Chapter 8 Web map application to support spatial planning ...
14
Chapter 8 Web map application to support spatial planning, decision-making and transition towards climate-smart landscapes in the Taita Hills, Kenya Tino Johansson, Janne Heiskanen, Mika Siljander and Petri Pellikka Abstract There is a growing demand for geospatial technologies and skills in Kenya due to on-going devolution of government to the county level, development of GIS-based National Land Management Information System, and digitalization of information and maps to databases. Furthermore, adaptation of agricultural production to the impacts of climate change, and its transition towards climate-smart landscape approach require support from geospatial technologies to stakeholders to sustainably manage land use interactions, such as soil, water and nutrients along with agro-forestry, livestock, husbandry, and forest and grassland utilization at landscape level. We developed a simple and visual Multifunctional Agricultural Landscape Mosaic (MALM) Story Map and Web Application to support this transition and adoption of open access geospatial technology among the universities, government organizations and NGOs in Kenya. The thematic content of the web application was designed to support climate change adaptation action planning in the target area with a focus on water resources, conservation agriculture, agro-forestry for the smallholder farms, and insect pest management. This chapter describes the emerging challenges of advancing geospatial technologies in Kenya, presents the results of a feasibility study of MALM and discusses its potential in supporting spatial planning and decision-making in climate change adaptation in the Taita Hills, southeast Kenya. Keywords geospatial · web mapping · spatial planning · landscapes · climate · Kenya _______________________________ T. Johansson () · J. Heiskanen · M. Siljander · P. Pellikka Department of Geosciences and Geography, University of Helsinki, Finland e-mail: [email protected] J. Heiskanen e-mail: [email protected] M. Siljander e-mail: [email protected] P. Pellikka e-mail: [email protected]
Transcript of Chapter 8 Web map application to support spatial planning ...
Chapter 8
Web map application to support spatial
planning, decision-making and transition
towards climate-smart landscapes in the
Taita Hills, Kenya
Tino Johansson, Janne Heiskanen, Mika Siljander and Petri Pellikka
Abstract There is a growing demand for geospatial technologies and skills in Kenya due to
on-going devolution of government to the county level, development of GIS-based National
Land Management Information System, and digitalization of information and maps to
databases. Furthermore, adaptation of agricultural production to the impacts of climate
change, and its transition towards climate-smart landscape approach require support from
geospatial technologies to stakeholders to sustainably manage land use interactions, such as
soil, water and nutrients along with agro-forestry, livestock, husbandry, and forest and
grassland utilization at landscape level. We developed a simple and visual Multifunctional
Agricultural Landscape Mosaic (MALM) Story Map and Web Application to support this
transition and adoption of open access geospatial technology among the universities,
government organizations and NGOs in Kenya. The thematic content of the web application
was designed to support climate change adaptation action planning in the target area with a
focus on water resources, conservation agriculture, agro-forestry for the smallholder farms,
and insect pest management. This chapter describes the emerging challenges of advancing
geospatial technologies in Kenya, presents the results of a feasibility study of MALM and
discusses its potential in supporting spatial planning and decision-making in climate change
adaptation in the Taita Hills, southeast Kenya.
Keywords geospatial · web mapping · spatial planning · landscapes · climate · Kenya
_______________________________
T. Johansson () · J. Heiskanen · M. Siljander · P. Pellikka
Department of Geosciences and Geography, University of Helsinki, Finland
e-mail: [email protected]
J. Heiskanen
e-mail: [email protected]
M. Siljander
e-mail: [email protected]
P. Pellikka
e-mail: [email protected]
8.1 Challenges of advancing geospatial technologies in Kenya
Advances in Geospatial Technologies have revolutionized the delivery of reliable and timely
datasets and information about Earth. Open source software, web mapping applications and
data repositories gradually expand the reach of computer-based models and geospatial
information to the Global South and help bridge the global digital divide in terms of access
to, use of and impact of geoinformation on e.g. monitoring climate and land change, and
assessing situations during extreme events, as well as on planning and decision-making. In
recent years, a wide range of web-based decision support services using mapping and GIS
have been developed for environmental purposes, such as watershed management (Zhang et
al. 2015), integrated pest management (Damos 2015), pest infestation (Lajis et al. 2016) and
ecosystem services (Tayyebi et al. 2016). Transition to geospatial cloud computing removes
the need to purchase or maintain in-house servers, and makes customized use of web-based
GIS instantly and widely available (Cope et al. 2017) which can increase geospatial
technology adoption in countries with limited economic resources for software and data
storage.
Despite the accelerating global trend in the use of geoinformation, many countries in the
Global South lack behind in this process mainly due to inadequate human capacity with
Geospatial skills and information networks, especially in the rural areas. Kenya, which is a
lower middle income country and a leading trade and mobile technology hub in East Africa,
provides an interesting case study for assessing the challenges and opportunities of
advancing geospatial technologies in the 21st Century. In Kenya, transition from traditional
paper-based mapping and planning to digital information-based technology in the higher
education institutions, county governments, ministries, companies, non-governmental
organizations and extension services currently takes place at accelerating speed. This
transition will have a huge impact in the Kenyan economy through increased availability and
efficiency of geospatial information use in decision-making, developing services for ICT-
based society and customers, and in generating businesses and jobs in this growth sector.
Many on-going projects in Kenya underline and indicate the growth of geospatial
technologies in both public and private sectors. During the First Medium Term Plan in 2008–
2012 the Kenyan Government managed to develop 10 percent of the GIS-based National
Land Management Information System which will provide a digitalized Land Registry once
finalized. Geo-referenced land titles register will be more transparent, efficient and
decentralized than the existing printed documentation system. The development of e-
commerce in Kenya identifies GIS maps for all inhabited areas during the Second Medium
Term Plan in 2013–2017. GIS also plays a key role for Kenya’s infrastructure development
as digitization and mapping the electricity grid network into a GIS utility database will be
finalized by year 2017, which makes maintenance and monitoring more efficient and
effective and as a result will ensure more stable delivery of electricity across the country.
Demand and use of geospatial technologies, as well as the need to develop geospatial skills,
are also increasing through the on-going process of devolution of government which is
implemented under the new Constitution of Kenya 2010. It gives powers of self-governance
to the established country governments, such as the Taita Taveta County in southeast Kenya.
The counties need to take up and facilitate many functions and responsibilities that earlier
were under the national government and sectoral ministries. Availability of and access to
geoinformation are critically important to these county governments, which adopt full
responsibility for local natural resources management and food security under the new
realities of climate change. The new Constitution’s clause on Environment and Natural
Resources further informs that the State will establish systems of environmental impact
assessment, environmental audit and monitoring of the environment which will certainly
increase the demand to use of digital geoinformation at the county level. However, the
counties staff and other authorities require geospatial skills and knowledge to fully utilize
such digital resources in e.g. land management and planning.
The higher education sector in Kenya has not managed to keep pace in the provision of
degree programmes on GIS, remote sensing and geoinformatics which would ensure the
availability of high quality professionals with geospatial skills to the labor market and
business development. In Kenya, Master’s degree training in geoinformatics, GIS and/or
remote sensing is only provided in the capital city Nairobi by the University of Nairobi and
the Jomo Kenyatta University of Agriculture and Technology. This lack of training
opportunities in geospatial skills, which already are and will increasingly be of high demand
in the counties as transformation into digital/information society proceeds, causes regional
disparity and uneven capacity development in Kenya. Rural-urban migration has been the
only option for young graduate students and in-service training staff to study geoinformatics
in the country, assuming that they can afford the higher living expenses in the capital city.
The University of Helsinki with support from the Ministry for Foreign Affairs of Finland
will launch a new M.Sc. degree programme in geoinformatics
(www.helsinki.fi/en/projects/taitagis) in cooperation with the Taita Taveta University to
support regional equality in geospatial and information technology skills and capacity in
Kenya in year 2018.
Political support to the modernization of higher education curricula is present and indicated
in the long-term national policy called Kenya Vision 2030 (Government of the Republic of
Kenya 2007) which encourages public and private universities to expand enrollment with
emphasis on science and technology. One of the major goals of the Kenya Vision 2030 is to
make the country a regional center of research and development of new technologies in
Africa. The Universities (Amendment) Bill to the Senate in July 2014 proposes the
establishment of public universities in each county to promote learning, knowledge, research
and innovation. The Bill states that the objectives of university education in Kenya will
among other things advance knowledge through teaching, scientific research and
investigation, support and contribute to the national economic and social development,
disseminate the outcomes of the research conducted by the university to the general
community, facilitates life-long learning through adult and continuing education, and
promotes gender balance and equal opportunity among students and employees.
(Government of the Republic of Kenya 2014). These policy statements lay the basis for
future advancement of technologies, such as geospatial that will support scientific research,
decision-making and education in various disciplines in the country.
However, emerging challenges for the development of information and communication
technologies, e.g. slow adoption of these services by educational, social and government
institutions, lack of harmonized data management system, and inadequate information
resource centers in rural areas may hamper their utilization (Government of the Republic of
Kenya 2013). Sharing geo data within and across organizations has remained very limited
so far. A detailed country-wide assessment of the challenges of advancement of geospatial
technologies is not available, but being part of modern information and communication
technologies (ICT) many of the identified challenges for their development may also be
applied to geospatial technologies in Kenya.
The Second Medium Term Plan 2013–2017 of the Kenya Vision 2030 (Government of the
Republic of Kenya 2013) identifies the poor state of infrastructure and equipment for
research in higher education and training as an emerging issue and a challenge for the
development of science, technology and innovations. Web-based applications, however,
may help overcome most of the infrastructure-related problems in geospatial technology
adoption. This document further states that the emerging issues and challenges for the
development of ICT are: inadequate human capacity for research and development of ICT,
slow adoption of ICT services by learning, social and government institutions, lack of
harmonized data management system, inadequate information resource centers in rural
areas, and low ICT skills. Nyangau (2014) points out that Kenya’s higher education system
should pay more emphasis on supporting the country’s economic growth and development
by “preparing well-educated highly-trained workforce for industrialization, modernization
and global citizenship”. He summarizes that despite its rapid expansion Kenya’s higher
education system faces a number of serious challenges, such as curricula that are not
responsive to the needs of modern labor market, lack of basic laboratory supplies and
equipment, poorly equipped libraries and ever-growing demand of higher education.
Innovative, user-friendly web map application that addresses some of the key challenges of
advancing geospatial technologies in Kenya has been developed under the Adaptation for
Food Security and Ecosystem Resilience in Africa project coordinated by the International
Center of Insect Physiology and Ecology in Nairobi, Kenya. The web map application will
be described in detail later in this article.
8.2 Geospatial technologies to support transition towards climate-
smart landscapes
The experienced and projected impacts of climate change on agriculture in Kenya generate
a major development challenge. Approximately 98 percent of the country’s agricultural
systems are rain-fed making them highly susceptible to increased variability of rainfall and
other impacts of climate change. Agriculture contributes to 25 percent of Kenya’s GDP and
accounts over 65 percent of exports, so any negative trend in production will directly affect
food security, employment, economic growth and poverty (Government of the Republic of
Kenya 2017). To address these challenges, the country has recently launched the Kenya
National Climate-Smart Agriculture Programme 2017–2026 which is expected to guide
actions that are needed to transform and reorient agricultural systems to support food security
under the new realities of climate change. Lipper et al. (2014) describe climate-smart
agriculture as an approach which differs from business-as-usual approaches by emphasizing
the capacity to implement flexible, content-specific solutions which are supported by
innovative policy and financing actions. The aim of climate-smart agriculture systems is to
increase farmers’ adaptive capacity, resilience and resource use efficiency in agricultural
production systems.
Emphasis on integrated land and water management approaches in climate change
adaptation and mitigation has generated a concept of climate-smart landscapes (CSL) which
includes a variety of field and farm practices in different land and tenure types that support
both adaptation and mitigation objectives. The CSL approach aims at managing land use
interactions, such as soil, water and nutrient management along with agro-forestry, livestock,
husbandry, and forest and grassland management techniques at landscape level. The key is
to maintain high level of diversity: 1) to reduce risks of production and livelihood losses
from erratic and changing climatic conditions, 2) to utilize certain areas of the landscape
strategically as emergency food, feed, fuel, and income reserves, and 3) to sustain minimally
disturbed habitats, such as forests, within the landscape mosaic that also serve as carbon
stocks, and secure ecosystem functions (Scherr et al. 2012).
The successful implementation of climate-smart landscapes requires functional interactions
of economic, ecological and social processes in the negotiated spaces where a diverse set of
stakeholders identify, negotiate and manage the impacts of different land uses and
management on other land uses and users at multiple scales in the landscape (Scherr et al.
2012; Minang et al. 2015). Geospatial technologies can be used in the facilitation of
negotiation process among the stakeholders as these enable overlay visualization, queries,
and other functionalities which help understanding different landscape level phenomena and
mapping risks.
In the Adaptation for Food Security and Ecosystem Resilience in Africa (AFERIA) project
a web map application, Multifunctional Agricultural Landscape Mosaic (MALM), was
developed. It consists of authoritative maps compiled from scientific findings, stakeholder
observations and prioritized community-based climate change adaptation actions to support
current and future land use planning and decision-making for gradual transition to climate-
smart landscapes in the Taita Hills, Kenya. The Coast Region, where the Taita Taveta
County is located, has over time experienced third highest absolute poverty levels in the
country. The Human Development Index (0.527) in the Coast Region was slightly below the
national average (0.561) in 2009. (Friedrich Ebert Stiftung 2012). Taita Taveta County’s
vicinity to the coastline and connectivity with Mombasa has in recent years resulted in huge
infrastructure development projects by the government, such as the standard gauge railway
between Nairobi and Mombasa and tarmac road establishment between Voi town and Taveta
international border. These huge projects have impacts on the environment and communities
located at the affected areas and surroundings. These large scale changes in land use, housing
and industry area development, impact to ecology and wildlife, and increased human-
wildlife conflicts, call for experts able to handle geospatial data for regional planning. Spatial
information used in land use planning and environmental impact assessment for these
infrastructure projects has so far been only available in the form of printed map sheets at
selected authorities’ and constructors’ offices. Availability of, and access to such key
information to support decision-making has been limited and negatively affected the
transparency of land demarcation processes.
8.3 MALM web map application to support spatial planning and
decision-making
The MALM web map combines authoritative maps with narrative text and images to tell a
story on climate change adaptation themes, such as prioritized sites/locations for adaptation
actions, drip irrigation, roof rain water harvesting, farm forestry, conservation agriculture
and integrated pest management for certain staple and cash crops. The layers visualized
include a summary of the observed land use/land cover changes, projections of future climate
and prediction models of land use/land cover, and suitability analyses of intervention, thus
providing an interface for local, regional and national users for communicating current and
projected impacts of climate and land change. The web map will support land use planning
and identification of key areas for climate change mitigation and adaptation actions in the
Taita Hills, but may also be used in education for spatial citizenship (Jekel et al. 2015)
throughout Kenya.
The geospatial visualizations for MALM include a Story Map and an additional Web App
built using Esri ArcGIS Online platform www.arcgis.com. ArcGIS Online is a cloud-based
web-GIS platform to make, search and share web maps, web map applications and geospatial
data.
Using the MALM Story Map and Web App requires only a web browser. However, if the
involved project stakeholders want prepare their own online services, they need to register
to ArcGIS Online. ArcGIS Online can be accessed for free through a public account, which
is not associated with any organization but offers a limited set of functionality. The public
account allows users to utilize and create maps, and share maps and apps with others, and
they can also add simple geospatial data in vector format to their maps. The organizational
account provides more functionality and options for adding data to maps. As many of the
AFERIA project outputs are in raster format, the organizational account is required for
making the MALM visualizations.
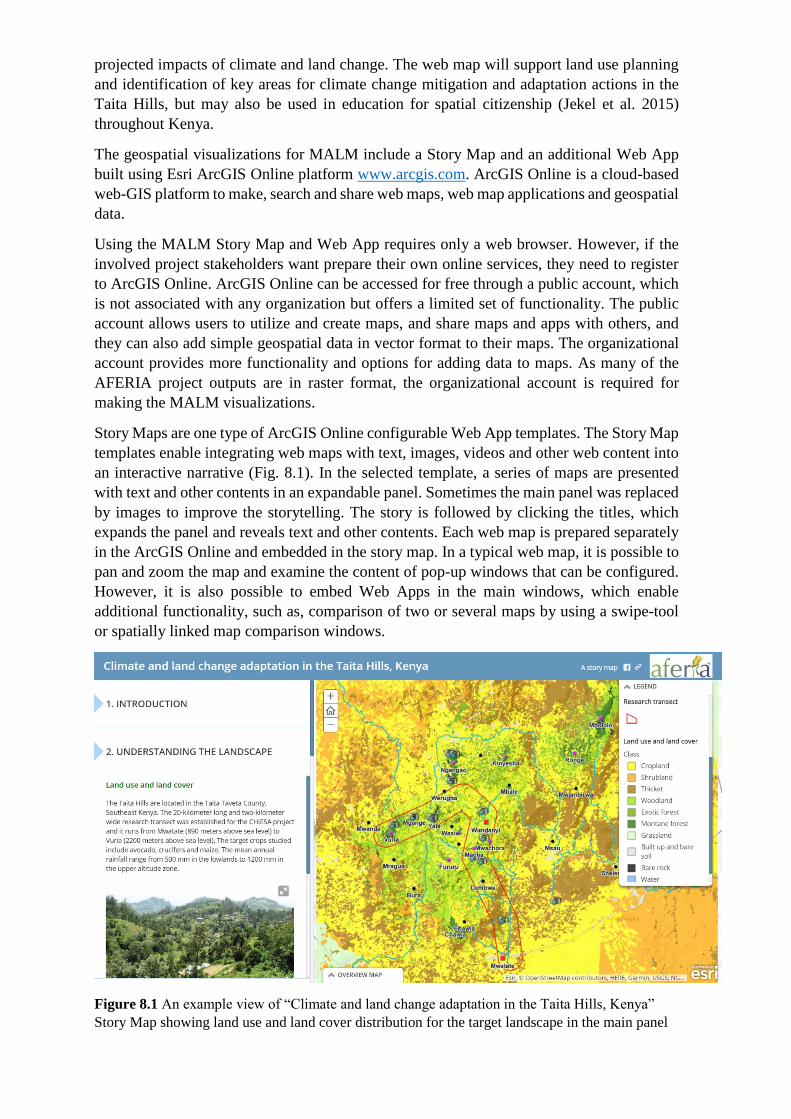
Story Maps are one type of ArcGIS Online configurable Web App templates. The Story Map
templates enable integrating web maps with text, images, videos and other web content into
an interactive narrative (Fig. 8.1). In the selected template, a series of maps are presented
with text and other contents in an expandable panel. Sometimes the main panel was replaced
by images to improve the storytelling. The story is followed by clicking the titles, which
expands the panel and reveals text and other contents. Each web map is prepared separately
in the ArcGIS Online and embedded in the story map. In a typical web map, it is possible to
pan and zoom the map and examine the content of pop-up windows that can be configured.
However, it is also possible to embed Web Apps in the main windows, which enable
additional functionality, such as, comparison of two or several maps by using a swipe-tool
or spatially linked map comparison windows.
Figure 8.1 An example view of “Climate and land change adaptation in the Taita Hills, Kenya”
Story Map showing land use and land cover distribution for the target landscape in the main panel
on right and text and images in the expandable panel on left. The Story Map is available online at:
http://arcg.is/1qePWK.
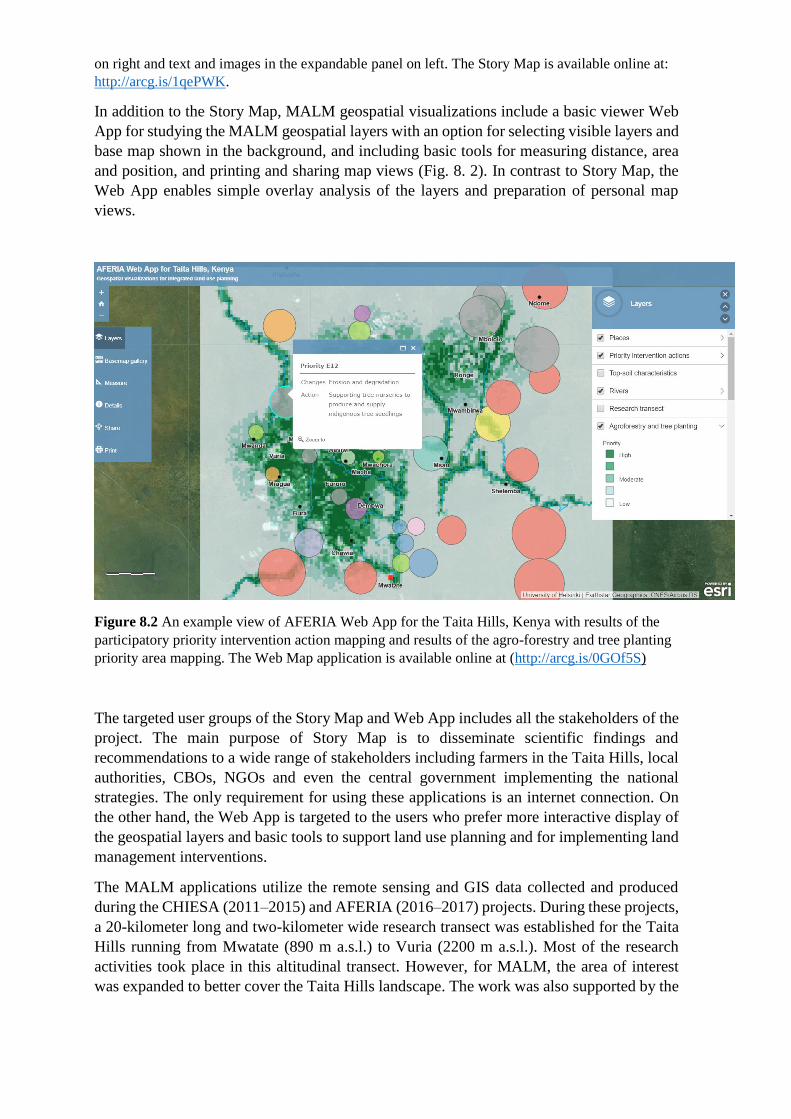
In addition to the Story Map, MALM geospatial visualizations include a basic viewer Web
App for studying the MALM geospatial layers with an option for selecting visible layers and
base map shown in the background, and including basic tools for measuring distance, area
and position, and printing and sharing map views (Fig. 8. 2). In contrast to Story Map, the
Web App enables simple overlay analysis of the layers and preparation of personal map
views.
Figure 8.2 An example view of AFERIA Web App for the Taita Hills, Kenya with results of the
participatory priority intervention action mapping and results of the agro-forestry and tree planting
priority area mapping. The Web Map application is available online at (http://arcg.is/0GOf5S)
The targeted user groups of the Story Map and Web App includes all the stakeholders of the
project. The main purpose of Story Map is to disseminate scientific findings and
recommendations to a wide range of stakeholders including farmers in the Taita Hills, local
authorities, CBOs, NGOs and even the central government implementing the national
strategies. The only requirement for using these applications is an internet connection. On
the other hand, the Web App is targeted to the users who prefer more interactive display of
the geospatial layers and basic tools to support land use planning and for implementing land
management interventions.
The MALM applications utilize the remote sensing and GIS data collected and produced
during the CHIESA (2011–2015) and AFERIA (2016–2017) projects. During these projects,
a 20-kilometer long and two-kilometer wide research transect was established for the Taita
Hills running from Mwatate (890 m a.s.l.) to Vuria (2200 m a.s.l.). Most of the research
activities took place in this altitudinal transect. However, for MALM, the area of interest
was expanded to better cover the Taita Hills landscape. The work was also supported by the
data, such airborne laser scanning data, gathered by other research projects of the University
of Helsinki in the study area.
The most elementary geospatial data by CHIESA and AFERIA projects include satellite
image based land use and land cover (LULC) classification (Pellikka et al. 2018), the results
of participatory mapping of the prioritized climate change adaptation action sites, and
AFRICLIM 3.0 high-resolution ensemble climate projections for Africa (Platts et al. 2015).
LULC layer was used for defining the extent of the study area. It is important for
understanding the main landscape patterns, such as, distribution of agricultural land and
remaining forest cover. In addition to LULC layer, the Story Map visualize LULC changes
between 2003 and 2011 demonstrating the current trend of agricultural expansion (Pellikka
et al. 2018), and the results of a scenario analysis carried out in AFERIA project to explore
alternative ways of responding to the current environmental and societal challenges by the
mid-21st century (Capitani et al., in print).
Participatory selection of climate change adaptation action sites by the stakeholders was part
of the process of linking local and scientific knowledge. Data on the prioritized climate
change adaptation action sites was collected with participatory GIS methods from the
communities and stakeholders, visualized, and shared with the local partners to establish
demonstration sites in the most optimal locations (critical areas where actions need to be
taken against experienced impacts and negative changes). Representatives from different
groups, such as government and county government, NGOs, water users associations,
women’s self-help groups and disabled persons groups, actively contributed their
observations and experiences in the areas and sites where urgent actions were needed. Later,
the observations were digitized, converted into a geospatial layer and embedded in the
MALM visualizations.
AFRICLIM 3.0 provides mid-century (2041–2070) climate projections of temperature,
rainfall and rainfall seasonality at 1 km spatial resolution (Platts et al. 2015). For the Taita
Hills, the climate projections predict a hotter future with wetter rainy seasons and drier or
similar dry months. The predictions were visualized as changes in the mean annual
temperature and rainfall between the baseline (1961–1991) and 2041–2070 period. In order
to demonstrate uncertainties in the projections, the predictions based on two different
Representative Concentration Pathways (RCPs) are shown, and can be compared in the Story
Map through the swipe tool. Furthermore, the layers were provided for the whole Kenya so
that users can relate changes in the Taita Hills to the national context.
In order to complement the results of the participatory mapping approach, a GIS-based
suitability analyses were used for mapping priority areas for the key AFERIA interventions
(i.e., roof rain water harvesting, drip irrigation, agro-forestry and tree planting, conservation
agriculture and integrated pest management) (Fig. 8.2). The suitability analyses were based
on multi-criteria overlay analysis. For each intervention type, a set of evaluation criteria were
determined and corresponding decision rules and weights determined and applied to make
the final maps. For example, the suitability of agro-forestry and tree planting was mapped
based on LULC map to concentrate on agricultural areas, forest connectivity analysis to
improve the ecological connectivity between the remaining forest patches, and distance to
the rivers was used to support reforestation of the riparian areas. The scientific finding of
CHIESA and AFERIA were used in the analyses when possible, particularly for visualizing
the key areas for the biological control of maize pests.
Although the main method for accessing MALM geospatial layers is through Story Map and
Web App, the geospatial layers, maps and apps are also accessible through ArcGIS Online.
By using the free ArcGIS public account, the stakeholders interested in tailoring their own
web maps and applications can make such by combining AFERIA outputs, other public data
in ArcGIS Online and their own data. For example, the user might want to combine data
collected by GPS device in the field in text or GXP format with one the MALM layers. Data
collection using GPS has been included in the GIS capacity development trainings earlier in
the project, and many stakeholders now have such data on their own applications. Making
web maps and apps in ArcGIS Online is relative easy and does not require training in GIS.
As a part of the MALM geospatial visualizations, one day capacity development training
was organized in the Taita Taveta University in November 2017. In the training, the
participants presenting various stakeholders and Taita Taveta University staff assessed
MALM Story Map and Web App, and learned how to access geospatial layers through
ArcGIS Online and create simple web maps and applications. In addition to introducing the
geospatial visualizations, the training aimed to discuss their contribution to climate and land
change adaptation and land use planning, and make participants consider how such tools
could be used for communicating landscape problems and possible solutions in their own
applications. For the users interested in developing their own applications, MALM Story
Map and Web App provide examples of the web GIS applications and some of their
possibilities, and hence, have an impact beyond the Taita Hills project area.
8.4 Feasibility study of the MALM for spatial decision support in
the Taita Hills
A feasibility study of the MALM Story Map and Web Application was carried out during
the one-day training in the Taita Taveta County, Kenya with 20 participants including local
stakeholders and Taita Taveta University students and staff members. None of the
participants had previous knowledge of Story Maps or Web Apps and only few participants
had used ArcGIS Online before. They came from various backgrounds from different
organizations and most of them had no previous GIS knowledge. The assessment was based
on a questionnaire that was filled in during the training. The questionnaire was structured in
a Four Way Analysis manner so that the questions measured usability of the MALM Story
map and the Web App for decision support. Questions were structured so that firstly
respondent’s basic spatial skills were investigated and then the ability to recognize spatial
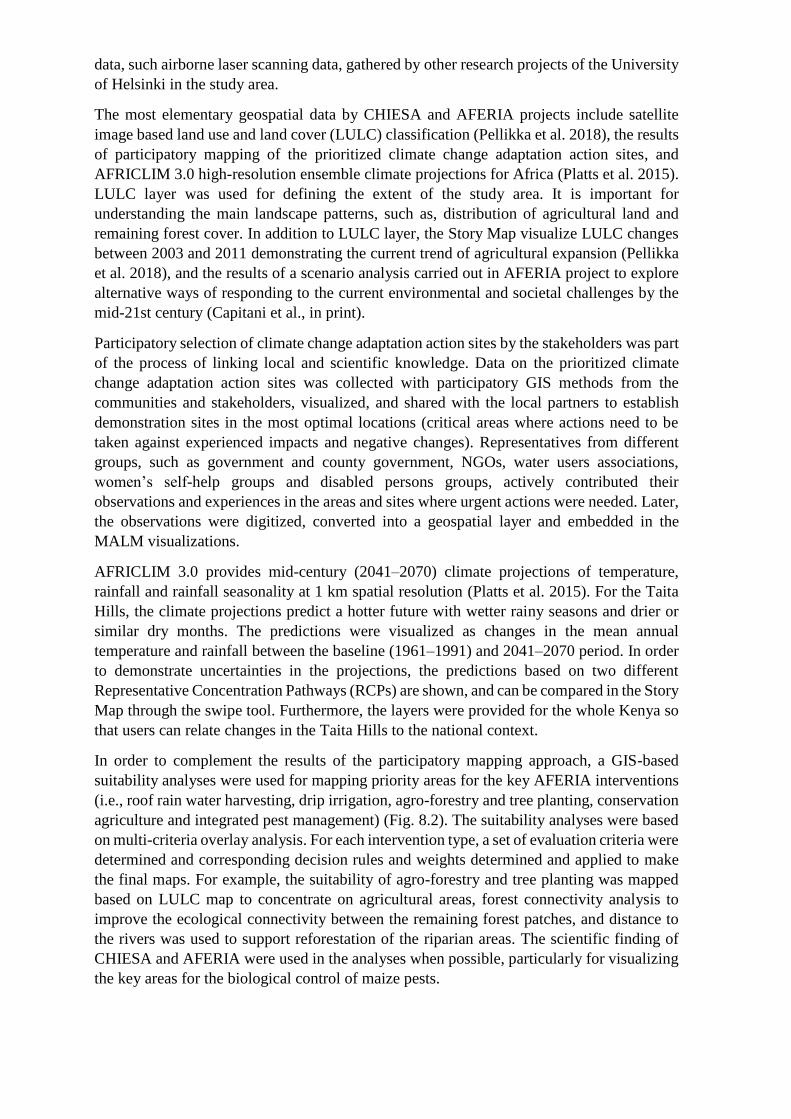
patterns and relations were tested. In the first section of the assessment, two specific climate
change adaptation actions for the climate change impacts on rainfall (roof rain water
harvesting; Fig. 8.3 and drip irrigation; Fig. 8.4) had to be identified from the MALM’s
narrative texts and images. In the second part respondents had to place the phenomena in the
context by using the authoritative maps and finding out the locations were these two adaption
actions mainly takes place in the Taita Hills. In the third part participants examined the
qualities of the objects by assessing how the two adaptation actions are similar or different,
and in the fourth part space-time relationships between the objects and/or event were
investigated. In addition, three questions were asked about the overall content of the MALM:
1) did the MALM visualizations improve your understanding on the landscape, landscape
problems and potential interventions; 2) how important were the maps for answering the
questions; and 3) how important was the text in the Story map for answering the questions?
The results of the feasibility study show that despite the respondents’ lack of prior experience
in geospatial technology, the MALM web mapping application enabled them to explore the
data, select layers and investigate the phenomena at different scales. The results indicate that
the MALM helps enhance users’ geospatial thinking in five main areas:
1. Identify the entity/event: MALM provides two specific adaptation actions for the climate
change impacts on rainfall. What are these two adaptation intervention actions? What are two
adaptation intervention actions for the climate change impacts on rainfall?
Our result shows that 14 out of 20 of the respondents found drip irrigation and roof rain
water harvesting as the two specific adaptation actions for the climate change impacts on
rainfall. Five participants selected roof rain water harvesting, agro-forestry and tree planting,
and one participant selected roof rain water harvesting and setting-up roof catchments and
tanks as the adaption actions.
Figure 8.3 Story map for prioritized roof rain water harvesting action sites in the Taita Hills, Kenya.
2. Place the phenomena in the context: Where are these two adaptation actions mainly
located and what are the main geographical characteristics of these locations?
Our result shows that respondents’ answers varied a lot and some answered that adaption
actions are located in the Taita Hills, Taita Taveta County. However, in this question we
were looking for more specific locations were the adaptation actions have been prioritized
to take place which could only be revealed by using the authoritative maps from the MALM.
From these maps some respondents only identified if the action took place in the highland
or in the lowland areas. Luckily, most of the respondents interpreted more carefully the
MALM maps and they mentioned the names of the sub-counties or villages where the actions
will mainly be located in the Taita Hills. When the main geographical characteristics of two
different climate change adaptation action locations were asked, majority of the participants
identified from the MALM maps that most suitable areas for the both actions are located at
higher altitudes and in areas with higher rainfall. Students also explained that roof rain water
harvesting has higher suitability in areas with more buildings, long distance to the rivers,
whereas drip irrigation has high suitability in areas with relatively short distance to the water
sources (rivers and streams), cultivated areas and buildings.
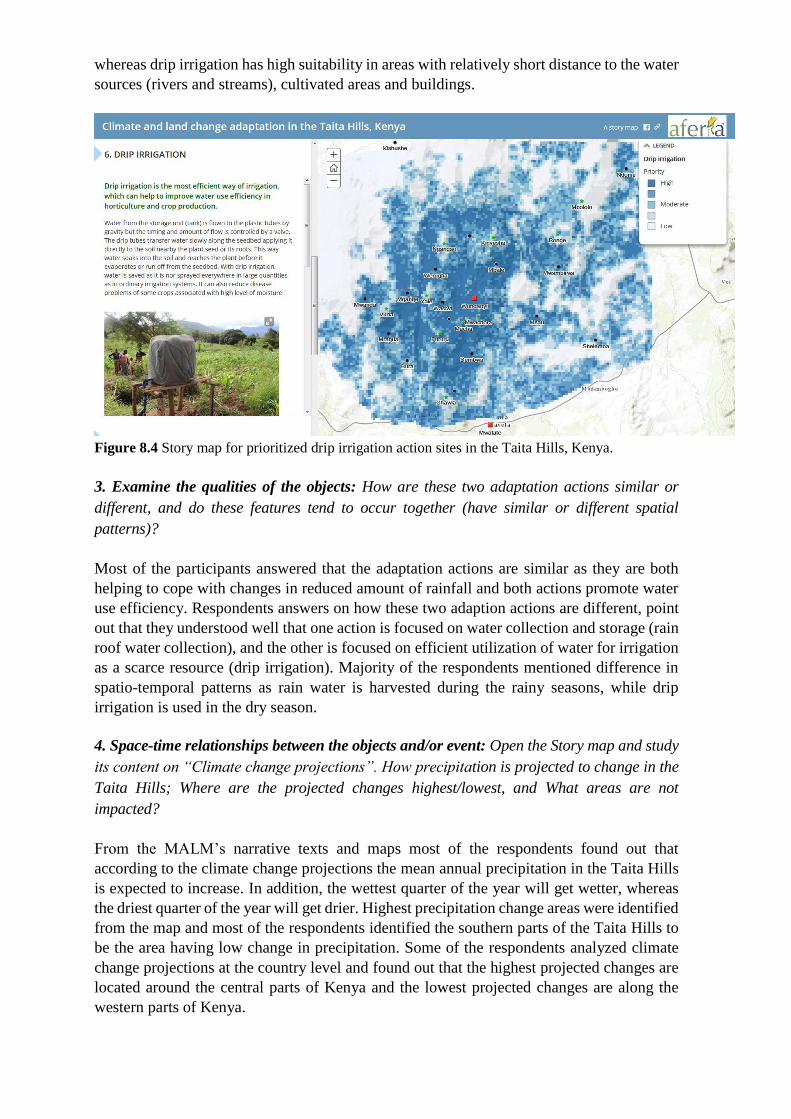
Figure 8.4 Story map for prioritized drip irrigation action sites in the Taita Hills, Kenya.
3. Examine the qualities of the objects: How are these two adaptation actions similar or
different, and do these features tend to occur together (have similar or different spatial
patterns)?
Most of the participants answered that the adaptation actions are similar as they are both
helping to cope with changes in reduced amount of rainfall and both actions promote water
use efficiency. Respondents answers on how these two adaption actions are different, point
out that they understood well that one action is focused on water collection and storage (rain
roof water collection), and the other is focused on efficient utilization of water for irrigation
as a scarce resource (drip irrigation). Majority of the respondents mentioned difference in
spatio-temporal patterns as rain water is harvested during the rainy seasons, while drip
irrigation is used in the dry season.
4. Space-time relationships between the objects and/or event: Open the Story map and study
its content on “Climate change projections”. How precipitation is projected to change in the
Taita Hills; Where are the projected changes highest/lowest, and What areas are not
impacted?
From the MALM’s narrative texts and maps most of the respondents found out that
according to the climate change projections the mean annual precipitation in the Taita Hills
is expected to increase. In addition, the wettest quarter of the year will get wetter, whereas
the driest quarter of the year will get drier. Highest precipitation change areas were identified
from the map and most of the respondents identified the southern parts of the Taita Hills to
be the area having low change in precipitation. Some of the respondents analyzed climate
change projections at the country level and found out that the highest projected changes are
located around the central parts of Kenya and the lowest projected changes are along the
western parts of Kenya.
5. Content of MALM visualizations: Did MALM visualizations improve your understanding
on the landscape, landscape problems and potential interventions; how important were the
maps for answering the questions; how important was text in the Story map for answering the
questions?
All respondents agreed that MALM Story Map and Web App improved their understanding
on the landscape, landscape problems and potential interventions in the Taita Hills. Most of
them found out that the maps provided a practical tool for both understanding and explaining
the concept behind the MALM and it can be a useful tool to support spatial decision making.
Respondents also thought that the maps provided a broad visual scientific analysis of the
adaptation intervention actions. However, some respondents thought that in the beginning
the maps were a bit challenging to fully understand and to make interpretations out of them.
Therefore, in the parts where the maps seemed a bit complex, the text gave students a more
detailed explanation of the prioritized climate change adaptation actions.
8.5 Discussion
Use of geospatial technologies, especially open source software and web mapping
applications, in spatial planning and decision-making is a relatively new phenomenon in
Kenya. GIS and geoinformation are not used much outside the universities and specific
research institutes in the country. Harnessing the geospatial technology potential widely
among the established county governments and other key stakeholders involved in planning,
managing, monitoring and evaluating agricultural production, water resources, forests, and
climate change adaptation and mitigation in Kenya would enhance information sharing
across the sector lines of responsible ministries. Digital maps and updated data from
repositories would be at hand to the decision-makers when needed, not just to those
authorities who happen to possess the only printed copy of the out-of-date thematic map of
the target area. Unharmonized policies often prevent sustainable management of natural
resources and enforcement of rules and regulations for their conservation in Kenya.
Geospatial technologies could provide a solution for more transparent and efficient
availability of information for policy-making if adopted widely among the local and national
governments. Transition towards climate-smart landscapes requires well-coordinated
collaboration among the multiple stakeholders to negotiate, design and manage land use
interactions at the landscape level. Availability of information on different land use types,
high resolution climate projections, and geographical characteristics of the target area at
different scales plays a critical role in the success of such negotiations and collaboration.
We developed a simple and visual Multifunctional Agricultural Landscape Mosaic (MALM)
Story Map and Web Application to support the transition towards climate-smart landscapes
and adoption of open access geospatial technology among the universities, government
organizations and NGOs in Kenya. The thematic content of the web application was
designed to support climate change adaptation action planning in the target area with a focus
on water resources, conservation agriculture, agro-forestry for the smallholder farms, and
insect pest management for maize, avocado and crucifers. The objective of this geospatial
application is to provide information on prioritized action sites for different interventions
and technologies so that the users may use the available information in planning future
adaptation actions in the area. Hands-on training was organized for selected end users to
enable them to tailor the application for their own purposes and data sets, which
simultaneously develops their geospatial skills and builds their capacity to adopt geospatial
technology. According to the feasibility study targeting a small group of users from the Taita
Taveta University and local stakeholder organizations, the application combining
authoritative maps and descriptive texts was well received and successfully used in basic
tasks requiring spatial thinking. After the initial launch of the MALM web application, a
series of promotion events and advertisement have been organized to attract a growing
number of users in the coming years in the Taita Taveta County and elsewhere in Kenya.
We expect the application to support and be of use for those researchers, teachers, and
authorities who continue to implement the Kenya National Climate-Smart Agriculture
Programme 2017–2026.
One of the assets of MALM is that in addition to laptop and desk top computers, it can be
operated with smart phones, which will expand its reach to a number of users who do not
have computers available. This removes the obstacles created by poor state of infrastructure
and equipment in research and education. Smart phones are widely utilized by the Kenyans
in both urban and rural areas. Network coverage and internet speed vary from region to
region but generally service is available in most universities, research institutes and
government offices. The MALM web application and Story Map can also be used for
educational purposes in high schools throughout the country as the thematic content provides
supplementary material and information to science education.
References
Capitani, C., Garedew, W., Mitiku, A., Berecha, G.Y., Hailu, B.T., Heiskanen, J., Hurskainen, P.,
Platts, P.J., Siljander, M., Pinard, F., Johansson, T. & Marchant, R. (2018). Views from two
mountains: Exploring climate change impacts on traditional farming communities of Eastern
African highlands through participatory scenarios. Sustainability Science (in print).
Cope, M., Mikhailova, E., Post, C., Schlautman, M., & McMillan, P. (2017). Developing an
integrated cloud-based spatial-temporal system for monitoring phenology. Ecological Informatics
39, 123–129.
Damos, P. (2015). Modular structure of web-based decision support systems for integrated pest
management. A review. Agronomy for Sustainable Development, 35(4), 1347–1372.
Friedrich Ebert Stiftung (2012). Regional Disparities and Marginalization in Kenya. Elite PrePress
Nairobi, Kenya.
Government of the Republic of Kenya (2007). Kenya Vision 2030. Ministry of Planning and National
Development. Nairobi, Kenya.
Government of the Republic of Kenya (2013). Second Medium Term Plan 2013–2017. Transforming
Kenya: Pathway to Devolution, Socio-Economic Development, Equity and National Unity.
Kenya Vision 2030. The Presidency, Ministry of Devolution and Planning. Nairobi, Kenya.
Government of the Republic of Kenya (2014). Kenya Gazette Supplement No. 107. Senate Bills
2014. The Government Printer. Nairobi, Kenya.
Government of the Republic of Kenya (2017). Kenya Climate Smart Agriculture Strategy 2017–
2026. Ministry of Agriculture, Livestock and Fisheries. Nairobi, Kenya.
Jekel, T., Gryl, I., & Schulze, U. (2015). Education for Spatial Citizenship, 35–49. In Solari, O. M.,
Demirci, A. & van der Schee, J. (Eds.): Geospatial Technologies and Geography Education in a
Changing World. IGU-UGI. Advances in Geographical and Environmental Sciences. Springer,
Japan.
Lajis, A., Nasir, H.M., & Ismail, N. (2016). Web GIS based information visualization for pest
infection: A case study of rice plantation. Asian Journal of Plant Sciences, 15(3-4), 109–114.
Lipper, L., Thornton, P., Campbell, B.M., Baedeker, T., Braimoh, A., Bwalya, M., Caron, P.,
Cattaneo, A., Garrity, D., Henry, K., Hottle, R., Jackson, L., Jarvis, A., Kossam, F., Mann, W.,
McCarthy, N., Meybeck, A., Neufeldt, H., Remington, T., Sen, P.T., Sessa, R., Shula, R., Tibu,
A. & Torquebiau, E.F. (2014). Climate-smart agriculture for food security. Nature Climate
Change 4(12), 1068–1072.
Minang, P. A., van Noordwijk, M., Freeman, O. E., Mbow, C., de Leeuw, J., & Catacutan, D. (Eds.)
(2015). Climate-Smart Landscapes: Multifunctionality in Practice. Nairobi, Kenya: World
Agroforestry Centre (ICRAF).
Nyangau, J.Z. (2014). Higher Education as an Instrument of Economic Growth in Kenya. FIRE:
Forum for International Research in Education 1(1). Retrieved from
http://preserve.lehigh.edu/fire/vol1/iss1/3
Pellikka, P.K.E., Heikinheimo, V., Hietanen, J., Schäfer, E., Siljander, M. & Heiskanen, J. (2018).
Impact of land cover change on aboveground carbon stocks in Afromontane landscape in Kenya.
Applied Geography 94, 178–189.
Platts, P. J., Omeny, P. & Marchant, R. (2015). AFRICLIM: high-resolution climate projections for
ecological applications in Africa. African Journal of Ecology 53, 103–108.
Scherr, S. J., Shames, S. & Friedman, R. (2012). From climate-smart agriculture to climate-smart
landscapes. Agriculture & Food Security 1(12).
Tayyebi, A., Meehan, T. D., Dischler, J., Radloff, G., Ferris, M. & Gratton, C. (2016). SmartScape™:
A web-based decision support system for assessing the tradeoffs among multiple ecosystem
services under crop-change scenarios. Computers and Electronics for Agriculture, 121, 108–121.
Zhang, D., Chen, X. & Yao, H. (2015). Development of a Prototype Web-Based Decision Support
System for Watershed Management. Water 7(2), 780–792.