Chapter 8 Supplement Cardiovascular Diseases Diseases A-1 The Health Consequences of Smoking —50...
82
S-253 Chapter 8 Cardiovascular Diseases Table 8.6S Detailed description of studies on smokefree laws and coronary events S-255 Table 8.7S Detailed description of studies on smokefree laws and cerebrovascular accidents S-281 Table 8.8S Detailed description of studies on the relationship between smokefree laws and other heart disease S-287
Transcript of Chapter 8 Supplement Cardiovascular Diseases Diseases A-1 The Health Consequences of Smoking —50...
S-253
Chapter 8 Cardiovascular Diseases
Table 8.6S Detailed description of studies on smokefree laws and coronary events S-255
Table 8.7S Detailed description of studies on smokefree laws and cerebrovascular accidents S-281
Table 8.8S Detailed description of studies on the relationship between smokefree laws and other heart disease S-287

Surgeon General’s Report
S-254 Chapter 8 Tables Supplement
Cardiovascular Diseases S-255
The Health Consequences of Smoking —50 Years of Progress

Surgeon General’s Report
S-256 Chapter 8 Tables Supplement

Cardiovascular Diseases S-257
The Health Consequences of Smoking —50 Years of Progress

Surgeon General’s Report
S-258 Chapter 8 Tables Supplement
Cardiovascular Diseases S-259
The Health Consequences of Smoking —50 Years of Progress

Surgeon General’s Report
S-260 Chapter 8 Tables Supplement

Cardiovascular Diseases S-261
The Health Consequences of Smoking —50 Years of Progress
Surgeon General’s Report
S-262 Chapter 8 Tables Supplement
Cardiovascular Diseases S-263
The Health Consequences of Smoking —50 Years of Progress
Surgeon General’s Report
S-264 Chapter 8 Tables Supplement

Cardiovascular Diseases S-265
The Health Consequences of Smoking —50 Years of Progress
Surgeon General’s Report
S-266 Chapter 8 Tables Supplement

Cardiovascular Diseases S-267
The Health Consequences of Smoking —50 Years of Progress

Surgeon General’s Report
S-268 Chapter 8 Tables Supplement

Cardiovascular Diseases S-269
The Health Consequences of Smoking —50 Years of Progress

Surgeon General’s Report
S-270 Chapter 8 Tables Supplement

Cardiovascular Diseases S-271
The Health Consequences of Smoking —50 Years of Progress
Surgeon General’s Report
S-272 Chapter 8 Tables Supplement

Cardiovascular Diseases S-273
The Health Consequences of Smoking —50 Years of Progress

Surgeon General’s Report
S-274 Chapter 8 Tables Supplement

Cardiovascular Diseases S-275
The Health Consequences of Smoking —50 Years of Progress
Surgeon General’s Report
S-276 Chapter 8 Tables Supplement

Cardiovascular Diseases S-277
The Health Consequences of Smoking —50 Years of Progress

Surgeon General’s Report
S-278 Chapter 8 Tables Supplement
Cardiovascular Diseases S-279
The Health Consequences of Smoking —50 Years of Progress

Surgeon General’s Report
S-280 Chapter 8 Tables Supplement
Cardiovascular Diseases S-281
The Health Consequences of Smoking —50 Years of Progress

Surgeon General’s Report
S-282 Chapter 8 Tables Supplement
Cardiovascular Diseases S-283
The Health Consequences of Smoking —50 Years of Progress

Surgeon General’s Report
S-284 Chapter 8 Tables Supplement
Cardiovascular Diseases S-285
The Health Consequences of Smoking —50 Years of Progress

Surgeon General’s Report
S-286 Chapter 8 Tables Supplement

Cardiovascular Diseases S-287
The Health Consequences of Smoking —50 Years of Progress

Surgeon General’s Report
S-288 Chapter 8 Tables Supplement

Cardiovascular Diseases S-289
The Health Consequences of Smoking —50 Years of Progress
Surgeon General’s Report
S-290 Chapter 8 Tables Supplement

Cardiovascular Diseases S-291
The Health Consequences of Smoking —50 Years of Progress

Surgeon General’s Report
S-292 Chapter 8 Tables Supplement

Cardiovascular Diseases S-293
The Health Consequences of Smoking —50 Years of Progress


Cardiovascular D
iseases A-1
The Health C
onsequences of Smoking —
50 Years of Progress
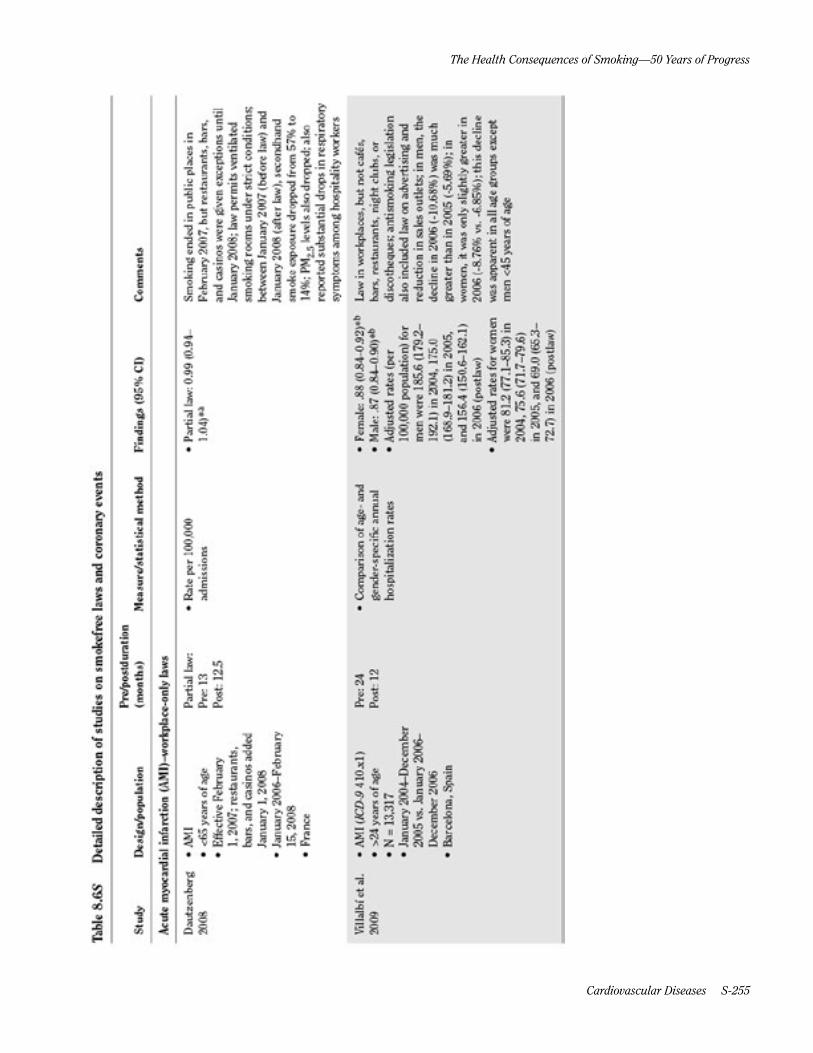
Table 8.6S Detailed description of studies on smokefree laws and coronary events—Part A: Acute myocardial infarction (AMI)–workplace-only laws
Study Design/populationPre/postduration (months) Measure/statistical method Findings (95% CI) Comments
Dautzenberg 2008
• AMI• <65 years of age• Effective February
1, 2007; restaurants,bars, and casinos addedJanuary 1, 2008
• January 2006–February15, 2008
• France
Partial law:Pre: 13Post: 12.5
• Rate per 100,000admissions
• Partial law: 0.99 (0.94–1.04)*a
Smoking ended in public places in February 2007, but restaurants, bars, and casinos were given exceptions until January 2008; law permits ventilated smoking rooms under strict conditions; between January 2007 (before law) and January 2008 (after law), secondhand smoke exposure dropped from 57% to 14%; PM2.5 levels also dropped; also reported substantial drops in respiratory symptoms among hospitality workers
Villalbí et al. 2009
• AMI (ICD-9 410.x1)• >24 years of age• N = 13,317• January 2004–December
2005 vs. January 2006–December 2006
• Barcelona, Spain
Pre: 24Post: 12
• Comparison of age- andgender-specific annualhospitalization rates
• Female: .88 (0.84–0.92)*b
• Male: .87 (0.84–0.90)*b
• Adjusted rates (per100,000 population) formen were 185.6 (179.2–192.1) in 2004, 175.0(168.9–181.2) in 2005,and 156.4 (150.6–162.1)in 2006 (postlaw)
• Adjusted rates for womenwere 81.2 (77.1–85.3) in2004, 75.6 (71.7–79.6)in 2005, and 69.0 (65.3–72.7) in 2006 (postlaw)
Law in workplaces, but not cafés, bars, restaurants, night clubs, or discotheques; antismoking legislation also included law on advertising and reduction in sales outlets; in men, the decline in 2006 (-10.68%) was much greater than in 2005 (-5.69%); in women, it was only slightly greater in 2006 (-8.76% vs. -6.85%); this decline was apparent in all age groups except men <45 years of age

Surgeon General’s R
eport
A-2 Chapter 8 Tables Supplem
ent
Table 8.6S Part A—Continued
Study Design/populationPre/postduration (months) Measure/statistical method Findings (95% CI) Comments
Naiman et al. 2010
• AMI (ICD-9 410, ICD-10I21)
• ≥45 years of age• Effective May 2006• January 1996–May 2006• Toronto, Canada
Pre: 36Postphase 1: 24
• ARIMA on crude rates ofhospital admission
• Subgroup analyses by age,gender
• Comparison with DurhamRegion and Thunder Bay,2 Ontario municipalitieswith no smokefree laws; nosignificant reductions wereobserved in control cities
• Smokefree legislationoccurred in 3 phases:smokefree public placesand workplaces inOctober 1999; smokefreerestaurants, dinnertheaters, and bowlingcenters except designatedsmoking rooms in June2001; smokefree bars,billiard halls, bingo halls,casinos, racetracks exceptdesignated smoking roomsin June 2004
• Postphase 1 vs. prelaw:1.03 (0.94–1.12)*
Legislation required all public places and workplaces to be smokefree and was implemented in 3 phases; the largest declines were seen after the phase of the law affecting restaurants came into effect, including a 17% (14%, 19%) decrease in AMI; crude rates of hospital admissions decreased 39% (38%, 40%) for cardiovascular conditions; no significant reductions were observed in number of hospital admissions attributable to control conditions (cholecystitis, appendicitis, bowel obstruction) in Toronto
Shetty et al. 2010
• AMI (ICD-9 and ICD-10)• Nationwide inpatient
sample: 673,631• Multiple cause of death
dataset: 2,018,548• Medicare patients:
2,382,387• United States
• Region-level fixed effectsmultivariate linearregression model
• Stratified by age• Regression model included
hospital beds/person,county population,physicians/person, percentpopulation in labor force,cigarette taxes
• Compared trends inregions where smokinglaws were implementedwith control regionshaving no laws
• Deaths in 18–64: 0.964(0.904–1.025)*
Does not differentiate between weak and strong laws; assumes that county-level laws apply in cities and unincorporated places (varies by county), causing significant misclassification; no statistically significant reduction of hip fracture admissions (control condition); effective date varies; study uses American Nonsmokers’ Rights Foundation smoking law database and national health outcomes datasets to analyze effect of smokefree laws in various places

Cardiovascular D
iseases A-3
The Health C
onsequences of Smoking —
50 Years of Progress
Table 8.6S Part A—Continued
Study Design/populationPre/postduration (months) Measure/statistical method Findings (95% CI) Comments
Villalbí et al. 2011
• AMI deaths (ICD-10 CM055)
• 34+ years of age• N = 90,382• Effective January 1, 2006• January 2006–December
2007 vs. January 2004–December 2005
• Spain
Pre: 24Post: 24
• Comparison of age- andsex-specific mortality rates
• Poisson regression tocalculate annual RR
• First postlaw year: 0.90(0.88–0.92)
– Female: 0.90 (0.87–0.92)
– Male: 0.90 (0.88–0.93)• Second postlaw year: 0.86
(0.84–0.88)* – Female: 0.86 (0.84–0.89)
– Male: 0.86 (0.83–0.88)• Significant reduction in
the RRs of AMI death inboth men and women;magnitude of reductionappeared greater amongthe elderly
Law in workplaces, but not cafes, bars, restaurants, night clubs, or discotheques; antismoking legislation also included law on advertising and reduction in sales outlets; a population-based surveillance system showed that the percentage of employed workers reporting smokefree jobs rose from 54% to 91% after implementation
Surgeon General’s R
eport
A-4 Chapter 8 Tables Supplem
ent
Table 8.6S Detailed description of studies on smokefree laws and coronary events—Part B: AMI–workplace and restaurant laws
Study Design/populationPre/postduration (months) Measure/statistical method Findings (95% CI) Comments
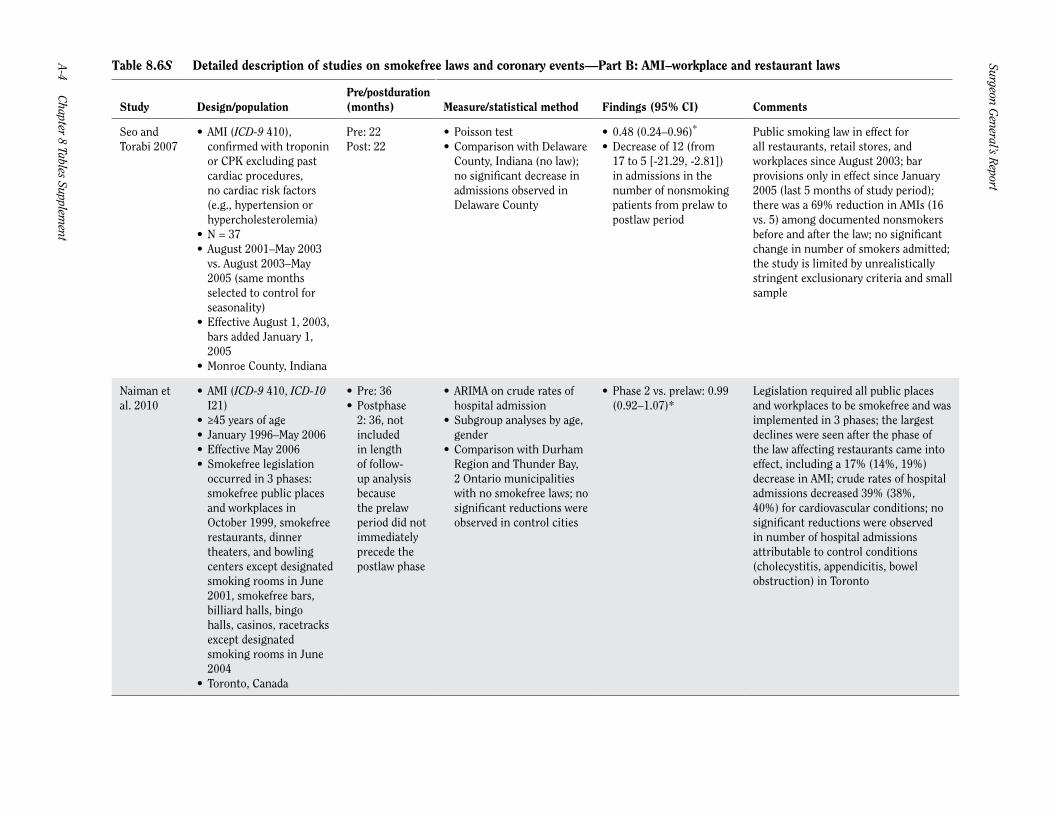
Seo and Torabi 2007
• AMI (ICD-9 410),confirmed with troponinor CPK excluding pastcardiac procedures,no cardiac risk factors(e.g., hypertension orhypercholesterolemia)
• N = 37• August 2001–May 2003
vs. August 2003–May2005 (same monthsselected to control forseasonality)
• Effective August 1, 2003,bars added January 1,2005
• Monroe County, Indiana
Pre: 22Post: 22
• Poisson test• Comparison with Delaware
County, Indiana (no law);no significant decrease inadmissions observed inDelaware County
• 0.48 (0.24–0.96)*
• Decrease of 12 (from17 to 5 [-21.29, -2.81])in admissions in thenumber of nonsmokingpatients from prelaw topostlaw period
Public smoking law in effect for all restaurants, retail stores, and workplaces since August 2003; bar provisions only in effect since January 2005 (last 5 months of study period); there was a 69% reduction in AMIs (16 vs. 5) among documented nonsmokers before and after the law; no significant change in number of smokers admitted; the study is limited by unrealistically stringent exclusionary criteria and small sample
Naiman et al. 2010
• AMI (ICD-9 410, ICD-10I21)
• ≥45 years of age• January 1996–May 2006• Effective May 2006• Smokefree legislation
occurred in 3 phases:smokefree public placesand workplaces inOctober 1999, smokefreerestaurants, dinnertheaters, and bowlingcenters except designatedsmoking rooms in June2001, smokefree bars,billiard halls, bingohalls, casinos, racetracksexcept designatedsmoking rooms in June2004
• Toronto, Canada
• Pre: 36• Postphase
2: 36, notincludedin lengthof follow-up analysisbecausethe prelawperiod did notimmediatelyprecede thepostlaw phase
• ARIMA on crude rates ofhospital admission
• Subgroup analyses by age,gender
• Comparison with DurhamRegion and Thunder Bay,2 Ontario municipalitieswith no smokefree laws; nosignificant reductions wereobserved in control cities
• Phase 2 vs. prelaw: 0.99(0.92–1.07)*
Legislation required all public places and workplaces to be smokefree and was implemented in 3 phases; the largest declines were seen after the phase of the law affecting restaurants came into effect, including a 17% (14%, 19%) decrease in AMI; crude rates of hospital admissions decreased 39% (38%, 40%) for cardiovascular conditions; no significant reductions were observed in number of hospital admissions attributable to control conditions (cholecystitis, appendicitis, bowel obstruction) in Toronto
Cardiovascular D
iseases A-5
The Health C
onsequences of Smoking —
50 Years of Progress
Table 8.6S Part B—Continued
Study Design/populationPre/postduration (months) Measure/statistical method Findings (95% CI) Comments
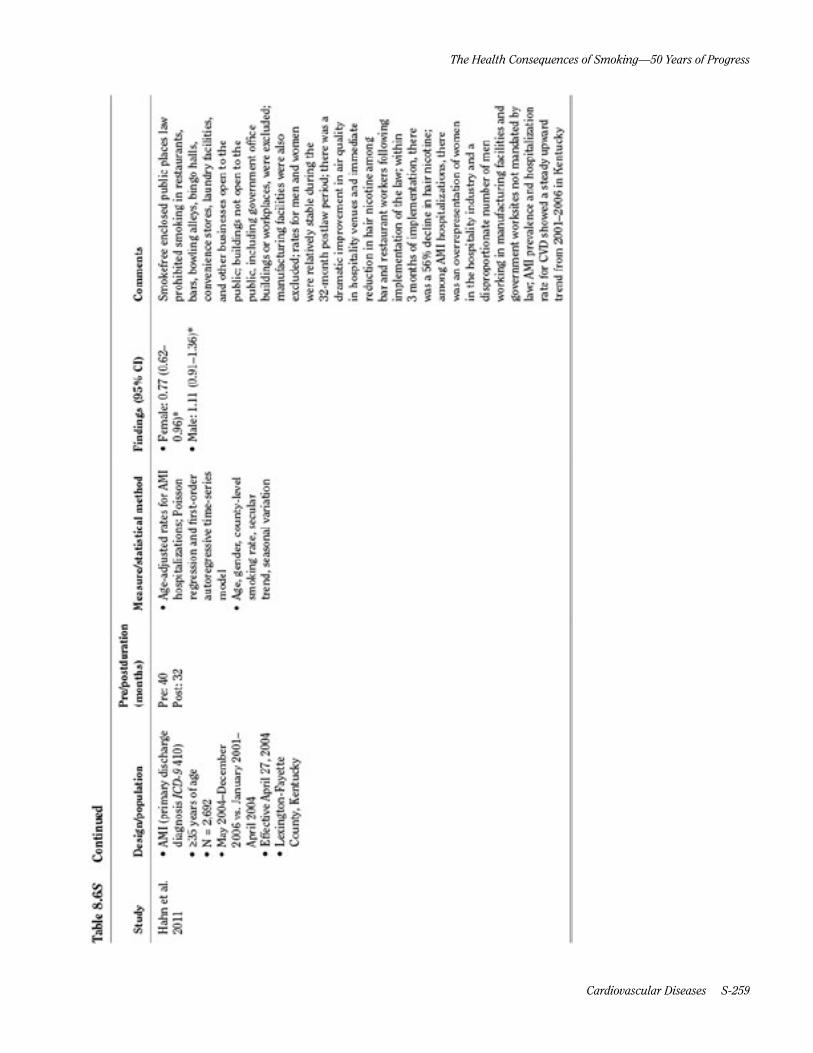
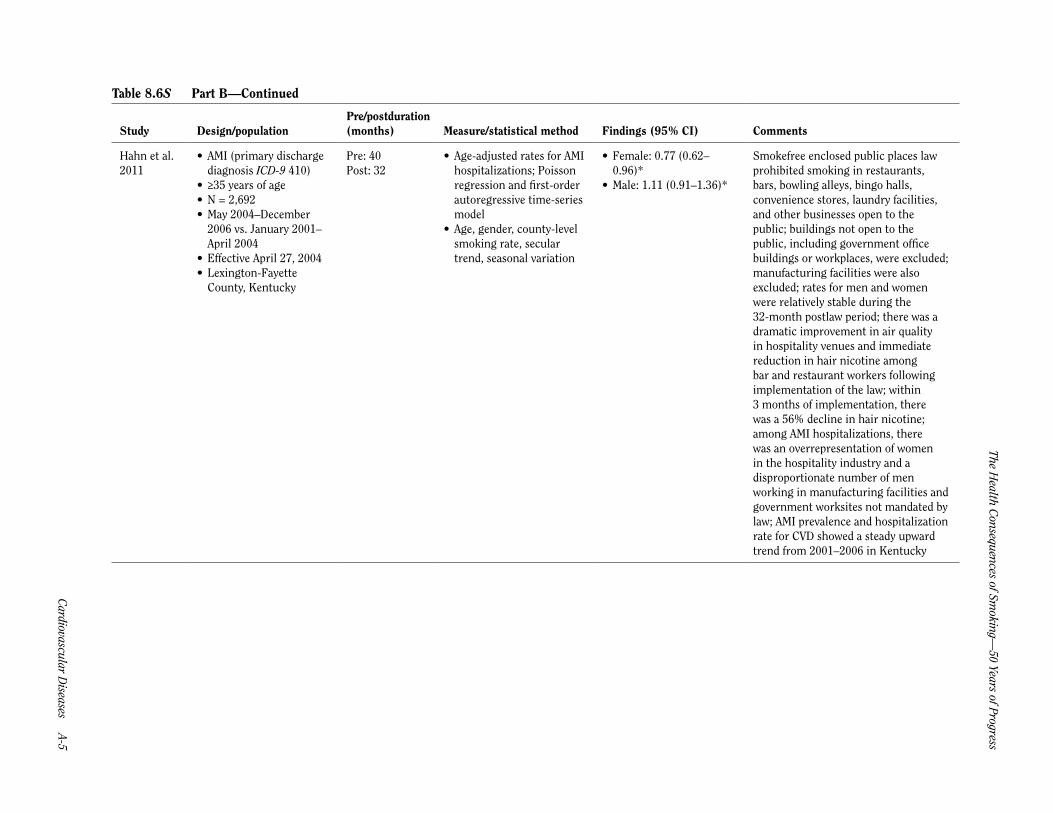
Hahn et al. 2011
• AMI (primary dischargediagnosis ICD-9 410)
• ≥35 years of age• N = 2,692• May 2004–December
2006 vs. January 2001–April 2004
• Effective April 27, 2004• Lexington-Fayette
County, Kentucky
Pre: 40Post: 32
• Age-adjusted rates for AMIhospitalizations; Poissonregression and first-orderautoregressive time-seriesmodel
• Age, gender, county-levelsmoking rate, seculartrend, seasonal variation
• Female: 0.77 (0.62–0.96)*
• Male: 1.11 (0.91–1.36)*
Smokefree enclosed public places law prohibited smoking in restaurants, bars, bowling alleys, bingo halls, convenience stores, laundry facilities, and other businesses open to the public; buildings not open to the public, including government office buildings or workplaces, were excluded; manufacturing facilities were also excluded; rates for men and women were relatively stable during the 32-month postlaw period; there was a dramatic improvement in air quality in hospitality venues and immediate reduction in hair nicotine among bar and restaurant workers following implementation of the law; within 3 months of implementation, there was a 56% decline in hair nicotine; among AMI hospitalizations, there was an overrepresentation of women in the hospitality industry and a disproportionate number of men working in manufacturing facilities and government worksites not mandated by law; AMI prevalence and hospitalization rate for CVD showed a steady upward trend from 2001–2006 in Kentucky

Surgeon General’s R
eport
A-6 Chapter 8 Tables Supplem
ent
Table 8.6S Part B—Continued
Study Design/populationPre/postduration (months) Measure/statistical method Findings (95% CI) Comments
Hurt et al. 2011
• AMI validated usingbiomarkers, cardiac pain,and Minnesota coding ofthe EKG
• October 2007–March2009 vs. July 2000–December 2001
• Effective January 1, 2002(Ordinance 1: smokefreerestaurants)
• Effective October 1, 2007(Ordinance 2: smokefreeworkplaces)
• Olmsted County,Minnesota
Preordinance 1: 18Postordinance 1: 18
• Age and gender-adjustedrate per 100,000; adjustedHR
• Ordinance 1 vs. no law:0.90 (0.73–1.10)*
Law was initiated in 2 steps, smokefree restaurants in January 2002, and smokefree workplaces in 2007; AMI rate per 100,000 dropped from 212.3 to 168.7 following the restaurant law (HR = 0.90; 0.73, 1.10; p = 0.30) and from 130.0 to 102.9 following the workplace law (HR = 0.79; 0.63, 0.98; p = 0.04); during this period, the prevalence of hypertension, diabetes, hypercholesterolemia, and obesity either remained constant or increased while the prevalence of smoking among the adults declined by 23%
Sargent et al. 2012
• Acute myocardialinfarction (ICD-10I21.0-I21.9) excludingrecurrent AMI within 28days of the initial event
• ≥30 years of age• N = 39,224• January 2004–December
2008• Nationwide: September
1, 2007• Statewide: varies• Germany
Pre: variesPost: 1
• Rate of hospitalization forAMI; logistic regressionand interrupted time serieslinear regression model
• Confounders: age, gender,occupation
• 0.914 (0.878–0.950)*• In the first year after
implementation, 449 AMIhospitalizations wereprevented
Legislation addressed smoking in federal buildings and the transportation system; private employers were allowed to introduce a total or partial smoking law in workplaces; states were permitted to decide how to limit smoking in the hospitality sector (hotels, restaurants, bars); nonsignificant trend toward decreasing rate of admissions after law; hospitality smoking laws were passed in all states and implemented between August 1, 2007 and July 1, 2008; most states continued to allow smoking in small bars without any food delivery and in separate rooms in large restaurants; a population-based survey revealed a significant decrease of cigarettes smoked in Germany after the law; hospital admissions for control condition fractures increased slightly from 65,100 in 2007 to 66,954 in 2009; bronchitis cases, which might be affected by smokefree laws, declined from 16,900 in 2007 to 15,391 in 2009; hospitalization costs for AMI decreased significantly by 20.1% (16.0–24.2%), or about €5.2 million

Cardiovascular D
iseases A-7
The Health C
onsequences of Smoking —
50 Years of Progress
Table 8.6S Detailed description of studies on smokefree laws and coronary events—Part C: AMI–workplace, restaurant, and bar laws
Study Design/populationPre/postduration (months) Measure/statistical method Findings (95% CI) Comments
Sargent et al. 2004
• AMI (primary andsecondary diagnosesof ICD-9 410, somevalidated with troponinor CPK)
• N = 304• December 1997–
November 2003• Effective June 5, 2002–
December 3, 2002• Helena, Montana
Pre: same 6 months for 4 pre-years and 1 year after law suspendedPost: 6
• Number of admissionsduring 6-month period thelaw was in effect comparedwith the average for thesame 6 months in otheryears by Poisson test
• Comparison withnumber of admissionsfrom surrounding area(not covered by law).No significant changein control area outsideHelena
• 0.60 (0.36–0.99)*c
• Drop in number ofadmissions of -16 (-31.7,-0.03) from 40 cases to 24
Law prohibited smoking in public and in workplaces but was suspended by a court order after 6 months; analysis did not consider fact that admissions were increasing with time, which biases comparison toward null
Barone-Adesi et al. 2006
• AMI (primary dischargediagnosis ICD-9 410)and hospital deaths dueto AMI
• N = 17,153• Compared October–
December 2004 (beforelaw) and February–June2005 (after law) withsame periods 1 yearearlier
• Effective January 10,2005
• Piedmont, Italy
Pre: 3Post: 6
• Age-standardizedrates (using Europeanstandardized population)
• (0.97–1.06)• <60 years: 0.89 (0.81–
0.98)* – Female: 0.75 (0.58–0.96)
– Male: 0.91 (0.82–1.01)• >60 years: 1.05 (1.00–
1.11) – Female: 1.05 (0.97–1.14)
– Male: 1.03 (0.96–1.11)
See entry for Italy (4 regions); no changes from 1 year before for prelaw period; change compared with 1 year earlier for postlaw period; estimated that 1% out of the 11% reduction in AMI is attributable to reduced smoking among smokers rather than passive smoking
Heinz et al. 2007
• AMI (primarydiagnosis using ICD-9classification)
• N = 1,197• July 1, 2004–June 30,
2005 vs. July 1, 2002–June 30, 2004
• Effective July 1, 2004• Boise, Idaho
Pre: 24Post: 12
• Poisson test• Weather, outdoor air
quality, time
• All patients: 0.82 (0.66–1.01)*d
• Nonsmokers: 0.68 (0.53–0.87)d
• Significant 32% decreasein MI rate amongnonsmokers (p = 0.002)and nonsignificant 18%decrease in MI rateamong all patients(p = 0.068)
Law on smoking in public buildings, including restaurants; control condition (urinary tract infection) demonstrated nonsignificant increase during study period

Surgeon General’s R
eport
A-8 Chapter 8 Tables Supplem
ent
Table 8.6S Part C—Continued
Study Design/populationPre/postduration (months) Measure/statistical method Findings (95% CI) Comments
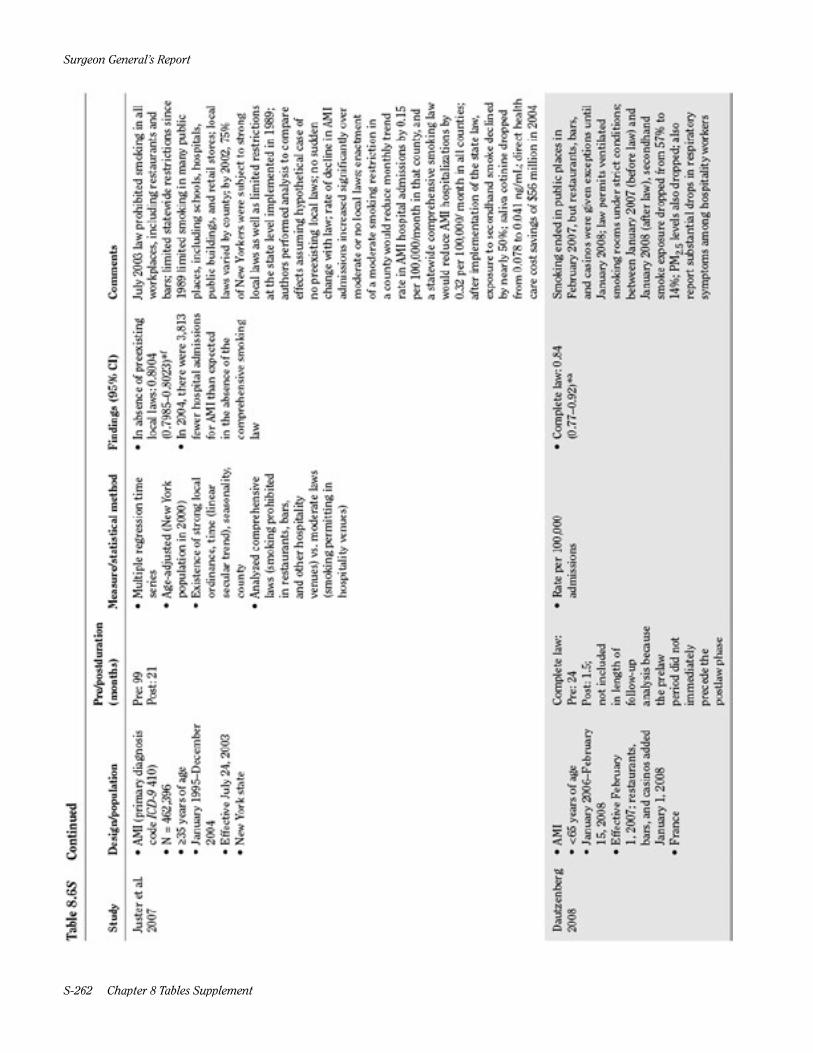
Juster et al. 2007
• AMI (primary diagnosiscode ICD-9 410)
• N = 462,396• ≥35 years of age• January 1995–December
2004• Effective July 24, 2003• New York state
Pre: 99Post: 21
• Multiple regression timeseries
• Age-adjusted (New Yorkpopulation in 2000)
• Existence of strong localordinance, time (linearsecular trend), seasonality,county
• Analyzed comprehensivelaws (smoking prohibitedin restaurants, bars,and other hospitalityvenues) vs. moderate laws(smoking permitting inhospitality venues)
• In absence of preexistinglocal laws: 0.8004(0.7985–0.8023)*f
• In 2004, there were 3,813fewer hospital admissionsfor AMI than expectedin the absence of thecomprehensive smokinglaw
July 2003 law prohibited smoking in all workplaces, including restaurants and bars; limited statewide restrictions since 1989 limited smoking in many public places, including schools, hospitals, public buildings, and retail stores; local laws varied by county; by 2002, 75% of New Yorkers were subject to strong local laws as well as limited restrictions at the state level implemented in 1989; authors performed analysis to compare effects assuming hypothetical case of no preexisting local laws; no sudden change with law; rate of decline in AMI admissions increased significantly over moderate or no local laws; enactment of a moderate smoking restriction in a county would reduce monthly trend rate in AMI hospital admissions by 0.15 per 100,000/month in that county, and a statewide comprehensive smoking law would reduce AMI hospitalizations by 0.32 per 100,000/ month in all counties; after implementation of the state law, exposure to secondhand smoke declined by nearly 50%; saliva cotinine dropped from 0.078 to 0.041 ng/mL; direct health care cost savings of $56 million in 2004
Dautzenberg 2008
• AMI• <65 years of age• January 2006–February
15, 2008• Effective February
1, 2007; restaurants,bars, and casinos addedJanuary 1, 2008
• France
Complete law: Pre: 24Post: 1.5; not included in length of follow-up analysis because the prelaw period did not immediately precede the postlaw phase
• Rate per 100,000admissions
• Complete law: 0.84(0.77–0.92)*a
Smoking ended in public places in February 2007, but restaurants, bars, and casinos were given exceptions until January 2008; law permits ventilated smoking rooms under strict conditions; between January 2007 (before law) and January 2008 (after law), secondhand smoke exposure dropped from 57% to 14%; PM2.5 levels also dropped; also report substantial drops in respiratory symptoms among hospitality workers

Cardiovascular D
iseases A-9
The Health C
onsequences of Smoking —
50 Years of Progress
Table 8.6S Part C—Continued
Study Design/populationPre/postduration (months) Measure/statistical method Findings (95% CI) Comments
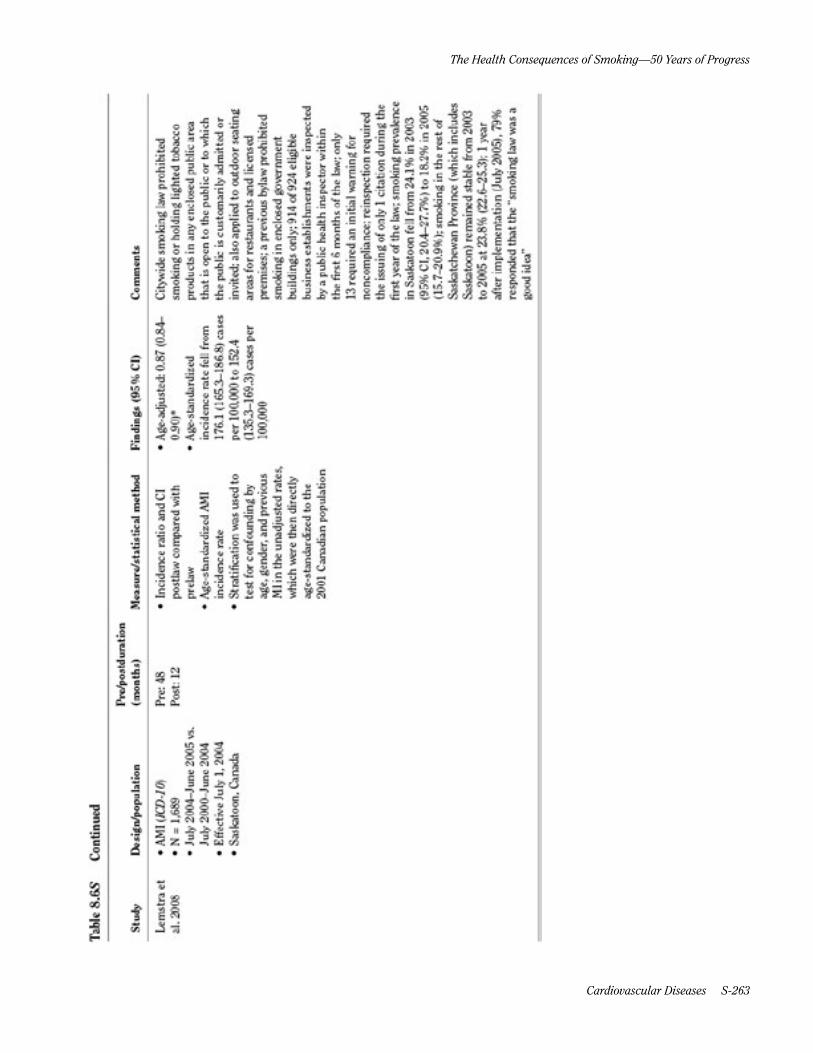
Lemstra et al. 2008
• AMI (ICD-10)• N = 1,689• July 2004–June 2005 vs.
July 2000–June 2004• Effective July 1, 2004• Saskatoon, Canada
Pre: 48Post: 12
• Incidence ratio and CIpostlaw compared withprelaw
• Age-standardized AMIincidence rate
• Stratification was used totest for confounding byage, gender, and previousMI in the unadjusted rates,which were then directlyage-standardized to the2001 Canadian population
• Age-adjusted: 0.87 (0.84–0.90)*
• Age-standardizedincidence rate fell from 176.1 (165.3–186.8) cases per 100,000 to 152.4 (135.3–169.3) cases per 100,000
Citywide smoking law prohibited smoking or holding lighted tobacco products in any enclosed public area that is open to the public or to which the public is customarily admitted or invited; also applied to outdoor seating areas for restaurants and licensed premises; a previous bylaw prohibited smoking in enclosed government buildings only; 914 of 924 eligible business establishments were inspected by a public health inspector within the first 6 months of the law; only 13 required an initial warning for noncompliance; reinspection required the issuing of only 1 citation during the first year of the law; smoking prevalence in Saskatoon fell from 24.1% in 2003 (95% CI, 20.4–27.7%) to 18.2% in 2005 (15.7–20.9%); smoking in the rest of Saskatchewan Province (which includes Saskatoon) remained stable from 2003 to 2005 at 23.8% (22.6–25.3); 1 year after implementation (July 2005), 79% responded that the “smoking law was a good idea”

Surgeon General’s R
eport
A-10 Chapter 8 Tables Supplem
ent
Table 8.6S Part C—Continued
Study Design/populationPre/postduration (months) Measure/statistical method Findings (95% CI) Comments
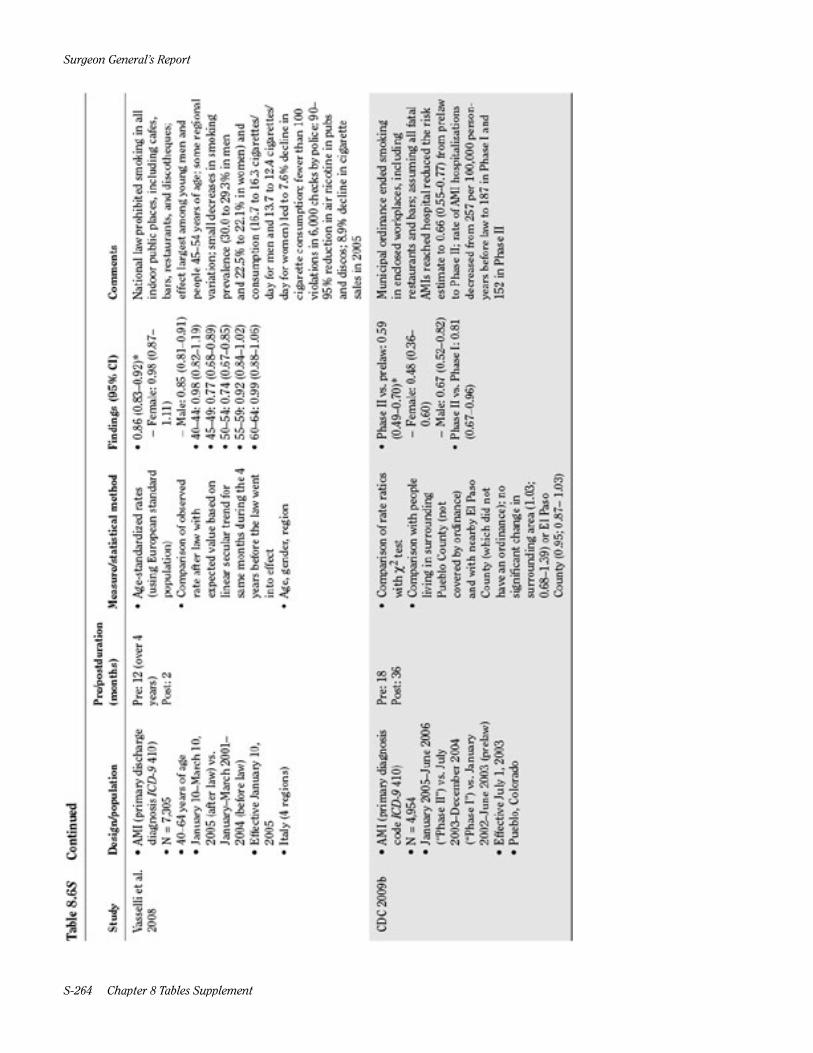
Vasselli et al. 2008
• AMI (primary dischargediagnosis ICD-9 410)
• N = 7,305• 40–64 years of age• January 10–March 10,
2005 (after law) vs.January–March 2001–2004 (before law)
• Effective January 10,2005
• Italy (4 regions)
Pre: 12 (over 4 years)Post: 2
• Age-standardized rates(using European standardpopulation)
• Comparison of observedrate after law withexpected value based onlinear secular trend forsame months during the 4years before the law wentinto effect
• Age, gender, region
• 0.86 (0.83–0.92)* – Female: 0.98 (0.87–1.11)
– Male: 0.85 (0.81–0.91)• 40–44: 0.98 (0.82–1.19)• 45–49: 0.77 (0.68–0.89)• 50–54: 0.74 (0.67–0.85)• 55–59: 0.92 (0.84–1.02)• 60–64: 0.99 (0.88–1.06)
National law prohibited smoking in all indoor public places, including cafes, bars, restaurants, and discotheques; effect largest among young men and people 45–54 years of age; some regional variation; small decreases in smoking prevalence (30.0 to 29.3% in men and 22.5% to 22.1% in women) and consumption (16.7 to 16.3 cigarettes/day for men and 13.7 to 12.4 cigarettes/day for women) led to 7.6% decline in cigarette consumption; fewer than 100 violations in 6,000 checks by police; 90–95% reduction in air nicotine in pubs and discos; 8.9% decline in cigarette sales in 2005
CDC 2009b • AMI (primary diagnosiscode ICD-9 410)
• N = 4,954• January 2005–June 2006
(“Phase II”) vs. July2003–December 2004(“Phase I”) vs. January2002–June 2003 (prelaw)
• Effective July 1, 2003• Pueblo, Colorado
Pre: 18Post: 36
• Comparison of rate ratioswith c2 test
• Comparison with peopleliving in surroundingPueblo County (notcovered by ordinance)and with nearby El PasoCounty (which did nothave an ordinance); nosignificant change insurrounding area (1.03;0.68–1.39) or El PasoCounty (0.95; 0.87– 1.03)
• Phase II vs. prelaw: 0.59(0.49–0.70)*
– Female: 0.48 (0.36–0.60)
– Male: 0.67 (0.52–0.82)• Phase II vs. Phase I: 0.81
(0.67–0.96)
Municipal ordinance ended smoking in enclosed workplaces, including restaurants and bars; assuming all fatal AMIs reached hospital reduced the risk estimate to 0.66 (0.55–0.77) from prelaw to Phase II; rate of AMI hospitalizations decreased from 257 per 100,000 person-years before law to 187 in Phase I and 152 in Phase II
Cardiovascular D
iseases A-11
The Health C
onsequences of Smoking —
50 Years of Progress
Table 8.6S Part C—Continued
Study Design/populationPre/postduration (months) Measure/statistical method Findings (95% CI) Comments
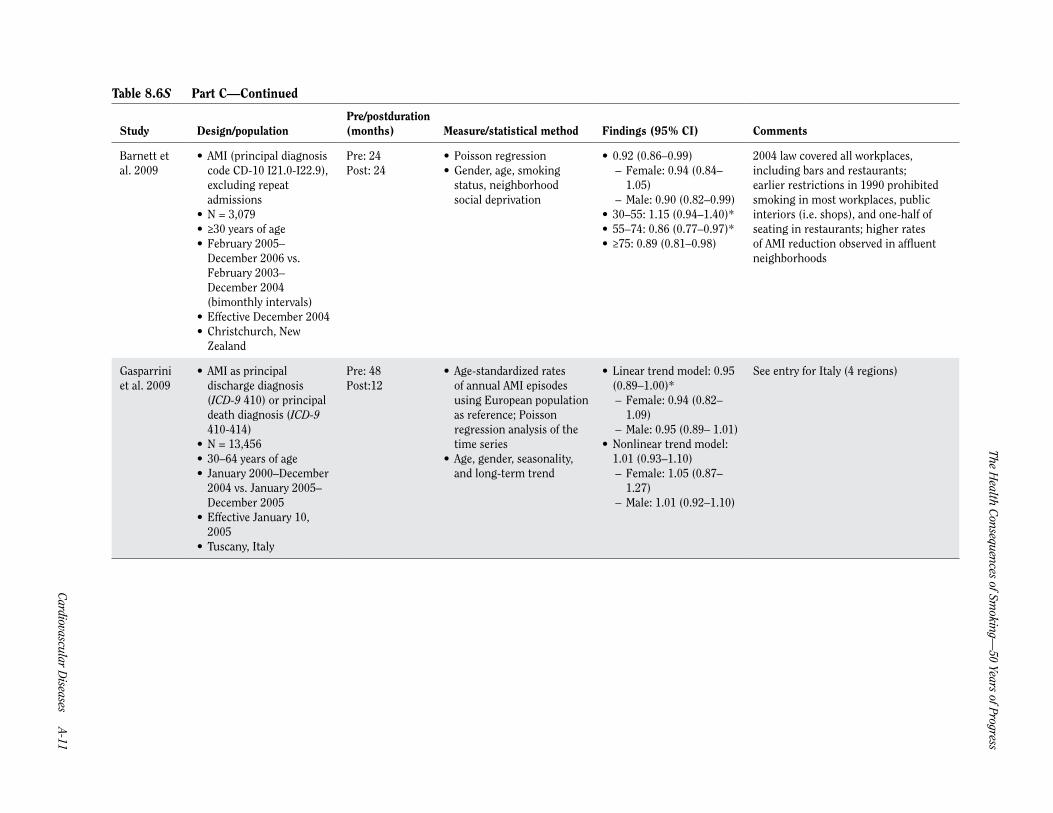
Barnett et al. 2009
• AMI (principal diagnosiscode CD-10 I21.0-I22.9),excluding repeatadmissions
• N = 3,079• ≥30 years of age• February 2005–
December 2006 vs.February 2003–December 2004(bimonthly intervals)
• Effective December 2004• Christchurch, New
Zealand
Pre: 24Post: 24
• Poisson regression• Gender, age, smoking
status, neighborhoodsocial deprivation
• 0.92 (0.86–0.99) – Female: 0.94 (0.84–1.05)
– Male: 0.90 (0.82–0.99)• 30–55: 1.15 (0.94–1.40)*• 55–74: 0.86 (0.77–0.97)*• ≥75: 0.89 (0.81–0.98)
2004 law covered all workplaces, including bars and restaurants; earlier restrictions in 1990 prohibited smoking in most workplaces, public interiors (i.e. shops), and one-half of seating in restaurants; higher rates of AMI reduction observed in affluent neighborhoods
Gasparrini et al. 2009
• AMI as principaldischarge diagnosis(ICD-9 410) or principaldeath diagnosis (ICD-9410-414)
• N = 13,456• 30–64 years of age• January 2000–December
2004 vs. January 2005–December 2005
• Effective January 10,2005
• Tuscany, Italy
Pre: 48Post:12
• Age-standardized ratesof annual AMI episodesusing European populationas reference; Poissonregression analysis of thetime series
• Age, gender, seasonality,and long-term trend
• Linear trend model: 0.95(0.89–1.00)*
– Female: 0.94 (0.82–1.09)
– Male: 0.95 (0.89– 1.01)• Nonlinear trend model:
1.01 (0.93–1.10) – Female: 1.05 (0.87–1.27)
– Male: 1.01 (0.92–1.10)
See entry for Italy (4 regions)

Surgeon General’s R
eport
A-12 Chapter 8 Tables Supplem
ent
Table 8.6S Part C—Continued
Study Design/populationPre/postduration (months) Measure/statistical method Findings (95% CI) Comments
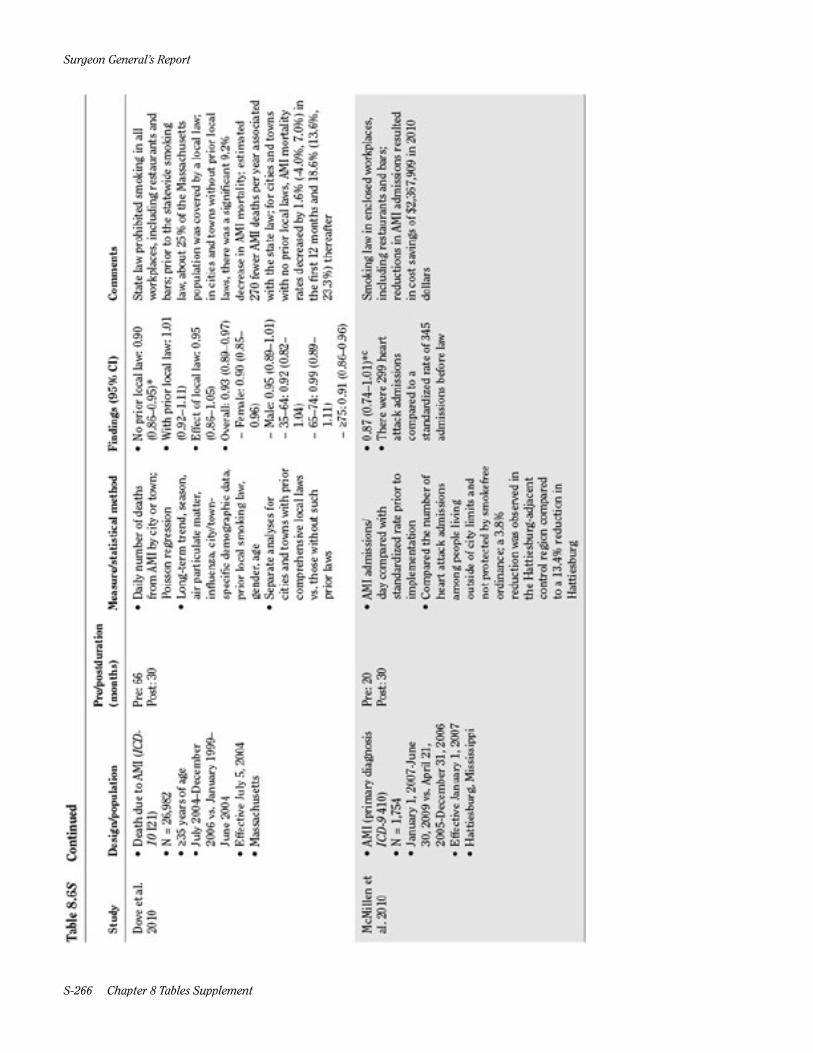
Dove et al. 2010
• Death due to AMI (ICD-10 I21)
• N = 26,982• ≥35 years of age• July 2004–December
2006 vs. January 1999–June 2004
• Effective July 5, 2004• Massachusetts
Pre: 66Post: 30
• Daily number of deathsfrom AMI by city or town;Poisson regression
• Long-term trend, season,air particulate matter,influenza, city/town-specific demographic data,prior local smoking law,gender, age
• Separate analyses forcities and towns with priorcomprehensive local lawsvs. those without suchprior laws
• No prior local law: 0.90(0.86–0.95)*
• With prior local law: 1.01(0.92–1.11)
• Effect of local law: 0.95(0.86–1.05)
• Overall: 0.93 (0.89–0.97) – Female: 0.90 (0.85–0.96)
– Male: 0.95 (0.89–1.01) – 35–64: 0.92 (0.82–1.04)
– 65–74: 0.99 (0.89–1.11)
– ≥75: 0.91 (0.86–0.96)
State law prohibited smoking in all workplaces, including restaurants and bars; prior to the statewide smoking law, about 25% of the Massachusetts population was covered by a local law; in cities and towns without prior local laws, there was a significant 9.2% decrease in AMI mortality; estimated 270 fewer AMI deaths per year associated with the state law; for cities and towns with no prior local laws, AMI mortality rates decreased by 1.6% (-4.0%, 7.0%) in the first 12 months and 18.6% (13.6%, 23.3%) thereafter
McMillen et al. 2010
• AMI (primary diagnosisICD-9 410)
• N = 1,754• January 1, 2007-June
30, 2009 vs. April 21,2005-December 31, 2006
• Effective January 1, 2007• Hattiesburg, Mississippi
Pre: 20Post: 30
• AMI admissions/day compared withstandardized rate prior toimplementation
• Compared the number ofheart attack admissionsamong people livingoutside of city limits andnot protected by smokefreeordinance; a 3.8%reduction was observed inthe Hattiesburg-adjacentcontrol region comparedto a 13.4% reduction inHattiesburg
• 0.87 (0.74–1.01)*c
• There were 299 heartattack admissionscompared to astandardized rate of 345admissions before law
Smoking law in enclosed workplaces, including restaurants and bars; reductions in AMI admissions resulted in cost savings of $2,367,909 in 2010 dollars
Cardiovascular D
iseases A-13
The Health C
onsequences of Smoking —
50 Years of Progress
Table 8.6S Part C—Continued
Study Design/populationPre/postduration (months) Measure/statistical method Findings (95% CI) Comments
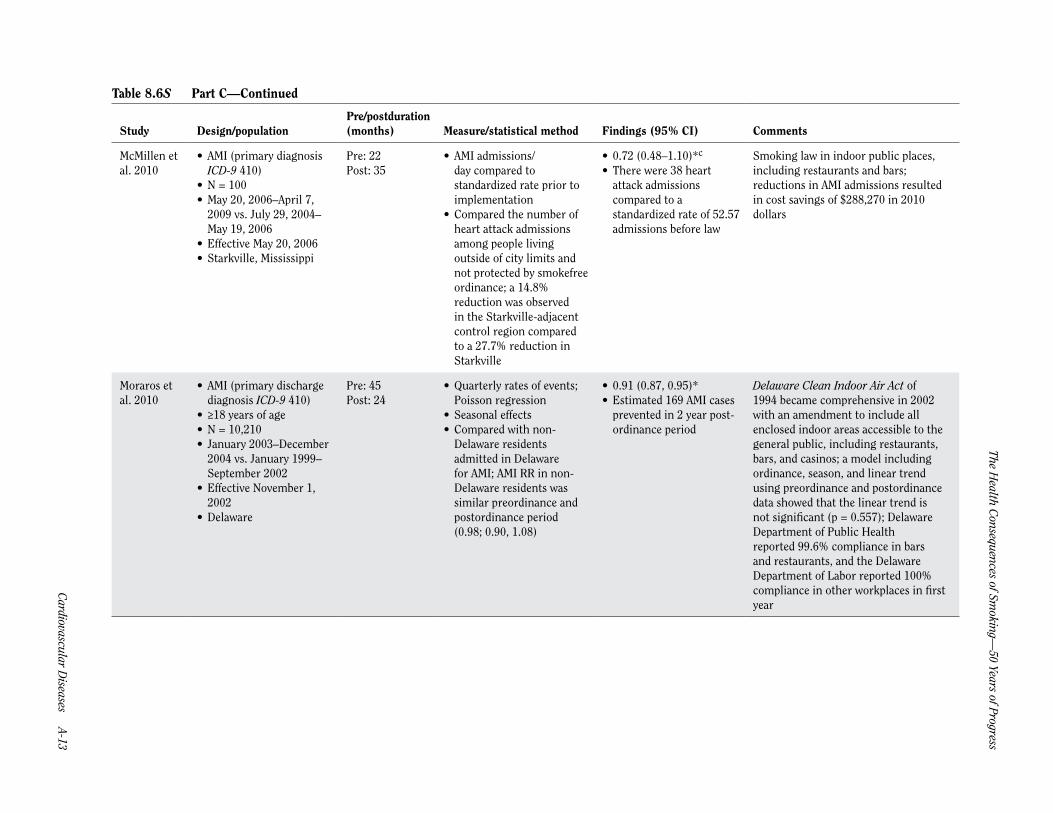
McMillen et al. 2010
• AMI (primary diagnosisICD-9 410)
• N = 100• May 20, 2006–April 7,
2009 vs. July 29, 2004–May 19, 2006
• Effective May 20, 2006• Starkville, Mississippi
Pre: 22Post: 35
• AMI admissions/day compared tostandardized rate prior toimplementation
• Compared the number ofheart attack admissionsamong people livingoutside of city limits andnot protected by smokefreeordinance; a 14.8%reduction was observedin the Starkville-adjacentcontrol region comparedto a 27.7% reduction inStarkville
• 0.72 (0.48–1.10)*c
• There were 38 heartattack admissionscompared to astandardized rate of 52.57admissions before law
Smoking law in indoor public places, including restaurants and bars; reductions in AMI admissions resulted in cost savings of $288,270 in 2010 dollars
Moraros et al. 2010
• AMI (primary dischargediagnosis ICD-9 410)
• ≥18 years of age• N = 10,210• January 2003–December
2004 vs. January 1999–September 2002
• Effective November 1,2002
• Delaware
Pre: 45Post: 24
• Quarterly rates of events;Poisson regression
• Seasonal effects• Compared with non-
Delaware residentsadmitted in Delawarefor AMI; AMI RR in non-Delaware residents wassimilar preordinance andpostordinance period(0.98; 0.90, 1.08)
• 0.91 (0.87, 0.95)*• Estimated 169 AMI cases
prevented in 2 year post-ordinance period
Delaware Clean Indoor Air Act of 1994 became comprehensive in 2002 with an amendment to include all enclosed indoor areas accessible to the general public, including restaurants, bars, and casinos; a model including ordinance, season, and linear trend using preordinance and postordinance data showed that the linear trend is not significant (p = 0.557); Delaware Department of Public Health reported 99.6% compliance in bars and restaurants, and the Delaware Department of Labor reported 100% compliance in other workplaces in first year

Surgeon General’s R
eport
A-14 Chapter 8 Tables Supplem
ent
Table 8.6S Part C—Continued
Study Design/populationPre/postduration (months) Measure/statistical method Findings (95% CI) Comments
Naiman et al. 2010
• AMI (ICD-9 410, ICD-10I21)
• ≥45 years of age• January 1996–May 2006• Effective May 2006• Toronto, Canada
Pre: 36Post phase 3: 36; not included in length of follow-up analysis because the prelaw period did not immediately precede the postlaw phase
• ARIMA on crude rates ofhospital admission
• Subgroup analyses by age,gender
• Comparison with DurhamRegion and Thunder Bay,2 Ontario municipalitieswith no smokefree laws; nosignificant reductions wereobserved in control cities
• Phase 3 vs. pre: 0.81(0.75–0.88)*c
Legislation required all public places and workplaces to be smokefree and was implemented in 3 phases; the largest declines were seen after the phase of the law affecting restaurants came into effect, including a 17% (14%, 19%) decrease in AMI; crude rates of hospital admissions decreased 39% (38%, 40%) for cardiovascular conditions; no significant reductions were observed in number of hospital admissions attributable to control conditions (cholecystitis, appendicitis, bowel obstruction) in Toronto; smokefree legislation occurred in 3 phases: smokefree public places and workplaces in October 1999; smokefree restaurants, dinner theaters, and bowling centers except designated smoking rooms in June 2001; smokefree bars, billiard halls, bingo halls, casinos, racetracks except designated smoking rooms in June 2004
Sims et al. 2010
• AMI (primary diagnosiscode ICD-10 I21)excluding repeatadmissions within 28days
• ≥18 years of age• N = 342,361• July 2007–September
2008 vs. July 2002–May2007
• Effective July 1, 2007• England
Pre: 60Post: 15
• Interrupted time seriesdesign with hospitalepisode statistics data;segmented Poissonregression
• Long-term trend, temporalfluctuations (temperature,week of year, holidays),population size
• Stratified by age andgender
• 0.98 (0.96–0.99)*• <60 years:
– Female: 0.98 (0.92–1.03)
– Male: 0.97 (0.94–0.99)• ≥60 years:
– Female: 0.96 (0.94–0.99)
– Male: 0.96 (0.95–0.99)• About 1,600 emergency
admissions for AMIprevented in 12 months
Law affected bars and restaurants most; some of these venues went smokefree before July 1 in preparation for the law, which may create a less marked decrease; no evidence of a change in the slope of the AMI trend line after the legislation; prior to the law, many public places and workplaces were already smokefree; in the year before implementation, 55% of employed adults already worked in smokefree environments; subgroup analysis shows significant 3.07% drop in admissions in 60+ group (p = 0.001) and 3.46% drop in men <60 (p <0.01)

Cardiovascular D
iseases A-15
The Health C
onsequences of Smoking —
50 Years of Progress
Table 8.6S Part C—Continued
Study Design/populationPre/postduration (months) Measure/statistical method Findings (95% CI) Comments
Barone-Adesi et al. 2011
• AMI (ICD-9 410)• Primary analysis was for
ACEs (AMI and otheracute and subacute IHD)
• N = 936,519 (all ACEs)• January 2005-November
2006 vs. January 2002–December 2004
• Effective January 10,2005
• Italy (20 regions)
Pre: 36Post: 24
• Admission rates; Poissontest with mixed effectregression modelswith fixed coefficientsdescribing the nationaltrend and randomcoefficients describingregion-specific deviations
• Seasonality, long termtrends
• Separate analysesconducted based on age,gender
• <70 years: 0.97 (0.95–0.99)*
– Female: 0.98 (0.94–1.02)
– Male: 0.97 (0.95–0.99)• ≥70 years: 1.01 (0.99–
1.04) – Female: 1.02 (0.99–1.04)
– Male: 1.00 (0.98– 1.03)
See entry for Italy (4 regions); the observed reduction was stable over the study period, similar in different geographic areas, and stronger among young people; no evidence of a gradual effect over time, as there was no change in the underlying trend in admissions for ACEs after law
Bonetti et al. 2011b
• AMI (defined asdetectable troponinin a clinical settingconsistent w/ myocardialischemia, identifiedby ICD-10 codes)undergoing coronaryangiography (may beviewed as representativeof overall incidence inthe region)
• N = 842• March 2006–February
2008 vs. March 1, 2008• Effective March 2008–
February 2010• Graubünden,
Switzerland
Pre: 24Post: 24
• AMI incidence• Air quality (PM10 and
NO2), sales of lipidlowering drugs
• Separate analyses basedon resident status, gender,smoking status, medicalhistory
• Compared with Lucerne,a nearby region withoutsmokefree law; AMIincidence increasedin Lucerne duringthe postlaw period inGraubünden
• 0.79 (0.69–0.90)*a
• The number of AMIpatients decreased 21%in the 2 years before vs. 2years after law
• For each of the 4 yearsof the study, incidencerate of AMI was 89.4(pre), 93.8 (pre), 69.8 (1year post), and 68.8 (2years post) per 100,000residents
Smoking law in public places, including cafes, bars, and restaurants; based on the large number of visitors, the population of the Canton of Graubünden may almost double during the holiday season, hence the resident vs. nonresident analysis; the most pronounced reduction in AMI was in patients with documented coronary artery disease; female AMI patients showed a more pronounced drop in the second year of the law compared to the first, while male patients experienced a diminished magnitude of decrease; changes in outdoor air pollution or use of lipid-lowering drugs (potential confounders) did not substantially contribute to the decrease in the incidence of AMI

Surgeon General’s R
eport
A-16 Chapter 8 Tables Supplem
ent
Table 8.6S Part C—Continued
Study Design/populationPre/postduration (months) Measure/statistical method Findings (95% CI) Comments
Bruckman and Bénnett 2011
• AMI (principal dischargediagnosis ICD-9 410)
• January 2005–April 2007vs. May 2007–December2009
• Effective May 2007• Ohio
Pre: 28Post: 32
• Age- and gender-adjusteddischarge rate per 1,000(converted to per 100,000);mixed linear models witha varying covariancestructure to determineif rates decreased yearly;spline polynomialfunctions to determineinflection point in monthlyrate data
• Age, gender, linear trend,seasonality
• 0.96 (0.95–0.98)*a
• AMI discharge ratesdropped from 198 per100,000 in 2005 to 168per 100,000 in 2009
Law prohibits smoking in a public place or a place of employment; inflection point identified as June 2007, 1 month after implementation; average decrease in MI discharge of 7 per 100,000 each year from 2005 to 2009; conservative estimate of $737,782 in hospital stay costs in first year after law (estimate does not account for physician fees); direct system savings of $1.1 million from 69 cases prevented by smoking law
Bruintjes et al. 2011
• AMI (primary diagnosisICD-9 410) andbiomarker confirmation(troponin I or CKMB)
• N = 706• January 2004–June 2006
vs. July 2002–November2003
• Effective December 2003• Greeley, Colorado
Pre: 17Post: 30
• Population-adjustedmonthly hospitalizationrates; Poisson regression
• Seasonality(nonsignificant), lineartrends (nonsignificant),smoking status, type of MI
• Compared with adjacentarea immediatelysurrounding Greeley; asmaller, nonsignificantdecrease was noted inthe area immediatelysurrounding Greeley (0.83;0.61, 1.14); comparisonof RR reductions betweenGreeley and the controlarea was not significant(p = 0.48)
• 0.73 (0.59–0.90)* Law prohibits smoking in all places of public assembly, including restaurants, bars, bowling alleys, bingo halls, and outdoor public gathering places where seating is provided; smoking law underwent various legal challenges through November 2004, during which compliance was variable; significant reductions in AMI among smokers (0.44; 0.29, 0.65); nonsignificant reduction among nonsmokers (0.86; 0.67, 1.09); smokers from control area also experienced a significant decrease (0.58; 0.35, 0.97) that was not significantly different from Greeley smokers (p = 0.38); reduction in events was similar in patients with STEMI (0.79; 0.34, 1.83) and NSTEMI (0.66; 0.37, 1.17); linear trends were tested and not significant
Di Valentino et al. 2011
• ST-elevation myocardialinfarction (ICD-10)
• N = 1,272• 2007–2008 vs. 2004–
2006• Effective April 2007• Canton Ticino,
Switzerland
Pre: 36Post: 24
• Comparison ofannual frequency ofhospitalizations due toSTEMI
• 0.79 (0.70–0.88)*b
• 22.4% (p <.0001) and20.6% (P <.0002)reduction inhospitalizations duringfirst and second postlawyears, respectively
Smokefree public places, including restaurants, bars, and discos; smoking rooms permitted; this study population overlaps with that of another study also conducted in Ticino examining rates of STEMI (a subset of Acute coronary syndrome) following the law
Cardiovascular D
iseases A-17
The Health C
onsequences of Smoking —
50 Years of Progress
Table 8.6S Part C—Continued
Study Design/populationPre/postduration (months) Measure/statistical method Findings (95% CI) Comments
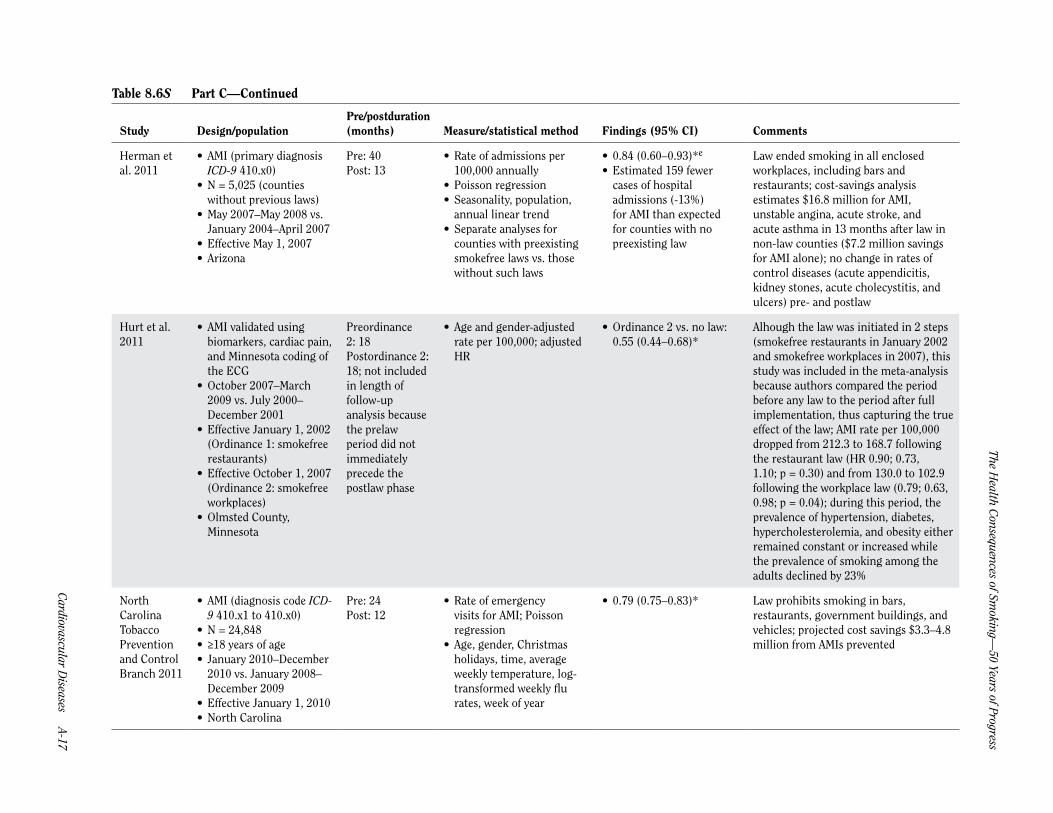
Herman et al. 2011
• AMI (primary diagnosisICD-9 410.x0)
• N = 5,025 (countieswithout previous laws)
• May 2007–May 2008 vs.January 2004–April 2007
• Effective May 1, 2007• Arizona
Pre: 40Post: 13
• Rate of admissions per100,000 annually
• Poisson regression• Seasonality, population,
annual linear trend• Separate analyses for
counties with preexistingsmokefree laws vs. thosewithout such laws
• 0.84 (0.60–0.93)*e
• Estimated 159 fewercases of hospitaladmissions (-13%)for AMI than expectedfor counties with nopreexisting law
Law ended smoking in all enclosed workplaces, including bars and restaurants; cost-savings analysis estimates $16.8 million for AMI, unstable angina, acute stroke, and acute asthma in 13 months after law in non-law counties ($7.2 million savings for AMI alone); no change in rates of control diseases (acute appendicitis, kidney stones, acute cholecystitis, and ulcers) pre- and postlaw
Hurt et al. 2011
• AMI validated usingbiomarkers, cardiac pain,and Minnesota coding ofthe ECG
• October 2007–March2009 vs. July 2000–December 2001
• Effective January 1, 2002(Ordinance 1: smokefreerestaurants)
• Effective October 1, 2007(Ordinance 2: smokefreeworkplaces)
• Olmsted County,Minnesota
Preordinance 2: 18Postordinance 2: 18; not included in length of follow-up analysis because the prelaw period did not immediately precede the postlaw phase
• Age and gender-adjustedrate per 100,000; adjustedHR
• Ordinance 2 vs. no law:0.55 (0.44–0.68)*
Alhough the law was initiated in 2 steps (smokefree restaurants in January 2002 and smokefree workplaces in 2007), this study was included in the meta-analysis because authors compared the period before any law to the period after full implementation, thus capturing the true effect of the law; AMI rate per 100,000 dropped from 212.3 to 168.7 following the restaurant law (HR 0.90; 0.73, 1.10; p = 0.30) and from 130.0 to 102.9 following the workplace law (0.79; 0.63, 0.98; p = 0.04); during this period, the prevalence of hypertension, diabetes, hypercholesterolemia, and obesity either remained constant or increased while the prevalence of smoking among the adults declined by 23%
North Carolina Tobacco Prevention and Control Branch 2011
• AMI (diagnosis code ICD-9 410.x1 to 410.x0)
• N = 24,848• ≥18 years of age• January 2010–December
2010 vs. January 2008–December 2009
• Effective January 1, 2010• North Carolina
Pre: 24Post: 12
• Rate of emergencyvisits for AMI; Poissonregression
• Age, gender, Christmasholidays, time, averageweekly temperature, log-transformed weekly flurates, week of year
• 0.79 (0.75–0.83)* Law prohibits smoking in bars, restaurants, government buildings, and vehicles; projected cost savings $3.3–4.8 million from AMIs prevented
Surgeon General’s R
eport
A-18 Chapter 8 Tables Supplem
ent
Table 8.6S Part C—Continued
Study Design/populationPre/postduration (months) Measure/statistical method Findings (95% CI) Comments
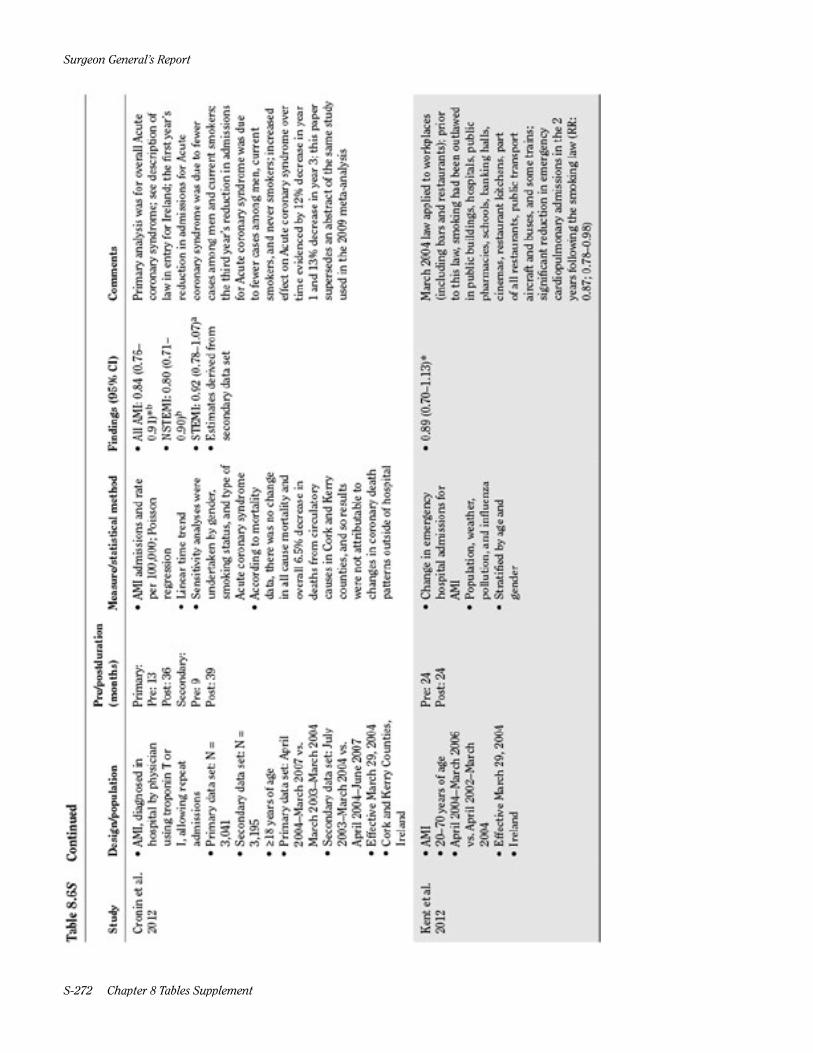
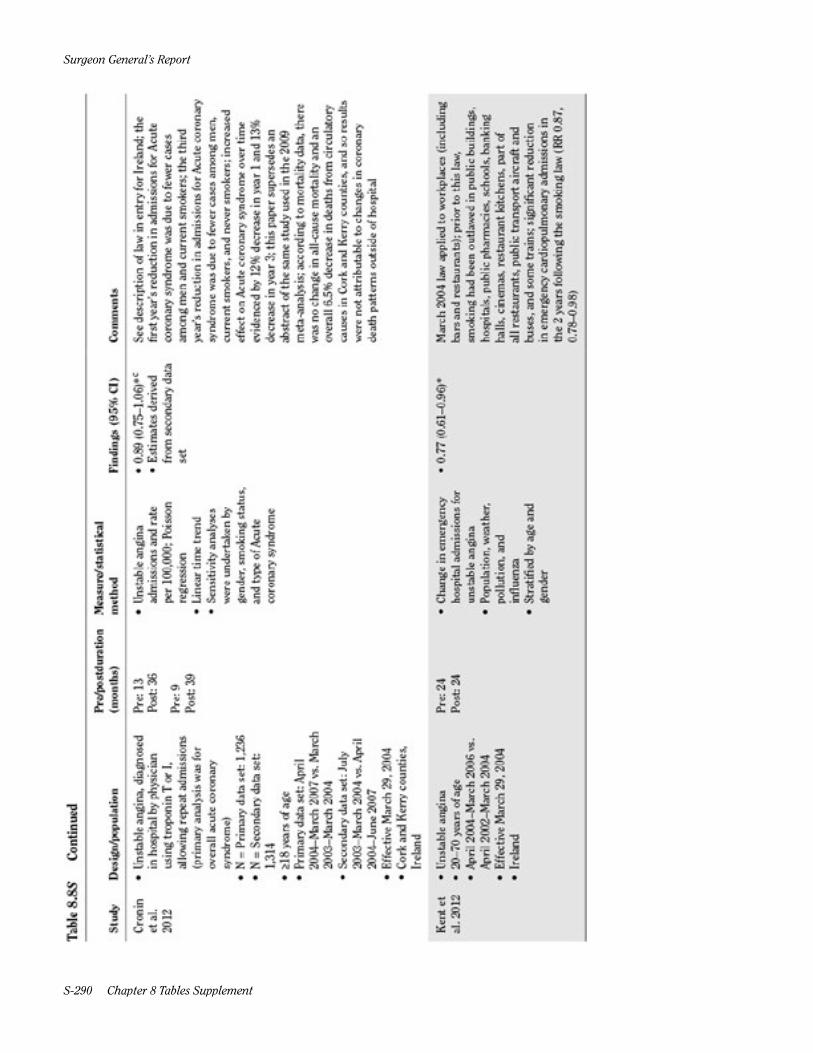
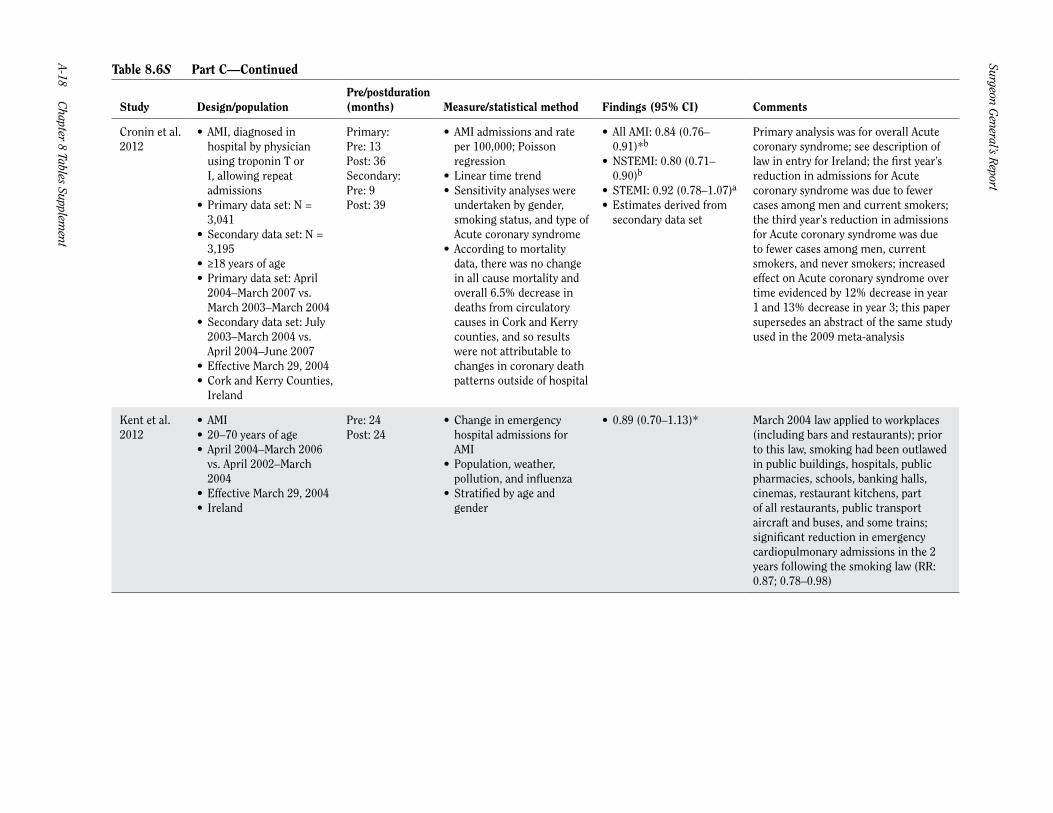
Cronin et al. 2012
• AMI, diagnosed inhospital by physicianusing troponin T orI, allowing repeatadmissions
• Primary data set: N =3,041
• Secondary data set: N =3,195
• ≥18 years of age• Primary data set: April
2004–March 2007 vs.March 2003–March 2004
• Secondary data set: July2003–March 2004 vs.April 2004–June 2007
• Effective March 29, 2004• Cork and Kerry Counties,
Ireland
Primary:Pre: 13Post: 36Secondary:Pre: 9Post: 39
• AMI admissions and rateper 100,000; Poissonregression
• Linear time trend• Sensitivity analyses were
undertaken by gender,smoking status, and type ofAcute coronary syndrome
• According to mortalitydata, there was no changein all cause mortality andoverall 6.5% decrease indeaths from circulatorycauses in Cork and Kerrycounties, and so resultswere not attributable tochanges in coronary deathpatterns outside of hospital
• All AMI: 0.84 (0.76–0.91)*b
• NSTEMI: 0.80 (0.71–0.90)b
• STEMI: 0.92 (0.78–1.07)a
• Estimates derived fromsecondary data set
Primary analysis was for overall Acute coronary syndrome; see description of law in entry for Ireland; the first year’s reduction in admissions for Acute coronary syndrome was due to fewer cases among men and current smokers; the third year’s reduction in admissions for Acute coronary syndrome was due to fewer cases among men, current smokers, and never smokers; increased effect on Acute coronary syndrome over time evidenced by 12% decrease in year 1 and 13% decrease in year 3; this paper supersedes an abstract of the same study used in the 2009 meta-analysis
Kent et al. 2012
• AMI• 20–70 years of age• April 2004–March 2006
vs. April 2002–March2004
• Effective March 29, 2004• Ireland
Pre: 24Post: 24
• Change in emergencyhospital admissions forAMI
• Population, weather,pollution, and influenza
• Stratified by age andgender
• 0.89 (0.70–1.13)* March 2004 law applied to workplaces (including bars and restaurants); prior to this law, smoking had been outlawed in public buildings, hospitals, public pharmacies, schools, banking halls, cinemas, restaurant kitchens, part of all restaurants, public transport aircraft and buses, and some trains; significant reduction in emergency cardiopulmonary admissions in the 2 years following the smoking law (RR: 0.87; 0.78–0.98)
Cardiovascular D
iseases A-19
The Health C
onsequences of Smoking —
50 Years of Progress
Table 8.6S Part C—Continued
Study Design/populationPre/postduration (months) Measure/statistical method Findings (95% CI) Comments
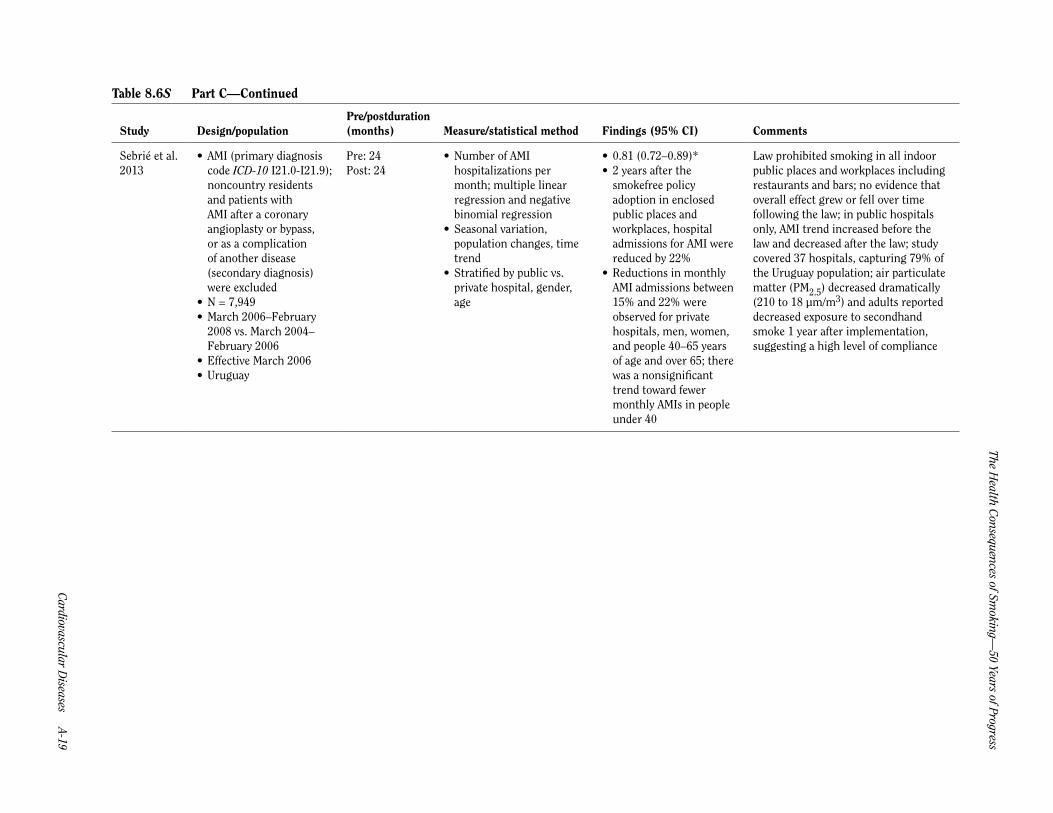
Sebrié et al. 2013
• AMI (primary diagnosiscode ICD-10 I21.0-I21.9);noncountry residentsand patients withAMI after a coronaryangioplasty or bypass,or as a complicationof another disease(secondary diagnosis)were excluded
• N = 7,949• March 2006–February
2008 vs. March 2004–February 2006
• Effective March 2006• Uruguay
Pre: 24Post: 24
• Number of AMIhospitalizations permonth; multiple linearregression and negativebinomial regression
• Seasonal variation,population changes, timetrend
• Stratified by public vs.private hospital, gender,age
• 0.81 (0.72–0.89)*• 2 years after the
smokefree policyadoption in enclosedpublic places andworkplaces, hospitaladmissions for AMI werereduced by 22%
• Reductions in monthlyAMI admissions between15% and 22% wereobserved for privatehospitals, men, women,and people 40–65 yearsof age and over 65; therewas a nonsignificanttrend toward fewermonthly AMIs in peopleunder 40
Law prohibited smoking in all indoor public places and workplaces including restaurants and bars; no evidence that overall effect grew or fell over time following the law; in public hospitals only, AMI trend increased before the law and decreased after the law; study covered 37 hospitals, capturing 79% of the Uruguay population; air particulate matter (PM2.5) decreased dramatically (210 to 18 µm/m3) and adults reported decreased exposure to secondhand smoke 1 year after implementation, suggesting a high level of compliance
Surgeon General’s R
eport
A-20 Chapter 8 Tables Supplem
ent
Table 8.6S Detailed description of studies on smokefree laws and coronary events—Part D: Acute coronary syndrome–workplace only laws
Study Design/populationPre/postduration (months) Measure/statistical method Findings (95% CI) Comments
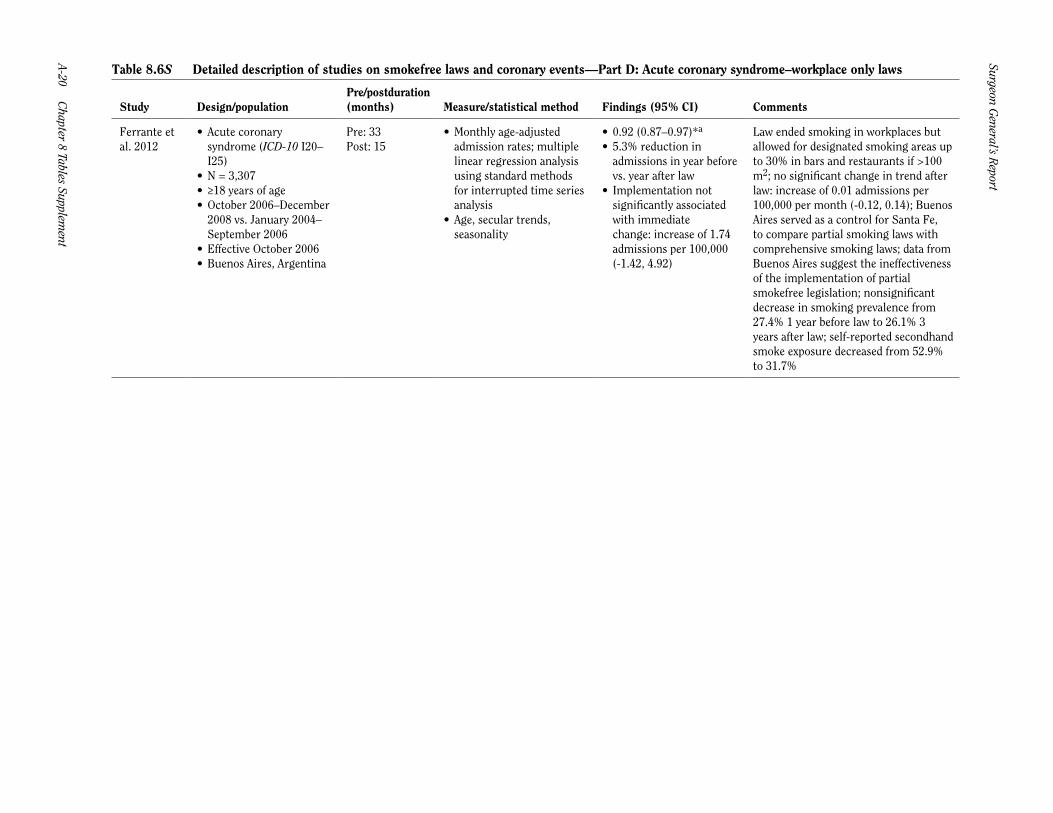
Ferrante et al. 2012
• Acute coronarysyndrome (ICD-10 I20–I25)
• N = 3,307• ≥18 years of age• October 2006–December
2008 vs. January 2004–September 2006
• Effective October 2006• Buenos Aires, Argentina
Pre: 33Post: 15
• Monthly age-adjustedadmission rates; multiplelinear regression analysisusing standard methodsfor interrupted time seriesanalysis
• Age, secular trends,seasonality
• 0.92 (0.87–0.97)*a
• 5.3% reduction inadmissions in year beforevs. year after law
• Implementation notsignificantly associatedwith immediatechange: increase of 1.74admissions per 100,000(-1.42, 4.92)
Law ended smoking in workplaces but allowed for designated smoking areas up to 30% in bars and restaurants if >100 m2; no significant change in trend after law: increase of 0.01 admissions per 100,000 per month (-0.12, 0.14); Buenos Aires served as a control for Santa Fe, to compare partial smoking laws with comprehensive smoking laws; data from Buenos Aires suggest the ineffectiveness of the implementation of partial smokefree legislation; nonsignificant decrease in smoking prevalence from 27.4% 1 year before law to 26.1% 3 years after law; self-reported secondhand smoke exposure decreased from 52.9% to 31.7%

Cardiovascular D
iseases A-21
The Health C
onsequences of Smoking —
50 Years of Progress
Table 8.6S Detailed description of studies on smokefree laws and coronary events—Part E: Acute coronary syndrome–workplace and restaurant laws
Study Design/populationPre/postduration (months) Measure/statistical method Findings (95% CI) Comments
Gupta et al. 2011
• Acute coronary syndrome(primary diagnosticcode ICD-9 410, 411.1,411.81, 411.89, 413.0,413.1, 413.9; an analysisperformed for AMIyielded similar resultsthat were not shown
• N = 14,245• ≥18 years of age• January 2004–September
2008 vs. January 2000–December 2003
• Effective January 1, 2004• Kanawha County, West
Virginia
Pre: 48Post: 57
• Age-adjusted Acutecoronary syndromehospital admission rates;Poisson regression
• Age, gender, year, season,tobacco use, diabetes
• 1.02 (0.92–1.12)*• Age-adjusted Acute
coronary syndromehospitalization ratesdecreased 37% duringentire study period; noadditional significantchange due to removalof smoking areasin restaurants afteraccounting for thesustainable decline ofAcute coronary syndromehospitalizations since the2002 revision
• Stratification showedthat the observed declinewas significant onlyamong nonsmokers
Effective May 22, 1995, a modest smoking regulation was enacted prohibiting smoking in all enclosed public places; restaurants were allowed to designate up to 50% of their seating capacity as smoking areas; on July 20, 2000 the law was modified to increase penalties for violations; on April 3, 2003, a revised regulation prohibited smoking in all restaurants and at most worksites; however, to come into compliance, the regulation allowed several businesses an exemption until January 1, 2004; the likelihood of hospital admissions for Acute coronary syndrome was significantly lower among nonsmokers, people without diabetes, and women; incidence of hospital admissions for Acute coronary syndrome decreased significantly by 6% per year (CI 4–8%) throughout the study; among male smokers, there was a significant decline in time trend (7%; 0.4%, 12%) in admission rates after 2004; smoking rate decreased from 32% to 24% from 2002 to 2008, a nonsignificant change; in conjunction with steady tobacco sales, authors dismiss the notion that changes in Acute coronary syndrome can be attributed to a decline in smoking
Surgeon General’s R
eport
A-22 Chapter 8 Tables Supplem
ent
Table 8.6S Detailed description of studies on smokefree laws and coronary events—Part F: ACE (acute coronary events)–workplace, restaurant, and bar laws
Study Design/populationPre/postduration (months) Measure/statistical method Findings (95% CI) Comments
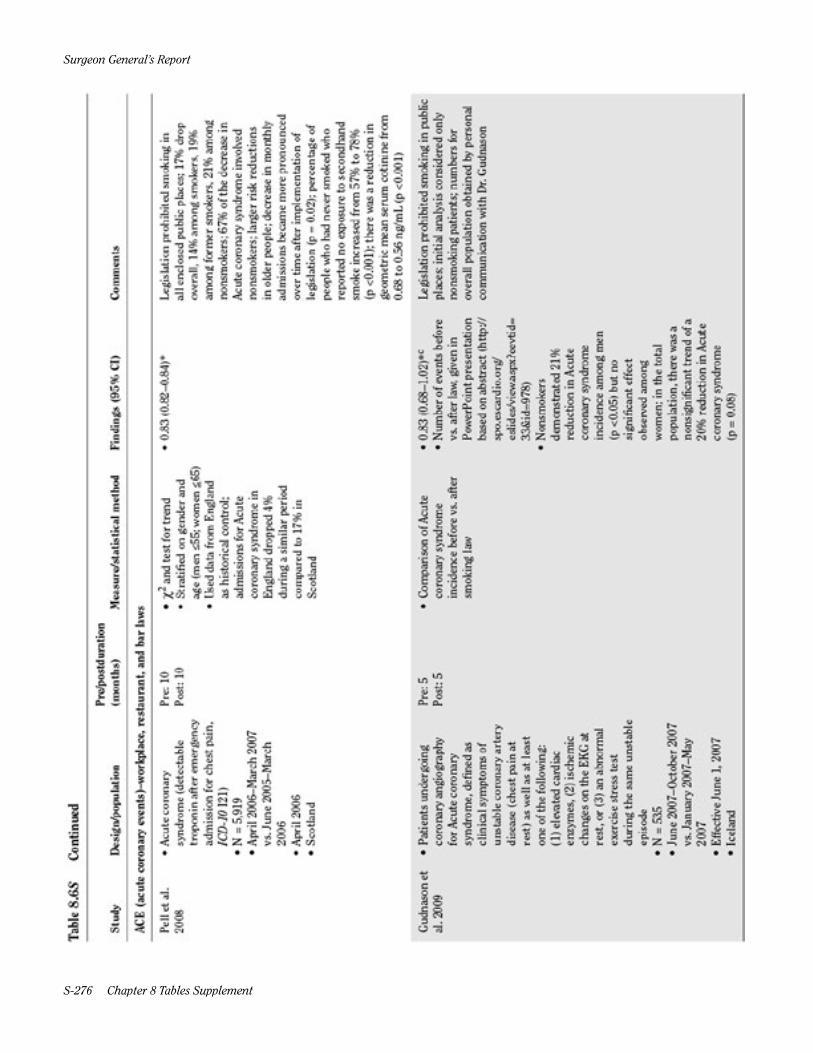
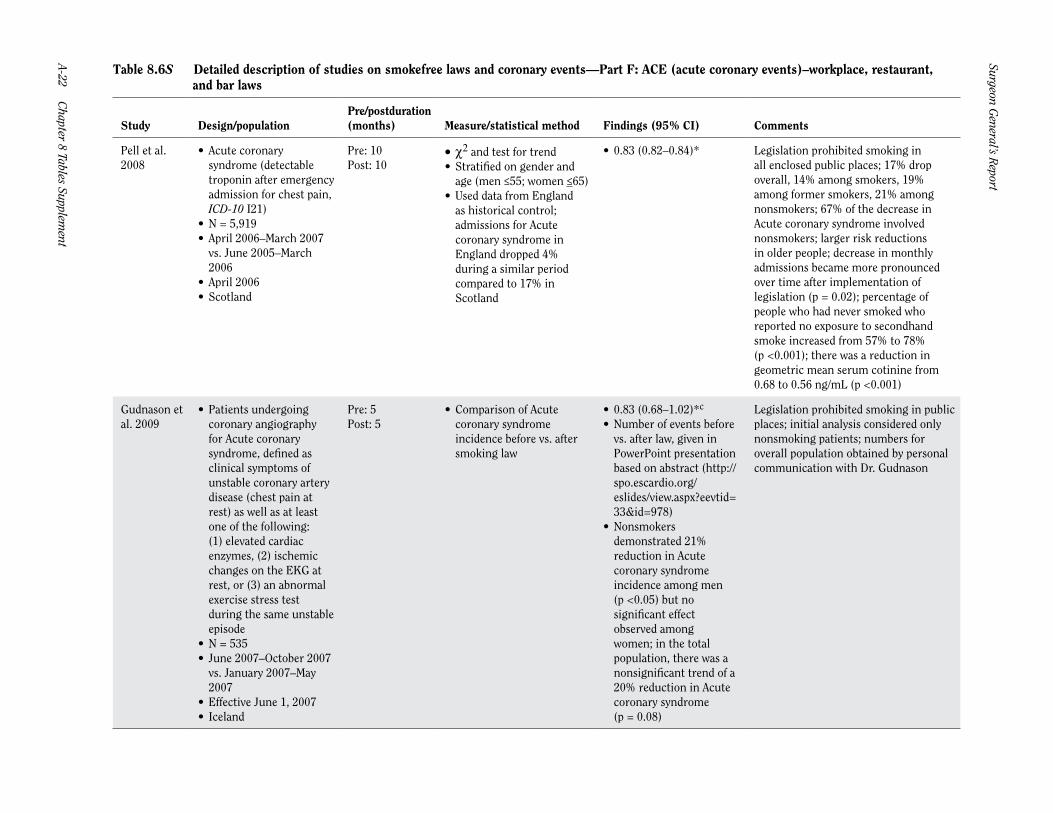
Pell et al. 2008
• Acute coronarysyndrome (detectabletroponin after emergencyadmission for chest pain,ICD-10 I21)
• N = 5,919• April 2006–March 2007
vs. June 2005–March2006
• April 2006• Scotland
Pre: 10Post: 10
• c2 and test for trend• Stratified on gender and
age (men ≤55; women ≤65)• Used data from England
as historical control;admissions for Acutecoronary syndrome inEngland dropped 4%during a similar periodcompared to 17% inScotland
• 0.83 (0.82–0.84)* Legislation prohibited smoking in all enclosed public places; 17% drop overall, 14% among smokers, 19% among former smokers, 21% among nonsmokers; 67% of the decrease in Acute coronary syndrome involved nonsmokers; larger risk reductions in older people; decrease in monthly admissions became more pronounced over time after implementation of legislation (p = 0.02); percentage of people who had never smoked who reported no exposure to secondhand smoke increased from 57% to 78% (p <0.001); there was a reduction in geometric mean serum cotinine from 0.68 to 0.56 ng/mL (p <0.001)
Gudnason et al. 2009
• Patients undergoingcoronary angiographyfor Acute coronarysyndrome, defined asclinical symptoms ofunstable coronary arterydisease (chest pain atrest) as well as at leastone of the following:(1) elevated cardiacenzymes, (2) ischemicchanges on the EKG atrest, or (3) an abnormalexercise stress testduring the same unstableepisode
• N = 535• June 2007–October 2007
vs. January 2007–May2007
• Effective June 1, 2007• Iceland
Pre: 5Post: 5
• Comparison of Acutecoronary syndromeincidence before vs. aftersmoking law
• 0.83 (0.68–1.02)*c
• Number of events beforevs. after law, given inPowerPoint presentationbased on abstract (http://spo.escardio.org/eslides/view.aspx?eevtid=33&id=978)
• Nonsmokersdemonstrated 21%reduction in Acutecoronary syndromeincidence among men(p <0.05) but nosignificant effectobserved amongwomen; in the totalpopulation, there was anonsignificant trend of a20% reduction in Acutecoronary syndrome(p = 0.08)
Legislation prohibited smoking in public places; initial analysis considered only nonsmoking patients; numbers for overall population obtained by personal communication with Dr. Gudnason
Cardiovascular D
iseases A-23
The Health C
onsequences of Smoking —
50 Years of Progress
Table 8.6S Part F—Continued
Study Design/populationPre/postduration (months) Measure/statistical method Findings (95% CI) Comments
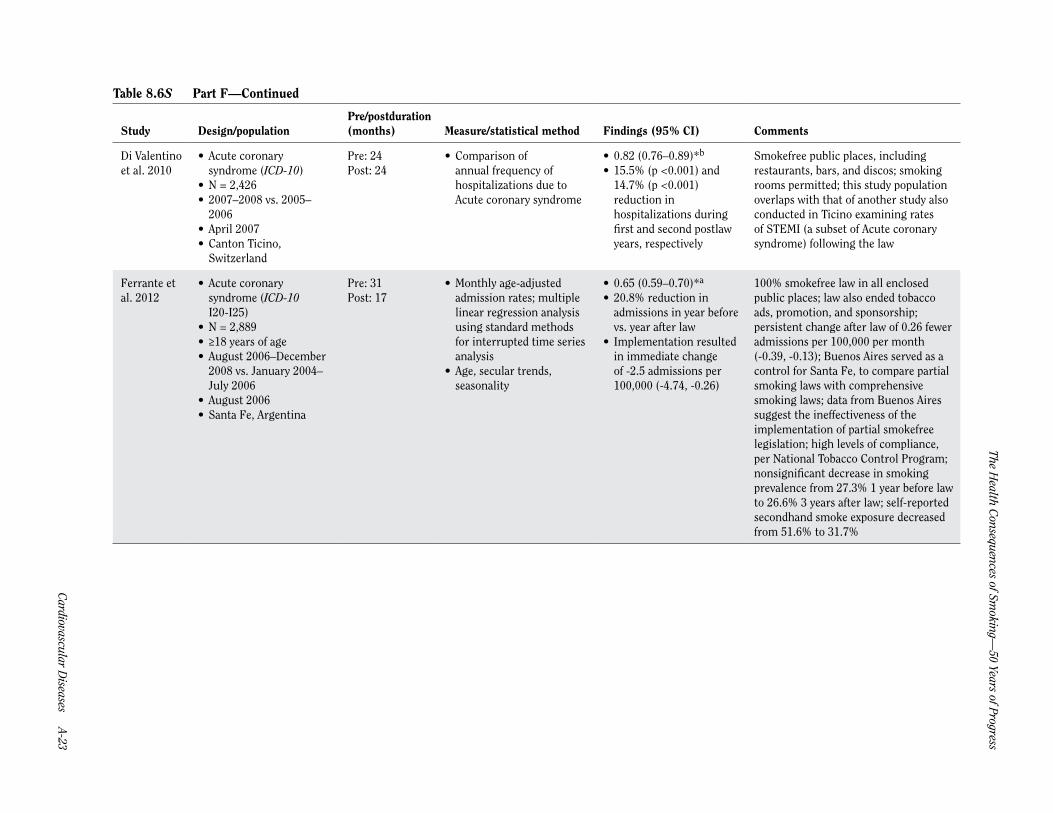
Di Valentino et al. 2010
• Acute coronarysyndrome (ICD-10)
• N = 2,426• 2007–2008 vs. 2005–
2006• April 2007• Canton Ticino,
Switzerland
Pre: 24Post: 24
• Comparison ofannual frequency ofhospitalizations due toAcute coronary syndrome
• 0.82 (0.76–0.89)*b
• 15.5% (p <0.001) and14.7% (p <0.001)reduction inhospitalizations duringfirst and second postlawyears, respectively
Smokefree public places, including restaurants, bars, and discos; smoking rooms permitted; this study population overlaps with that of another study also conducted in Ticino examining rates of STEMI (a subset of Acute coronary syndrome) following the law
Ferrante et al. 2012
• Acute coronarysyndrome (ICD-10I20-I25)
• N = 2,889• ≥18 years of age• August 2006–December
2008 vs. January 2004–July 2006
• August 2006• Santa Fe, Argentina
Pre: 31Post: 17
• Monthly age-adjustedadmission rates; multiplelinear regression analysisusing standard methodsfor interrupted time seriesanalysis
• Age, secular trends,seasonality
• 0.65 (0.59–0.70)*a
• 20.8% reduction inadmissions in year beforevs. year after law
• Implementation resultedin immediate changeof -2.5 admissions per100,000 (-4.74, -0.26)
100% smokefree law in all enclosed public places; law also ended tobacco ads, promotion, and sponsorship; persistent change after law of 0.26 fewer admissions per 100,000 per month (-0.39, -0.13); Buenos Aires served as a control for Santa Fe, to compare partial smoking laws with comprehensive smoking laws; data from Buenos Aires suggest the ineffectiveness of the implementation of partial smokefree legislation; high levels of compliance, per National Tobacco Control Program; nonsignificant decrease in smoking prevalence from 27.3% 1 year before law to 26.6% 3 years after law; self-reported secondhand smoke exposure decreased from 51.6% to 31.7%
Surgeon General’s R
eport
A-24 Chapter 8 Tables Supplem
ent
Table 8.6S Detailed description of studies on smokefree laws and coronary events—Part G: ACE (acute coronary events)–workplace, restaurant, and bar laws
Study Design/populationPre/postduration (months) Measure/statistical method Findings (95% CI) Comments
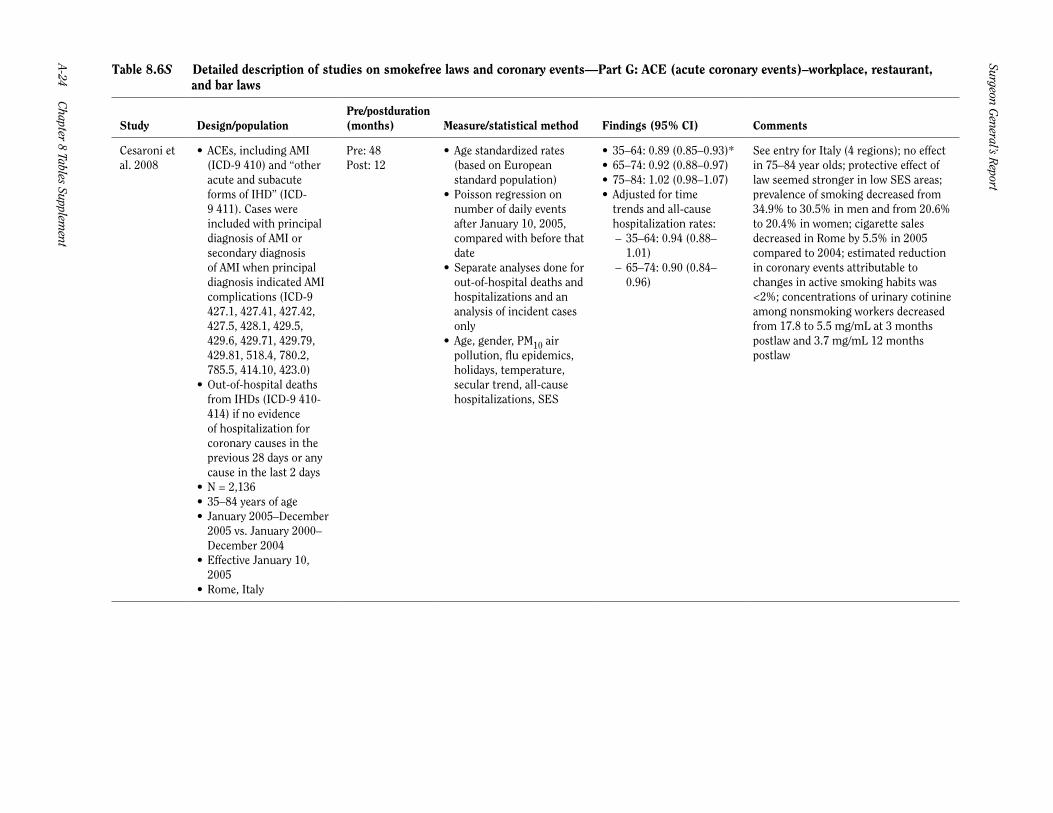
Cesaroni et al. 2008
• ACEs, including AMI(ICD-9 410) and “otheracute and subacuteforms of IHD” (ICD-9 411). Cases wereincluded with principaldiagnosis of AMI orsecondary diagnosisof AMI when principaldiagnosis indicated AMIcomplications (ICD-9427.1, 427.41, 427.42,427.5, 428.1, 429.5,429.6, 429.71, 429.79,429.81, 518.4, 780.2,785.5, 414.10, 423.0)
• Out-of-hospital deathsfrom IHDs (ICD-9 410-414) if no evidenceof hospitalization forcoronary causes in theprevious 28 days or anycause in the last 2 days
• N = 2,136• 35–84 years of age• January 2005–December
2005 vs. January 2000–December 2004
• Effective January 10,2005
• Rome, Italy
Pre: 48Post: 12
• Age standardized rates(based on Europeanstandard population)
• Poisson regression onnumber of daily eventsafter January 10, 2005,compared with before thatdate
• Separate analyses done forout-of-hospital deaths andhospitalizations and ananalysis of incident casesonly
• Age, gender, PM10 airpollution, flu epidemics,holidays, temperature,secular trend, all-causehospitalizations, SES
• 35–64: 0.89 (0.85–0.93)*• 65–74: 0.92 (0.88–0.97)• 75–84: 1.02 (0.98–1.07)• Adjusted for time
trends and all-causehospitalization rates:
– 35–64: 0.94 (0.88–1.01)
– 65–74: 0.90 (0.84–0.96)
See entry for Italy (4 regions); no effect in 75–84 year olds; protective effect of law seemed stronger in low SES areas; prevalence of smoking decreased from 34.9% to 30.5% in men and from 20.6% to 20.4% in women; cigarette sales decreased in Rome by 5.5% in 2005 compared to 2004; estimated reduction in coronary events attributable to changes in active smoking habits was <2%; concentrations of urinary cotinine among nonsmoking workers decreased from 17.8 to 5.5 mg/mL at 3 months postlaw and 3.7 mg/mL 12 months postlaw

Cardiovascular D
iseases A-25
The Health C
onsequences of Smoking —
50 Years of Progress
Table 8.6S Part G—Continued
Study Design/populationPre/postduration (months) Measure/statistical method Findings (95% CI) Comments
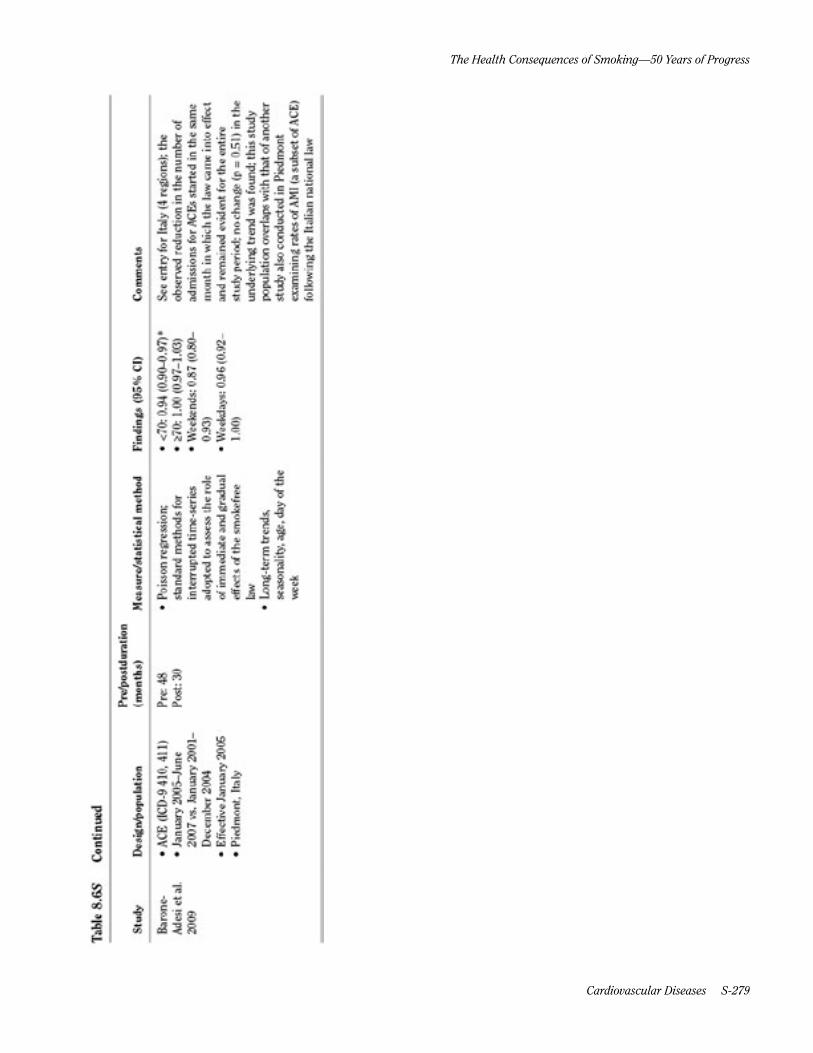
Barone-Adesi et al. 2009
• ACE (ICD-9 410, 411)• January 2005–June
2007 vs. January 2001–December 2004
• Effective January 2005• Piedmont, Italy
Pre: 48Post: 30
• Poisson regression;standard methods forinterrupted time-seriesadopted to assess the roleof immediate and gradualeffects of the smokefreelaw
• Long-term trends,seasonality, age, day of theweek
• <70: 0.94 (0.90–0.97)*• ≥70: 1.00 (0.97–1.03)• Weekends: 0.87 (0.80–
0.93)• Weekdays: 0.96 (0.92–
1.00)
See entry for Italy (4 regions); the observed reduction in the number of admissions for ACEs started in the same month in which the law came into effect and remained evident for the entire study period; no change (p = 0.51) in the underlying trend was found; this study population overlaps with that of another study also conducted in Piedmont examining rates of AMI (a subset of ACE) following the Italian national law
Surgeon General’s R
eport
A-26 Chapter 8 Tables Supplem
ent
Table 8.6S Detailed description of studies on smokefree laws and coronary events—Part H: CHD–workplace, restaurant, and bar laws
Study Design/populationPre/postduration (months) Measure/statistical method Findings (95% CI) Comments
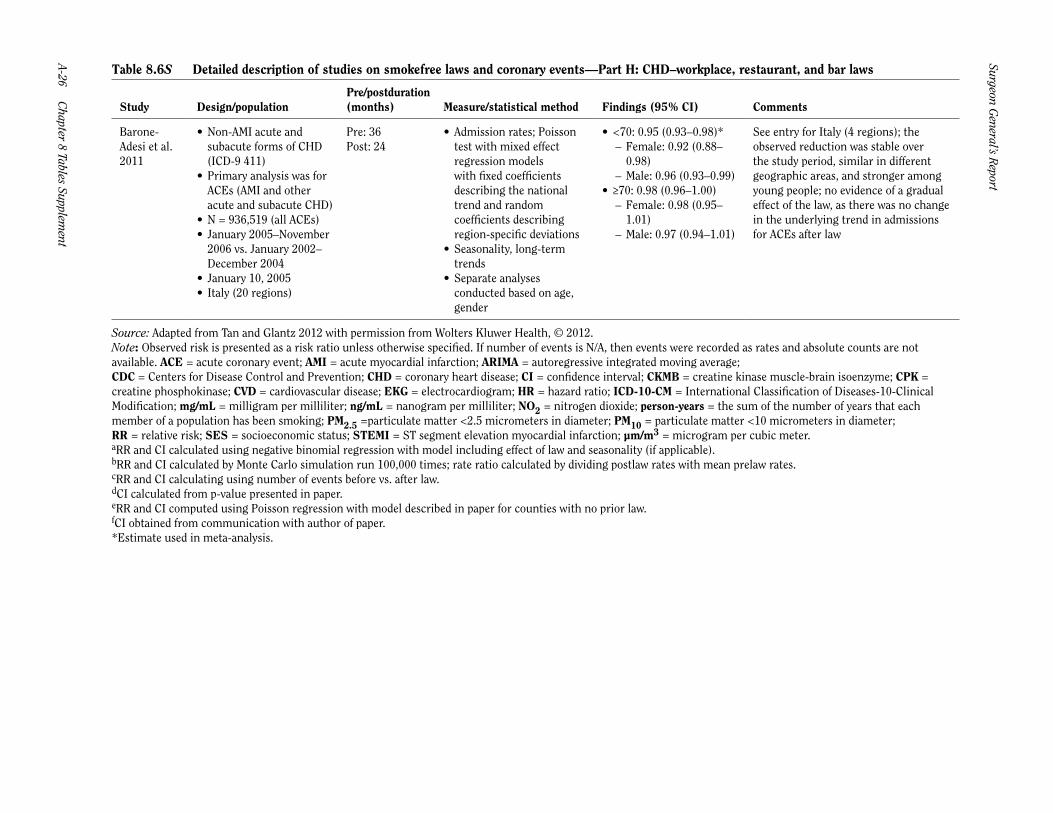
Barone-Adesi et al. 2011
• Non-AMI acute andsubacute forms of CHD(ICD-9 411)
• Primary analysis was forACEs (AMI and otheracute and subacute CHD)
• N = 936,519 (all ACEs)• January 2005–November
2006 vs. January 2002–December 2004
• January 10, 2005• Italy (20 regions)
Pre: 36Post: 24
• Admission rates; Poissontest with mixed effectregression modelswith fixed coefficientsdescribing the nationaltrend and randomcoefficients describingregion-specific deviations
• Seasonality, long-termtrends
• Separate analysesconducted based on age,gender
• <70: 0.95 (0.93–0.98)* – Female: 0.92 (0.88–0.98)
– Male: 0.96 (0.93–0.99)• ≥70: 0.98 (0.96–1.00)
– Female: 0.98 (0.95–1.01)
– Male: 0.97 (0.94–1.01)
See entry for Italy (4 regions); the observed reduction was stable over the study period, similar in different geographic areas, and stronger among young people; no evidence of a gradual effect of the law, as there was no change in the underlying trend in admissions for ACEs after law
Source: Adapted from Tan and Glantz 2012 with permission from Wolters Kluwer Health, © 2012.Note: Observed risk is presented as a risk ratio unless otherwise specified. If number of events is N/A, then events were recorded as rates and absolute counts are not available. ACE = acute coronary event; AMI = acute myocardial infarction; ARIMA = autoregressive integrated moving average; CDC = Centers for Disease Control and Prevention; CHD = coronary heart disease; CI = confidence interval; CKMB = creatine kinase muscle-brain isoenzyme; CPK = creatine phosphokinase; CVD = cardiovascular disease; EKG = electrocardiogram; HR = hazard ratio; ICD-10-CM = International Classification of Diseases-10-Clinical Modification; mg/mL = milligram per milliliter; ng/mL = nanogram per milliliter; NO2 = nitrogen dioxide; person-years = the sum of the number of years that eachmember of a population has been smoking; PM2.5 =particulate matter <2.5 micrometers in diameter; PM10 = particulate matter <10 micrometers in diameter;RR = relative risk; SES = socioeconomic status; STEMI = ST segment elevation myocardial infarction; µm/m3 = microgram per cubic meter.aRR and CI calculated using negative binomial regression with model including effect of law and seasonality (if applicable).bRR and CI calculated by Monte Carlo simulation run 100,000 times; rate ratio calculated by dividing postlaw rates with mean prelaw rates.cRR and CI calculating using number of events before vs. after law.dCI calculated from p-value presented in paper.eRR and CI computed using Poisson regression with model described in paper for counties with no prior law.fCI obtained from communication with author of paper.*Estimate used in meta-analysis.

Cardiovascular D
iseases A-27
The Health C
onsequences of Smoking —
50 Years of Progress
Table 8.7S Detailed description of studies on smokefree laws and cerebrovascular accidents —Part A: Stroke–workplace only laws
Study Design/populationPre/postduration (months) Measure/statistical method Findings (95% CI) Comments
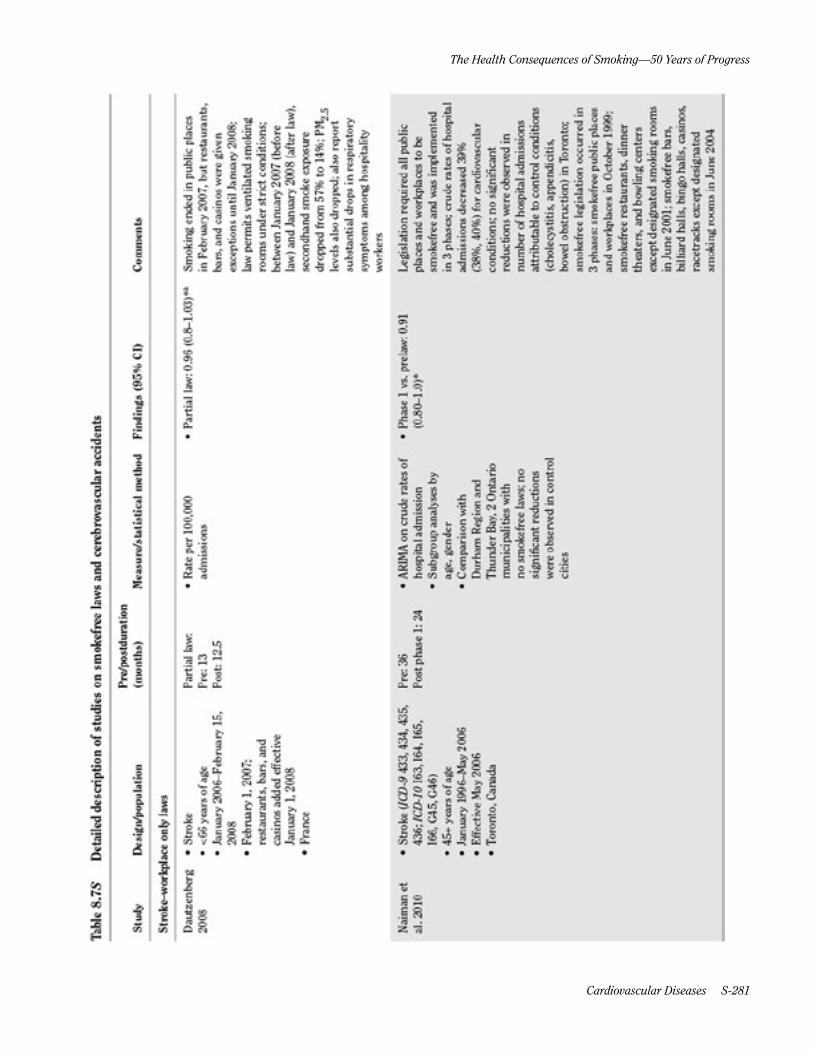
Dautzenberg 2008
• Stroke• <66 years of age• January 2006–February 15,
2008• February 1, 2007;
restaurants, bars, and casinos added effective January 1, 2008
• France
Partial law:Pre: 13Post: 12.5
• Rate per 100,000admissions
• Partial law: 0.96 (0.8–1.03)*a Smoking ended in public placesin February 2007, but restaurants, bars, and casinos were given exceptions until January 2008; law permits ventilated smoking rooms under strict conditions; between January 2007 (before law) and January 2008 (after law), secondhand smoke exposure dropped from 57% to 14%; PM2.5 levels also dropped; also report substantial drops in respiratory symptoms among hospitality workers
Naiman et al. 2010
• Stroke (ICD-9 433, 434, 435,436; ICD-10 I63, I64, I65,I66, G45, G46)
• 45+ years of age• January 1996–May 2006• Effective May 2006• Toronto, Canada
Pre: 36Post phase 1: 24
• ARIMA on crude rates ofhospital admission
• Subgroup analyses byage, gender
• Comparison withDurham Region andThunder Bay, 2 Ontariomunicipalities withno smokefree laws; nosignificant reductionswere observed in controlcities
• Phase 1 vs. prelaw: 0.91(0.80–1.0)*
Legislation required all public places and workplaces to be smokefree and was implemented in 3 phases; crude rates of hospital admissions decreased 39% (38%, 40%) for cardiovascular conditions; no significant reductions were observed in number of hospital admissions attributable to control conditions (cholecystitis, appendicitis, bowel obstruction) in Toronto; smokefree legislation occurred in 3 phases: smokefree public places and workplaces in October 1999; smokefree restaurants, dinner theaters, and bowling centers except designated smoking rooms in June 2001; smokefree bars, billiard halls, bingo halls, casinos, racetracks except designated smoking rooms in June 2004

Surgeon General’s R
eport
A-28 Chapter 8 Tables Supplem
ent
Table 8.7S Detailed description of studies on smokefree laws and cerebrovascular accidents—Part B: Stroke–workplace and restaurant laws
Study Design/populationPre/postduration (months) Measure/statistical method Findings (95% CI) Comments
Naiman et al. 2010
• Stroke (ICD-9 433, 434, 435,436; ICD-10 I63, I64, I65,I66, G45, G46)
• ≥45 years of age• January 1996–May 2006• Effective May 2006• Toronto, Canada
Pre: 36Post phase 2: 36; not included in length of follow-up analysis because the prelaw period did not immediately precede the postlaw phase
• ARIMA on crude rates ofhospital admission
• Subgroup analyses byage, gender
• Comparison withDurham Region andThunder Bay, 2 Ontariomunicipalities withno smokefree laws; nosignificant reductionswere observed in controlcities
• Phase 2 vs. pre: 0.76 (0.68–0.85)*
Legislation required all public places and workplaces to be smokefree and was implemented in 3 phases; crude rates of hospital admissions decreased 39% (38%, 40%) for cardiovascular conditions; no significant reductions were observed in number of hospital admissions attributable to control conditions (cholecystitis, appendicitis, bowel obstruction) in Toronto; smokefree legislation occurred in 3 phases: smokefree public places and workplaces in October 1999; smokefree restaurants, dinner theaters, and bowling centers except designated smoking rooms in June 2001; smokefree bars, billiard halls, bingo halls, casinos, racetracks except designated smoking rooms in June 2004
Cardiovascular D
iseases A-29
The Health C
onsequences of Smoking —
50 Years of Progress
Table 8.7S Detailed description of studies on smokefree laws and cerebrovascular accidents—Part C: Stroke–workplace, restaurant, and bar laws
Study Design/populationPre/postduration (months) Measure/statistical method Findings (95% CI) Comments
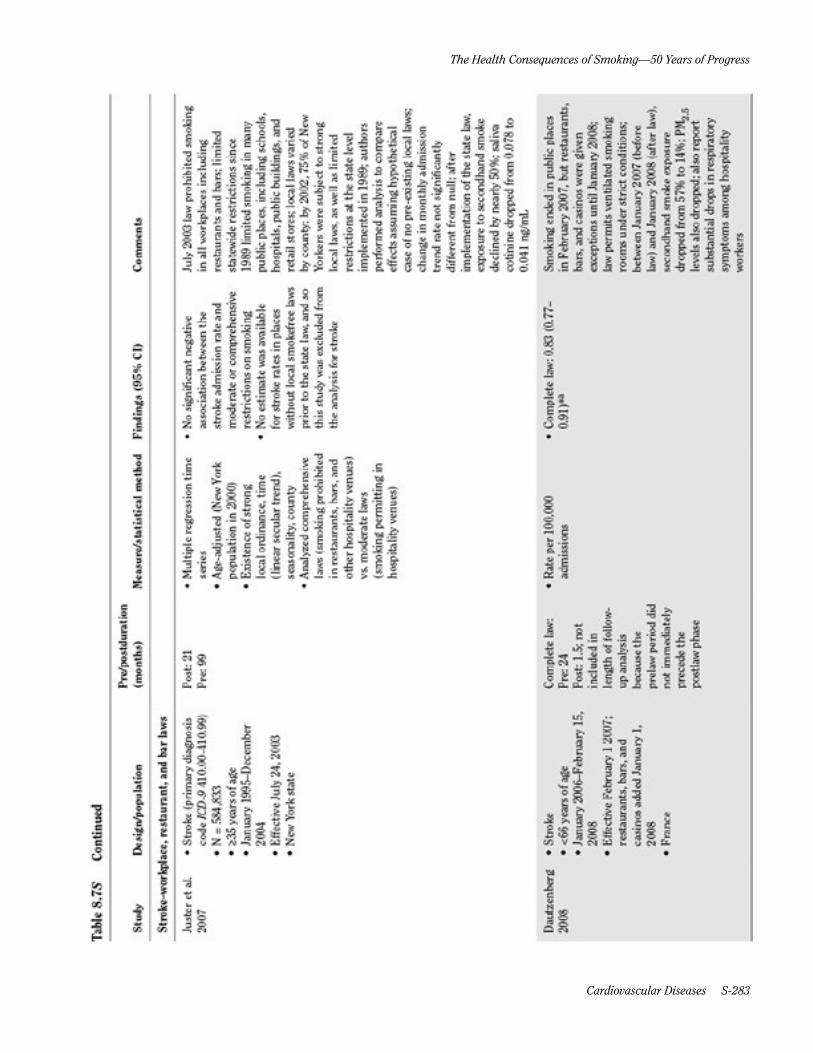
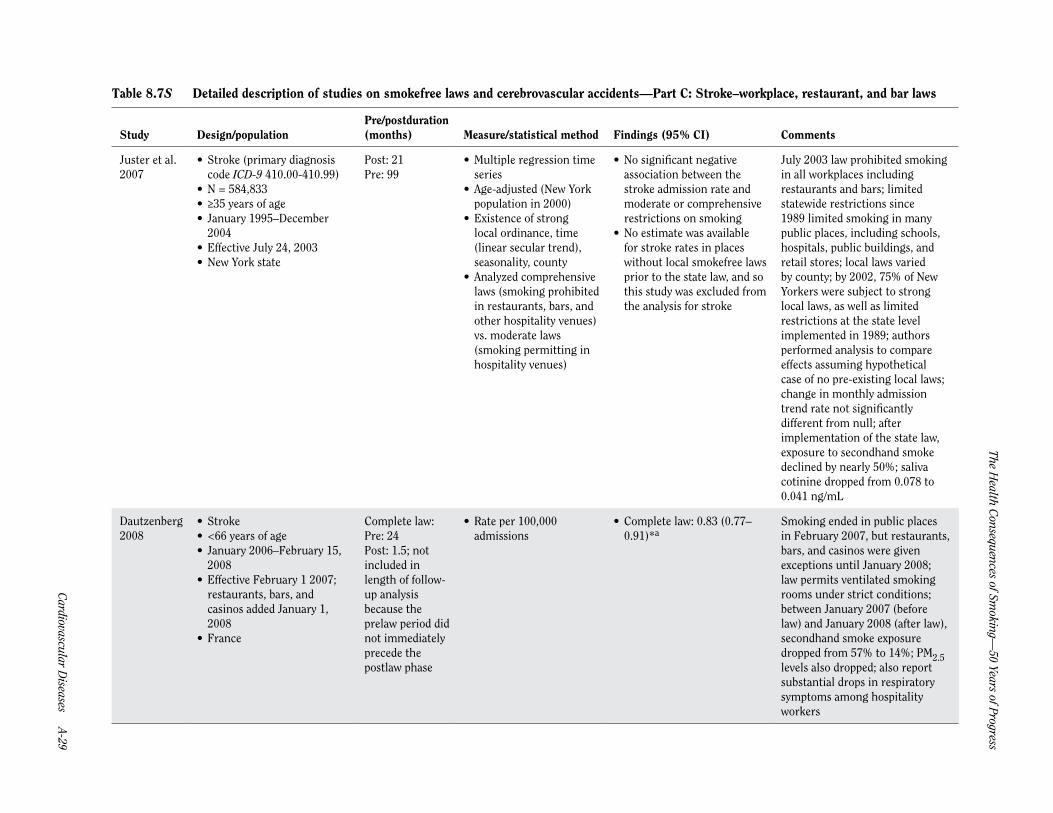
Juster et al. 2007
• Stroke (primary diagnosiscode ICD-9 410.00-410.99)
• N = 584,833• ≥35 years of age• January 1995–December
2004• Effective July 24, 2003• New York state
Post: 21Pre: 99
• Multiple regression timeseries
• Age-adjusted (New Yorkpopulation in 2000)
• Existence of stronglocal ordinance, time(linear secular trend),seasonality, county
• Analyzed comprehensivelaws (smoking prohibitedin restaurants, bars, andother hospitality venues)vs. moderate laws(smoking permitting inhospitality venues)
• No significant negativeassociation between thestroke admission rate andmoderate or comprehensiverestrictions on smoking
• No estimate was availablefor stroke rates in placeswithout local smokefree lawsprior to the state law, and sothis study was excluded fromthe analysis for stroke
July 2003 law prohibited smoking in all workplaces including restaurants and bars; limited statewide restrictions since 1989 limited smoking in many public places, including schools, hospitals, public buildings, and retail stores; local laws varied by county; by 2002, 75% of New Yorkers were subject to strong local laws, as well as limited restrictions at the state level implemented in 1989; authors performed analysis to compare effects assuming hypothetical case of no pre-existing local laws; change in monthly admission trend rate not significantly different from null; after implementation of the state law, exposure to secondhand smoke declined by nearly 50%; saliva cotinine dropped from 0.078 to 0.041 ng/mL
Dautzenberg 2008
• Stroke• <66 years of age• January 2006–February 15,
2008• Effective February 1 2007;
restaurants, bars, and casinos added January 1, 2008
• France
Complete law: Pre: 24Post: 1.5; not included in length of follow-up analysis because the prelaw period did not immediately precede the postlaw phase
• Rate per 100,000admissions
• Complete law: 0.83 (0.77–0.91)*a
Smoking ended in public places in February 2007, but restaurants, bars, and casinos were given exceptions until January 2008; law permits ventilated smoking rooms under strict conditions; between January 2007 (before law) and January 2008 (after law), secondhand smoke exposure dropped from 57% to 14%; PM2.5 levels also dropped; also report substantial drops in respiratory symptoms among hospitality workers

Surgeon General’s R
eport
A-30 Chapter 8 Tables Supplem
ent
Table 8.7S Part C—Continued
Study Design/populationPre/postduration (months) Measure/statistical method Findings (95% CI) Comments
Naiman et al. 2010
• Stroke (ICD-9 433, 434, 435,436; ICD-10 I63, I64, I65,I66, G45, G46)
• ≥45 years of age• January 1996–May 2006• Effective May 2006• Toronto, Canada
Pre: 36Post phase 3: 36; not included in length of follow-up analysis because the prelaw period did not immediately precede the postlaw phase
• ARIMA on crude rates ofhospital admission
• Subgroup analyses byage, gender
• Comparison withDurham Region andThunder Bay, 2 Ontariomunicipalities withno smokefree laws; nosignificant reductionswere observed in controlcities
• Phase 3 vs. pre: 0.63 (0.56–0.71)*b
Legislation required all public places and workplaces to be smokefree and was implemented in 3 phases; crude rates of hospital admissions decreased 39% (38%, 40%) for cardiovascular conditions; no significant reductions were observed in number of hospital admissions attributable to control conditions (cholecystitis, appendicitis, bowel obstruction) in Toronto; smokefree legislation occurred in 3 phases: smokefree public places and workplaces in October 1999; smokefree restaurants, dinner theaters, and bowling centers except designated smoking rooms in June 2001; smokefree bars, billiard halls, bingo halls, casinos, racetracks except designated smoking rooms in June 2004
Herman et al. 2011
• Acute stroke (ICD-9 430-434.xx, 436.xx, 437.1x)
• N = 6,018 (counties withoutprevious laws)
• May 2007–May 2008 vs.January 2004–April 2007
• Effective May 1, 2007• Arizona
Pre: 40Post: 13
• Rate of admissions per100,000 annually
• Poisson regression• Seasonality, population,
annual linear trend• Separate analyses for
counties with preexistingsmokefree laws vs. thosewithout such laws
• 0.86 (0.79–0.96)*c Law ended smoking in all enclosed workplaces, including bars and restaurants; cost-savings analysis estimates $16.8 million in savings for AMI, unstable angina, acute stroke, and acute asthma in 13 months after law in non-law counties ($4.9 million for acute stroke alone); no change in rates of control diseases (acute appendicitis, kidney stones, acute cholecystitis, and ulcers) pre- and postlaw
Cardiovascular D
iseases A-31
The Health C
onsequences of Smoking —
50 Years of Progress
Table 8.7S Part C—Continued
Study Design/populationPre/postduration (months) Measure/statistical method Findings (95% CI) Comments
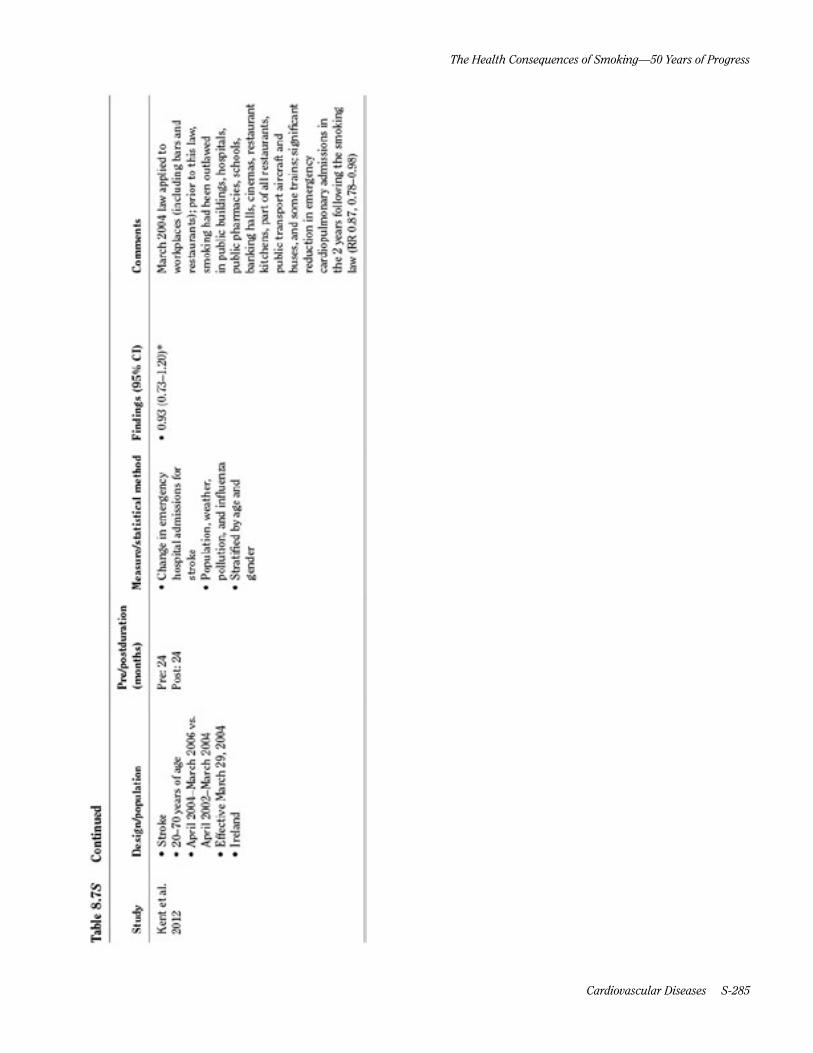
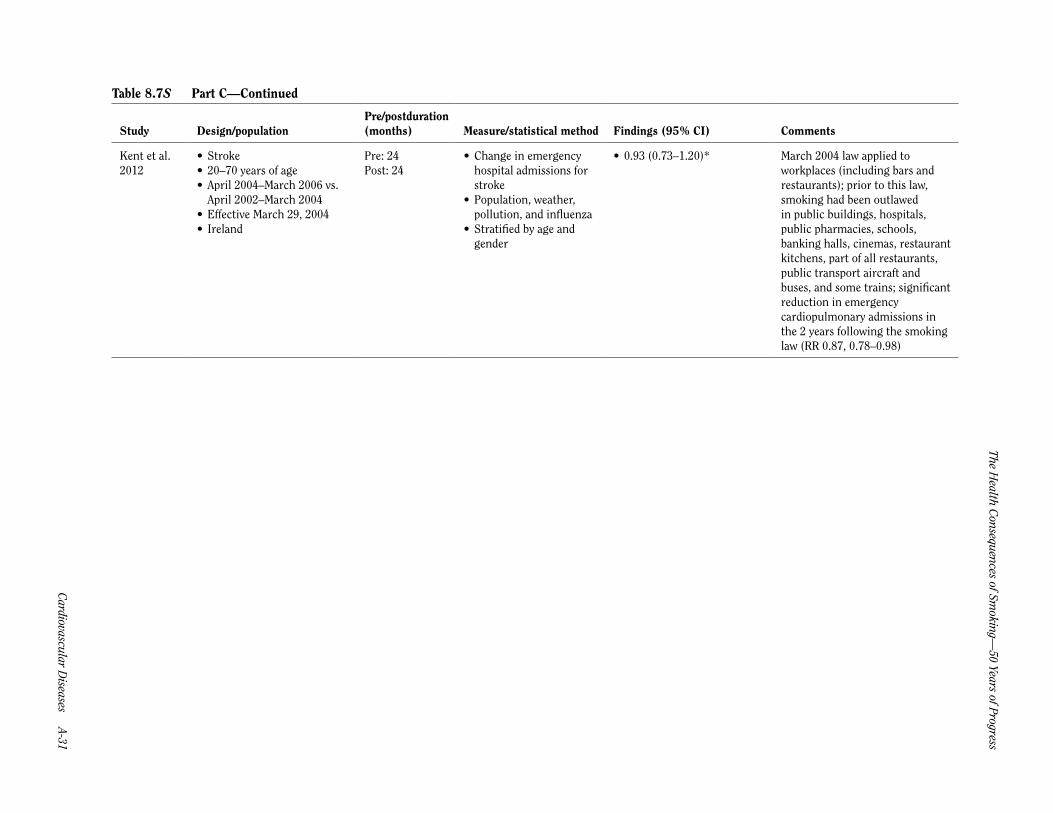
Kent et al. 2012
• Stroke• 20–70 years of age• April 2004–March 2006 vs.
April 2002–March 2004• Effective March 29, 2004• Ireland
Pre: 24Post: 24
• Change in emergencyhospital admissions forstroke
• Population, weather,pollution, and influenza
• Stratified by age andgender
• 0.93 (0.73–1.20)* March 2004 law applied to workplaces (including bars and restaurants); prior to this law, smoking had been outlawed in public buildings, hospitals, public pharmacies, schools, banking halls, cinemas, restaurant kitchens, part of all restaurants, public transport aircraft and buses, and some trains; significant reduction in emergency cardiopulmonary admissions in the 2 years following the smoking law (RR 0.87, 0.78–0.98)

Surgeon General’s R
eport
A-32 Chapter 8 Tables Supplem
ent
Table 8.7S Detailed description of studies on smokefree laws and cerebrovascular accidents—Part D: TIA–workplace, restaurant, and bar laws
Study Design/populationPre/postduration (months) Measure/statistical method Findings (95% CI) Comments
• TIA• 20–70
years ofage
• April2004–March2006 vs.April2002–March2004
• EffectiveMarch 29, 2004
• Ireland
Pre: 24Post: 24
• Change inemergencyhospitaladmissionsfor transientischemicattack
• Population,weather,pollution, andinfluenza
• Stratified byage and gender
• 1.00 (0.70–1.42)* March 2004 law applied to workplaces (including bars and restaurants); prior to this law, smoking had been outlawed in public buildings, hospitals, public pharmacies, schools, lawking halls, cinemas, restaurant kitchens, part of all restaurants, public transport aircraft and buses, and some trains; significant reduction in emergency cardiopulmonary admissions in the 2 years following the smoking law (RR 0.87, 0.78–0.98)
March 2004 law applied to workplaces (including bars and restaurants); prior to this law, smoking had been outlawed in public buildings, hospitals, public pharmacies, schools, banking halls, cinemas, restaurant kitchens, part of all restaurants, public transport aircraft and buses, and some trains; significant reduction in emergency cardiopulmonary admissions in the 2 years following the smoking law (RR 0.87, 0.78–0.98)
Source: Tan and Glantz 2012.Note: Observed risk is presented as a risk ratio unless otherwise specified. If number of events is N/A, then events were recorded as rates and absolute counts are not available. AMI = acute myocardial infarction; ARIMA = autoregressive integrated moving-average; CI = confidence interval; ICD = International Classification of Diseases; PM2.5 = particulate matter <2.5 micrometers in diameter; RR = relative risk; TIA = transient ischemic attack.aRR and CI calculated using negative binomial regression with model including effect of law and seasonality (if applicable)bRR and CI calculated using number of events before vs. after lawcRR and CI computed using Poisson regression with model described in paper for counties with no prior law*Estimate used in meta-analysis.
Cardiovascular D
iseases A-33
The Health C
onsequences of Smoking —
50 Years of Progress
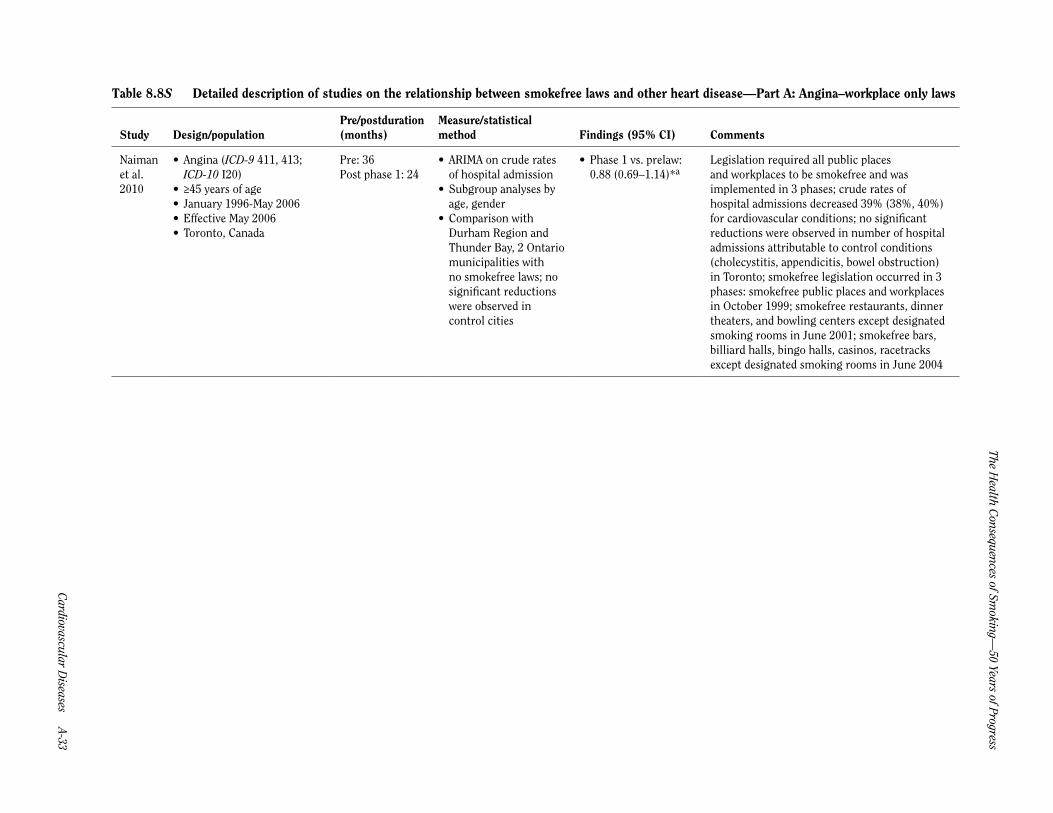
Table 8.8S Detailed description of studies on the relationship between smokefree laws and other heart disease —Part A: Angina–workplace only laws
Study Design/populationPre/postduration (months)
Measure/statistical method Findings (95% CI) Comments
Naiman et al. 2010
• Angina (ICD-9 411, 413;ICD-10 I20)
• ≥45 years of age• January 1996-May 2006• Effective May 2006• Toronto, Canada
Pre: 36Post phase 1: 24
• ARIMA on crude ratesof hospital admission
• Subgroup analyses byage, gender
• Comparison withDurham Region andThunder Bay, 2 Ontariomunicipalities withno smokefree laws; nosignificant reductionswere observed incontrol cities
• Phase 1 vs. prelaw:0.88 (0.69–1.14)*a
Legislation required all public places and workplaces to be smokefree and was implemented in 3 phases; crude rates of hospital admissions decreased 39% (38%, 40%) for cardiovascular conditions; no significant reductions were observed in number of hospital admissions attributable to control conditions (cholecystitis, appendicitis, bowel obstruction) in Toronto; smokefree legislation occurred in 3 phases: smokefree public places and workplaces in October 1999; smokefree restaurants, dinner theaters, and bowling centers except designated smoking rooms in June 2001; smokefree bars, billiard halls, bingo halls, casinos, racetracks except designated smoking rooms in June 2004

Surgeon General’s R
eport
A-34 Chapter 8 Tables Supplem
ent
Table 8.8S Detailed description of studies on the relationship between smokefree laws and other heart disease —Part B: Angina–workplace and restaurant laws
Study Design/populationPre/postduration (months)
Measure/statistical method Findings (95% CI) Comments
Naiman et al. 2010
• Angina (ICD-9 411, 413;ICD-10 I20)
• ≥45 years of age• January 1996–May 2006• Effective May 2006• Toronto, Canada
Pre: 36Post phase 2: 36; not included in length of follow-up analysis because the prelaw period did not immediately precede the postlaw phase
• ARIMA on crude ratesof hospital admission
• Subgroup analyses byage, gender
• Comparison withDurham Region andThunder Bay, 2 Ontariomunicipalities withno smokefree laws; nosignificant reductionswere observed incontrol cities
• Phase 2 vs. prelaw:0.65 (0.52–0.82)*a
Legislation required all public places and workplaces to be smokefree and was implemented in 3 phases; crude rates of hospital admissions decreased 39% (38%, 40%) for cardiovascular conditions; no significant reductions were observed in number of hospital admissions attributable to control conditions (cholecystitis, appendicitis, bowel obstruction) in Toronto; smokefree legislation occurred in 3 phases: smokefree public places and workplaces in October 1999; smokefree restaurants, dinner theaters, and bowling centers except designated smoking rooms in June 2001; smokefree bars, billiard halls, bingo halls, casinos, racetracks except designated smoking rooms in June 2004
Sargent et al. 2012
• Stable or unstable anginapectoris (ICD-10 I20.0-I20.9)
• N = 39,224• ≥30 years of age• January 2004–December
2008• Nationwide: effective
September 1, 2007• Statewide: effective date
varies• Germany
Pre: variesPost: 12
• Rate of hospitalizationfor AMI; logisticregression andinterrupted time serieslinear regression model
• Age, gender, occupation
• 0.87 (0.82–0.92)*• In the first year after
implementation,1431 anginahospitalizations wereprevented
Legislation addressed smoking in federal buildings and the transportation system; private employers were allowed to introduce a total or partial smoking law in workplaces; states were permitted to decide how to limit smoking in the hospitality sector (hotels, restaurants, bars); hospitality smoking laws were passed in all states in implemented between August 1, 2007 and July 1, 2008; most states continued to allow smoking in small bars without any food delivery and in separate rooms in large restaurants; a population-based survey revealed a significant decrease in cigarettes smoked in Germany after the law; after the law, there was a significant downward trend, with slope resulting in a decline of 5.33 (7.18, 3.48) hospitalizations per month; hospital admissions for control condition fractures increased slightly from 65,100 in 2007 to 66,954 in 2009; bronchitis cases, which might be affected by smokefree laws, declined from 16,900 in 2007 to 15,391 in 2009; hospitalization costs for angina decreased significantly by 9.6 (2.5, 16.6%), or about €2.5 million

Cardiovascular D
iseases A-35
The Health C
onsequences of Smoking —
50 Years of Progress
Table 8.8S Detailed description of studies on the relationship between smokefree laws and other heart disease —Part C: Angina–workplace,restaurant, and bar laws
Study Design/populationPre/postduration (months)
Measure/statistical method Findings (95% CI) Comments
Naiman et al. 2010
• Unstable angina (ICD9-411.1x)
• N = 670 (counties withoutprevious laws)
• May 2007–May 2008 vs.January 2004–April 2007
• Effective May 1, 2007• Arizona
Pre: 40Post: 13
• Rate of admissions per100,000 annually
• Poisson regression• Seasonality, population,
annual linear trend• Separate analyses
for counties withpreexisting smokefreelaws vs. those withoutsuch laws
• 0.64 (0.46–0.88)*b Law ended smoking in all enclosed workplaces including bars and restaurants; cost-savings analysis estimates $16.8 million in savings for AMI, unstable angina, acute stroke, and acute asthma in 13 months after law in non-law counties ($0.9 million for angina alone); no change in rates of control diseases (acute appendicitis, kidney stones, acute cholecystitis, and ulcers) pre- and postlaw
Naiman et al. 2010
• Angina (ICD-9 411, 413;ICD-10 I20)
• ≥45 years of age• January 1996–May 2006• Effective May 2006• Toronto, Canada
Pre: 36Post phase 3: 36; not included in length of follow-up analysis because the prelaw period did not immediately precede the postlaw phase
• ARIMA on crude ratesof hospital admission
• Subgroup analyses byage, gender
• Comparison withDurham Region andThunder Bay, 2 Ontariomunicipalities withno smokefree laws; nosignificant reductionswere observed incontrol cities
• Phase 3 vs. prelaw:0.38 (0.30–0.48)*a
Legislation required all public places and workplaces to be smokefree and was implemented in 3 phases; crude rates of hospital admissions decreased 39% (38%, 40%) for cardiovascular conditions; no significant reductions were observed in number of hospital admissions attributable to control conditions (cholecystitis, appendicitis, bowel obstruction) in Toronto; smokefree legislation occurred in 3 phases: smokefree public places and workplaces in October 1999; smokefree restaurants, dinner theaters, and bowling centers except designated smoking rooms in June 2001; smokefree bars, billiard halls, bingo halls, casinos, racetracks except designated smoking rooms in June 2004
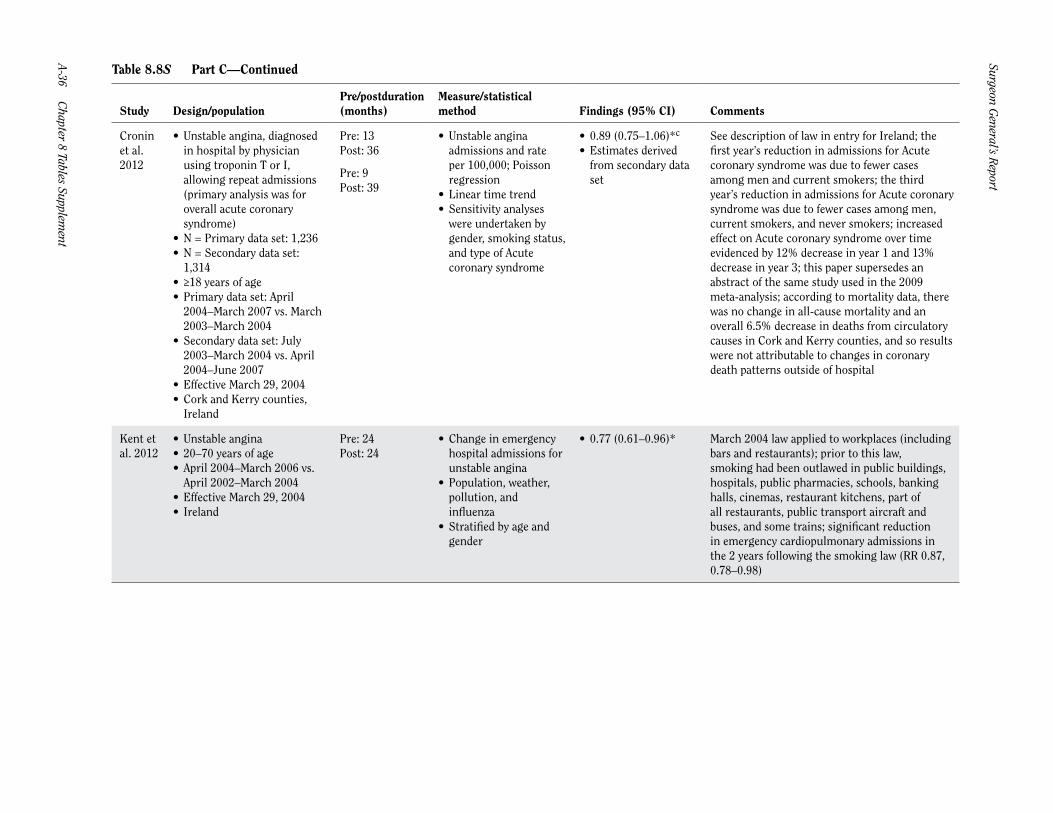
Surgeon General’s R
eport
A-36 Chapter 8 Tables Supplem
ent
Table 8.8S Part C—Continued
Study Design/populationPre/postduration (months)
Measure/statistical method Findings (95% CI) Comments
Cronin et al. 2012
• Unstable angina, diagnosedin hospital by physicianusing troponin T or I,allowing repeat admissions(primary analysis was foroverall acute coronarysyndrome)
• N = Primary data set: 1,236• N = Secondary data set:
1,314• ≥18 years of age• Primary data set: April
2004–March 2007 vs. March2003–March 2004
• Secondary data set: July2003–March 2004 vs. April2004–June 2007
• Effective March 29, 2004• Cork and Kerry counties,
Ireland
Pre: 13Post: 36
Pre: 9Post: 39
• Unstable anginaadmissions and rateper 100,000; Poissonregression
• Linear time trend• Sensitivity analyses
were undertaken bygender, smoking status,and type of Acutecoronary syndrome
• 0.89 (0.75–1.06)*c
• Estimates derivedfrom secondary dataset
See description of law in entry for Ireland; the first year’s reduction in admissions for Acute coronary syndrome was due to fewer cases among men and current smokers; the third year’s reduction in admissions for Acute coronary syndrome was due to fewer cases among men, current smokers, and never smokers; increased effect on Acute coronary syndrome over time evidenced by 12% decrease in year 1 and 13% decrease in year 3; this paper supersedes an abstract of the same study used in the 2009 meta-analysis; according to mortality data, there was no change in all-cause mortality and an overall 6.5% decrease in deaths from circulatory causes in Cork and Kerry counties, and so results were not attributable to changes in coronary death patterns outside of hospital
Kent et al. 2012
• Unstable angina• 20–70 years of age• April 2004–March 2006 vs.
April 2002–March 2004• Effective March 29, 2004• Ireland
Pre: 24Post: 24
• Change in emergencyhospital admissions forunstable angina
• Population, weather,pollution, andinfluenza
• Stratified by age andgender
• 0.77 (0.61–0.96)* March 2004 law applied to workplaces (including bars and restaurants); prior to this law, smoking had been outlawed in public buildings, hospitals, public pharmacies, schools, banking halls, cinemas, restaurant kitchens, part of all restaurants, public transport aircraft and buses, and some trains; significant reduction in emergency cardiopulmonary admissions in the 2 years following the smoking law (RR 0.87, 0.78–0.98)

Cardiovascular D
iseases A-37
The Health C
onsequences of Smoking —
50 Years of Progress
Table 8.8S Detailed description of studies on the relationship between smokefree laws and other heart disease —Part D: CHD–workplace and restaurant laws
Study Design/populationPre/postduration (months)
Measure/statistical method Findings (95% CI) Comments
Khuder et al. 2007
• CHD (ICD-9 410-414, 428)• ≥18 years of age• January 1999–February 2002
vs. March 2002–June 2005• Effective March 2002• Bowling Green, Ohio
Pre: 38Post: 40
• Age-standardized rates• ARIMA• Ordinance effect
assumed to start inOctober 2002
• Comparison withcontrol communityof Kent, Ohio (notcovered by law); nosignificant change inKent
• 12 months postlaw:0.61 (0.55–0.67)
• 40 months postlaw:0.53 (0.45–0.59)*
Smoking was prohibited in all public places within the city, except for bars and restaurants with bars, provided that the bar area was isolated within a separate smoking room; smoking was allowed in bars and bowling alleys at the discretion of the owners; 39% reduction in CHD in 12 months and 47% reduction in 40 months; projected that 17% of reduction may be due to decreased secondhand smoke exposure, while the remaining 21% is due to decreased smoking prevalence and cigarette consumption; no differences in admissions for unspecified nonsmoking related conditions
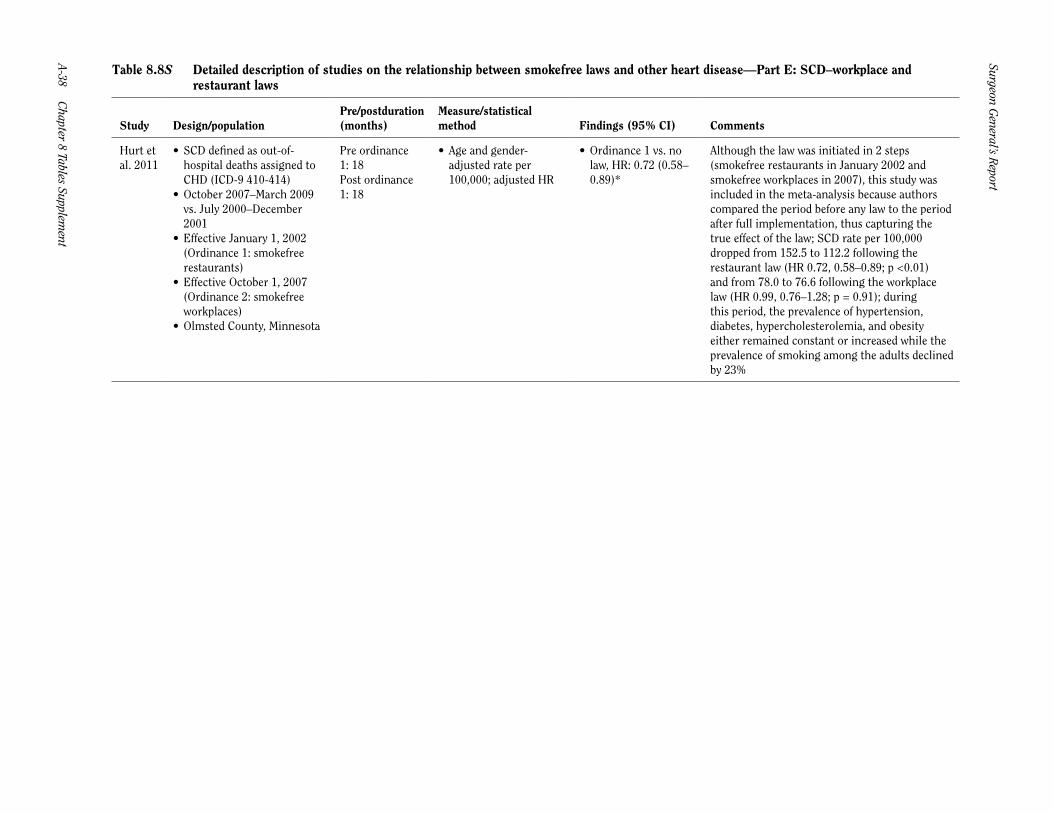
Surgeon General’s R
eport
A-38 Chapter 8 Tables Supplem
ent
Table 8.8S Detailed description of studies on the relationship between smokefree laws and other heart disease —Part E: SCD–workplace and restaurant laws
Study Design/populationPre/postduration (months)
Measure/statistical method Findings (95% CI) Comments
Hurt et al. 2011
• SCD defined as out-of-hospital deaths assigned toCHD (ICD-9 410-414)
• October 2007–March 2009vs. July 2000–December2001
• Effective January 1, 2002(Ordinance 1: smokefree restaurants)
• Effective October 1, 2007(Ordinance 2: smokefree workplaces)
• Olmsted County, Minnesota
Pre ordinance 1: 18Post ordinance 1: 18
• Age and gender-adjusted rate per100,000; adjusted HR
• Ordinance 1 vs. nolaw, HR: 0.72 (0.58–0.89)*
Although the law was initiated in 2 steps (smokefree restaurants in January 2002 and smokefree workplaces in 2007), this study was included in the meta-analysis because authors compared the period before any law to the period after full implementation, thus capturing the true effect of the law; SCD rate per 100,000 dropped from 152.5 to 112.2 following the restaurant law (HR 0.72, 0.58–0.89; p <0.01) and from 78.0 to 76.6 following the workplace law (HR 0.99, 0.76–1.28; p = 0.91); during this period, the prevalence of hypertension, diabetes, hypercholesterolemia, and obesity either remained constant or increased while the prevalence of smoking among the adults declined by 23%

Cardiovascular D
iseases A-39
The Health C
onsequences of Smoking —
50 Years of Progress
Table 8.8S Detailed description of studies on the relationship between smokefree laws and other heart disease —Part F: SCD–workplace, restaurant, and bar laws
Study Design/populationPre/postduration (months)
Measure/statistical method Findings (95% CI) Comments
Hurt et al. 201153
• SCD defined as out-of-hospital deaths assigned toCHD (ICD-9 410-414)
• October 2007–March 2009vs. July 2000–December2001
• Effective January 1, 2002(Ordinance 1: smokefree restaurants)
• Effective October 1, 2007(Ordinance 2: smokefree workplaces)
• Olmsted County, Minnesota
Pre-ordinance 2: 18Post-ordinance 2: 18; not included in length of follow-up analysis because the prelaw period did not immediately precede the postlaw phase
• Age and sex-adjustedrate per 100,000;adjusted HR
• Ordinance 2 vs. nolaw, hazard ratio:0.72 (0.58–0.89)*
Although the law was initiated in 2 steps (smokefree restaurants in January 2002 and smokefree workplaces in 2007), this study was included in the meta-analysis because authors compared the period before any law to the period after full implementation, thus capturing the true effect of the law; SCD rate per 100,000 dropped from 152.5 to 112.2 following the restaurant law (HR 0.72, 0.58–0.89; p <0.01) and from 78.0 to 76.6 following the workplace law (HR 0.99; 0.76–1.28; p = 0.91); during this period, the prevalence of hypertension, diabetes, hypercholesterolemia, and obesity either remained constant or increased while the prevalence of smoking among the adults declined by 23%
Source: Tan and Glantz 2012.Note: Observed risk is presented as a risk ratio unless otherwise specified. If number of events is N/A, then events were recorded as rates and absolute counts are not available. AMI = acute myocardial infarction; ARIMA = autoregressive integrated moving-average; CHD = coronary heart disease; CI = confidence interval; HR = hazard ratio; ICD = International Classification of Diseases; RR = relative risk; SCD = sudden cardiac death.aRR and CI calculated using number of events before vs. after law.bRR and CI computed using Poisson regression with model described in paper for counties with no prior law.cRR and CI calculated using negative binomial regression with model including effect of law and seasonality (if applicable).*Estimate used in meta-analysis.