Chapter 8 Social Stratification: United States and Global Perspectives.
67
Chapter 8 Social Stratification: United States and Global Perspectives
-
Upload
eugenia-singleton -
Category
Documents
-
view
225 -
download
0
Transcript of Chapter 8 Social Stratification: United States and Global Perspectives.
Chapter 8
Social Stratification: United States and Global
Perspectives

Chapter Outline•Social Stratification:
Shipwrecks and Inequality•Patterns of Inequality•Global Inequality•Theories of Stratification•Social Mobility: Theory and
Research •Noneconomic Dimensions of
Class

Social Stratification: Shipwrecks and
Inequality•Writers and filmmakers use the
shipwreck as a literary device.• It allows them to sweep away
all traces of privilege and social convention and reveal human beings stripped to their essentials.
Robinson Crusoe (1719)•Defoe was one of the first writers to portray capitalism favorably.
•He believed that people get rich if they possess the virtues of good businessmen.
•Defoe tells the story of an Englishman marooned on a desert island.
•His strong will, hard work, and inventiveness turn the poor island into a thriving colony.
Swept Away (1975)•A yacht shipwrecks while on a
cruise in the Mediterranean. •The only survivors are a rich
woman and a lowly deckhand.•They fall in love.•When they are rescued and
return home, the woman turns her back on the deckhand, who is once again just a common laborer.

Swept Away (1975)The movie sends three messages:1. It is possible to be rich without
working hard, because one can inherit wealth.
2.One can work hard without becoming rich.
3. Inequality disappears only on the desert island, without society as we know it.
Question
•_______________ refers to the way in which society is organized in layers or strata.
• Social stratification refers to the way in which society is organized in layers or strata.
*

*Economic Inequality in the United States
• In the mid-1990s, the richest 1% owned 39% of national wealth.–The richest 10% owned almost 72%.
–The poorest 40% owned 0.2% percent of all national wealth.
–The bottom 20% had a negative net worth - they owed more than they owned.
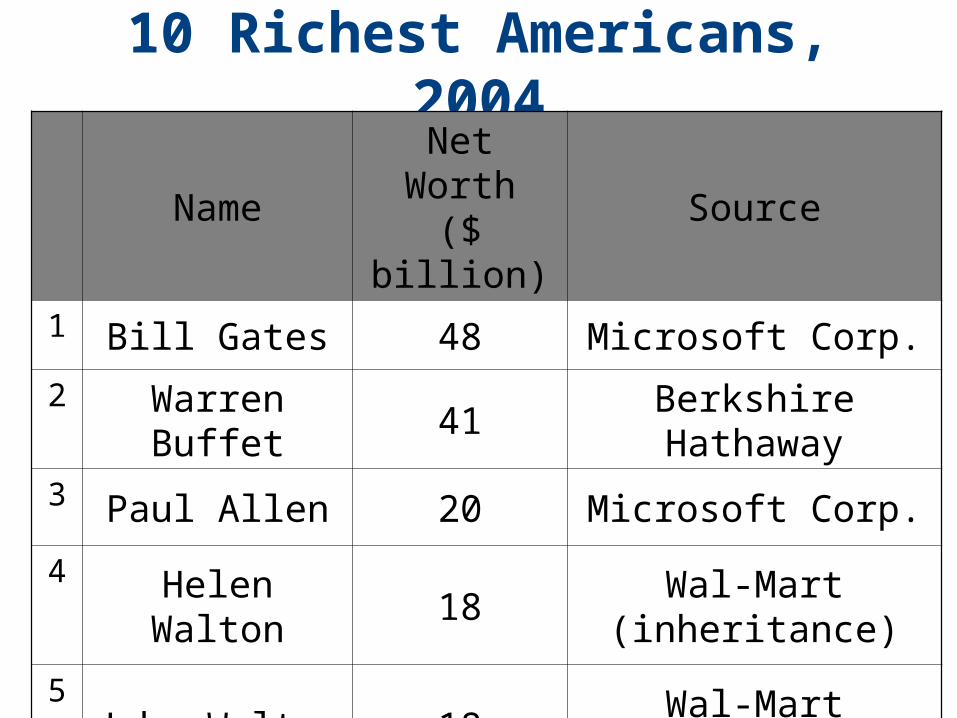
10 Richest Americans, 2004
NameNet Worth($ billion)
Source
1 Bill Gates 48 Microsoft Corp.
2 Warren Buffet
41Berkshire Hathaway
3 Paul Allen 20 Microsoft Corp.
4Helen Walton 18
Wal-Mart (inheritance)
5John Walton 18
Wal-Mart (inheritance)
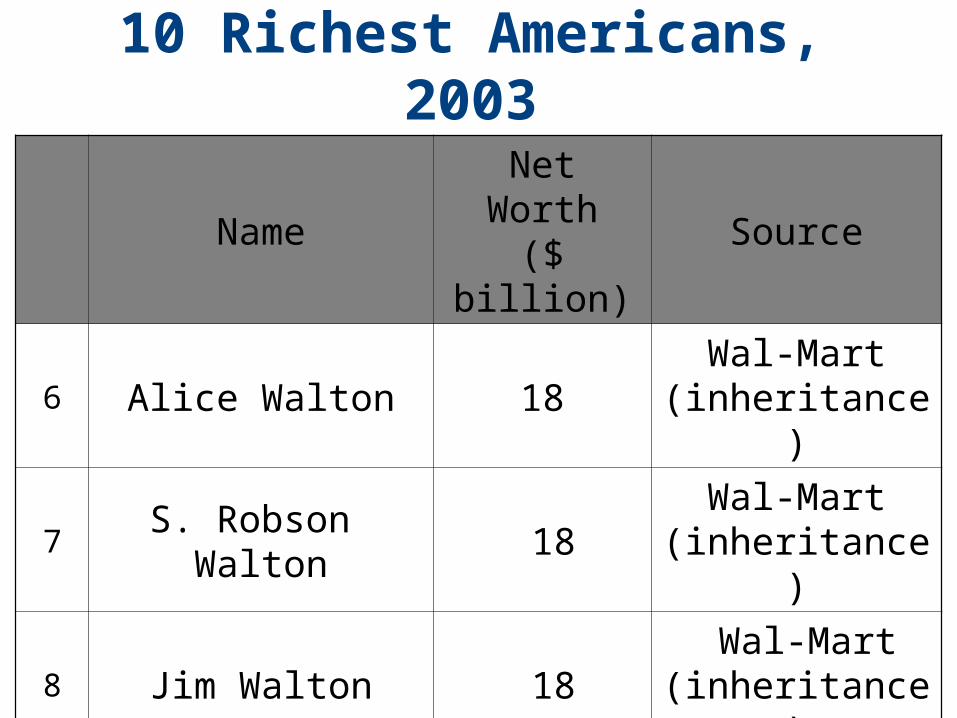
10 Richest Americans, 2003
NameNet Worth($ billion)
Source
6 Alice Walton 18Wal-Mart
(inheritance)
7S. Robson
Walton 18
Wal-Mart (inheritance)
8 Jim Walton 18 Wal-Mart
(inheritance)
9 Lawrence Ellison 18 Oracle Corp.
10 Michael Dell 14.2 Dell Computer

*Question
• One’s wealth includes which of the following:
a.earnings from workb.house minus mortgagec. car minus car loand.b. and c. only

*Answer: d
•One’s wealth includes: house minus mortgage and car minus car loan.

*Income Classes Households 2001
Income Class
% of Households
Annual Income
Upper upper 1.0 $1 million
Lower upper 12.4$100,000-$999,999
Upper middle
22.5$57,500-$99,999

*Income Classes, Households 2001
Income Class
% of Households
Annual Income
Average middle
18.8$37,500-$57,499
Lower middle or working
22.7$20,000-$37,499
Lower 22.6 $0-$19,999

Question
• In which of these groups did your total family income, from all sources, fall last year before taxes:
a.$0K-24.9Kb.$25K-49.9Kc.50K and up
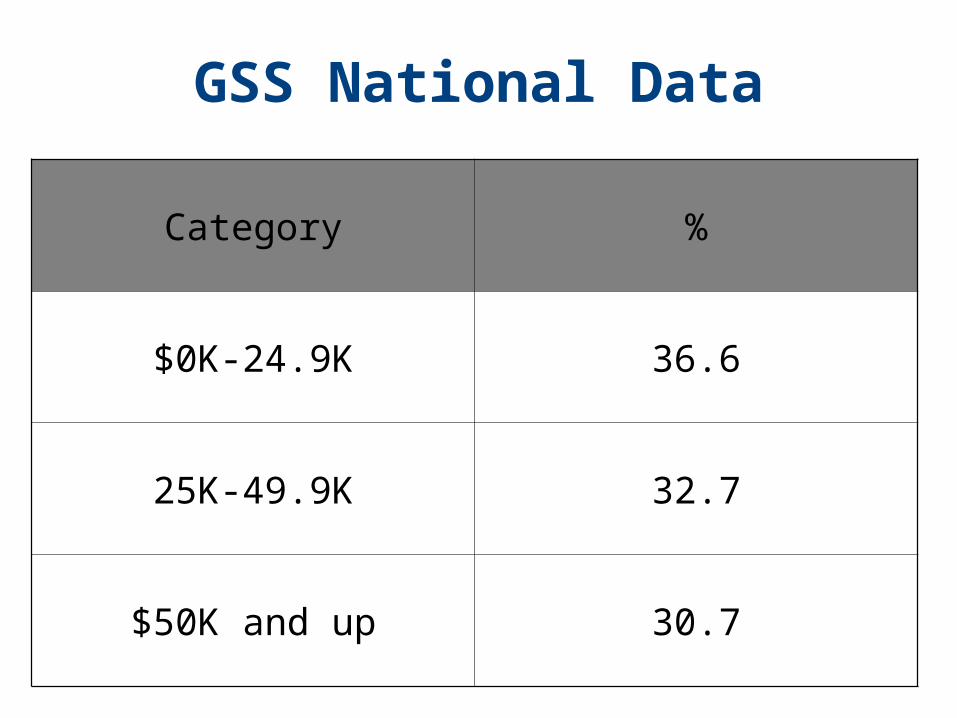
GSS National Data
Category %
$0K-24.9K 36.6
25K-49.9K 32.7
$50K and up 30.7
Distribution of National Income Among
Households

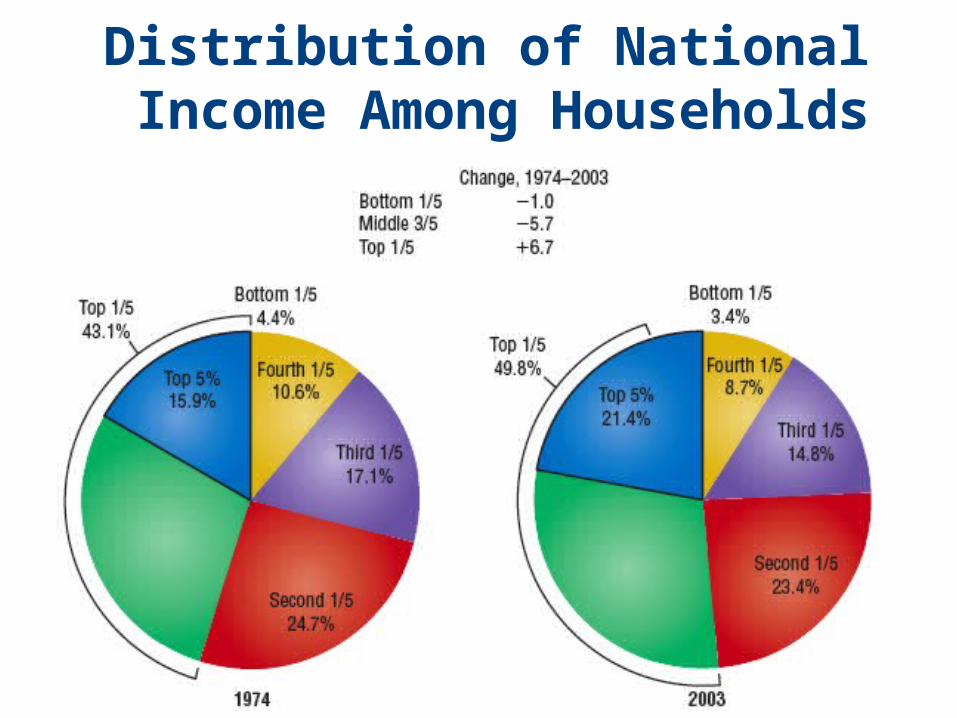
*Patterns of Income Inequalities
• 1974 - The top 5th of households earned 9.8 times more than the bottom 5th.
• 2001 -The top 5th earned more than half of all national income.
• The rich have been getting richer, middle-income earners and the poor have been getting poorer.

*Global Inequality
• 1/5 of the world’s population lacks shelter.
• More than 1/5 lacks safe water.• 1/3 of the world’s people are without
electricity.• More than 2/5 lack adequate
sanitation.• There are still about 27 million slaves
in Mozambique, Sudan, and other African countries.

*Question•The citizens of poorer nations are more likely to be lazy when compared to the citizens of richer nations.
a.Strongly agreeb.Agree somewhatc. Unsured.Disagree somewhate.Strongly disagree
*Gini Index•A measure of income inequality
with a value ranging from zero to 1.
•A Gini index of zero indicates every household earns the same amount of money.
•A Gini index of 1 indicates that a single household earns the entire national income.
•Most countries have Gini indexes between 0.2 and 0.5.

*Household Income Inequality, 2000

*U.N. Indicators of Human Development, Top 6 Countries,
2000Country
and RankLife
ExpectancyAdult
LiteracyGDP/
Capita
Norway 78.9 99% 36,600
United States 77.0 99% 35,750
Sweden 80.0 99% 26,050
Australia 79.1 99% 28,260
Canada 79.3 99% 29,480
Netherlands 78.3 99% 29,100
Belgium 78.7 99% 27,570GDP = Gross Domestic Product the total market value of all final goods and services produced within a given country or region in a given period of time (usually a calendar year)

*U.N. Indicators of Human Development
Bottom 6 Countries, 2000Country
and Rank
Life Expectanc
y
Adult Literacy
GDP/ Capita
Guinea-Bissau 45.2 39.4 710
Burundi 40.8 19.0 630Mali 48.5 19.0 930
Burkina Faso 45.8 12.8 1,100Niger 46.0 17.1 800
Sierra Leone 34.3 n.a. 520
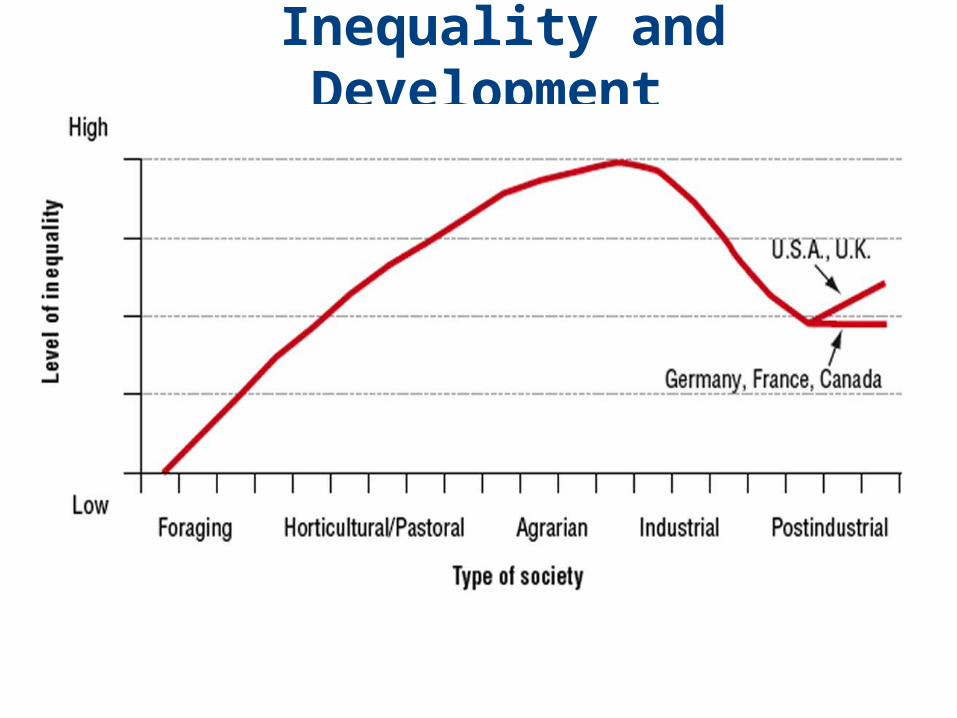
Inequality and Development
*Stratification Systems
•An ascription-based stratification system is one in which the allocation of rank depends on the characteristics a person is born with.
•An achievement-based stratification system is one in which the allocation of rank depends on a person’s accomplishments.
*Caste System
• A caste system is an almost pure ascription-based stratification system in which occupation and marriage partners are assigned on the basis of caste membership.

Apartheid
•A caste system based on race that existed in South Africa from 1948 until 1992.–consigned the large black majority to menial jobs
–prevented marriage between blacks and whites
–erected separate public facilities for members of the two races
*Theories of Stratification: Marx
•A person’s class is determined by the source of his or her income:–The bourgeoisie owns the means of production.
–The proletariat do physical labor.
–The petty bourgeoisie own means of production but do some physical labor themselves.
*Theories of Stratification: Weber
•Four main classes:–large property owners–small property owners–propertyless but relatively highly educated and well-paid employees
–propertyless manual workers
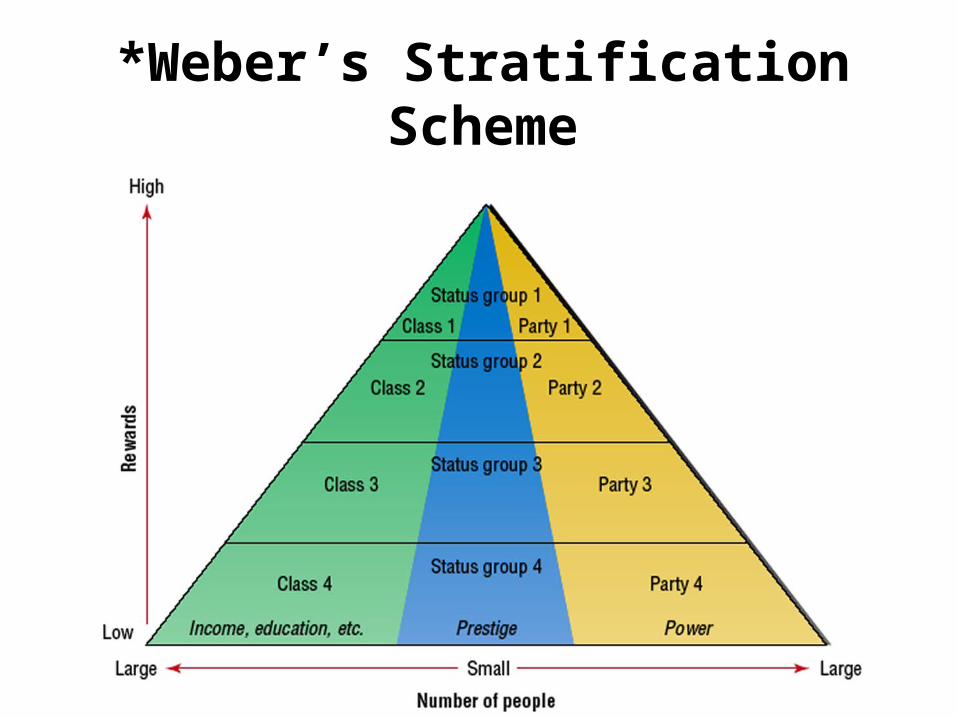
*Weber’s StratificationScheme

*Mean Annual Earnings, Full-Time Workers, and Prestige Scores,
Selected Occupations, U.S.
Occupation Median
Annual, 2003Prestige
Score, 1989
Airline pilots 120,589 61
Physicians 117,664 86
Lawyers 99,796 75
Aerospace Engineers
82,113 72
College/University Professors
66,945 74

*Mean Annual Earnings, Full-Time Workers, and Prestige Scores,
Selected Occupations, U.S. Occupation
MedianHourly
Annual, 2003Prestige
Score, 1989
Computer Programmers
59,940 61
Police officers and detectives
49,032 60
Plumbers, pipe fitters and
steamfitters45,047 45
High School teachers
45,254 66
*Theories of Stratification: Functionalism
•Some jobs are more importantthan others.
•People have to make sacrifices totrain for important jobs.
• Inequality is required to motivate people to undergo these sacrifices.

*Criticisms of Functionalism
•Inequality encourages the discovery of talent only for those who can afford to take advantage of the opportunities available to them.
•Once people attain high-class standing, they can use their power to maintain their position and promote the interests of their families regardless of their children’s talent.

*Blau and Duncan: The Status Attainment Model
• Stratification is not a system of distinct classes, but a continuous hierarchy or ladder of occupations with hundreds of rungs.
• Each rung on the ladder requires different levels of education and generates different amounts of income
• Socioeconomic index of occupational status• Averages earnings and years of education
of men employed full time in various occupations

*Blau and Duncan: The Status Attainment Model
• Looked at five variables:– Respondent’s current job– Respondent’s first job– Father’s job– Education completed by
respondent– Education completed by father
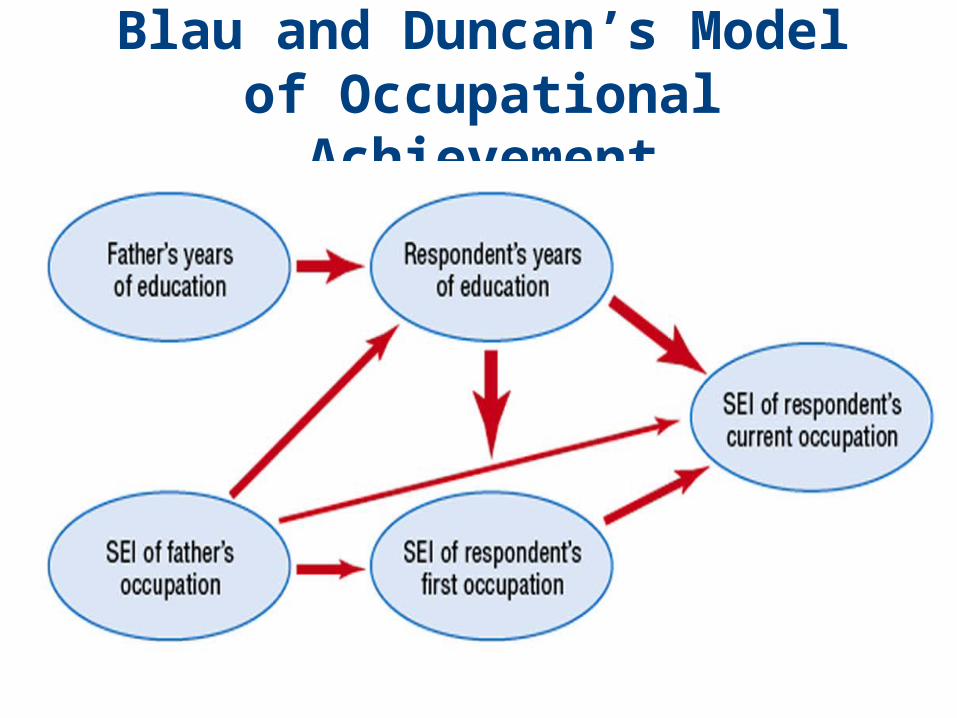
Blau and Duncan’s Model of Occupational
Achievement
*Blau and Duncan: The Status Attainment Model
• Main finding:– Respondents’ own achievements had
much more influence on their current occupational status than did ascribed characteristics
• Subsequent research confirmed rate of social mobility for men
• However, intragenerational mobility generally modest (within a single generation)
• Intergenerational mobility can be substantial (between generations)

*Blau and Duncan: The Status Attainment Model
• Most social mobility occurs as a result of change in the occupational structure rather than individual achievement
• Structural mobility – social mobility that results from changes in the distribution of occupations.
• Examples of occupational structure changes:– Agriculture to Manufacturing– Manufacturing to Service

Blau and Duncan: The Status Attainment Model
•Critique:– Ignored or underrepresented women,
minorities, and people employed part-time or unemployed workers
•Good News:– Subsequent research confirmed that
the process of status attainment is much the same for women and minorities as it is for white men.

*Blau and Duncan: The Status Attainment Model
•Good News:– Years of schooling influence status
attainment more than does father’s occupation whether one examines white men, women, African Americans or Hispanic Americans
•Bad News:– If you compare people with the same level of
education and similar family backgrounds, women and members of minority groups tend to attain lower status than white men.

*Wright’s Typology of Classes, United States,
1980
*Goldthorpe’s Typology of Classes
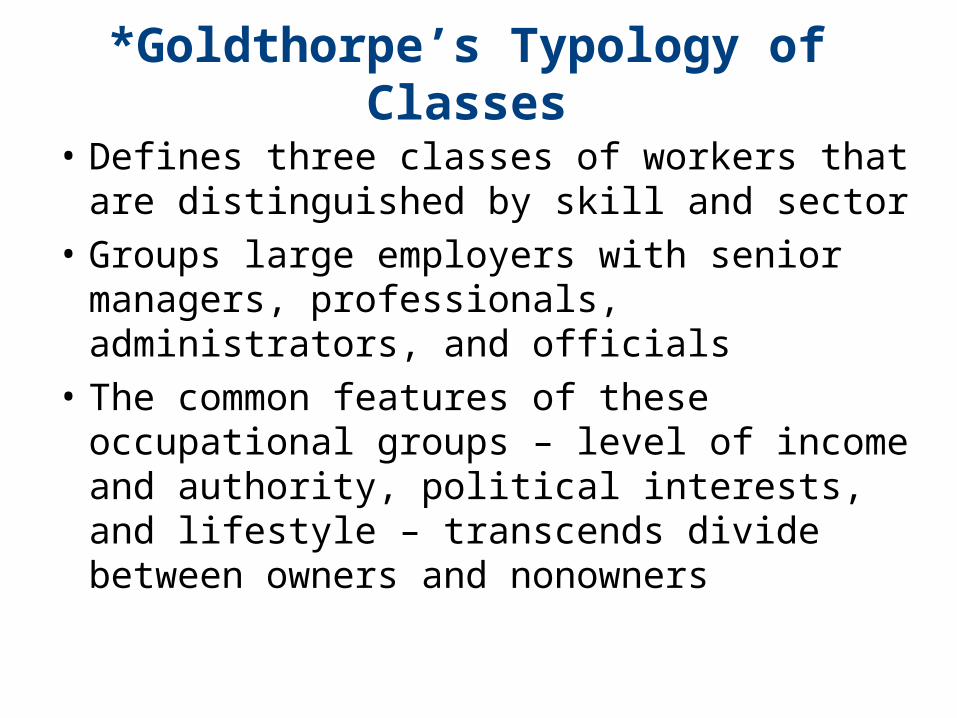
• Defines three classes of workers that are distinguished by skill and sector
• Groups large employers with senior managers, professionals, administrators, and officials
• The common features of these occupational groups – level of income and authority, political interests, and lifestyle – transcends divide between owners and nonowners

*Goldthorpe’s Typology of Classes
Service classes
I. Higher-grade professionals, administrators, and officials; managers in large industrial enterprises; large proprietors
II. Lower-grade professionals, administrators, and officials; higher- grade technicians; managers in small industrial establishments; supervisors of nonmanual employees
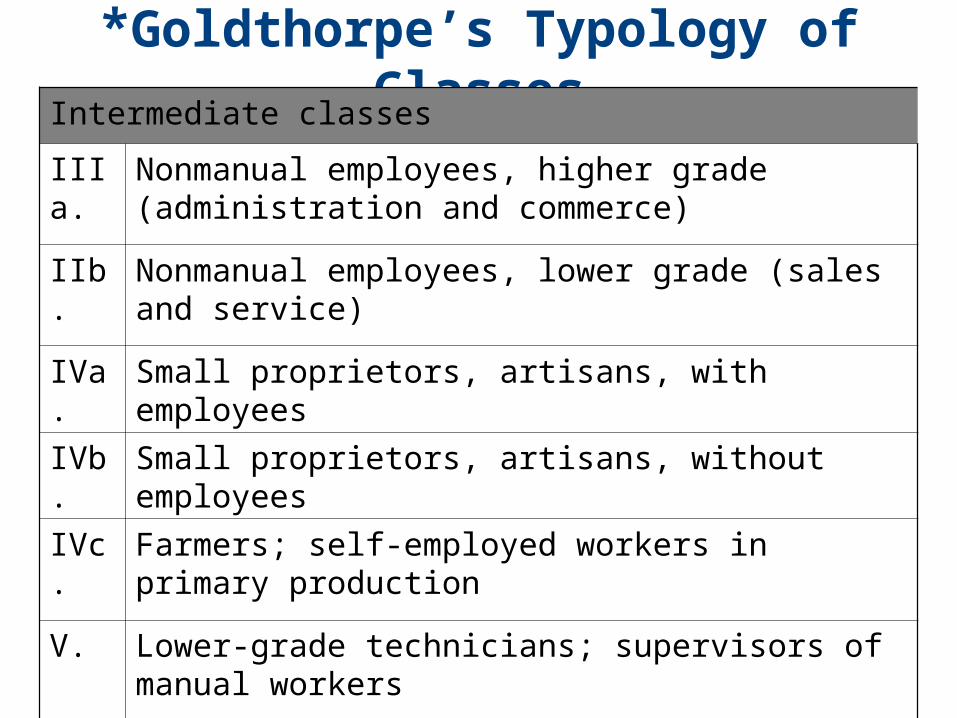
*Goldthorpe’s Typology of ClassesIntermediate classes
IIIa.
Nonmanual employees, higher grade (administration and commerce)
IIb. Nonmanual employees, lower grade (sales and service)
IVa. Small proprietors, artisans, with employees
IVb. Small proprietors, artisans, without employees
IVc. Farmers; self-employed workers in primary production
V. Lower-grade technicians; supervisors of manual workers
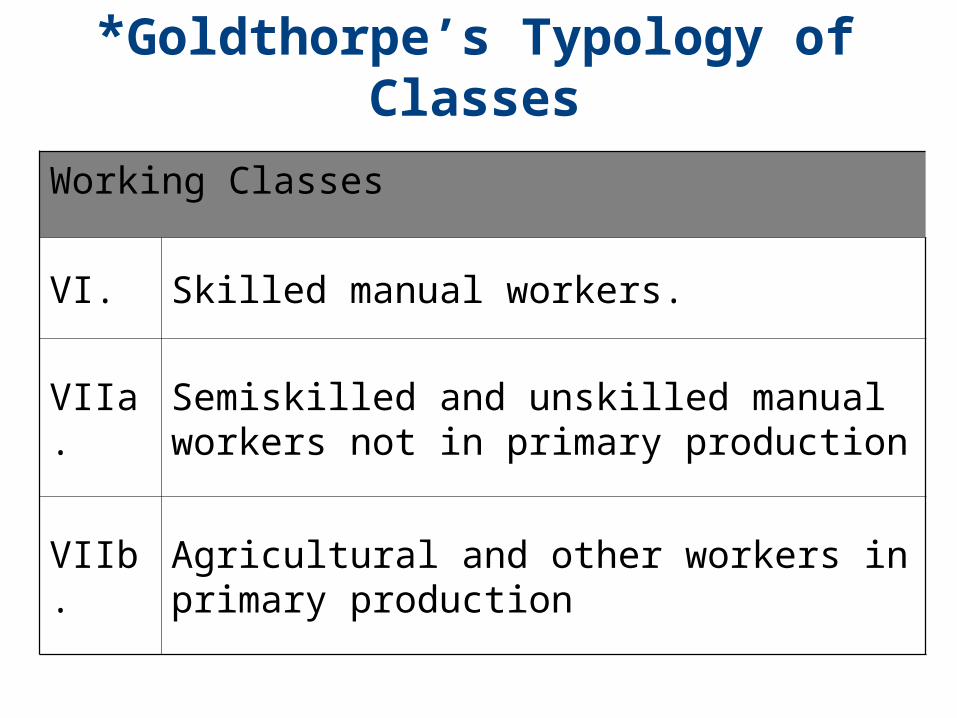
*Goldthorpe’s Typology of Classes
Working Classes
VI. Skilled manual workers.
VIIa.Semiskilled and unskilled manual workers not in primary production
VIIb.Agricultural and other workers in primary production

*Poverty Threshold
•The poverty threshold is set at three times the cost of an economy food budget and adjusted for: –number of people in the household
–annual inflation rate–whether adult householders are younger than 65
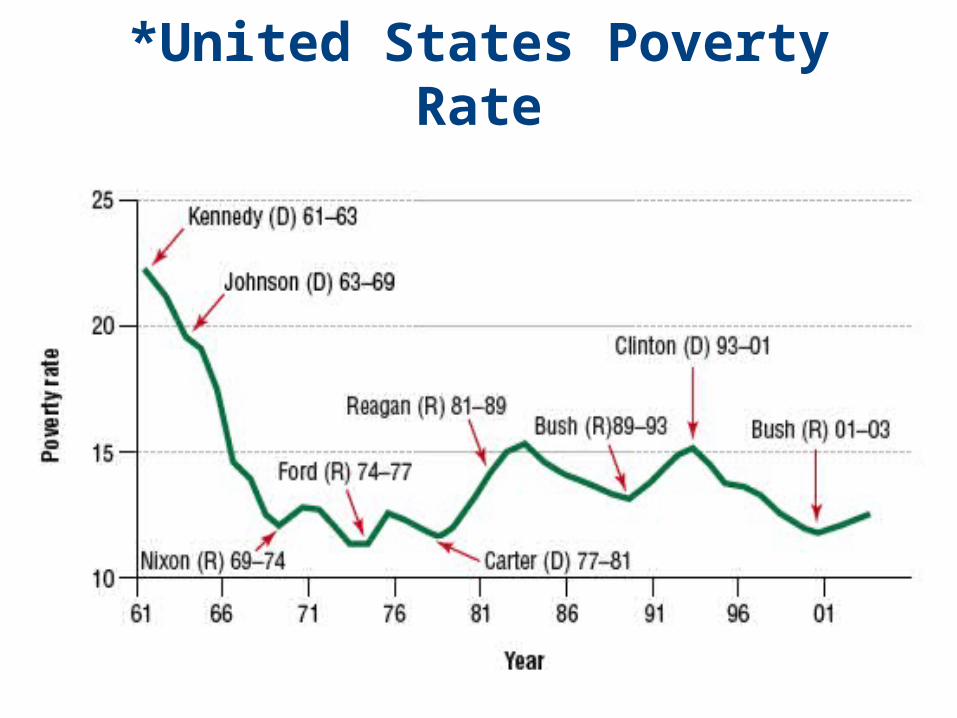
*United States Poverty Rate
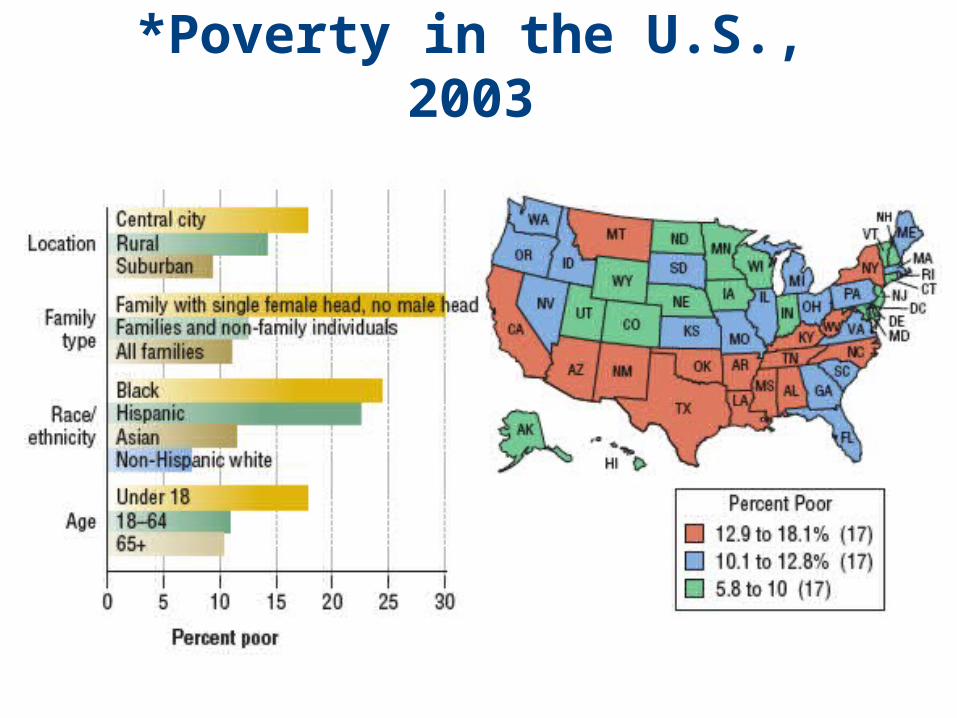
*Poverty in the U.S., 2003

*Polling Question
• Many poor people simply don't want to work hard.
a. Strongly agreeb. Agree somewhatc. Unsured. Disagree somewhate. Strongly disagree

Quick Quiz

1.Since the early 1960s:a.more upward than downward mobility
has occurred in the United Statesb.more downward than upward mobility
has occurred in the United Statesc. the amount of downward and upward
mobility has been about equald.more upward than downward mobility
has occurred in the United States, and the gap between upward and downward mobility started to shrink when many Americans reported deterioration in their economic situation

Answer: d
1. Since the early 1960s: more upward than downward mobility has occurred in the United States, and the gap between upward and downward mobility started to shrink when many Americans reported deterioration in their economic situation.

2. The _________________ is a measure of income inequality that ranges from 0 (every household earns the same amount of money) to 1 (all income is earned by a single household).
Answer: Gini Index
• The Gini Index is a measure of income inequality that ranges from 0 (every household earns the same amount of money) to 1 (all income is earned by a single household).
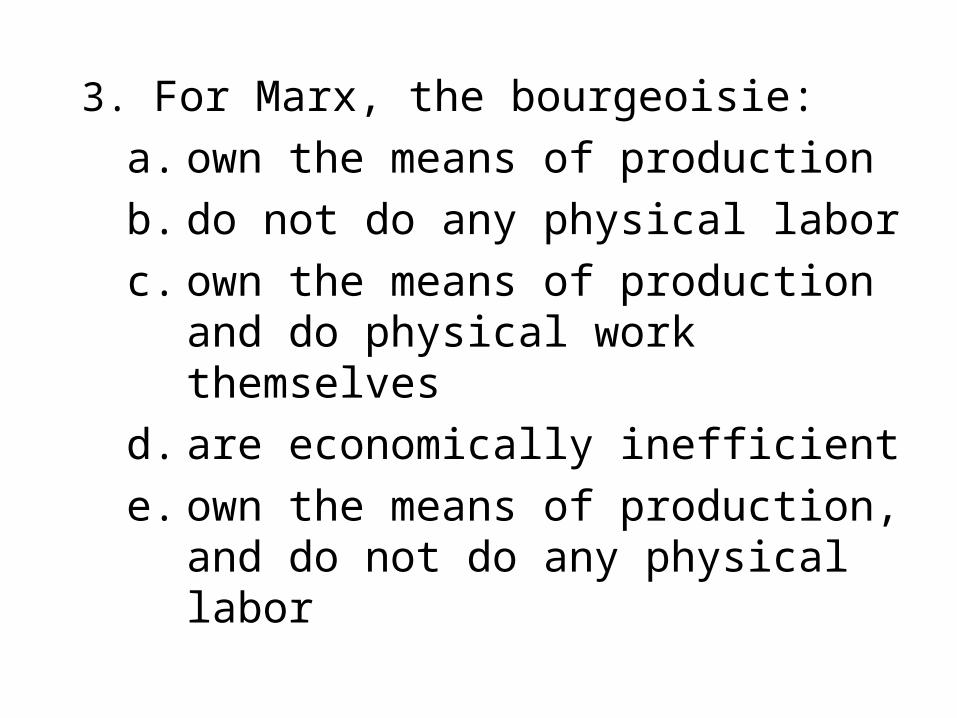
3. For Marx, the bourgeoisie:a. own the means of productionb. do not do any physical laborc. own the means of production
and do physical work themselves
d. are economically inefficiente. own the means of production,
and do not do any physical labor

Answer: e
•For Marx, the bourgeoisie own the means of production, and do not do any physical labor.
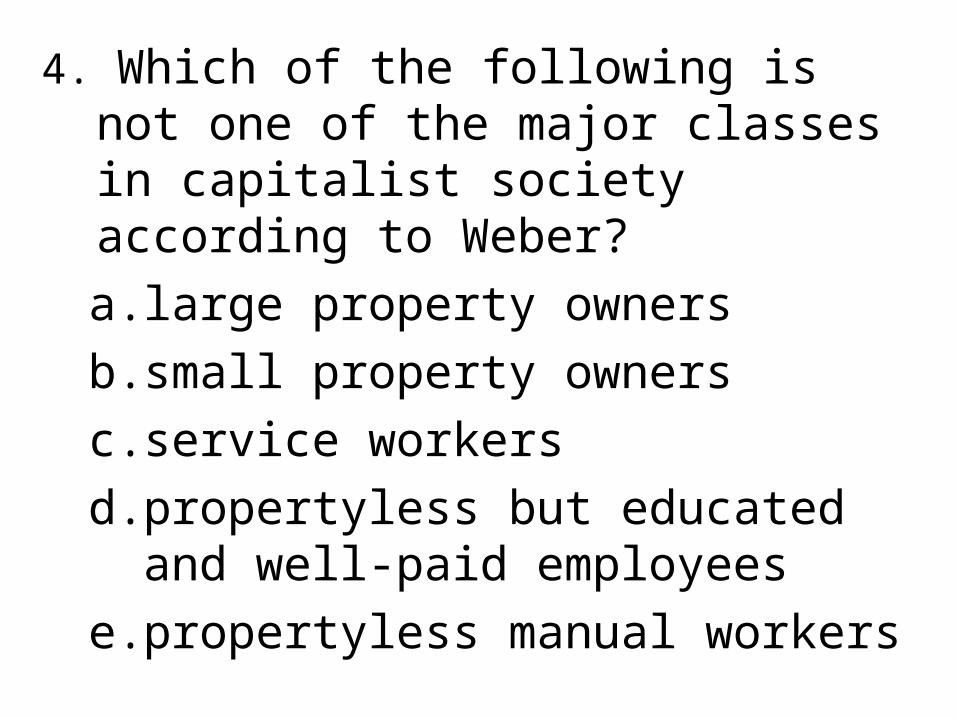
4. Which of the following is not one of the major classes in capitalist society according to Weber?a. large property ownersb. small property ownersc. service workersd. propertyless but educated and
well-paid employeese. propertyless manual workers

Answer: c
• Service workers are not one of the major classes in capitalist society according to Weber.

5. According to the functional theory of stratification, social inequality is necessary because the prospect of high material rewards motivates people to undergo the sacrifices needed to get a higher education.
a. Trueb. False

Answer: True
•According to the functional theory of stratification, social inequality is necessary because the prospect of high material rewards motivates people to undergo the sacrifices needed to get a higher education.
6. lau and Duncan's main research finding:a.ascription is about as powerful as
achievement in determining social mobility in American society
b.respondents' own achievements had much more influence on their current occupational status than did ascribed characteristics
c.ascribed characteristics had much more influence on respondents' current occupational status than did their own achievements
d.all of the above

Answer: b
• lau and Duncan's main research finding: respondents' own achievements had much more influence on their current occupational status than did ascribed characteristics.

7. Apartheid was:a.a foraging societyb.a feudal systemc. a caste systemd.an achievement societye.a postindustrial system

Answer: c
7. Apartheid was a caste system.