Chapter 8 Simulation of Protocols -...
30
173 Chapter 8 Simulation of Protocols 8.1. Introduction In this chapter, we analyze the security and performance of proposed protocols: HDVP, RSA-DPAP, ECC-DPAP, PVDSSP and EDVP by using simulation results. The simulation results were realized by using Network Simulator (NS-2), MATLAB 9.0, Statistical Tool box and proposed verification protocols applied to outsourced data storage applications in cloud to show the security and performance of these verification protocols. For the sake of completeness, we implemented proposed protocols in windows. Our experiments are conducted on a system with an Intel Core 2 processor running at 2.4 GHz, 4GB RAM, and a 7200 RPM Western Digital 320 GB Serial ATA drive with an 8 MB buffer with. All programs are written with help of Pairing-Based Cryptography (PBC) library version 0.4.18, the crypto library of OpenSSL version 0.9.8h and Sobol_Data Set library. Our implementation utilizes storage services/application: Amazon Simple Storage Service (S3). Storage service: Amazon Simple Storage Service (S3) is a scalable, pay-per use online storage service. The Clients can store an unlimited amount of data, paying for only the storage space and bandwidth that they are using, without initial startup fee. The basic data unit in S3 is an object, and the basic container for objects in S3 is called a bucket. For example, objects contain both data and metadata. A single object has a size limit of 5GB, but there is no limit on the number of objects per bucket. Moreover, a small script on Amazon Elastic Compute Cloud (EC2) is used to provide the support for verification protocol and dynamic data operations. 8.2. Experimental Results In this section, we present and discuss the experimental results for security and performance of all our proposed protocols and compare the results. 8.2.1. Security Here, we conduct experimental results for testing the Integrity, Confidentiality and Availability of the data for data storage applications.
Transcript of Chapter 8 Simulation of Protocols -...

173
Chapter 8 Simulation of Protocols
8.1. Introduction
In this chapter, we analyze the security and performance of proposed protocols: HDVP,
RSA-DPAP, ECC-DPAP, PVDSSP and EDVP by using simulation results.
The simulation results were realized by using Network Simulator (NS-2), MATLAB 9.0,
Statistical Tool box and proposed verification protocols applied to outsourced data storage
applications in cloud to show the security and performance of these verification protocols.
For the sake of completeness, we implemented proposed protocols in windows. Our
experiments are conducted on a system with an Intel Core 2 processor running at 2.4 GHz, 4GB
RAM, and a 7200 RPM Western Digital 320 GB Serial ATA drive with an 8 MB buffer with. All
programs are written with help of Pairing-Based Cryptography (PBC) library version 0.4.18, the
crypto library of OpenSSL version 0.9.8h and Sobol_Data Set library. Our implementation
utilizes storage services/application: Amazon Simple Storage Service (S3).
Storage service: Amazon Simple Storage Service (S3) is a scalable, pay-per use online
storage service. The Clients can store an unlimited amount of data, paying for only the storage
space and bandwidth that they are using, without initial startup fee. The basic data unit in S3 is
an object, and the basic container for objects in S3 is called a bucket. For example, objects
contain both data and metadata. A single object has a size limit of 5GB, but there is no limit on
the number of objects per bucket. Moreover, a small script on Amazon Elastic Compute Cloud
(EC2) is used to provide the support for verification protocol and dynamic data operations.
8.2. Experimental Results
In this section, we present and discuss the experimental results for security and performance
of all our proposed protocols and compare the results.
8.2.1. Security
Here, we conduct experimental results for testing the Integrity, Confidentiality and
Availability of the data for data storage applications.

174
a)Integrity
To test the Integrity of data, we consider two parameters: Probability Detection and
Verification Time.
1) Probability Detection is the corruption of data should be detected with high probability as
soon as possible. The Probabilistic detection of data corruption assurance on data Integrity
increased with the iteration of the verification protocols. The main problem is the detection of
such corruption in less time.
2) Verification time is the time taken for probability detection of it being corrupted blocks,
less time is always preferable.
We simulated the proposed verification protocols and existing protocol with 100, 500 and
1000 node cloud network using NS2 to test the Integrity in terms of verification time for the
detecting data corruptions with high probability (99%) and compare the verification time of all
Integrity verification protocols. We assume that nodes that data is deleted or modified by the
store. Each simulation step is identifying the corrupted data on the verification time. We consider
the different randomly corrupt a percentage ranging from 1% to 10% of the data with 1GB of the
data file.
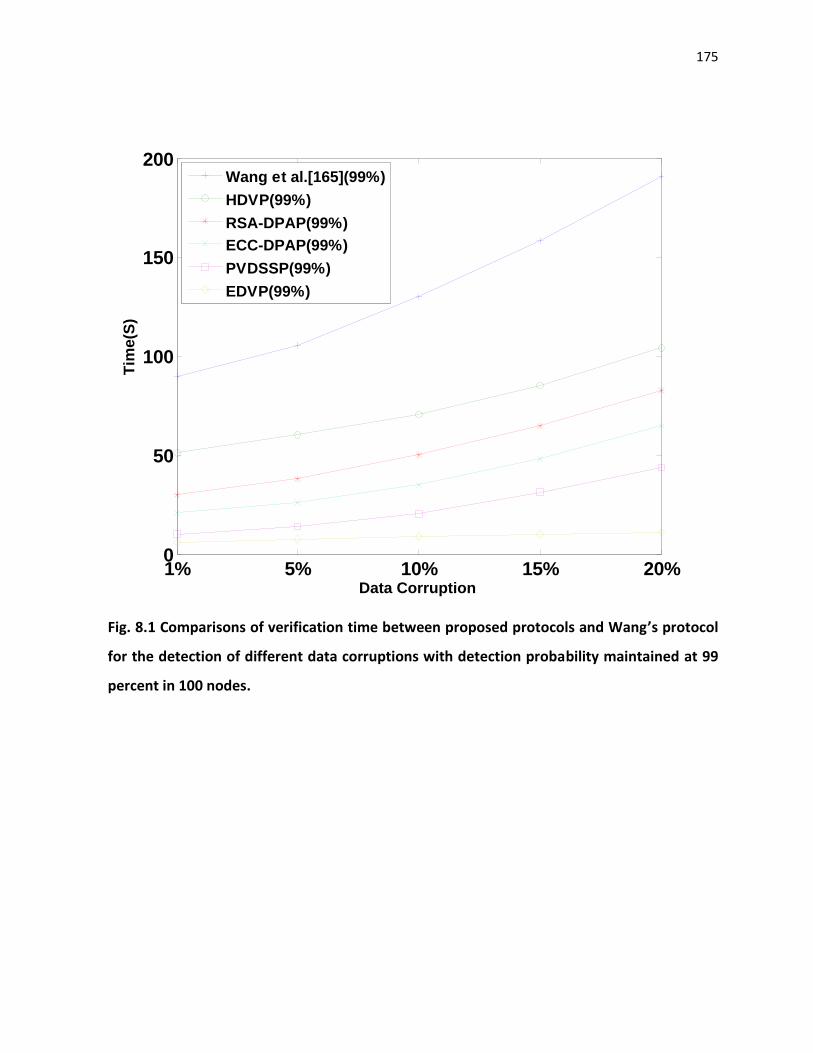
Fig. 8.1-8.3 presents the verification time (in seconds) for the detection of different data
corruptions range from 1% to 20% of 1GB file with 99% probability using proposed protocols
and Wang et al.[165] protocol in 100, 500 and 1000 node cloud network.
175
1% 5% 10% 15% 20%0
50
100
150
200
Data Corruption
Tim
e(S
)
Wang et al.[165](99%)
HDVP(99%)
RSA-DPAP(99%)
ECC-DPAP(99%)
PVDSSP(99%)
EDVP(99%)
Fig. 8.1 Comparisons of verification time between proposed protocols and Wang’s protocol
for the detection of different data corruptions with detection probability maintained at 99
percent in 100 nodes.

176
1 5 10 15 200
50
100
150
200
250
300
350
Data Corruption(%)
Tim
e(S
)Wang et al.[165](99%)
HDVP(99%)
RSA-DPAP(99%)
ECC-DPAP(99%)
PVDSSP(99%)
EDVP(99%)
Fig. 8.2 Comparisons of verification time between proposed protocols and Wang’s protocol
for the detection of different data corruptions with detection probability maintained at 99
percent in 500 nodes.

177
1 5 10 15 200
50
100
150
200
250
300
350
400
Data Corruption(%)
Tim
e(S
)
Wang et al.[165](99%)
HDVP(99%)
RSA-DPAP(99%)
ECC-DPAP(99%)
PVDSSP(99%)
EDVP(99%)
Fig. 8.3 Comparisons of verification time between proposed protocols and Wang’s protocol
for the detection of different data corruptions with detection probability maintained at 99
percent in 1000 nodes.
As observed from Fig. 8.1-8.3, the proposed protocols are very fast at detecting data
corruptions in cloud than Wang et al. [165]. In proposed protocols, the HDVP is useful for small
size applications and it is not suitable for large size data storage application when Clients having
less constrained resources. The RSA-DPAP suitable for large size data storage application but it
creates heavy overhead on processer due to large key size. Similarly, ECC-DPAP is more
suitable for small, medium and large size applications even when Clients having less constrained
resources(PDA, smart phones) and detects the corruptions faster than RSA-DPAP due to the less
key size. The PVDSSP is also useful for all types of applications and it takes very less
verification time to detect data corruptions. Finaly, the EDVP protocol detects the corruptions
more efficiently when compare to all above protocols.

178
Statistical Inference on Integrity of proposed protocols using one-way ANOVA
Consider a one-way ANOVA having experimental results of proposed verification protocols
for verification time to detect the data corruptions.
The hypothesis is assumed as follows:
Null hypothesis H0: There is no significant difference in the verification time of the
proposed algorithms tested.
Alternate hypothesis H1: there is significant difference between the verification times of
the proposed algorithms tested.
Table 8.1: ANOVA Table for Comparison of the Verification Time of Proposed Protocols No. of Nodes source SS df MS F Prob>F
100
Columns 12948.4 4 3237.1 11.59 0.0004932
Error 5585 24 279.25
Total 18533.4 28
500
Columns 35713.6 4 8928.39 9.86 0.0001
Error 18118.7 24 905.93
Total 53832.3 28
1000
Columns 47000 4 11750.01 7.26 0.0009
Error 32355.9 28 1671.79
Total 79355.9 28
SS: Sum of Squares, df: degrees of freedom, MS: mean square F:F-distribution, Prob: Probabability
The test statistic is the F value of 11.59, 9.86, and 7.26 from Table 8.1 for 100, 500 and
1000 nodes respectively. Using an α of .05, we have that F.05; 4, 24 = 2.87 from the F distribution
table. Since the test statistic is much larger than the critical value, we reject the null hypothesis of
equal verification time means and conclude that there is a (statistically) significant difference
among the verification times of proposed protocols. The p-value for 11.59, 9.86, and 7.26 are
0.000493, 0.0001, and 0.0009 respectively from Table 8.1, so the test statistic is significant at
that level.
The p-value returned by anova1 depends on assumptions about the random disturbances εij
in the model equation. For the p-value to be correct, these disturbances need to be independent,

179
normally distributed, and have constant variance. The ANOVA1 test is conducting by using
MATLAB 9.0 Statistical Tool Box.
Duncan Multiple Range Test
When null hypothesis is rejected, then a post hoc test can be conducted to identify which
groups having different mean. In this study, Duncan multiple range test was chosen. Duncan
multiple range test can maintain a low overall type I error and also can to be applied in groups
application that exhibit not significantly different. Duncan test uses a studentized range statistic
within a multiple stage test, referred to as a multiple range test.
To find which proposed protocol poorly performed, we compute the means of proposed
protocols using Duncan test at different nodes and presented in Table 8.2.
Table 8.2: Means of Proposed Protocols
No. of Nodes Mean
HDVP RSA-DPAP ECC-DPAP PVDSSP EDVP
100 74.24 53.27 39.12 24.09 8.58
500 126.28 91.51 68.56 48.38 14.83
1000 150.52 121.78 93.12 65.32 25.83
Form Table 8.2, the HDVP scheme performs poorly compared to other proposed methods.
The HDVP method (corresponding to the mean values: 74.24, 126.28, 150.52 for 100,500 and
1000 nodes respectively) yield more differences when compared with other methods. It is shown
that the mean difference of HDVP with other groups was greater from the least significant range.
This indicates that HDVP scheme is not an appropriate technique to be applied for the large
datasets.
Now, we compare the verification time of HDVP scheme existing Wang‘s [165] scheme
using Statistical Inference.
Statistical Inference on Integrity of HDVP and Existing Protocol using one-way ANOVA
Consider a one-way ANOVA having experimental results of different types of verification
protocols for verification time to detect the data corruptions.

180
The hypothesis is assumed as follows:
Null hypothesis H0: There is no significant difference in the verification time of the
HDVP and Wang et al.[165] tested.
Alternate hypothesis H1: there is significant difference between the verification time of
HDVP and Wang et al.[165] tested.
Table 8.3: ANOVA Table for Comparison of the Verification Time of HDVP and Existing Scheme
No. of Nodes source SS df MS F Prob>F
100
Columns 9261.1 1 9261.07 8.8 0.018
Error 8419.8 8 1052.48
Total 17680.9 9
500
Columns 20691.6 1 20691.6 5.42 0.048
Error 30549 8 3818.6
Total 51240.6 9
1000
Columns 30759.2 1 30759.2 5.71 0.043
Error 43093.6 8 5386.7
Total 73852.8 9
The test statistic is the F value of 8.8, 5.42and 5.71 from Table 8.3 for 100, 500 and 1000
nodes respectively. Using an α of .05, we have that F.05; 1, 8 = 5.32 from the F distribution table.
Since the test statistic is much larger than the critical value, we reject the null hypothesis of equal
verification time means and conclude that there is a (statistically) significant difference among
the verification times of HDVP and Wang‘s[165] scheme. The p-value for 8.8, 5.42and 5.71 are
0.018, 0.048, and 0.043 respectively from Table 8.3, so the test statistic is significant at that
level.
b)Availability
To test the Availability of data, we consider the following two parameters: Availability
percentage, and the encoding time. The Availability percentage of data means how much
percentage of data should be available with different number of redundancy blocks. Encoding
time is the time taken to generate redundancy blocks. It is by no means clear that proposed
approach to encode the data will work well in practice. Too many redundancy data blocks could
be created due to partial or incorrect information and due to multiple servers acting

181
simultaneously. The overhead of the state monitoring is required guiding the generation of
redundancy data blocks.
We simulated the 100, 500 and 1000-node cloud network with unlimited storage space using
NS2 to test the Availability of data. The nodes join or leave with a specific probability; we
assume that nodes that fail or leave the network lose the data blocks they store. In simulation, at
each step:
A certain number of nodes go down(depending on the probability of nodes being up)
The percentage of nodes that are up check for available blocks the file can contain. If
they need, they create more redundancy blocks.
We built simulations for proposed protocols with two parameters: 1) evaluate the
Availability percentage data using proposed protocols 2) compare encoding time of different
erasure codes are used in existing and proposed schemes. In Fig, 8.4 - 8.6 each plot corresponds
to different node Availability percentage with 100, 500 and 1000 node network using erasure
codes.
(20,0) (20,4) (20,8) (20,12) (20,16) (20, 20)0
20
40
60
80
100
Data Blocks(m,n)
Availab
ilit
y(%
)
Fig. 8.4 the Availability of data with 100 node network using different
redundancy blocks

182
(20,0) (20,4) (20,8) (20,12) (20,16) (20,20)0
20
40
60
80
100
Data Blocks(m,n)
Availab
ilit
y(%
)
Fig. 8.5 the Availability of data with 500 node network using different
redundancy blocks
(20,0) (20,4) (20,8) (20,12) (20,16) (20,20)0
20
40
60
80
100
Data Blocks(m,n)
Ava
ilab
ility
(%)
Fig. 8.6 the Availability of data with 1000 node network using different
redundancy blocks

183
By observing Fig. 8.4 -8.6, as soon as increasing more redundancy blocks, the Availability
of data guarantee are increasing when increasing the number of nodes in the network also.
In Fig 8.7, we compare encoding performance of different erasure codes to get the
Availability of the data in less time. From the Fig. 8.7, we can see that Tornado codes giving
better performance than all other erasure codes and Cauchy Reed-Solomon codes are giving best
performance than remaining erasure codes. Hence, we are using Tornado codes and Cauchy
Reed-Solomon codes for large size and small size storage applications respectively.
1 2 3 4 50
1000
2000
3000
4000
5000
6000
File Size(GB)
Tim
e(S
)
Tornado Code
Cauchy Reed-Solomon Code
Vandermonde Reed-Solomon Code
Server Code
Dispersal ECC
Fig. 8.7 Encoding Performance of different Erasure Codes
Statistical Inference on encoding cost of different erasure codes using one-way ANOVA
Consider a one-way ANOVA having experimental results of different types of different
erasure codes for encoding the data on EC2 database.
The hypothesis is assumed as follows:
Null hypothesis H0: There is no significant difference in the encoding cost of the erasure
codes tested.

184
Alternate hypothesis H1: there is significant difference between the encoding costs of the
erasure codes tested.
Table 8.4: Comparison of the Encoding Time of Different Erasure Codes
SS: Sum of Squares, df: degrees of freedom, MS: mean square F:F-distribution, Prob: Probability
The test statistic is the F value of 3.43, from Table 8.4. Using α of .05, we have that
F.05; 4, 20 = 2.866, from the F distribution table. Since the test statistic is larger than the critical
value, we reject the null hypothesis of equal encoding time means and conclude that there is a
(statistically) significant difference among the encoding time of erasure codes. The p-value for
3.43 is 0.0273 from Table 8.4, so the test statistic is significant at that level.
The HDVP, RSA-DPAP, ECC-DPAP and PVDSSP schemes have the lowest available
bandwidth, where initially all files is stored, so at the beginning of the simulation the Availability
of data is the worst. With encoding of data, the Availability percentage of data improves
drastically, since the most popular files become available on the local storage. Similar behavior
can be seen on the proposed protocols, which have a much better available bandwidth to cloud
applications.
c) Confidentiality
To test the Confidentiality of data, we consider the two parameters: data is not disclosed to
attackers and compares the time for encrypting the data. We simulate a cloud network with
100,500 and 1000 nodes randomly for the testing the Confidentiality of the data using NS2. We
verify the claim that encryption techniques in ECC-DPAP and PVDSSPs guarantees the ∆T -
Confidentiality property with probability almost one when 0ktT is sufficiently long. To this
end, we randomly pick two nodes on the cloud and consider one as the source and the other as

185
the data collector. By applying ECC-DPAP and PVDSSPs between the two nodes, we can
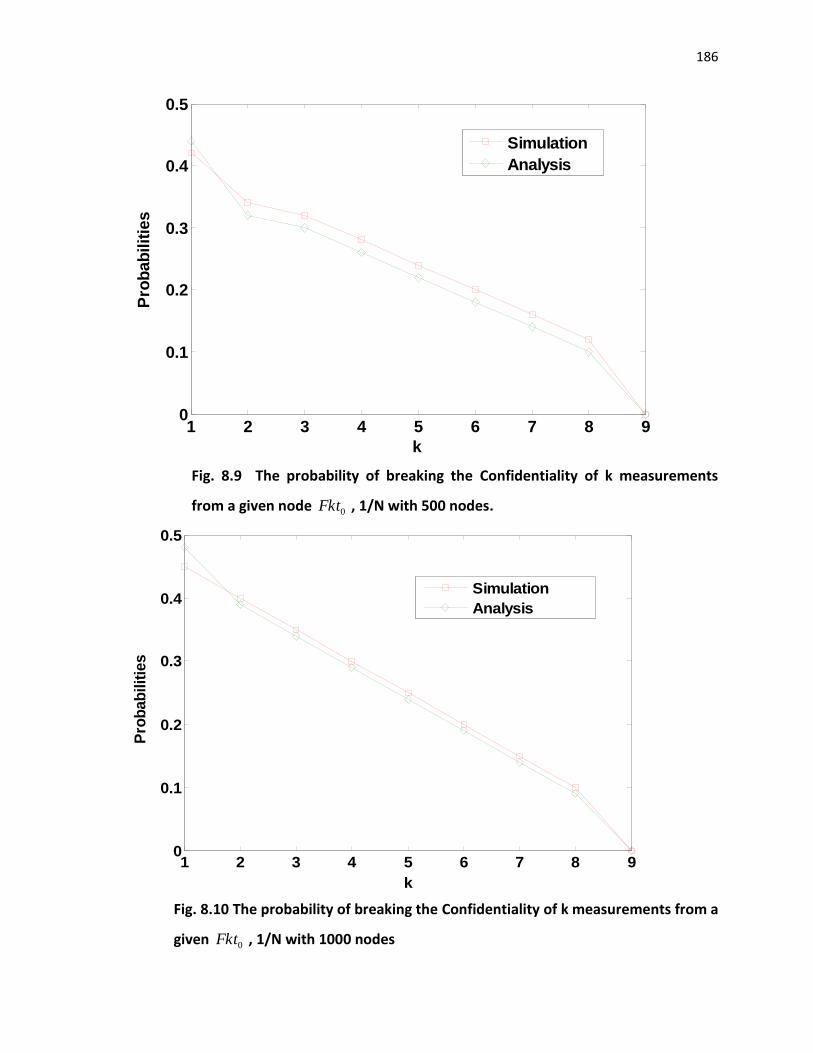
evaluate the quantity 0Fkt , 1/N for different values of k. As shown in Fig. 8.8-8.10 with different
node network, this probability converges very fast to zero with an increasing k, according to both
simulation and analytical results.
1 2 3 4 5 6 7 8 9-0.1
0
0.1
0.2
0.3
0.4
0.5
0.6
k
Pro
bab
ilit
ies
Simulation
Analysis
Fig. 8.8 The probability of breaking the Confidentiality of k measurements from a
given 0Fkt , 1/N with 100 nodes
186
1 2 3 4 5 6 7 8 90
0.1
0.2
0.3
0.4
0.5
k
Pro
bab
ilit
ies
Simulation
Analysis
Fig. 8.9 The probability of breaking the Confidentiality of k measurements
from a given node 0Fkt , 1/N with 500 nodes.
1 2 3 4 5 6 7 8 90
0.1
0.2
0.3
0.4
0.5
k
Pro
bab
ilit
ies
Simulation
Analysis
Fig. 8.10 The probability of breaking the Confidentiality of k measurements from a
given 0Fkt , 1/N with 1000 nodes

187
Fig. 8.8-8.10 shows the simulation results, as well as the analytical results of
Confidentiality of data with 100, 500 and 1000 nodes respectively. It is observed that the
approximated results obtained from theoretical analysis match the simulation results perfectly.
The second observation is that the false guess probability P in most cases is zero. Does this mean
that the ECC-DPAP and PVDSSP Schemes almost-zero false guess probability leaks more useful
information to the attackers? The answer is definitely NO. Although the almost-zero false guess
probability reflects a fact that the number of false guesses 0Fkt , 1/N is zero, it ignores the fact
that the total number of matched guesses 0Fkt is almost zero as well.
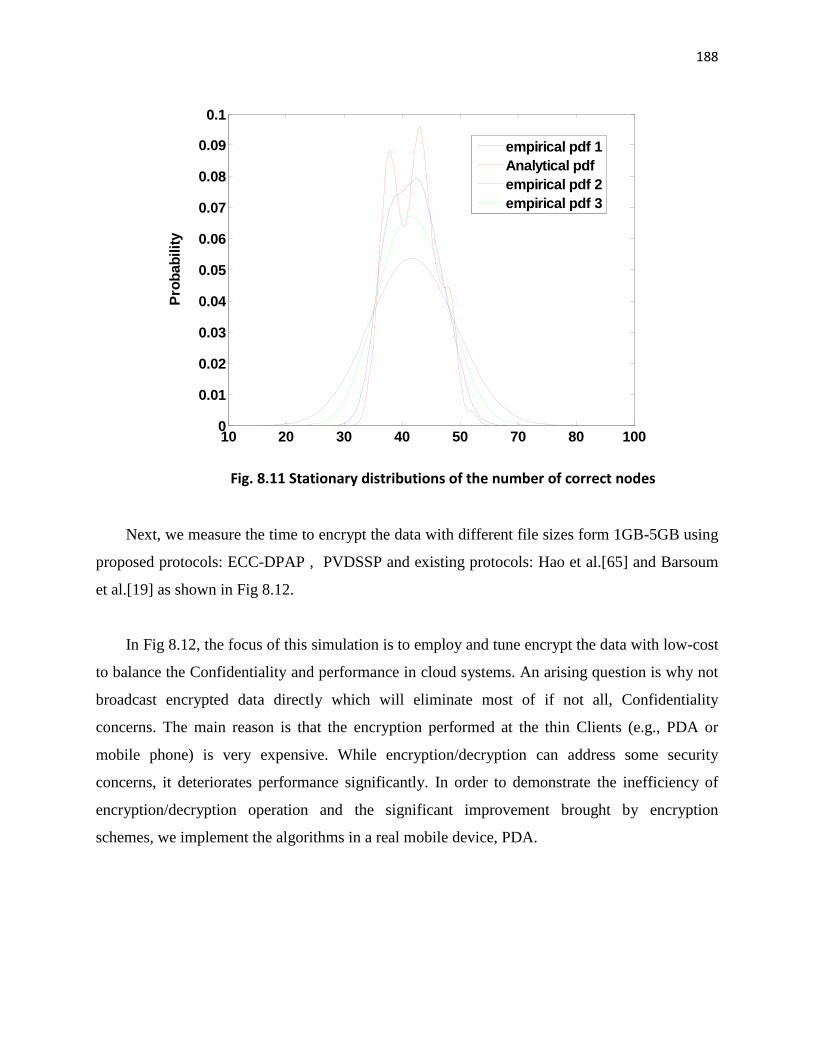
In the this experiment, we have also shown that, for any application-specific objective ∆ ≥
1/N , the Confidentiality of the stored data can be safeguarded with probability almost equal to
one. Of course, this probability is the one that an attacker might overhear the data, it does not
mean that the data can be compromised because the data blocks are encrypted as well. Again,
this verifies that proposed idea makes it harder to an attacker for collect enough data to break the
secret. Although this seems to require that a sufficiently high number of measurements (or
equivalently long period T ) are of interest, the experimental values show that even very short
sequences (e.g., T = 5t0 ) of measurements originating from a single source node can be
protected with probability fast approaching one. This is achieved thanks to the encryption,
resulting in particularly robust operation even when approximately 60% of the nodes are
compromised by the attacker as shown in Fig. 8.11.
188
10 20 30 40 50 70 80 1000
0.01
0.02
0.03
0.04
0.05
0.06
0.07
0.08
0.09
0.1
no. of nodes
Pro
bab
ilit
y
empirical pdf 1
Analytical pdf
empirical pdf 2
empirical pdf 3
Fig. 8.11 Stationary distributions of the number of correct nodes
Next, we measure the time to encrypt the data with different file sizes form 1GB-5GB using
proposed protocols: ECC-DPAP , PVDSSP and existing protocols: Hao et al.[65] and Barsoum
et al.[19] as shown in Fig 8.12.
In Fig 8.12, the focus of this simulation is to employ and tune encrypt the data with low-cost
to balance the Confidentiality and performance in cloud systems. An arising question is why not
broadcast encrypted data directly which will eliminate most of if not all, Confidentiality
concerns. The main reason is that the encryption performed at the thin Clients (e.g., PDA or
mobile phone) is very expensive. While encryption/decryption can address some security
concerns, it deteriorates performance significantly. In order to demonstrate the inefficiency of
encryption/decryption operation and the significant improvement brought by encryption
schemes, we implement the algorithms in a real mobile device, PDA.

189
1 2 3 4 50
500
1000
1500
2000
2500
3000
3500
4000
4500
File Size(GB)
Tim
e(S
)
PVDSSP
ECC-DPAP
Hao et al.[65]
Barsoum et al.[19]
Fig. 8.12 Time for the Encrypting the Data using Different Protocols
In all four schemes, the Client is supposed to encrypt the data, which are much larger size.
Fig. 8.12 shows that the proposed protocols ECC-DPAP and PVDSSP are more suitable for the
thin Clients( having less constrained resources) when working with large size applications
whereas existing protocols Hao et al.[65] and Barsoum et al.[19] are not suitable for the thin
Clients when dealing with large size applications.
Statistical Inference on Encryption cost of different protocols using one-way ANOVA
Consider a one-way ANOVA having experimental results of different types of protocols for
encrypting the data on EC2 database.
The hypothesis is assumed as follows:

190
Null hypothesis H0: There is no significant difference in the encryption cost of the
different protocols tested.
Alternate hypothesis H1: there is significant difference between the encryption costs of
the different protocols tested.
Table 8.5: Comparison of Encryption Time of Different Protocols
SS: Sum of Squares, df: degrees of freedom, MS: mean square F:F-distribution, Prob: Probabability
The test statistic is the F value of 5.34, from Table 8.5. Using α of .05, we have that
F.05; 3, 16 = 3.23, from the F distribution table. Since the test statistic is larger than the critical
value, we reject the null hypothesis of equal encryption time means and conclude that there is a
(statistically) significant difference among the encryption times. The p-value for 5.34 is 0.0097
from Table 8.5, so the test statistic is significant at that level.
We can get some graphical assurance that the means are different by looking at the box plots
in the Fig. 8.13 displayed by anova1.

191
500
1000
1500
2000
2500
3000
3500
4000
4500
1 2 3 4
Protocols
Tim
e(S
)
Fig. 8.13 Encryption Cost of Different protocols by ANOVA
1: PVDSSP, 2: ECC-DPAP, 3: Hao et al.[65] 4: Barsoum et al.[19].
The summary of security of proposed protocols are, the HDVP is provide better security
compared to other protocols when the application size is small and demands private verifiability
without requiring Confidentiality of data. The RSA-DPAP is suitable for large size applications
when application demands public verifiability without requiring Confidentiality of data.
Similarly, The ECC-DPAP suitable for all types of applications when an application demands all
three basic security requirements: Confidentiality, Integrity and Availability. This protocol is
more suitable for the thin Clients (e.g., a PDA or a cell phone). The ECC-DPAP is also suitable
for the all types of applications even if Clients having less computing resources where
applications demand all three security requirements with public verifiability and without any
storage overhead for the Clients.

192
8.2.2. Performance
In this section, we present and discuss the experimental results for the performance of our
research and compare the results of proposed schemes (HDVP, RSA-DPAP, ECC-DPAP, and
PVDSSP) from different perspectives: Computation Cost, Communication cost and Storage Cost.
a) Computation Cost
To test the computation cost of proposed verification protocols, we considered the three
parameters: Client, Verifier and CSP computation costs.
Client Computation Cost
Here, we are measuring computation cost of Client for generating the metadata. Table 8.6
presents the computation cost for generating metadata for proposed schemes using different file
sizes. The metadata generation time of the PVDSSP scheme is the lowest one, and this is because
it uses linear code. Moreover, the metadata generation time is unlikely to have significant impact
on the overall system performance because the metadata generation task is done only once
during the files life time which may be for tens of years.
Table 8.6: Metadata Generation Cost(S) of Client in Proposed protocols
File Size PVDSSP ECC-DPAP RSA-DPAP HDVP
1GB 165.11 191.91 335.15 491.05
2GB 186.06 230.66 372.22 538.35
3GB 208.71 276.02 405.02 581.36
4GB 230.52 310.86 442.45 635.85
5GB 251.06 353.19 485.1 697.92
We can get some graphical assurance that the means are different by looking at the box plots
in the Fig. 8.14.

193
200
300
400
500
600
700
1 2 3 4
Protocols
Co
mp
uta
tio
n T
ime(M
S)
Fig. 8.14 Computation cost of the Client in Proposed Protocols
1: PVDSSP, 2: ECC-DPAP, 3: RSA-DPAP, 4: HDVP
Verifier Computation cost
Table 8.7 presents the verifier computation times to check the responses received from the
CSP. The Secret sharing schemes has the shortest verification time among the four proposed
schemes. As illustrated in Table 8.7 proposed schemes have a very tiny increase in the verifier
computation time with increasing file sizes.
Table 8.7: Computation Cost(S) of the Verifier in Proposed Protocols
Data Size PVDSSP ECC-DPAP RSA-DPAP HDVP
20KB 110.21 165.11 294.04 396.21
40KB 132.64 182.05 321.22 445.11
60KB 153.46 203.09 352.91 491.22
80KB 177.32 222.45 385.12 540.34
100KB 201.42 251.71 420.25 595.52

194
We can get some graphical assurance of the verification time that the means are different by
looking at the box plots in the Fig 8.15.
100
200
300
400
500
600
1 2 3 4
Proposed Protocols
Co
mp
uta
tio
n T
ime(M
S)
Fig. 8.15 Computation cost of the Verifier in Proposed Protocols
1: PVDSSP, 2: ECC-DPAP, 3: RSA-DPAP, 4: HDVP
CSP Computation Cost
Table 8.8 presents the CSP computation times (s) to compute the Integrity proof for the
challenged blocks. Of course, the computation cost of HDVP is the largest one; it computes the
proof using universal hash functions, and thus provides the strongest guarantee.
Table 8.8 Computation Cost(S) of the CSP in Proposed Protocols
Data Size PVDSSP ECC-DPAP RSA-DPAP HDVP
20KB 80.76 120.9 204.4 294.4
40KB 96.8 144.31 235.05 341.76
60KB 113.04 162.07 263.23 373.43
80KB 128.07 186.33 298.44 405.9
100KB 146.02 209.74 323.19 441.08

195
We can get some graphical assurance of CSP computation time that the means are different
by looking at the box plots in the Fig 8.16.
100
150
200
250
300
350
400
450
1 2 3 4
Proposed Protocols
Co
mp
uta
tio
n T
ime(M
S)
Fig. 8.16 Computation cost of the CSP in Proposed Protocols
1: PVDSSP, 2: ECC-DPAP, 3: RSA-DPAP, 4: HDVP
Statistical Inference on computation Cost of proposed protocols using one-way ANOVA
Consider a one-way ANOVA having experimental results of different types of proposed
verification protocols for computation time of Client, TPA and CSP tested on EC2 database.
The hypothesis is assumed as follows:
Null hypothesis H0: There is no significant difference in the computation cost of the
proposed algorithms tested.
Alternate hypothesis H1: there is significant difference between the computations costs of
the proposed algorithms tested.

196
Table 8.9: ANOVA Table for Comparison of the Computation cost of Proposed Protocols
Computation Source SS df MS F Prob>F
Client
Columns 424102.3 5 141367.4 37.28 0.009299
Error 60833.8 13 3802.1
Total 484936.1 18
TPA
Columns 352786.5 5 117595.5 42.56 0.007494
Error 44209.3 16 2763.1
Total 396995.8 21
CSP
Columns 195734.3 3 65224.8 35.52 0.0026487
Error 29390.7 16 1836.9
Total 225125 19
SS: Sum of Squares, df: degrees of freedom, MS: mean square F:F-distribution, Prob: Probabability
The test statistic is the F value of 37.28, 42.56, and 35.52 from Table 8.9 for 100, 500 and
1000 nodes respectively. Using an α of .05, we have that F.05; 5, 13 = 3.025, F.05; 5, 16 = 2.85 and
F.05; 3, 16 = 3.23 from the F distribution table. Since the test statistics are much larger than the
critical values, we reject the null hypothesis of equal computation cost means and conclude that
there is a (statistically) significant difference among the computation costs of Client, TPA and
CSP in proposed protocols. The p-values for 37.28, 42.56, and 35.52 are 0.009299, 0.007494,
and 0.002648 respectively from Table 8.9, so the test statistic is significant at that level.
b) Storage Cost
Table 8.8 shows the storage overhead of the verifier for proposed schemes with different file
sizes. The way we aggregate the metadata makes PVDSSP scheme to have the lowest storage
overhead on the verifier side.
Table 8.10: Storage Cost (B) of the Verifier in Proposed Protocols
Data Size PVDSSP ECC-DPAP RSA-DPAP HDVP
1GB 145.76 180.90 235.40 295.40
2GB 162.80 221.31 285.050 361.76
3GB 185.04 262.07 341.23 433.43
4GB 214.07 306.33 408.44 515.90
5GB 245.02 359.74 473.19 609.08

197
We can get some graphical assurance that the means are different by looking at the bar
charts in the Fig. 8.17.
2 4 6 8 100
100
200
300
400
500
600
700
File Size(MB)
Sto
rag
e C
ost(
B)
PVDSSP
ECC-DPAP
RSA-DPAP
HDVP
Fig. 8.17 Storage cost of the Verifier in Proposed Protocols
Statistical Inference on Verifier Storage Cost of the proposed protocols using one-way
ANOVA
Consider a one-way ANOVA having experimental results of different types of proposed
verification protocols for storage overhead of the verifier tested on EC2 database.
The hypothesis is assumed as follows:
Null hypothesis H0: There is no significant difference in the verifier storage costs of the
proposed algorithms tested.

198
Alternate hypothesis H1: there is significant difference between the verifier storage costs
of the proposed algorithms tested.
Table 8.11: Comparison of the Storage cost of verifier in Proposed Protocols
SS: Sum of Squares, df: degrees of freedom, MS: mean square F:F-distribution, Prob: Probabability
The test statistic is the F value of 15.47, from Table 8.11. Using α of .05, we have that
F.05; 3, 16 = 7.65, from the F distribution table. Since the test statistic is larger than the critical
value, we reject the null hypothesis of equal storage cost means and conclude that there is a
(statistically) significant difference among the storage cost of verifier in proposed protocols. The
p-value for 15.47 is 0.0022 from the Table 8.11, so the test statistic is significant at that level.
c) Communication Cost
The communication costs of proposed protocols are illustrated in Fig. 8.18. From the Fig.
8.18, we can see that the HDVP scheme has the highest communication overhead. On the other
hand, PVDSSP scheme has lowest communication cost among the four schemes. Hence,
proposed schemes are much more practical especially when the available bandwidth is limited
and there are millions of verifiers who need to audit their data files over the CSPs.

199
1 2 3 4 5 6 7 8 9 100
500
1000
1500
2000
2500
3000
3500
4000
4500
5000
File Size(GB)
Co
mm
un
icati
on
Co
st(
Byte
s)
HDVP
RSA-DPAP
ECC-DPAP
PVDSSP
Fig. 8.18 Communication Cost of Proposed Protocols
Statistical Inference on Communication Cost of the proposed protocols using one-way
ANOVA
Consider a one-way ANOVA having experimental results of communication cost of
different types of proposed verification protocols tested on EC2 database.
The hypothesis is assumed as follows:
Null hypothesis H0: There is no significant difference in the communication costs of the
proposed algorithms tested.
Alternate hypothesis H1: there is significant difference between the communications
costs of the proposed algorithms tested.

200
Table 8.12: Comparison of the Computation cost of Proposed Protocols
SS: Sum of Squares, df: degrees of freedom, MS: mean square F:F-distribution, Prob: Probabability
The test statistic is the F value of 18.52, from Table 8.12. Using α of .05, we have that
F.05; 3, 36 = 2.866, from the F distribution table. Since the test statistic is larger than the critical
value, we reject the null hypothesis of equal storage cost means and conclude that there is a
(statistically) significant difference among the communication cost of proposed protocols. The
p-value for 18.52 is 1.95669e-007
from the Table 8.12, so the test statistic is significant at that
level.
The summary of performance of the proposed protocols is, the PVDSSP protocol gives best
performance among the proposed protocols considered here; it surpasses the number of
perspectives: verifier storage overhead cost, metadata generation cost, communication cost, and
computation cost. To conclude that a HDVP is suitable for small applications, RSA -DPAP is
useful for large applications even Clients having less capable of resourcing power where the
application demands public verifiability and an efficient data dynamic support. Besides, if the
computation cost over the server side is less important (the CSP has unlimited computational
resources), the Client needs the strongest guarantee that data is intact, and the verification
process is done in a constrained environment with limited bandwidth and limited verifier‘s
computational power (e.g., a PDA or a cell phone), then ECC-DPAP and PVDSSP are the best
choice to be applied in such circumstances.

201
Table 8.13: Salient features of the Proposed Protocols
Parameters/Protocols HDVP RSA-DPAP ECC-DPAP PVDSSP
Integrity yes Yes Yes Yes
Availability Yes Yes Yes Yes
Confidentiality no no yes Yes
Public Verifiability no Yes yes Yes
Data Dynamics Partialy Yes Yes Yes
Probability Detection O(N-1) O(N-1) O(N-1) O(N-1)
Storage Overhead for the Clients
yes yes yes no
Security of Dynamic Data Operations
No Possibility of
replay attacks Possibility of
replay attacks Yes
Overall Security N/A IF ECDL CDH, DDH
Server Computation O(1) O(1) O(1) O(1)
Verifier computation O(1) O(1) O(1) O(1)
Verifier Storage Overhead
O(1) O(1) O(1) O(1)
Size of MetaData O(n) O(n) O(n) O(1)
N/A: No Assumption, IF: Integer Factorization, DH: Diffie–Hellman, CDH: Computational
DH, ECDL: Elliptic Curve Discrete Logarithm (ECDL). DDH: Decisional DH.
The EDVP is RSA-DPAP, ECC-DPAP and PVDSSP in a distributed manner, so all the
characteristics of these protocols also applicable to EDVP.

202
8.3. Summary
In this chapter, we have presented and discuss the simulation results of proposed protocols,
which consist of security and performance results and compared the results with existing
schemes. In security results, we have tested the Integrity, Availability and Confidentiality of the
proposed protocols. In performance results, we have tested the computation cost, communication
cost and storage cost. We have also evaluated the both results with statistical tests using one-way
ANOVA and proved that there is a security and efficiency difference between the proposed
protocols and existing protocols. By considering experimental results, we conclude that
Homomorpic Distribution Verification Protocol (HDVP) is useful when an application needs
Availability and Integrity of data through private verifiability. RSA-based Dynamic Audit
Protocol (RSA-DPAP) is useful where an application demands Integrity and Availability of data
with efficient dynamic data operations through public verifiability. ECC-based Dynamic Public
Audit Protocol (ECC-DPAP) is useful where application needs Confidentiality, Availability
and Integrity of data efficiently and mainly it is suitable for resource constrained mobile devices
in cloud computing like PDA, Smart-Cards and note books. A Publicly Verifiable Dynamic
Secret Sharing Protocol (PVDSSP): this protocol is useful where an application needs all three
security properties refer to Availability, Integrity and Confidentiality of data with lightweight
communication and without any storage cost for the Clients to maintain the encryption key at
locally. An Efficient Distributed Verification Protocol (EDVP) is useful when application
needs faster execution time to validate the Integrity of data through multiple verifiers.
The main salient features of proposed protocols are given in Table 8.13.