Chapter 8 Principles of Corporate Finance Eighth Edition Risk and Return Slides by Matthew Will...
36
Chapter 8 Principles of Corporate Finance Eighth Edition Risk and Return Slides by Matthew Will Copyright © 2006 by The McGraw-Hill Companies, Inc. All rights reserved McGraw-Hill/Irwin
-
Upload
basil-cannon -
Category
Documents
-
view
254 -
download
1
Transcript of Chapter 8 Principles of Corporate Finance Eighth Edition Risk and Return Slides by Matthew Will...

Chapter 8
Principles of
Corporate FinanceEighth Edition
Risk and Return
Slides by
Matthew Will
Copyright © 2006 by The McGraw-Hill Companies, Inc. All rights reserved
McGraw-Hill/Irwin

Copyright © 2006 by The McGraw-Hill Companies, Inc. All rights reserved
8- 2
McGraw-Hill/Irwin
Topics Covered
Markowitz Portfolio TheoryRisk and Return RelationshipValidity and the Role of the CAPMSome Alternative Theories

Copyright © 2006 by The McGraw-Hill Companies, Inc. All rights reserved
8- 3
McGraw-Hill/Irwin
Markowitz Portfolio Theory
Combining stocks into portfolios can reduce standard deviation, below the level obtained from a simple weighted average calculation.
Correlation coefficients make this possible.The various weighted combinations of
stocks that create this standard deviations constitute the set of efficient portfoliosefficient portfolios.

Copyright © 2006 by The McGraw-Hill Companies, Inc. All rights reserved
8- 4
McGraw-Hill/Irwin
Markowitz Portfolio Theory
Price changes vs. Normal distribution
Coca Cola - Daily % change 1987-2004
0
0.02
0.04
0.06
0.08
0.1
0.12
0.14
-9 -7 -5 -3 -1 0 2 4 6 7
Pro
port
ion
of D
ays
Daily % Change

Copyright © 2006 by The McGraw-Hill Companies, Inc. All rights reserved
8- 5
McGraw-Hill/Irwin
Markowitz Portfolio Theory
Standard Deviation VS. Expected Return
Investment A
0
2
4
6
8
10
12
14
16
18
20
-50 0 50
%
prob
abili
ty
% return

Copyright © 2006 by The McGraw-Hill Companies, Inc. All rights reserved
8- 6
McGraw-Hill/Irwin
Markowitz Portfolio Theory
Standard Deviation VS. Expected Return
Investment B
0
2
4
6
8
10
12
14
16
18
20
-50 0 50
%
prob
abili
ty
% return

Copyright © 2006 by The McGraw-Hill Companies, Inc. All rights reserved
8- 7
McGraw-Hill/Irwin
Markowitz Portfolio Theory
Standard Deviation VS. Expected Return
Investment C
0
2
4
6
8
10
12
14
16
18
20
-50 0 50
%
prob
abili
ty
% return

Copyright © 2006 by The McGraw-Hill Companies, Inc. All rights reserved
8- 8
McGraw-Hill/Irwin
Markowitz Portfolio Theory
Standard Deviation VS. Expected Return
Investment D
0
2
4
6
8
10
12
14
16
18
20
-50 0 50
%
prob
abili
ty
% return
Copyright © 2006 by The McGraw-Hill Companies, Inc. All rights reserved
8- 9
McGraw-Hill/Irwin
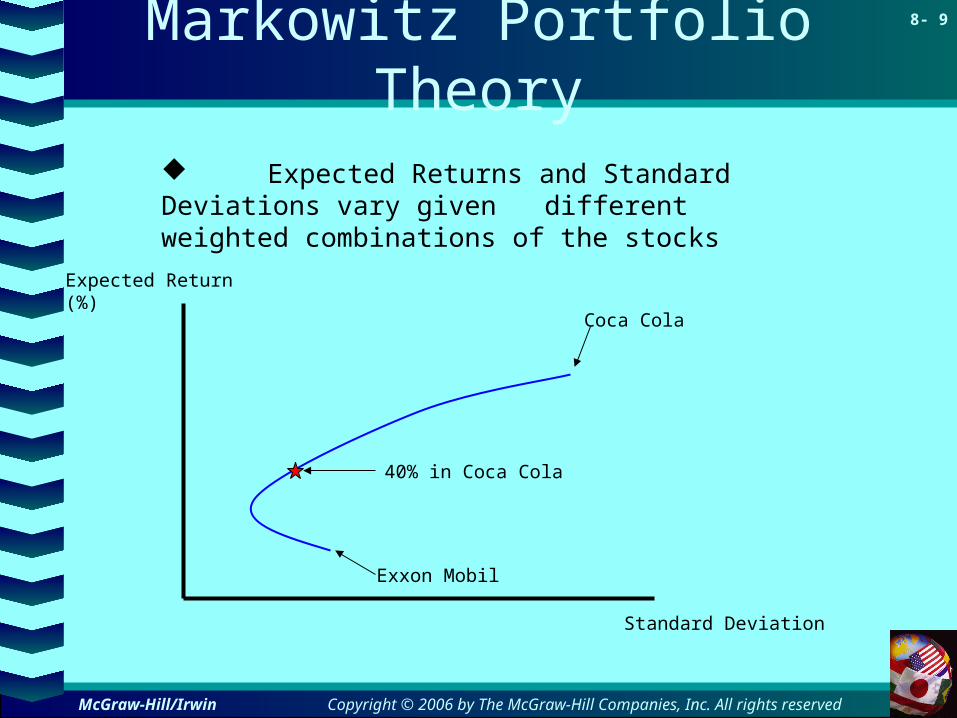
Markowitz Portfolio Theory
Exxon Mobil
Coca Cola
Standard Deviation
Expected Return (%)
40% in Coca Cola
Expected Returns and Standard Deviations vary given different weighted combinations of the stocks

Copyright © 2006 by The McGraw-Hill Companies, Inc. All rights reserved
8- 10
McGraw-Hill/Irwin
Efficient Frontier
Standard Deviation
Expected Return (%)
•Each half egg shell represents the possible weighted combinations for two stocks.
•The composite of all stock sets constitutes the efficient frontier

Copyright © 2006 by The McGraw-Hill Companies, Inc. All rights reserved
8- 11
McGraw-Hill/Irwin
Efficient Frontier
Standard Deviation
Expected Return (%)
•Lending or Borrowing at the risk free rate (rf) allows us to exist outside the
efficient frontier.
rf
Lending
BorrowingT
S

Copyright © 2006 by The McGraw-Hill Companies, Inc. All rights reserved
8- 12
McGraw-Hill/Irwin
Efficient Frontier
Example Correlation Coefficient = .4
Stocks % of Portfolio Avg Return
ABC Corp 28 60% 15%
Big Corp 42 40% 21%
Standard Deviation = weighted avg = 33.6
Standard Deviation = Portfolio = 28.1
Return = weighted avg = Portfolio = 17.4%

Copyright © 2006 by The McGraw-Hill Companies, Inc. All rights reserved
8- 13
McGraw-Hill/Irwin
Efficient Frontier
Example Correlation Coefficient = .4
Stocks % of Portfolio Avg Return
ABC Corp 28 60% 15%
Big Corp 42 40% 21%
Standard Deviation = weighted avg = 33.6
Standard Deviation = Portfolio = 28.1
Return = weighted avg = Portfolio = 17.4%
Let’s Add stock New Corp to the portfolio

Copyright © 2006 by The McGraw-Hill Companies, Inc. All rights reserved
8- 14
McGraw-Hill/Irwin
Efficient Frontier
Example Correlation Coefficient = .3
Stocks % of Portfolio Avg Return
Portfolio 28.1 50% 17.4%
New CorpNew Corp3030 50%50% 19% 19%
NEW Standard Deviation = weighted avg = 31.80
NEW Standard Deviation = Portfolio = 23.43
NEW Return = weighted avg = Portfolio = 18.20%

Copyright © 2006 by The McGraw-Hill Companies, Inc. All rights reserved
8- 15
McGraw-Hill/Irwin
Efficient Frontier
Example Correlation Coefficient = .3
Stocks % of Portfolio Avg Return
Portfolio 28.1 50% 17.4%
New Corp 30 50% 19%
NEW Standard Deviation = weighted avg = 31.80
NEW Standard Deviation = Portfolio = 23.43
NEW Return = weighted avg = Portfolio = 18.20%
NOTE: Higher return & Lower risk
How did we do that? DIVERSIFICATION
Copyright © 2006 by The McGraw-Hill Companies, Inc. All rights reserved
8- 16
McGraw-Hill/Irwin
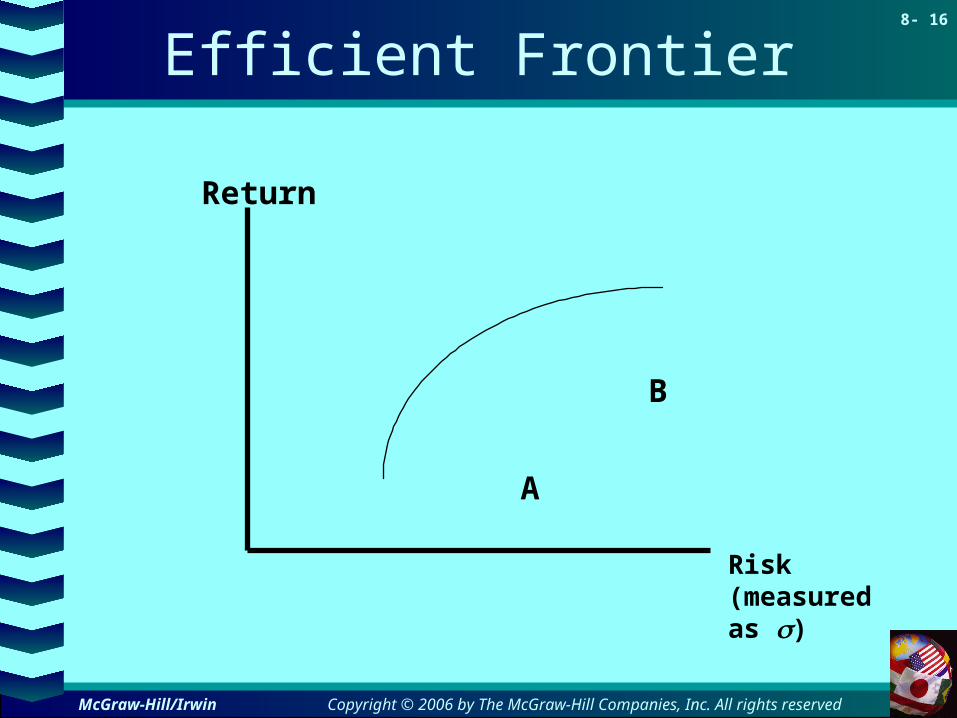
Efficient Frontier
A
B
Return
Risk (measured as )

Copyright © 2006 by The McGraw-Hill Companies, Inc. All rights reserved
8- 17
McGraw-Hill/Irwin
Efficient Frontier
A
B
Return
Risk
AB

Copyright © 2006 by The McGraw-Hill Companies, Inc. All rights reserved
8- 18
McGraw-Hill/Irwin
Efficient Frontier
A
BN
Return
Risk
AB

Copyright © 2006 by The McGraw-Hill Companies, Inc. All rights reserved
8- 19
McGraw-Hill/Irwin
Efficient Frontier
A
BN
Return
Risk
ABABN

Copyright © 2006 by The McGraw-Hill Companies, Inc. All rights reserved
8- 20
McGraw-Hill/Irwin
Efficient Frontier
A
BN
Return
Risk
AB
Goal is to move up and left.
WHY?
ABN
Copyright © 2006 by The McGraw-Hill Companies, Inc. All rights reserved
8- 21
McGraw-Hill/Irwin
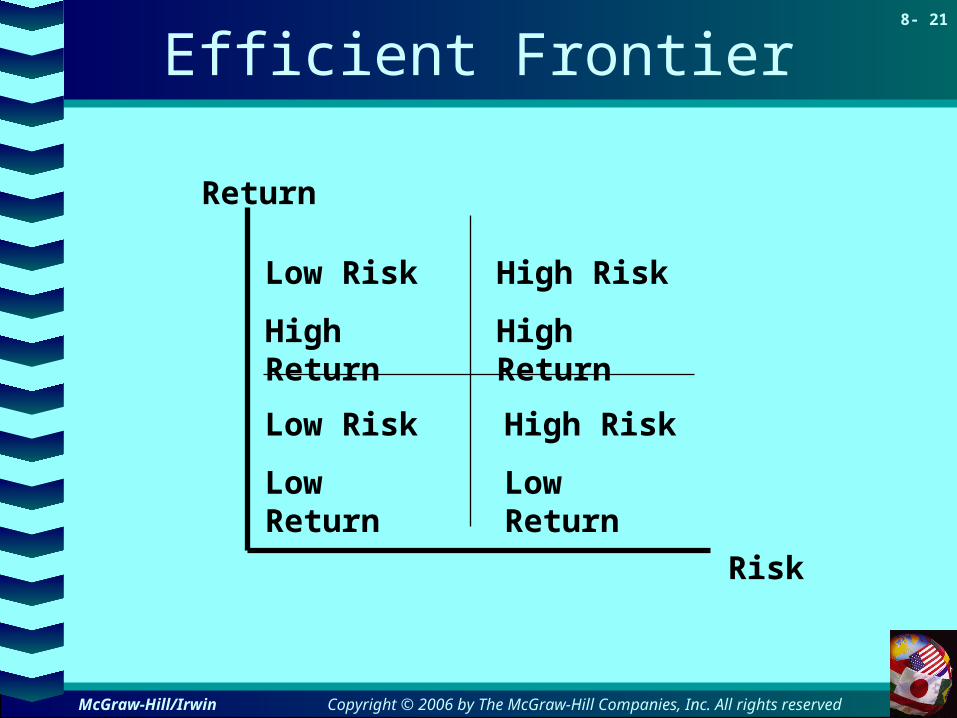
Efficient Frontier
Return
Risk
Low Risk
High Return
High Risk
High Return
Low Risk
Low Return
High Risk
Low Return
Copyright © 2006 by The McGraw-Hill Companies, Inc. All rights reserved
8- 22
McGraw-Hill/Irwin
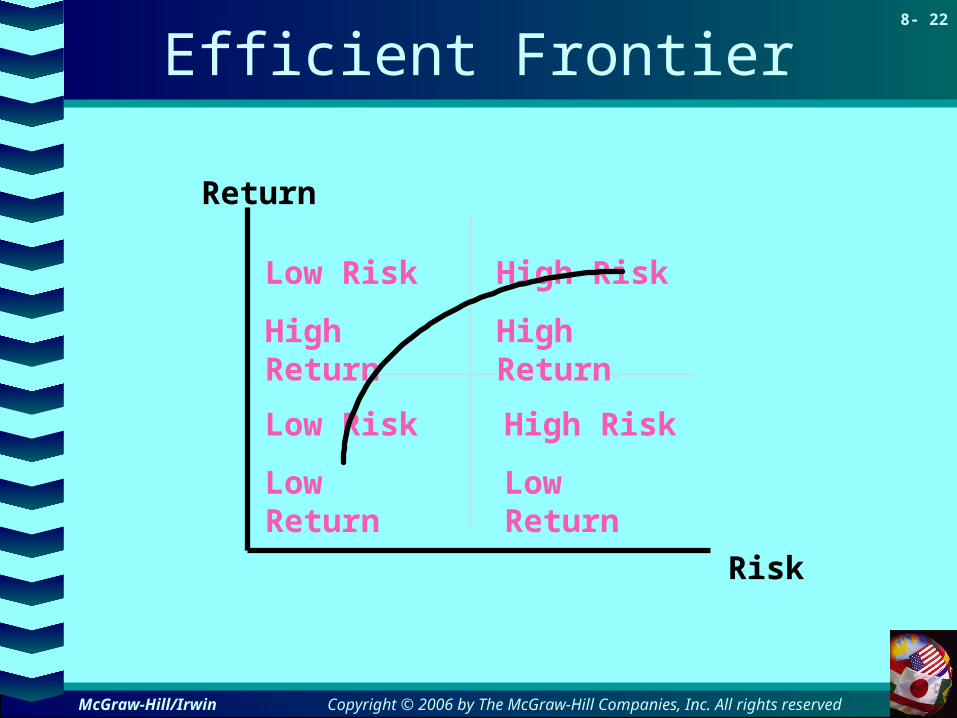
Efficient Frontier
Return
Risk
Low Risk
High Return
High Risk
High Return
Low Risk
Low Return
High Risk
Low Return

Copyright © 2006 by The McGraw-Hill Companies, Inc. All rights reserved
8- 23
McGraw-Hill/Irwin
Efficient Frontier
Return
Risk
A
BNABABN

Copyright © 2006 by The McGraw-Hill Companies, Inc. All rights reserved
8- 24
McGraw-Hill/Irwin
Security Market Line
Return
Risk
.
rf
Risk Free
Return =
Efficient Portfolio
Market Return = rm

Copyright © 2006 by The McGraw-Hill Companies, Inc. All rights reserved
8- 25
McGraw-Hill/Irwin
Security Market Line
Return
.
rf
Risk Free
Return =
Efficient Portfolio
Market Return = rm
BETA1.0

Copyright © 2006 by The McGraw-Hill Companies, Inc. All rights reserved
8- 26
McGraw-Hill/Irwin
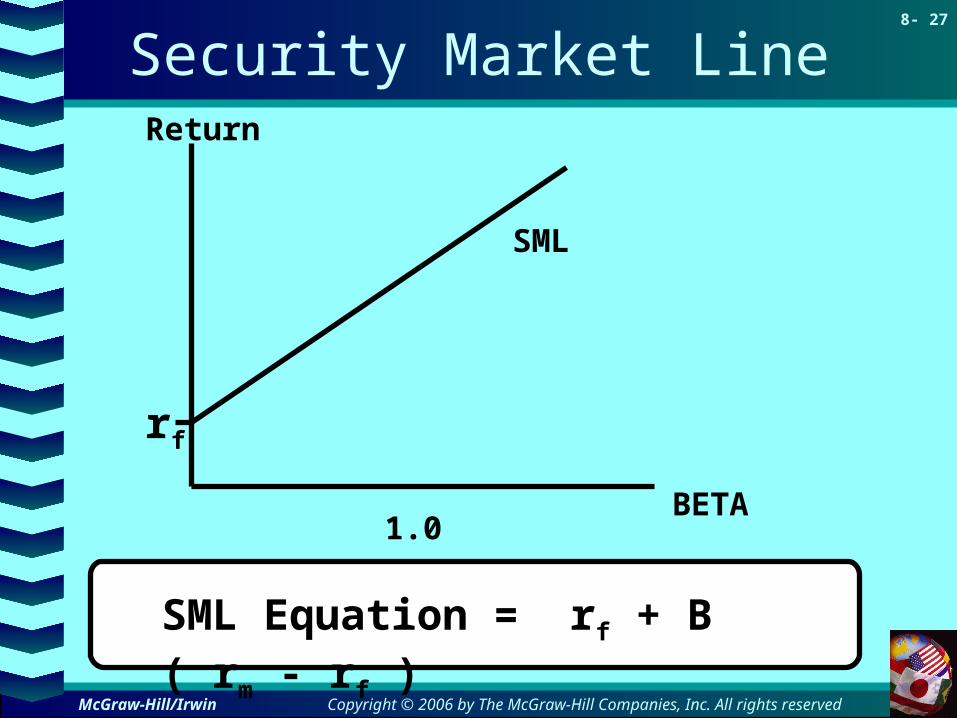
Security Market Line
Return
.
rf
Risk Free
Return =
BETA
Security Market Line (SML)
Copyright © 2006 by The McGraw-Hill Companies, Inc. All rights reserved
8- 27
McGraw-Hill/Irwin
Security Market LineReturn
BETA
rf
1.0
SML
SML Equation = rf + B ( rm - rf )

Copyright © 2006 by The McGraw-Hill Companies, Inc. All rights reserved
8- 28
McGraw-Hill/Irwin
Capital Asset Pricing Model
R = rf + B ( rm - rf )
CAPM

Copyright © 2006 by The McGraw-Hill Companies, Inc. All rights reserved
8- 29
McGraw-Hill/Irwin
Testing the CAPM
Avg Risk Premium 1931-2002
Portfolio Beta1.0
SML30
20
10
0
Investors
Market Portfolio
Beta vs. Average Risk Premium

Copyright © 2006 by The McGraw-Hill Companies, Inc. All rights reserved
8- 30
McGraw-Hill/Irwin
Testing the CAPM
Avg Risk Premium 1931-65
Portfolio Beta1.0
SML
30
20
10
0
Investors
Market Portfolio
Beta vs. Average Risk Premium

Copyright © 2006 by The McGraw-Hill Companies, Inc. All rights reserved
8- 31
McGraw-Hill/Irwin
Testing the CAPM
Avg Risk Premium 1966-2002
Portfolio Beta1.0
SML
30
20
10
0
Investors
Market Portfolio
Beta vs. Average Risk Premium
Copyright © 2006 by The McGraw-Hill Companies, Inc. All rights reserved
8- 32
McGraw-Hill/Irwin
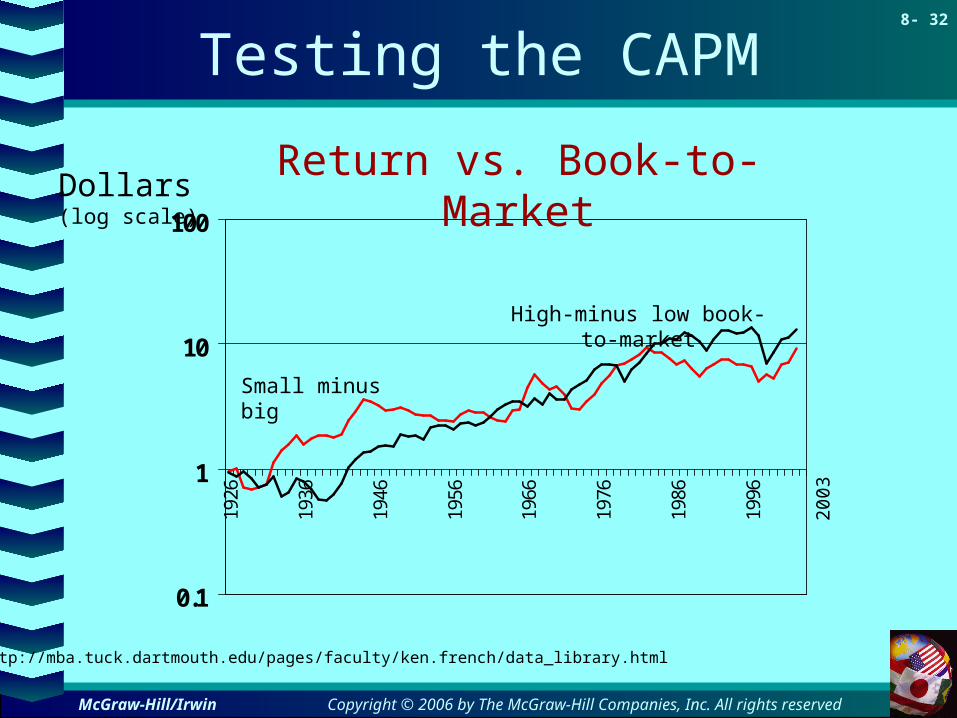
Testing the CAPM
0.1
1
10
10019
26
1936
1946
1956
1966
1976
1986
1996
High-minus low book-to-market
Return vs. Book-to-MarketDollars(log scale)
Small minus big
http://mba.tuck.dartmouth.edu/pages/faculty/ken.french/data_library.html
200
3

Copyright © 2006 by The McGraw-Hill Companies, Inc. All rights reserved
8- 33
McGraw-Hill/Irwin
Consumption Betas vs Market Betas
Stocks (and other risky assets)
Wealth = marketportfolio
Market risk makes wealth
uncertain.
Stocks (and other risky assets)
Consumption
Wealth
Wealth is uncertain
Consumption is uncertain
Standard
CAPM
Consumption
CAPM

Copyright © 2006 by The McGraw-Hill Companies, Inc. All rights reserved
8- 34
McGraw-Hill/Irwin
Arbitrage Pricing Theory
Alternative to CAPMAlternative to CAPM
Expected Risk
Premium = r - rf
= Bfactor1(rfactor1 - rf) + Bf2(rf2 - rf) + …
Return = a + bfactor1(rfactor1) + bf2(rf2) + …

Copyright © 2006 by The McGraw-Hill Companies, Inc. All rights reserved
8- 35
McGraw-Hill/Irwin
Arbitrage Pricing Theory
Estimated risk premiums for taking on risk factors
(1978-1990)
6.36Market
.83-Inflation
.49GNP Real
.59-rate Exchange
.61-rateInterest
5.10%spread Yield)(r
PremiumRisk EstimatedFactor
factor fr

Copyright © 2006 by The McGraw-Hill Companies, Inc. All rights reserved
8- 36
McGraw-Hill/Irwin
Web Resources
www.finance.yahoo.com/
www.duke.edu/~charvey
www.mba.tuck.dartmouth.edu/pages/faculty/ken.french
www.globalfindata.com
Click to access web sitesClick to access web sites
Internet connection requiredInternet connection required