Chapter 8. Parental responsibility: Decision-making about ...€¦ · 8 Parental responsibility:...
29
175 Evaluation of the 2006 family law reforms Parental responsibility: Decision-making about issues affecting the child and financial support 8 Parental responsibility: Decision- making about issues affecting the child and financial support This chapter examines the question of parental responsibility and the extent to which parents share such responsibility. 1 This chapter has three parts. In the first part, data from the Longitudinal Study of Separated Families Wave 1, conducted in 2008 (LSSF W1 2008), is used to address the following questions: ■ To what extent are decisions relating to the children’s long-term welfare shared equally between parents? ■ How is the exercise of decision-making responsibility related to the amount of time a parent spends with a child? ■ Is the family law pathway used to resolve parenting issues related to the likelihood of joint decision-making? In the second part, parental responsibility outcomes in orders made by consent and judicial determination are examined (using data from the quantitative analysis of court files). Key issues considered are: ■ Has there been a change in parental responsibility outcomes after the 2006 changes? ■ Are there differences in parental responsibility outcomes between courts? ■ Are there differences in parental responsibility outcomes between cases determined by judi- cial decision and those resolved by consent? ■ Is there a relationship between parental responsibility outcomes and allegations of violence or child abuse recorded in the court file? The third part concerns financial support. Data from the LSSF W1 2008 are used to address the following questions: ■ What is the nature of parents’ child support obligations, and to what extent are parents complying with these obligations? ■ To what extent are parents’ contributions to decision-making and their level of compliance with any financial support obligations related to care-time arrangements? The issue of parental responsibility is also dealt with elsewhere in this report. Chapter 9 pro- vides a detailed discussion of how the legislative provisions about parental responsibility and care time operate from the perspective of family lawyers and family relationship service profes- sionals. Chapter 15 discusses parental responsibility in legal decision-making. 8.1 Decision-making responsibilities In order to assess the extent to which the sharing of parental responsibility applies in practice, respondents in the LSSF W1 2008 were asked to indicate the relative contributions of each par- ent to decisions regarding four broad matters pertaining to their child: education, health care, 1 See the “big picture evaluation” questions concerning the proportion of parents who exercise shared parental responsibility (including shared decision-making on long-term issues) (2007 Evaluation Framework; see Appendix B), together with the questions concerning parental involvement and agreement under policy objectives 2 and 3.
Transcript of Chapter 8. Parental responsibility: Decision-making about ...€¦ · 8 Parental responsibility:...

175Evaluation of the 2006 family law reforms
Parental responsibility: Decision-making about issues affecting the child and financial support
8 Parental responsibility: Decision-making about issues affecting the
child and financial support
This chapter examines the question of parental responsibility and the extent to which parents share such responsibility.1 This chapter has three parts.
In the first part, data from the Longitudinal Study of Separated Families Wave 1, conducted in 2008 (LSSF W1 2008), is used to address the following questions:
■ To what extent are decisions relating to the children’s long-term welfare shared equally between parents?
■ How is the exercise of decision-making responsibility related to the amount of time a parent spends with a child?
■ Is the family law pathway used to resolve parenting issues related to the likelihood of joint decision-making?
In the second part, parental responsibility outcomes in orders made by consent and judicial determination are examined (using data from the quantitative analysis of court files). Key issues considered are:
■ Has there been a change in parental responsibility outcomes after the 2006 changes?
■ Are there differences in parental responsibility outcomes between courts?
■ Are there differences in parental responsibility outcomes between cases determined by judi-cial decision and those resolved by consent?
■ Is there a relationship between parental responsibility outcomes and allegations of violence or child abuse recorded in the court file?
The third part concerns financial support. Data from the LSSF W1 2008 are used to address the following questions:
■ What is the nature of parents’ child support obligations, and to what extent are parents complying with these obligations?
■ To what extent are parents’ contributions to decision-making and their level of compliance with any financial support obligations related to care-time arrangements?
The issue of parental responsibility is also dealt with elsewhere in this report. Chapter 9 pro-vides a detailed discussion of how the legislative provisions about parental responsibility and care time operate from the perspective of family lawyers and family relationship service profes-sionals. Chapter 15 discusses parental responsibility in legal decision-making.
8.1 Decision-making responsibilitiesIn order to assess the extent to which the sharing of parental responsibility applies in practice, respondents in the LSSF W1 2008 were asked to indicate the relative contributions of each par-ent to decisions regarding four broad matters pertaining to their child: education, health care,
1 See the “big picture evaluation” questions concerning the proportion of parents who exercise shared parental responsibility (including shared decision-making on long-term issues) (2007 Evaluation Framework; see Appendix B), together with the questions concerning parental involvement and agreement under policy objectives 2 and 3.

176 Australian Institute of Family Studies
Chapter 8
religion or cultural ties, and sporting or social activities.2 Decision-making relating to education issues was only asked about if the focus child was at least four years old.
Table 8.1 provides an overview of whether decisions relating to each of the four areas (taken separately) were mainly made by: (a) the mother, (b) the father, or (c) both parents equally. For each decision-making area, a small proportion of parents said that decisions were mainly made by whichever parent the child happens to be with at the time, or by someone else (e.g., a grandparent, uncle, sibling, or the child, where this child was older). In this chapter, the situation where decisions are being made equally by both parents is also referred as “shared decision-making”.
Table 8.1 Involvement of each parent in decision-making about focus child, mothers and fathers, 2008
Fathers Mothers All
% % %
Education (children 4+ years)Mainly mother 41.0 66.3 53.4Mainly father 10.3 4.3 7.4Both parents equally 46.3 28.0 37.3Other 2.5 1.4 1.9Total 100.1 100.0 100.0
Health careMainly mother 51.2 78.9 65.1Mainly father 9.3 2.4 5.8Both parents equally 33.5 16.2 24.8Other 5.9 2.6 4.3Total 99.9 100.1 100.0
Religion or cultural ties a
Mainly mother 37.1 64.0 50.9Mainly father 10.2 3.6 6.8Both parents equally 47.2 28.8 37.8Other 5.5 3.5 4.5Total 100.0 99.9 100.0
Sporting and social activitiesMainly mother 41.3 72.0 56.9Mainly father 12.5 3.3 7.8Both parents equally 39.0 20.8 29.8Other 7.3 3.9 5.6Total 100.1 100.0 100.1
Number of observations 4,983 5,019 10,002
Notes: a 10% of parents answered “don’t know” and 1% did not respond to the question—these parents are excluded from the analysis. It is likely that for many of the parents who answered “don’t know” to this question, it was because it was not an issue whether either parent made a decision as it was not relevant (e.g., no religion). The “other” category consists of the responses “whichever parent the child is with at the time” and “someone else”. Percentages may not total exactly 100.0% due to rounding.
Source: LSSF W1 2008
For all four decision-making areas, the majority of parents said that the decisions were mainly made by the mother or by both parents equally, with only a minority saying that the decisions
2 In the LSSF W1 2008, parents were asked: “Who is mostly involved in making decisions about …”. The issues raised were: [the child’s] education, health care for [the child], [the child’s] religious or cultural ties, and [the child’s] sporting and social activities. Response options were: (a) “mainly you”, (b) “mainly … [name or pseudonym of child’s other parent]”, (c) “both of you equally”, (d) “whichever parent the child is with at the time”, or (e) “someone else”. Parents who reported that someone else mainly made the decisions were asked to indicate who this person was.

177Evaluation of the 2006 family law reforms
Parental responsibility: Decision-making about issues affecting the child and financial support
were mainly made by the father. The following proportions of parents (mothers and fathers combined) indicated that each parent contributed equally to decision-making:
■ 37% for decisions about education;
■ 25% for decisions about health care;
■ 38% for decisions about religion or cultural ties; and
■ 30% for decisions about sporting and social activities.
However, only 15% of parents indicated that decisions in all four areas were made jointly. It is clear that shared parental decision-making is not exercised for the majority of children post-separation.
Overall, mothers were more likely than fathers to say that the mother mainly made the deci-sions (Table 8.1). For example, 66% of mothers and 41% of fathers said that the mother mainly made the decisions about the child’s education. Fathers were more likely than mothers to say that decisions concerning education were made by both parents equally (reported by 46% of fathers and 28% of mothers), with only 10% of fathers and 4% of mothers saying that these deci-sions were mainly made by the father.
8.1.1 Decision-making and care-time arrangements
This section provides information on the relationship between care-time arrangement and deci-sion-making responsibility in each of the areas.
Figure 8.1 shows the proportion of fathers with each care-time arrangement who reported that decision-making is shared equally between the parents. Trends for each of the four areas of decision-making are presented. Figure 8.2 provides the same information from the mothers’ perspectives.
20
40
60
80
100
Percentage of nights per annum that focus child spent with each parent
Mother 100% & father
never sees
Mother 66–99% & father 1–34%
Equal time
48–52%
Mother 1–34% & father 66–99%
Mother never sees & father 100%
Mother 100% &
father sees daytime only
Mother 53–65% & father 35–47%
Mother 35–47% & father 53–65%
Mother sees daytime only
& father 100%
Perc
enta
ge
0
EducationHealth care Sporting/social activities
Religious/cultural ties
Source: LSSF W1 2008
Figure 8.1 Proportion of fathers who said that both parents were equally involved in decision-making about the focus child for each issue, by care-time arrangements, 2008

178 Australian Institute of Family Studies
Chapter 8
20
40
60
80
100
Percentage of nights per annum that focus child spent with each parent
Mother 100% & father
never sees
Mother 66–99% & father 1–34%
Equal time
48–52%
Mother 1–34% & father 66–99%
Mother never sees & father 100%
Mother 100% &
father sees daytime only
Mother 53–65% & father 35–47%
Mother 35–47% & father 53–65%
Mother sees daytime only
& father 100%
Perc
enta
ge
0
EducationHealth care Sporting/social activities
Religious/cultural ties
Source: LSSF W1 2008
Figure 8.2 Proportion of mothers who said that both parents were equally involved in decision-making about the focus child for each issue, by care-time arrangements, 2008
It is clear that the more equal the care time of each parent, the more likely were mothers and fa-thers to indicate that decision-making was shared equally. That is, across the four decision-mak-ing areas, the proportions of fathers and mothers who said that both parents contributed equally in decisions increased as the proportion of nights the child spent with the father increased from nil (and in fact never seeing the child), reaching a peak when care time was shared equally. The proportion of fathers and mothers reporting that decision-making was shared equally then decreased progressively as the child saw less of the mother. For example, 79% of fathers with equal care time reported that both parents contributed equally to decision-making on educa-tion about the focus child, while 63–73% of fathers with shared care time where the child spent more nights with one parent and fewer than 43% of fathers with other care-time arrangements said that decisions regarding the child’s education were made jointly. Among mothers, shared decision-making on education was reported by 66% of those with equal care time (48–52% of nights), 47% of those where the child lived 35–47% of nights with one parent and 53–65% of nights with the other parent, and fewer than 38% of mothers with other care-time arrangements.
The greater the care time of mothers, relative to fathers, the more likely were mothers to be seen as the main decision-maker. Figure 8.3 shows the proportion of fathers with each care-time arrangement who reported that decisions were mainly made by the child’s mother, while Figure 8.4 shows the relationship between mothers’ reports on this issue and their care-time arrangements. Using decisions about the child’s education as an example, fewer than 10% of fathers and mothers whose focus child was mostly in the care of the father said that the mother was mainly responsible for making decisions, compared with 52–87% of fathers and 73–95% of mothers whose child was in the care of the mother for 66% or more of nights.
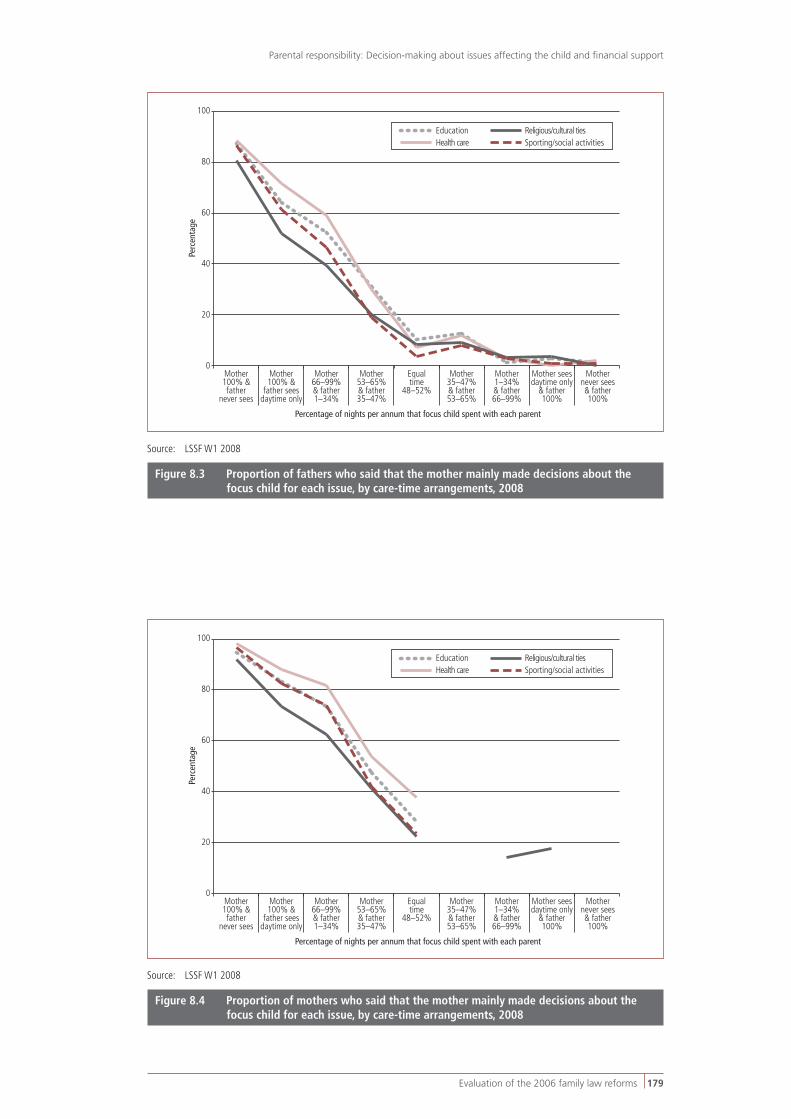
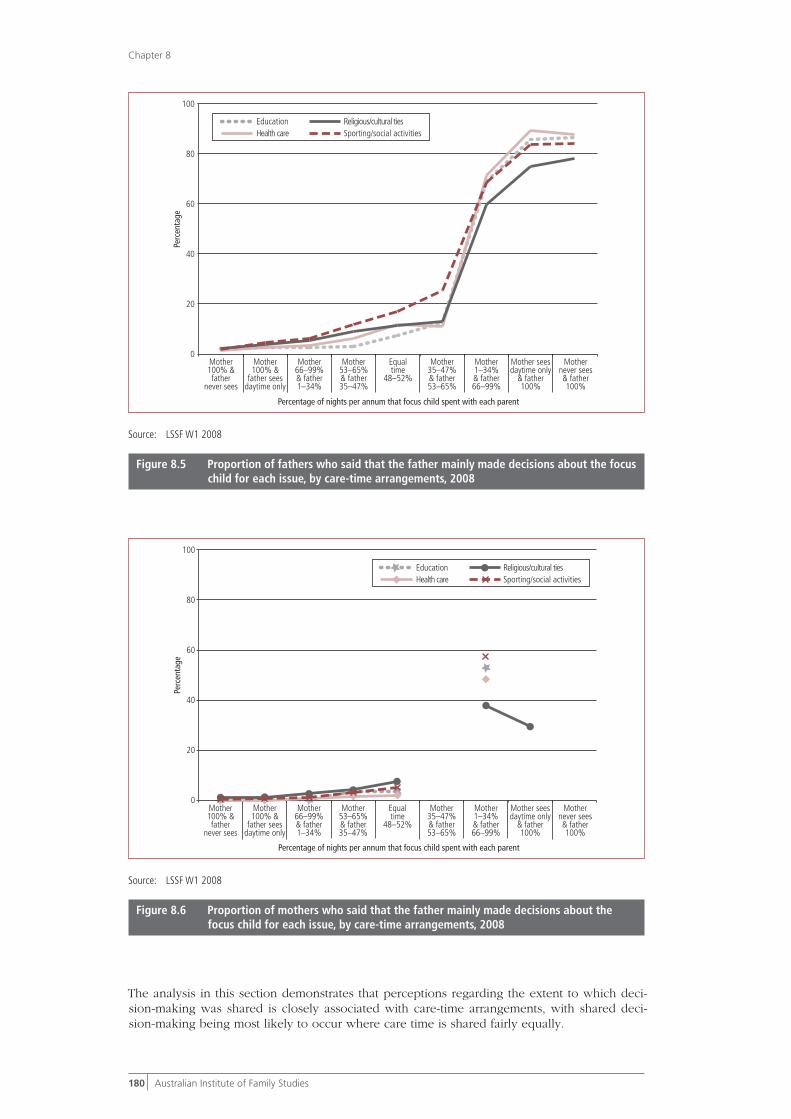
Figures 8.5 and 8.6 show the relationship between care-time arrangements and reports that the father mainly made decisions regarding each of the four areas, from the perspectives of fathers and mothers respectively.
179Evaluation of the 2006 family law reforms
Parental responsibility: Decision-making about issues affecting the child and financial support
EducationHealth care Sporting/social activities
Religious/cultural ties
20
40
60
80
100
Percentage of nights per annum that focus child spent with each parent
Mother 100% & father
never sees
Mother 66–99% & father 1–34%
Equal time
48–52%
Mother 1–34% & father 66–99%
Mother never sees & father 100%
Mother 100% &
father sees daytime only
Mother 53–65% & father 35–47%
Mother 35–47% & father 53–65%
Mother sees daytime only
& father 100%
Perc
enta
ge
0
Source: LSSF W1 2008
Figure 8.3 Proportion of fathers who said that the mother mainly made decisions about the focus child for each issue, by care-time arrangements, 2008
EducationHealth care Sporting/social activities
Religious/cultural ties
20
40
60
80
100
Percentage of nights per annum that focus child spent with each parent
Mother 100% & father
never sees
Mother 66–99% & father 1–34%
Equal time
48–52%
Mother 1–34% & father 66–99%
Mother never sees & father 100%
Mother 100% &
father sees daytime only
Mother 53–65% & father 35–47%
Mother 35–47% & father 53–65%
Mother sees daytime only
& father 100%
Perc
enta
ge
0
Source: LSSF W1 2008
Figure 8.4 Proportion of mothers who said that the mother mainly made decisions about the focus child for each issue, by care-time arrangements, 2008
180 Australian Institute of Family Studies
Chapter 8
EducationHealth care Sporting/social activities
Religious/cultural ties
20
40
60
80
100
Percentage of nights per annum that focus child spent with each parent
Mother 100% & father
never sees
Mother 66–99% & father 1–34%
Equal time
48–52%
Mother 1–34% & father 66–99%
Mother never sees & father 100%
Mother 100% &
father sees daytime only
Mother 53–65% & father 35–47%
Mother 35–47% & father 53–65%
Mother sees daytime only
& father 100%
Perc
enta
ge
0
Source: LSSF W1 2008
Figure 8.5 Proportion of fathers who said that the father mainly made decisions about the focus child for each issue, by care-time arrangements, 2008
20
40
60
80
100
Percentage of nights per annum that focus child spent with each parent
Mother 100% & father
never sees
Mother 66–99% & father 1–34%
Equal time
48–52%
Mother 1–34% & father 66–99%
Mother never sees & father 100%
Mother 100% &
father sees daytime only
Mother 53–65% & father 35–47%
Mother 35–47% & father 53–65%
Mother sees daytime only
& father 100%
Perc
enta
ge
0
EducationHealth care Sporting/social activities
Religious/cultural ties
Source: LSSF W1 2008
Figure 8.6 Proportion of mothers who said that the father mainly made decisions about the focus child for each issue, by care-time arrangements, 2008
The analysis in this section demonstrates that perceptions regarding the extent to which deci-sion-making was shared is closely associated with care-time arrangements, with shared deci-sion-making being most likely to occur where care time is shared fairly equally.
181Evaluation of the 2006 family law reforms
Parental responsibility: Decision-making about issues affecting the child and financial support
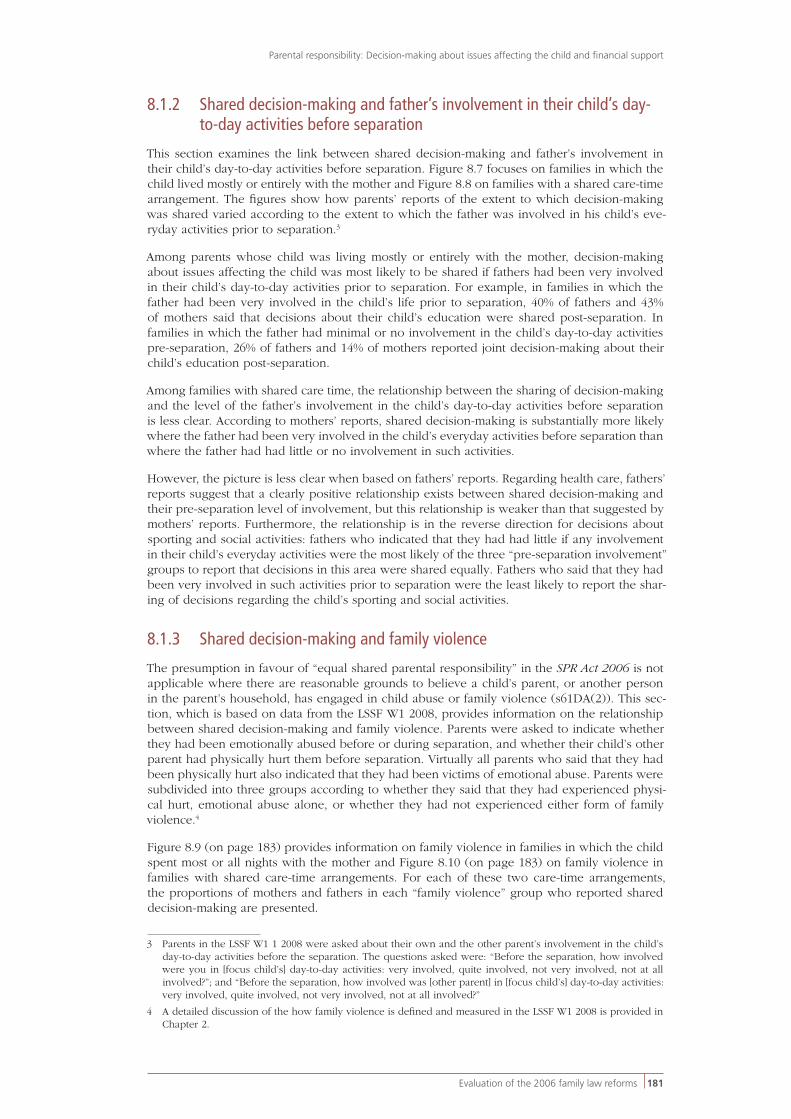
8.1.2 Shared decision-making and father’s involvement in their child’s day-to-day activities before separation
This section examines the link between shared decision-making and father’s involvement in their child’s day-to-day activities before separation. Figure 8.7 focuses on families in which the child lived mostly or entirely with the mother and Figure 8.8 on families with a shared care-time arrangement. The figures show how parents’ reports of the extent to which decision-making was shared varied according to the extent to which the father was involved in his child’s eve-ryday activities prior to separation.3
Among parents whose child was living mostly or entirely with the mother, decision-making about issues affecting the child was most likely to be shared if fathers had been very involved in their child’s day-to-day activities prior to separation. For example, in families in which the father had been very involved in the child’s life prior to separation, 40% of fathers and 43% of mothers said that decisions about their child’s education were shared post-separation. In families in which the father had minimal or no involvement in the child’s day-to-day activities pre-separation, 26% of fathers and 14% of mothers reported joint decision-making about their child’s education post-separation.
Among families with shared care time, the relationship between the sharing of decision-making and the level of the father’s involvement in the child’s day-to-day activities before separation is less clear. According to mothers’ reports, shared decision-making is substantially more likely where the father had been very involved in the child’s everyday activities before separation than where the father had had little or no involvement in such activities.
However, the picture is less clear when based on fathers’ reports. Regarding health care, fathers’ reports suggest that a clearly positive relationship exists between shared decision-making and their pre-separation level of involvement, but this relationship is weaker than that suggested by mothers’ reports. Furthermore, the relationship is in the reverse direction for decisions about sporting and social activities: fathers who indicated that they had had little if any involvement in their child’s everyday activities were the most likely of the three “pre-separation involvement” groups to report that decisions in this area were shared equally. Fathers who said that they had been very involved in such activities prior to separation were the least likely to report the shar-ing of decisions regarding the child’s sporting and social activities.
8.1.3 Shared decision-making and family violence
The presumption in favour of “equal shared parental responsibility” in the SPR Act 2006 is not applicable where there are reasonable grounds to believe a child’s parent, or another person in the parent’s household, has engaged in child abuse or family violence (s61DA(2)). This sec-tion, which is based on data from the LSSF W1 2008, provides information on the relationship between shared decision-making and family violence. Parents were asked to indicate whether they had been emotionally abused before or during separation, and whether their child’s other parent had physically hurt them before separation. Virtually all parents who said that they had been physically hurt also indicated that they had been victims of emotional abuse. Parents were subdivided into three groups according to whether they said that they had experienced physi-cal hurt, emotional abuse alone, or whether they had not experienced either form of family violence.4
Figure 8.9 (on page 183) provides information on family violence in families in which the child spent most or all nights with the mother and Figure 8.10 (on page 183) on family violence in families with shared care-time arrangements. For each of these two care-time arrangements, the proportions of mothers and fathers in each “family violence” group who reported shared decision-making are presented.
3 Parents in the LSSF W1 1 2008 were asked about their own and the other parent’s involvement in the child’s day-to-day activities before the separation. The questions asked were: “Before the separation, how involved were you in [focus child’s] day-to-day activities: very involved, quite involved, not very involved, not at all involved?”; and “Before the separation, how involved was [other parent] in [focus child’s] day-to-day activities: very involved, quite involved, not very involved, not at all involved?”
4 A detailed discussion of the how family violence is defined and measured in the LSSF W1 2008 is provided in Chapter 2.

182 Australian Institute of Family Studies
Chapter 8
Figures 8.9 and 8.10 suggest that shared decision-making was most likely where there had been no physical or emotional abuse, and least likely where respondents had been physically hurt. However, differences in the extent of shared decision-making between those who reported physical violence and those who reported emotional abuse alone are relatively small. These patterns were apparent regardless of the gender of respondents or care-time arrangements.
Again using decisions about the child’s education as an example, among parents whose child spent most or all nights with the mother, shared decision-making was reported by:
■ 49% of fathers and 31% of mothers who indicated that they had not been subjected to either physical or emotional abuse;
0
20
40
60
80
100
Fathers Mothers
Father very involved
Father quite involved
Father not very/not at all involved
Father very involved
Father quite involved
Father not very/not at all involved
EducationHealth care Sporting/social activities
Religious/cultural ties
Perc
enta
ge
Source: LSSF W1 2008
Figure 8.7 Shared decision-making, by level of pre-separation involvement of the father in their child’s life, parents with focus child living mostly/entirely with mother (66–100%), 2008
EducationHealth care Sporting/social activities
Religious/cultural ties
0
20
40
60
80
100
Fathers Mothers
Father very involved
Father quite involved
Father not very/not at all involved
Father very involved
Father quite involved
Father not very/not at all involved
Perc
enta
ge
Source: LSSF W1 2008
Figure 8.8 Shared decision-making, by level of pre-separation involvement of the father in their child’s life, parents with focus child in shared care time (35–65%), 2008

183Evaluation of the 2006 family law reforms
Parental responsibility: Decision-making about issues affecting the child and financial support
■ 31% of fathers and 18% of mothers who said that their child’s other parent had emotionally abused them but had not hurt them physically; and
■ 25% of fathers and 15% of mothers who said that their child’s other parent had hurt them physically.
Among parents providing shared care-time arrangements, shared decision-making about the education of the child was reported by:
■ 82% of fathers and 76% of mothers who said that they had not experienced either form of family violence;
EducationHealth care Sporting/social activities
Religious/cultural ties
0
20
40
60
80
100
Fathers Mothers
Perc
enta
ge
No violence reported
Emotional abuse alone
Physical hurt No violence reported
Emotional abuse alone
Physical hurt
Source: LSSF W1 2008
Figure 8.9 Shared decision-making, by reports of family violence, parents with focus child living mostly/entirely with mother (66–100%), 2008
EducationHealth care Sporting/social activities
Religious/cultural ties
0
20
40
60
80
100
Fathers Mothers
Perc
enta
ge
No violence reported
Emotional abuse alone
Physical hurt No violence reported
Emotional abuse alone
Physical hurt
Source: LSSF W1 2008
Figure 8.10 Shared decision-making, by reports of family violence, parents with focus child in shared care time (35–65%), 2008

184 Australian Institute of Family Studies
Chapter 8
■ 66% of fathers and 53% of mothers who reported the experience of emotional abuse alone; and
■ 54% of fathers and 42% of mothers who reported the experience of physical hurt.
Nevertheless, the proportion of parents who had experienced family violence who reported that decision-making was shared is relatively high, given their experience.
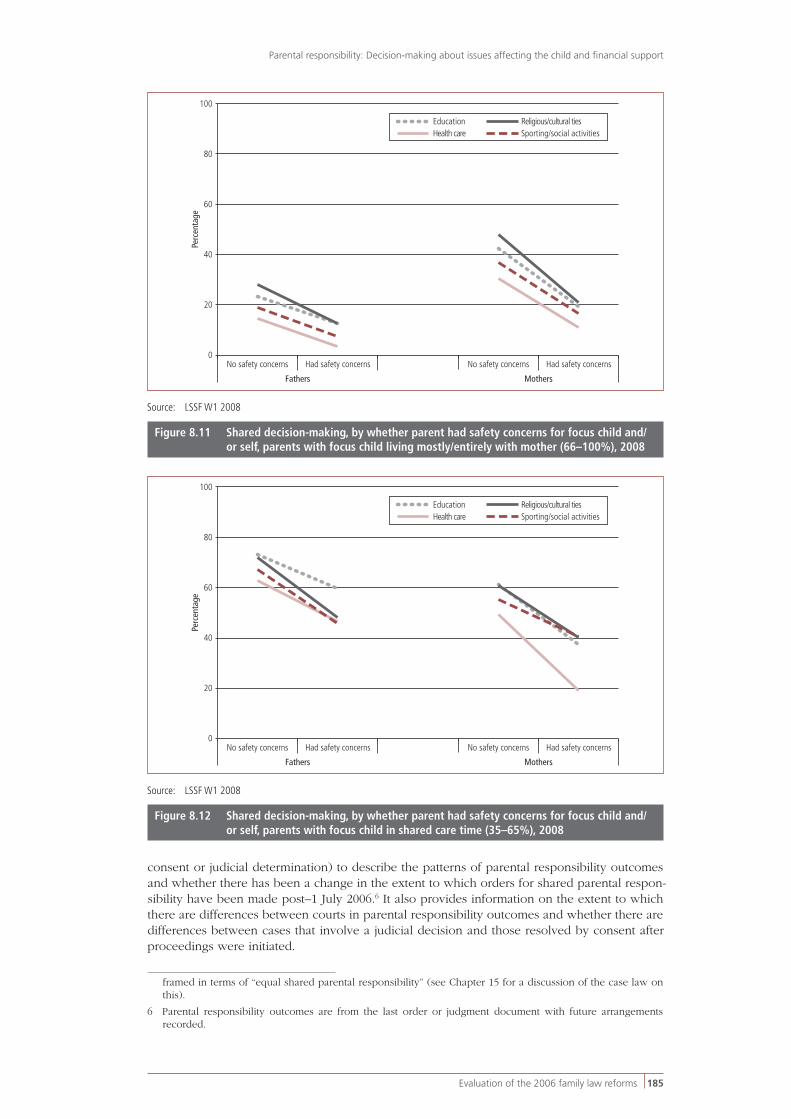
8.1.4 Shared decision-making and safety concernsIn the LSSF W1 2008, parents were asked whether they held any concerns about their child’s safety or their own safety as a result of ongoing contact with their child’s other parent. The specific question on safety concerns identified whether the concerns related to the respondent alone, the focus child alone, or both respondent and child. Those who reported that they held such concerns were also asked to indicate whether their concerns related to contact with the child’s other parent, the new partner of that parent, another adult, and/or another child.
Figures 8.11 and 8.12 show that shared decision-making was much less likely to be reported by parents who held safety concerns than by other parents. This pattern holds irrespective of care-time arrangements and the gender of respondent. However, in families with shared care time, this trend is stronger in the reports of mothers than fathers.
Using education decisions as an example, among mothers with shared care-time arrangements, joint decision-making was reported by 37% who held safety concerns for the child and/or them-selves, compared with 61% who indicated that they did not hold such concerns. Among fathers with shared care-time arrangements, 60% who held such safety concerns and 73% who did not hold such concerns said that decision-making was shared.
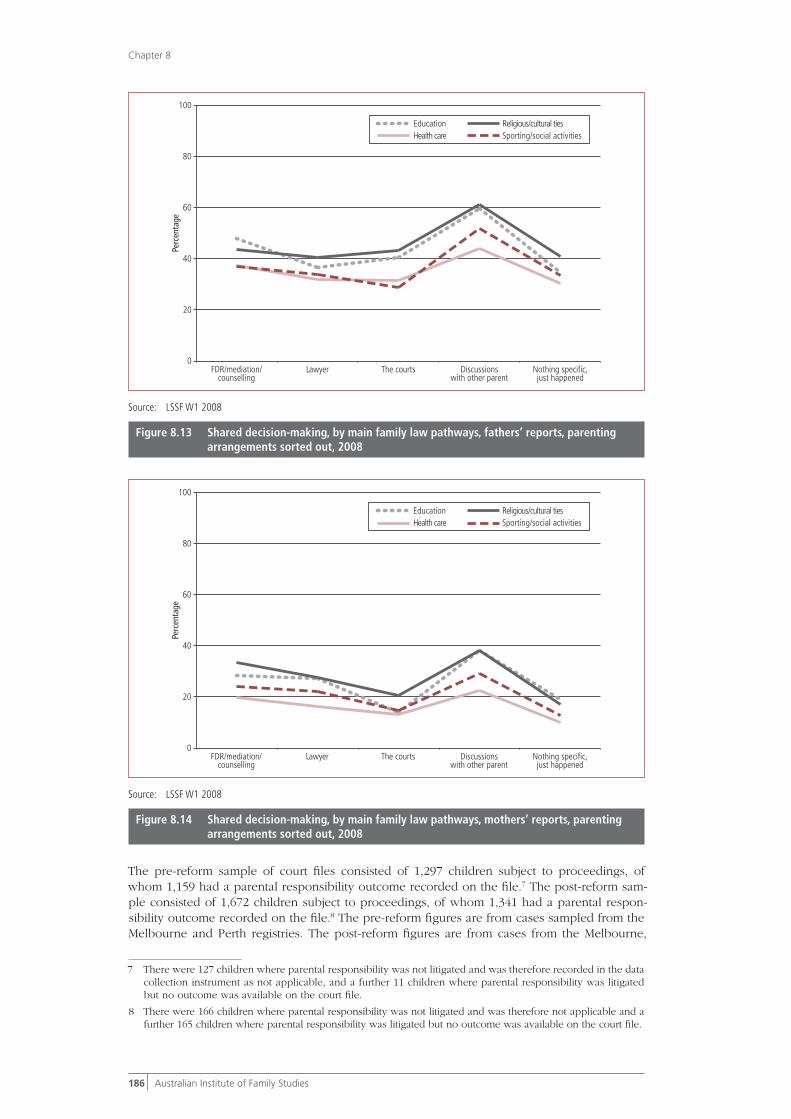
8.1.5 Shared decision-making and family law pathwaysParents in the LSSF W1 2008 were asked whether they had sorted out their parenting arrange-ments, and if they had done so, they were asked to indicate whether they had mainly achieved this through: (a) counselling, mediation or dispute resolution services; (b) a lawyer; (c) the courts; (d) discussions with the other parent; (e) nothing specific, it just happened; or (f) some-thing else (in which case, parents were asked to specify the process adopted). Few parents indicated that the last of these alternative options applied. This analysis is restricted to parents who indicated that they had sorted out their arrangements (reported by 71% of fathers and 73% of mothers). Figure 8.13 (on page 186) shows the proportions of fathers who reported shared decision-making, according to the main family law pathway they used to sort out their parent-ing arrangements. Figure 8.14 (on page 186) provides this information for mothers.
The parents who were most likely to report shared decision-making were those who indicated that they had mainly sorted out their arrangements through discussions with their child’s other parent. For example, shared decision-making about education was reported by 60% of fathers who said that they finalised their parenting arrangements mainly through discussions with their child’s other parent, compared with between 35% and 49% of fathers who said that they had reached agreement mainly through other means. Among mothers, shared decision-making about education was reported by 38% of those who indicated that they had reached agreement mainly through discussions with other parent, compared with 14% to 29% of mothers who said that they had mainly used other means to sort out their arrangements.
While parents who indicated that they had managed to sort out their parenting arrangements between themselves were more likely than other parents to indicate that decision-making was shared, very little difference in the extent of shared decision-making was apparent for the other family law pathways used to sort out parenting arrangements.
8.1.6 Parental responsibility: Patterns in court filesAs described in Chapter 1, the SPR Act 2006 changed the legislative provisions that guide deter-minations about parental responsibility. A key change was the introduction of a presumption in favour of equal shared parental responsibility (s61DA). This section uses data from the analy-sis of court files (FCoA, FMC and FCoWA) on parental responsibility orders5 (made either by
5 As outlined in Chapter 1, prior to 1 July 2006, the legislation (and consequently court orders) was framed as orders for “joint parental responsibility”. Since 1 July 2006, orders for parental responsibility have been mostly
185Evaluation of the 2006 family law reforms
Parental responsibility: Decision-making about issues affecting the child and financial support
consent or judicial determination) to describe the patterns of parental responsibility outcomes and whether there has been a change in the extent to which orders for shared parental respon-sibility have been made post–1 July 2006.6 It also provides information on the extent to which there are differences between courts in parental responsibility outcomes and whether there are differences between cases that involve a judicial decision and those resolved by consent after proceedings were initiated.
framed in terms of “equal shared parental responsibility” (see Chapter 15 for a discussion of the case law on this).
6 Parental responsibility outcomes are from the last order or judgment document with future arrangements recorded.
0
20
40
60
80
100
No safety concerns Had safety concerns No safety concerns Had safety concerns
Fathers Mothers
EducationHealth care Sporting/social activities
Religious/cultural ties
Perc
enta
ge
Source: LSSF W1 2008
Figure 8.11 Shared decision-making, by whether parent had safety concerns for focus child and/or self, parents with focus child living mostly/entirely with mother (66–100%), 2008
0
20
40
60
80
100
No safety concerns Had safety concerns No safety concerns Had safety concerns
Fathers Mothers
EducationHealth care Sporting/social activities
Religious/cultural ties
Perc
enta
ge
Source: LSSF W1 2008
Figure 8.12 Shared decision-making, by whether parent had safety concerns for focus child and/or self, parents with focus child in shared care time (35–65%), 2008
186 Australian Institute of Family Studies
Chapter 8
The pre-reform sample of court files consisted of 1,297 children subject to proceedings, of whom 1,159 had a parental responsibility outcome recorded on the file.7 The post-reform sam-ple consisted of 1,672 children subject to proceedings, of whom 1,341 had a parental respon-sibility outcome recorded on the file.8 The pre-reform figures are from cases sampled from the Melbourne and Perth registries. The post-reform figures are from cases from the Melbourne,
7 There were 127 children where parental responsibility was not litigated and was therefore recorded in the data collection instrument as not applicable, and a further 11 children where parental responsibility was litigated but no outcome was available on the court file.
8 There were 166 children where parental responsibility was not litigated and was therefore not applicable and a further 165 children where parental responsibility was litigated but no outcome was available on the court file.
0
20
40
60
80
100
FDR/mediation/counselling
Lawyer The courts Discussionswith other parent
Nothing specific,just happened
Perc
enta
ge
EducationHealth care Sporting/social activities
Religious/cultural ties
Source: LSSF W1 2008
Figure 8.13 Shared decision-making, by main family law pathways, fathers’ reports, parenting arrangements sorted out, 2008
0
20
40
60
80
100
FDR/mediation/counselling
Lawyer The courts Discussionswith other parent
Nothing specific,just happened
Perc
enta
ge
EducationHealth care Sporting/social activities
Religious/cultural ties
Source: LSSF W1 2008
Figure 8.14 Shared decision-making, by main family law pathways, mothers’ reports, parenting arrangements sorted out, 2008

187Evaluation of the 2006 family law reforms
Parental responsibility: Decision-making about issues affecting the child and financial support
Perth, Brisbane and Sydney registries. The sensitivity of the estimates to the inclusion of more registries for the post-reform estimates has been tested by comparing the pattern of parental responsibility outcomes from just the Melbourne and Perth registries with the patterns when ar-rangements from all registries are considered. The estimates from the restricted sample are simi-lar to those derived when all of the registries are used. We therefore use the data from all of the registries when examining the extent to which parent responsibility outcomes have changed.
There is evidence of an increase in shared responsibility outcomes following the 2006 reforms. Pre-reform, 76% of cases recorded were for shared parental responsibility, increasing to 87% post-reform (Table 8.2). Interestingly, there was little change in the proportion of parental re-sponsibility orders that were “sole to mother” or “sole to father” (see Chapter 15 for a discussion providing examples of the kinds of cases in which courts will make orders for sole parental responsibility). Most of the increase in shared parental responsibility outcomes is a result of a decrease in the “other” category.
Table 8.2 Parental responsibility outcomes, pre– and post–1 July 2006
Pre-reform Post-reform
% %
Shared parental responsibility 76.3 86.5
Sole to mother 10.3 8.2
Sole to father 3.6 1.6
Other 9.8 3.6
Total 100.0 99.9
Number of children 1,159 1,341
Notes: The shared parental responsibility category includes a small number of cases where there was shared parental responsibility with exceptions (less than 1%). The “other” category includes sole to maternal grandparent, sole to paternal grandparent or sole to other relatives, along with a small proportion of orders—both mother and father—in the post-reform sample. Sample restricted to cases in which a parental responsibility outcome was applicable and the outcome recorded on file. Weighted percentages. Percentages may not total exactly 100.0% due to rounding.
Source: FCoA, FMC and FCoWA court files
Both pre- and post-reform, a shared parental responsibility order is less likely in cases that are resolved by judicial determination than those resolved by consent (Table 8.3). For example, post-reform, 56% of cases decided by judicial determination had a shared parental responsibil-ity outcome, compared to 91% of cases resolved by consent. There was an increase in shared parental responsibility outcomes for both judicial determination and consent cases.
Table 8.3 Parental responsibility outcomes, judicial determination and consent, pre– and post–1 July 2006
Judicial determination Consent
Pre-reform Post-reform Pre-reform Post-reform
% %
Shared parental responsibility 44.0 56.1 79.9 90.9
Sole to mother 27.8 28.2 8.3 5.4
Sole to father 10.3 6.2 2.9 0.9
Other 17.9 9.4 8.8 2.8
Total 100.0 99.9 99.9 100.0
Number of children 251 222 908 1,119
Notes: The shared parental responsibility category includes a small number of cases where there was shared parental responsibility with exceptions (less than 1%). The “other” category includes sole to maternal grandparent, sole to paternal grandparent or sole to other relatives, along with a small proportion of orders—both mother and father—in the post-reform sample. Sample restricted to cases in which a parental responsibility outcome was applicable and the outcome recorded on file. Weighted percentages. Percentages may not total exactly 100.0% due to rounding.
Source: FCoA, FMC and FCoWA court files
188 Australian Institute of Family Studies
Chapter 8
There has been little change in the extent to which there are sole to mother parental responsi-bility orders and some decrease in sole to father outcomes, particularly in cases that are judi-cially determined.
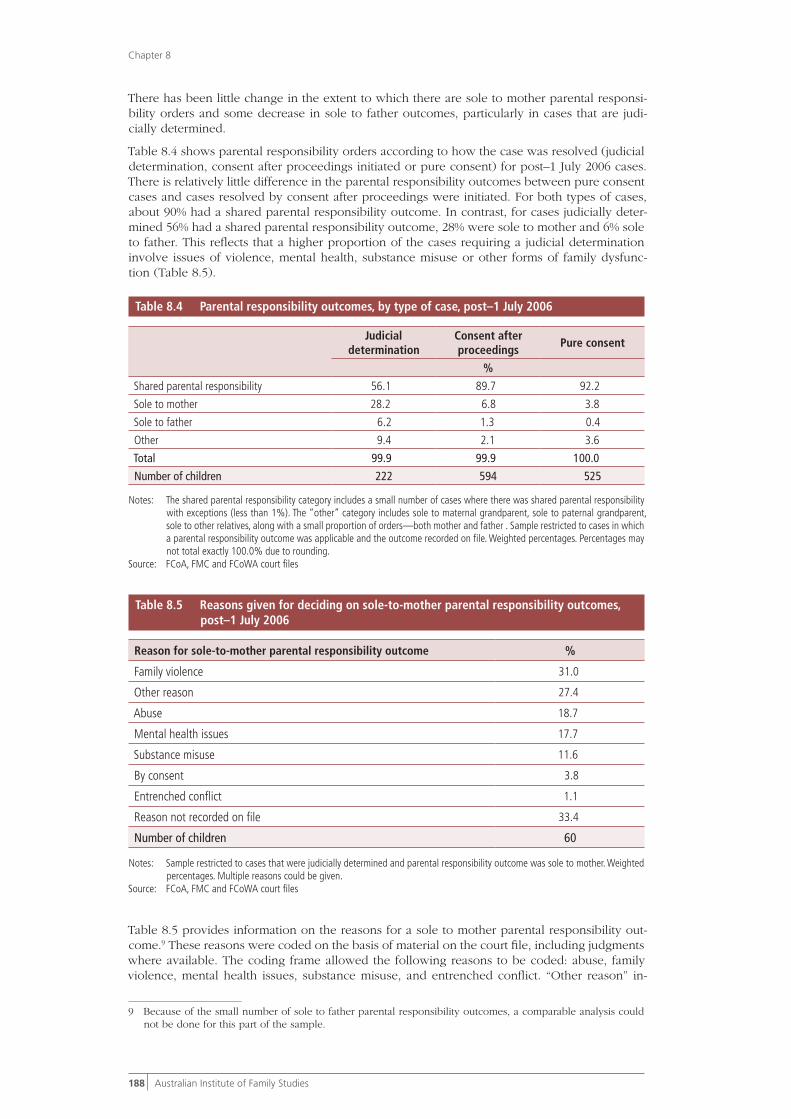
Table 8.4 shows parental responsibility orders according to how the case was resolved (judicial determination, consent after proceedings initiated or pure consent) for post–1 July 2006 cases. There is relatively little difference in the parental responsibility outcomes between pure consent cases and cases resolved by consent after proceedings were initiated. For both types of cases, about 90% had a shared parental responsibility outcome. In contrast, for cases judicially deter-mined 56% had a shared parental responsibility outcome, 28% were sole to mother and 6% sole to father. This reflects that a higher proportion of the cases requiring a judicial determination involve issues of violence, mental health, substance misuse or other forms of family dysfunc-tion (Table 8.5).
Table 8.4 Parental responsibility outcomes, by type of case, post–1 July 2006
Judicial determination
Consent after proceedings
Pure consent
%
Shared parental responsibility 56.1 89.7 92.2
Sole to mother 28.2 6.8 3.8
Sole to father 6.2 1.3 0.4
Other 9.4 2.1 3.6
Total 99.9 99.9 100.0
Number of children 222 594 525
Notes: The shared parental responsibility category includes a small number of cases where there was shared parental responsibility with exceptions (less than 1%). The “other” category includes sole to maternal grandparent, sole to paternal grandparent, sole to other relatives, along with a small proportion of orders—both mother and father . Sample restricted to cases in which a parental responsibility outcome was applicable and the outcome recorded on file. Weighted percentages. Percentages may not total exactly 100.0% due to rounding.
Source: FCoA, FMC and FCoWA court files
Table 8.5 Reasons given for deciding on sole-to-mother parental responsibility outcomes, post–1 July 2006
Reason for sole-to-mother parental responsibility outcome %
Family violence 31.0
Other reason 27.4
Abuse 18.7
Mental health issues 17.7
Substance misuse 11.6
By consent 3.8
Entrenched conflict 1.1
Reason not recorded on file 33.4
Number of children 60
Notes: Sample restricted to cases that were judicially determined and parental responsibility outcome was sole to mother. Weighted percentages. Multiple reasons could be given.
Source: FCoA, FMC and FCoWA court files
Table 8.5 provides information on the reasons for a sole to mother parental responsibility out-come.9 These reasons were coded on the basis of material on the court file, including judgments where available. The coding frame allowed the following reasons to be coded: abuse, family violence, mental health issues, substance misuse, and entrenched conflict. “Other reason” in-
9 Because of the small number of sole to father parental responsibility outcomes, a comparable analysis could not be done for this part of the sample.

189Evaluation of the 2006 family law reforms
Parental responsibility: Decision-making about issues affecting the child and financial support
cluded a range of issues, including situations in which a father had either initiated proceedings and then failed to pursue them or had failed to respond to proceedings issued by the mother. The data reported in Table 8.5 demonstrate that family violence and abuse were the most com-mon reasons underlying a sole to mother parental responsibility order.
In our sample of court files, the FCoA had a higher proportion of cases resolved by consent compared with cases in the FMC and FCoWA.10 As consent cases were more likely to have a shared parental responsibility outcome than cases that were judicially determined, differences in parental responsibility outcomes between the courts were further analysed for those files with a judicial determination.11 As shown in Table 8.6, there were differences in the pattern of parental responsibility outcomes for children in cases that were judicially determined, with the FCoA having the highest proportion of sole parental responsibility orders. Where orders of sole parental responsibility were made, in both the FCoA and FMC judicial determination sample, the majority were made in favour of mothers—38% in the FCoA and 26% in the FMC. In both of these courts, a small minority of such orders were made in favour of fathers, 8% in the FCoA and 4% in the FMC.
Table 8.6 Parental responsibility outcomes in files judicially determined, by court, post–1 July 2006
FCoA FMC FCoWA
%
Shared parental responsibility 44.9 60.0 66.1
Sole to mother 38.1 25.9 12.1
Sole to father 8.2 4.2 13.3
Other 8.7 9.8 8.6
Total 99.9 99.9 100.1
Number of children 49 111 62
Notes: The shared parental responsibility category includes a small number of cases where there was shared parental responsibility with exceptions (less than 1%). The “other” category includes sole to maternal grandparent, sole to paternal grandparent, sole to other relatives, along with a small proportion of orders—both mother and father. Sample restricted to cases in which a parental responsibility outcome was applicable and the outcome recorded on file. Weighted percentages. Percentages may not total exactly 100.0% due to rounding.
Source: FCoA, FMC and FCoWA court files
A more even spread of sole parental responsibility was evident in the FCoWA, with 12% of mothers and 13% of fathers in the judicial determination sample being awarded sole parental responsibility.
While there is some relationship between an allegation of family violence or child abuse being made in proceedings and an outcome other than shared parental responsibility, even in cases with allegations of family violence or child abuse, in the majority of cases there is a shared parental responsibility outcome (Table 8.7). For example, in cases with no allegations, 90% have a shared parental responsibility outcome, compared to 76% of cases where both family violence and child abuse are alleged, 80% of cases where family violence alone is alleged and 72% of cases where child abuse alone is alleged. Generally, where there is an allegation of fam-ily violence or child abuse and an order for sole parental responsibility is made, the order is sole to mother.
Table 8.8 shows parental responsibility outcomes by the age of the child. The most striking feature of this table is that there is apparently no relationship between the age of the child and shared parental responsibility outcomes.
10 In the FCoA, 55% of cases were pure consent cases, compared with 42% in the FCoWA and 13% in the FMC.
11 Overall, little difference was found in parental responsibility outcomes between the courts. In the FCoA, 89% of children had an outcome of shared parental responsibility. The corresponding proportions in the FMC was 85% and 83% in the FCoWA.

190 Australian Institute of Family Studies
Chapter 8
Table 8.7 Parental responsibility outcomes, by allegation of violence or child abuse, judicially determined and consent after proceedings cases, post–1 July 2006
Allegation of family violence or child abuseNo
allegationBoth family violence and child abuse
Family violence only
Child abuse only
% %
Shared parental responsibility 75.8 79.6 71.9 89.8
Sole to mother 14.0 18.5 18.0 4.9
Sole to father 4.0 1.0 4.4 1.8
Other 6.3 0.9 5.6 3.4
Total 100.1 100.0 99.9 99.9
Number of children 140 152 129 395
Notes: The shared parental responsibility category includes a small number of cases where there was shared parental responsibility with exceptions (less than 1%). The “other” category includes sole to maternal grandparent, sole to paternal grandparent, sole to other relatives, and orders—both mother and father. Sample restricted to cases in which a parental responsibility outcome was applicable and the outcome recorded on file. Weighted percentages. “Family violence” defined as parent’s assertion of either family violence—sexual, family violence—physical, family violence—emotional/psychological/threatened, or family violence order. “Child abuse” defined as a claim of either need to protect child from physical harm, need to protect child from sexual harm, need to protect child from emotional/psychological harm, need to protect child from neglect or need to protect child from witnessing family violence. Percentages may not total exactly 100.0% due to rounding.
Source: FCoA, FMC and FCoWA court files
Table 8.8 Parental responsibility outcome, by age of child, post–1 July 2006
0–2 years 3–4 years 5–11 years 12–14 years 15–19 years
%
Shared parental responsibility 85.6 82.1 86.9 89.1 88.5
Sole to mother 10.5 10.5 7.8 7.0 6.8
Sole to father 1.7 2.6 1.5 1.3 0.1
Other 2.1 4.8 3.8 2.5 4.7
Total 99.9 100.0 100.0 99.9 100.1
Number of children 132 198 739 192 80
Notes: The shared parental responsibility category includes a small number of cases where there was shared parental responsibility with exceptions (less than 1%). The “other” category includes sole to maternal grandparent, sole to paternal grandparent, sole to other relatives, and orders—both mother and father. Sample restricted to cases in which a parental responsibility outcome was applicable and the outcome recorded on file. Weighted percentages. Percentages may not total exactly 100.0% due to rounding.
Source: FCoA, FMC and FCoWA court files
8.1.7 SummaryThis analysis has examined parents’ reports about shared decision-making in relation to chil-dren, and court orders concerning shared parental responsibility. The parent data show that parents’ practices concerning shared decision-making are contingent on a number of issues, including the amount of care time a parent spends with a child. The trend in formal legal ar-rangements show that most parents retain parental responsibility under court orders, with this being removed only in a minority of (usually litigated) cases where issues such as child abuse and family violence are of concern.12
The analysis of separated parents’ views about whether decisions affecting their child are made unilaterally or shared by both parents clearly demonstrates that the exercise of parental re-sponsibility is closely linked with the parents’ care-time arrangements. The greater the sharing of care time, the more likely it was that parents would make joint decisions, although those
12 For cases that deal with this point, see: Re B and B: Family Law Reform Act 1995 (1997) 21 FamLR 676 ¶ 3.12, and W and W [2006] FCWA 103 ¶ 23.

191Evaluation of the 2006 family law reforms
Parental responsibility: Decision-making about issues affecting the child and financial support
who had a minority of care nights were more likely than those with a majority of care nights to believe that decision-making was shared. In addition, the parents’ reports suggest that the sharing of decisions about the child was more likely to occur where the father had been very involved in their child’s everyday activities before separation, and where parenting arrange-ments had been sorted out mainly through discussions between the parents themselves, rather than through the use of family relationship services, lawyers or the courts. Finally, the sharing of decision-making was less likely to occur where there had been a history of family violence or where one parent was concerned about personal safety or the child’s safety linked with ongoing contact with the other parent. At the same time, a substantial proportion of parents who reported a history of family violence or expressed ongoing safety concerns were in shared care-time arrangements and indicated that decision-making was shared.
The data from court files on parental responsibility shows that orders for shared parental re-sponsibility accounted for the majority of parental responsibility orders both prior to and after the reforms. Matters requiring judicial determination were less likely to result in shared parental responsibility orders being made than matters resolved by consent. This is true both before and after the reforms and reflects the complex nature of matters that proceed to judicial determina-tion and the extent to which concerns about family violence and child abuse are relevant in such matters.
The following section focuses on another key area of parental responsibility: the provision of financial support for children. Among other matters, this next section includes an assessment of the extent to which compliance with child support liability is related to the key issues examined in the present section: the sharing of decision-making and care-time arrangements.
8.2 Financial support for children post-separationThe Child Support Scheme (CSS), which was established in 1988, was designed to ensure that non-resident parents contributed to the financial support of their children following separation. This was in response to evidence of low rates of compliance with child support payments and low levels of amounts paid.13
As outlined in Chapter 1, a number of changes have been made to the CSS since its introduction, the most significant of which were introduced in the Child Support Amendment Act 2006. These most recent reforms were designed to better reflect the costs of children, the income of both parents (with each parent’s income being treated equally), and the costs incurred by parents when the children are in their direct care. There has also been an increased emphasis on the enforcement of child support obligations.
In its 2005 report, In the Best Interests of Children: Reforming the Child Support Scheme, the Ministerial Taskforce on Child Support (2005) noted that:
child support policy can no longer just be concerned with enforcing the financial obli-gations of reluctant non-resident parents. Ensuring the payment of child support is one part of a bigger picture of encouraging the continuing involvement of both parents in the upbringing of their children. (p. 1)
While the present evaluation is not about the changes to the CSS, it does consider the interac-tions between the CSS and the 2006 changes to the family law system. Using data from the LSSF W1 2008, this section examines parents’:
■ compliance with their CSS obligations—whether payments are made in full and on time; and
■ views about the fairness or unfairness of the amount paid.
The new Child Support Formula took effect from 1 July 2008. The LSSF W1 2008 was conducted between August and October 2008—that is, just after the new formula took effect. This was therefore a transitional period for many parents and their responses to the questions about child support may have been affected by this transitional period. The second wave of the LSSF
13 Early research by AIFS suggested that, before the introduction of the CSS, fewer than one resident mother in three received regular maintenance payments for their children (McDonald & Weston, 1986), with single divorced mothers being the most likely to receive regular payments (36%) and never-married mothers being the least likely (9%). Of divorced resident parents who received maintenance for two children, the average amount received was just over $20 per week per child (Harrison & Tucker, 1986).

192 Australian Institute of Family Studies
Chapter 8
W1, being conducted in the second half of 2009, will provide data on child support more than 12 months after the new formula came into effect.
It is important to keep in mind that the sample for the LSSF W1 2008 was drawn from parents who had registered with the Child Support Agency (CSA). (It includes private collection and CSA collect cases.)
8.2.1 Child support payment liability
While all the parents in the LSSF W1 2008 were registered with the CSA, a proportion of parents said that they were neither supposed to pay nor receive child support.14
Eighty per cent of fathers said that they were supposed to pay child support and 5% indicated that they were supposed to receive it. The reverse pattern was evident for mothers, with 80% reporting that they were to receive child support and 4% indicating that they were to pay it. Fifteen per cent of fathers and 17% of mothers said that child support payments were not meant to be transferred between the parents (i.e., there was no payment transfer liability).
Figure 8.15 shows the proportion of fathers and mothers with different care-time arrangements who indicated that child support payments were supposed to be transferred from the father to the mother. Across all care-time groups, the proportion of fathers reporting that they were sup-posed to pay child support was similar to the proportion of mothers reporting that they were supposed to receive child support.
Father payersMother payees
20
40
60
80
100
Percentage of nights per annum that focus child spent with each parent
Mother 100% & father
never sees
Mother 66–99% & father 1–34%
Equal time
48–52%
Mother 1–34% & father 66–99%
Mother never sees & father 100%
Mother 100% &
father sees daytime only
Mother 53–65% & father 35–47%
Mother 35–47% & father 53–65%
Mother sees daytime only
& father 100%
Perc
enta
ge
0
Note: The number of mothers responding to the LSSF W1 2008 with whom the child spent 1–47% of nights or who never saw the child was too small to provide statistically reliable estimates and are therefore excluded from the figure.
Source: LSSF W1 2008
Figure 8.15 Liability of fathers to pay child support to mothers, by care-time arrangement, fathers’ and mothers’ reports, 2008
14 In the LSSF W1 2008, parents were asked the following question: “Do you currently pay any child support to, or receive any child support from, [the focus child’s other parent]?” Interviewers were instructed as follows: (a)
“Pay includes ‘should pay’ and receive includes ‘should receive’”; and (b) “If both pay and receive ask, ‘Do you pay more or receive more?’ Only use ‘both’ if the amounts are equal or cancel each other out.” There is no guarantee that all respondents answered this question in terms of child support transfer liabilities rather than transfers that occurred in practice. That is, some respondents may have answered in terms of whether actual transfers took place. Nevertheless, it is assumed here that most respondents answered in terms of payment liability rather than practice.

193Evaluation of the 2006 family law reforms
Parental responsibility: Decision-making about issues affecting the child and financial support
Where the child was in the care of the mother most or all nights, most fathers and mothers indi-cated that the mother was supposed to receive child support. There was little difference in the pattern of reports provided by parents whose child never saw the father, saw him during the daytime only, or spent a minority of nights with him. The proportion of parents who indicated child support payments were to be transferred from father to mother gradually fell as the nights that the child spent with the father increased beyond 34% of nights.15 This pattern reflects the Child Support Formula, which recognises the costs of care time once parents have their children staying with them for 14% or more of nights.
Specifically, the proportions of parents who reported that the father had a liability to pay child support to the mother were:
■ 87% of fathers and 79% of mothers where the child never saw the father;
■ 90–91% of fathers and 87% of mothers whose child had daytime-only contact with the father or spent the majority of nights (66% or more) with the mother;
■ 80% of fathers and 73% of mothers with shared care time involving more nights with the mother;
■ 60% of fathers and 54% of mothers with equal shared care;
■ 51% of fathers with shared care involving more nights with the father; and
■ fewer than 14% of fathers who cared for their child most or all nights, and fewer than 14% of mothers who saw their child during the daytime only. (The fact that mothers with these care-time arrangements were receiving child support may reflect the possibility that their child support payments had lagged behind changes in care-time arrangements.)16
Figure 8.16 shows the proportion of mothers and fathers who said that the mother was liable to pay child support to the father. As expected, very few fathers were to receive child support where the child lived mostly with the mother. The proportion of fathers who were liable to receive child support was higher where the child spent equal time with each parent than where the child spent most or all the care time with the mother. However, even when the child spent equal care time with each parent or had shared arrangements involving more nights with the father than mother, the proportion of fathers who indicated that the mother was liable to pay the father was quite small (8% and 13% respectively). The liability for the mother to pay the father increased as the father’s level of care time increased beyond 65% of nights. In fact, 61% of fathers whose child never saw the mother indicated that the mother was supposed to pay child support.
It is worth noting that the likelihood of fathers being liable to pay child support when the child was mostly in the care of the mother was considerably greater than the likelihood of mothers being liable to pay child support when the child was mostly in the care of the father. This dif-ference possibly reflects differences in the financial circumstances of fathers and mothers with these care-time arrangements, as outlined in Chapter 7, or that mothers were more likely than fathers to have other children from the relationship living with them.
15 Percentages were not derived for mothers for three care-time arrangements (mothers with shared time involving more nights with the father than mother; mothers with minority time; and mothers who never saw their child) because there were fewer than 40 mothers who indicated that they had these care-time arrangements and who provided information on child support transfers. These sample sizes are too small to enable derivation of statistically reliable estimates.
16 Another possible reason is that these mothers were more likely to have other children from the relationship living with them, which would influence their overall child support liability. Although parents were asked about child support liability with reference to the focus child, some parents may have misunderstood the question and answered in relation to all children from the relationship, leading to some degree of response error.

194 Australian Institute of Family Studies
Chapter 8
Father payeesMother payers
20
40
60
80
100
Percentage of nights per annum that focus child spent with each parent
Mother 100% & father
never sees
Mother 66–99% & father 1–34%
Equal time
48–52%
Mother 1–34% & father 66–99%
Mother never sees & father 100%
Mother 100% &
father sees daytime only
Mother 53–65% & father 35–47%
Mother 35–47% & father 53–65%
Mother sees daytime only
& father 100%
Perc
enta
ge
0
Note: The number of mothers responding to the LSSF W1 2008 with whom the child spent 1–34% of nights or who never saw the child was too small to provide statistically reliable estimates and are therefore excluded from the figure.
Source: LSSF W1 2008
Figure 8.16 Receipt of child support by fathers, by care-time arrangement, mothers’ and fathers’ reports, 2008
8.2.2 Reports on compliance with child support payment liabilityThis section shows the extent to which parents who were liable to pay child support met their obligations, according to the reports of parents in the LSSF W1 2008.17
Table 8.9 shows the extent to which child support obligations were met fully, in terms of amount only, time only, or neither condition. For simplicity, those who were liable to pay child support are called payers, and those who were liable to receive child support are called payees, regardless of whether child support transfers actually took place.
A relatively high proportion of father payers indicated that they fully complied with their child support obligations (74%). A further 18% of father payers said they complied fully with the amount of payment but that such payments were not always made on time, while 6% said that they paid on time but did not always pay the full amount, and only 2% indicated that they neither paid in full nor on time.
Mother payees painted a much less favourable picture. Only 51% said that they received the amount of child support they were supposed to receive in full and on time. A further 29% said that they received the full amount but not always on time, and 7% said they received child sup-port payments on time, but the amount was less than they were supposed to receive. Another 13% of mother payees said that they neither received the full amount of child support they were supposed to receive nor did they receive payments on time. Parents who said that they did not receive the full amount may not have received any child support.
Partial compliance was more likely to reflect child support transfer delays rather than reduc-tions in the amount of payment. Specifically, 18% of father payers and 29% of mother payees
17 Compliance with child support liability here refers to: (a) whether the amount of child support that is paid is equivalent to (or exceeds) the amount the parent is supposed to pay; and (b) whether the payments are made on time. Compliance regarding the amount paid was derived from parents’ reports of both the actual amount paid and the assessed amount to be paid, while compliance in relation to timing of payment was based on parents’ reports about whether the total amount of child support was paid: “always on time”, “mostly on time”, “sometimes on time”, “rarely on time” or “never on time”. Compliance regarding the payment of child support overall was derived based on these two sets of information: “complied both in amount and on time”;
“complied only in amount”; “complied only on time”; and “complied neither in amount or on time”.

195Evaluation of the 2006 family law reforms
Parental responsibility: Decision-making about issues affecting the child and financial support
indicated that payments were made in full but not on time, and 6% of father payers and 7% of mother payees indicated that payments were made on time but not in full.
As implied above, father payers were more likely than mother payees to report full compliance (74% compared to 51%) and less likely to report no compliance at all (2% compared to 13%). Mother payees were more likely than father payers to report that payment was delayed (29% compared to 18%), while much the same proportions of father payers and mother payees indi-cated that payment was reduced (6–7%).
Mother payers were less likely to report compliance with their child support obligations (59% reported fully complying with their obligations) than were father payers (74% reported fully complying). Only a small proportion of mothers are child support payers and the lower rate of reported compliance may reflect a more accurate reporting of compliance or it may reflect that this group of mothers, as shown in Chapter 7, is quite different from father payers (in terms of mental health and substance misuse and other aspects of dysfunction).
The tendency for payers to paint a more favourable picture than payees was also apparent among father payees and mother payers. Mother payers were more likely than father payees to report full compliance, while father payees were more likely than mother payers to report no compliance at all.
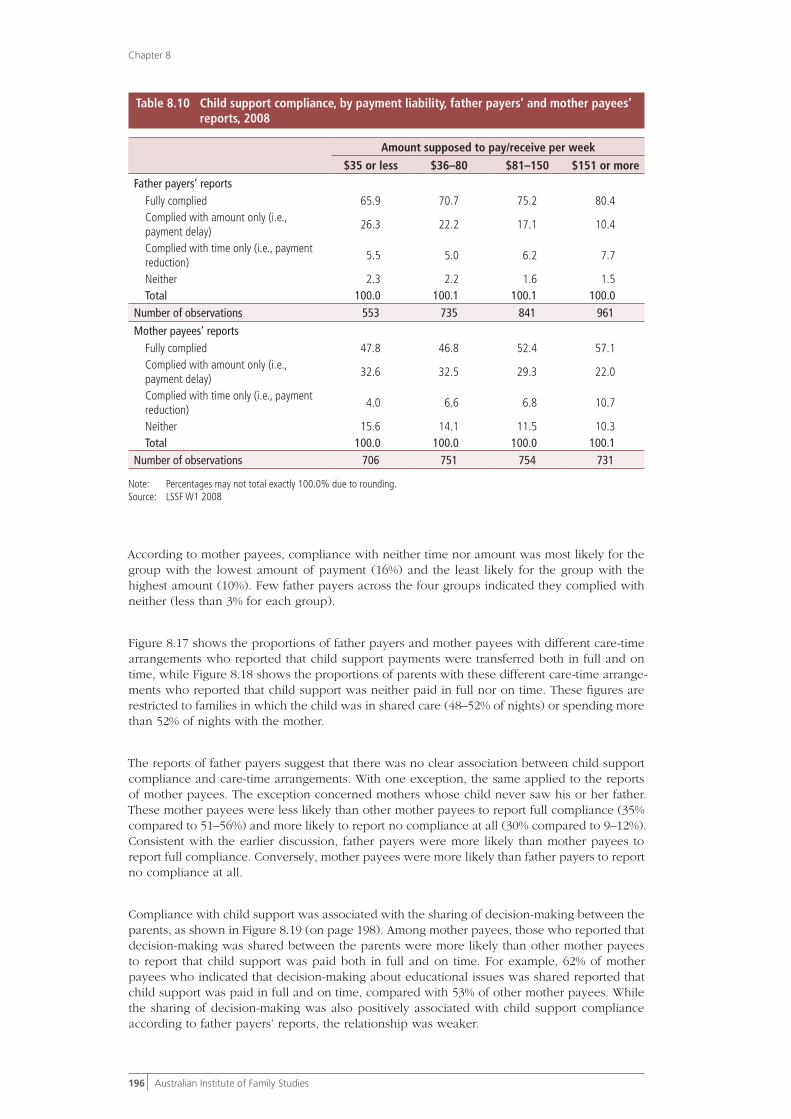
Table 8.10 shows the extent to which father payers complied with their obligations, as reported by these fathers and by mother payees. According to the reports of both father payers and mother payees, the larger the amount of child support the higher the rate of compliance with the child support obligations. Two-thirds of fathers with the obligation to pay $35 or less per week reported that they had paid in full and on time, compared with 71–75% of fathers with a $36–$150 payment per week, and 80% of fathers who needed to pay $151 or more per week. Similarly, 57% of mother payees who were supposed to receive at least $151 per week reported that they had received the payment in full and on time compared to 52% of mothers who were supposed to received $81–$150 per week and 47–48% of mothers who were supposed to re-ceive $80 or less per week.
The smaller the amount of child support, the more likely it was that father payers did not pay on time. About a quarter of father payers with a payment of $35 or less per week reported that they paid in full but not always on time while 10% of fathers who were supposed to pay at least $151 per week reported this. Similarly, one-third of mothers who were supposed to receive $80 or less each week indicated that the payment was received in full but not always on time, compared with 22% of mothers who were supposed to receive at least $151 each week.
While few father payers and mother payees indicated that the payment was transferred always on time but not in full amount (i.e., at a reduced amount), it appears that reduction of child support payment was more likely to occur when the amount was higher, though the differences were small. The proportion of parents who reported that payment was transferred always on time but not in full ranged from 5% for the group with the lowest amount of payment ($35 or less per week) to 8% for the group with the highest amount ($151 or more per week), accord-ing to father payers, and from 4% for the groups with the lowest amount of payment to 11% for the group with the highest amount according to mother payees’ reports.
Table 8.9 Child support compliance, by liability status and gender of parent, 2008
Fathers Mothers
Payers Payees Payers Payees
% %
Fully complied 73.6 49.5 59.1 50.9
Complied with amount only (i.e., payment delay)
18.4 21.9 22.9 29.2
Complied with time only (i.e., payment reduction)
6.2 7.7 6.0 7.0
Neither 1.8 20.9 12.0 12.9
Total 100.0 100.0 100.0 100.0
Number of observations 3,090 251 195 2,942
Source: LSSF W1 2008
196 Australian Institute of Family Studies
Chapter 8
According to mother payees, compliance with neither time nor amount was most likely for the group with the lowest amount of payment (16%) and the least likely for the group with the highest amount (10%). Few father payers across the four groups indicated they complied with neither (less than 3% for each group).
Figure 8.17 shows the proportions of father payers and mother payees with different care-time arrangements who reported that child support payments were transferred both in full and on time, while Figure 8.18 shows the proportions of parents with these different care-time arrange-ments who reported that child support was neither paid in full nor on time. These figures are restricted to families in which the child was in shared care (48–52% of nights) or spending more than 52% of nights with the mother.
The reports of father payers suggest that there was no clear association between child support compliance and care-time arrangements. With one exception, the same applied to the reports of mother payees. The exception concerned mothers whose child never saw his or her father. These mother payees were less likely than other mother payees to report full compliance (35% compared to 51–56%) and more likely to report no compliance at all (30% compared to 9–12%). Consistent with the earlier discussion, father payers were more likely than mother payees to report full compliance. Conversely, mother payees were more likely than father payers to report no compliance at all.
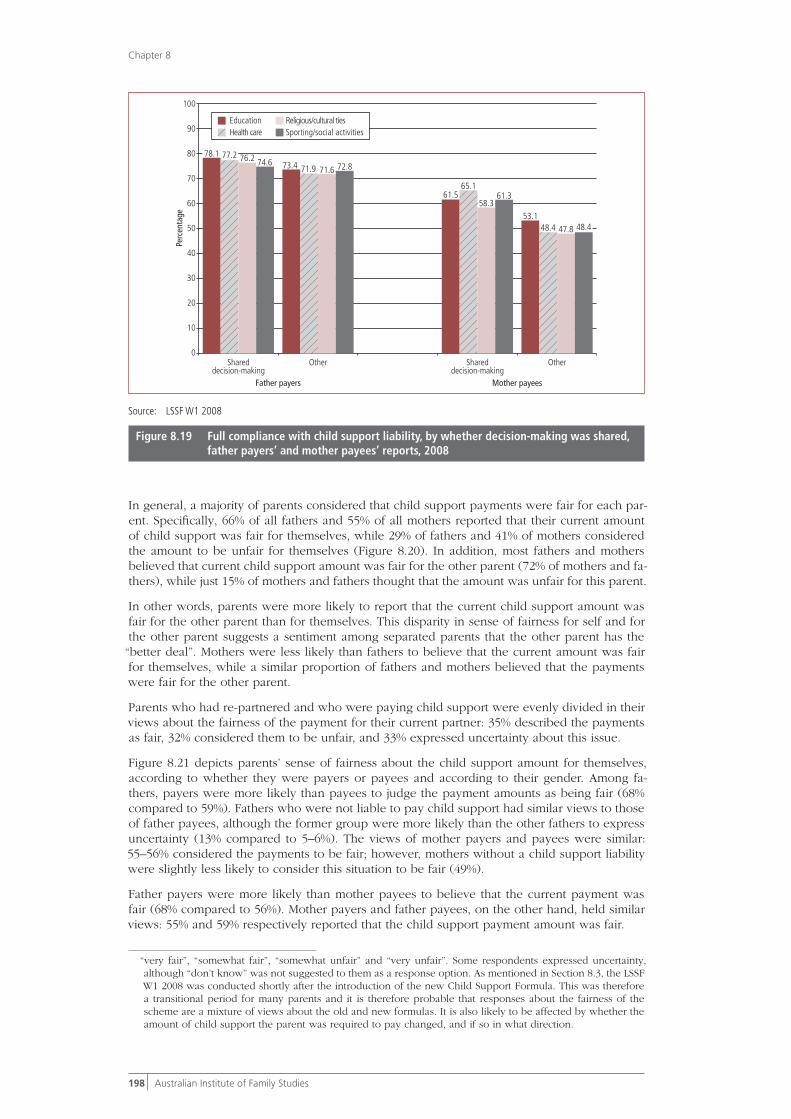
Compliance with child support was associated with the sharing of decision-making between the parents, as shown in Figure 8.19 (on page 198). Among mother payees, those who reported that decision-making was shared between the parents were more likely than other mother payees to report that child support was paid both in full and on time. For example, 62% of mother payees who indicated that decision-making about educational issues was shared reported that child support was paid in full and on time, compared with 53% of other mother payees. While the sharing of decision-making was also positively associated with child support compliance according to father payers’ reports, the relationship was weaker.
Table 8.10 Child support compliance, by payment liability, father payers’ and mother payees’ reports, 2008
Amount supposed to pay/receive per week
$35 or less $36–80 $81–150 $151 or more
Father payers’ reportsFully complied 65.9 70.7 75.2 80.4Complied with amount only (i.e., payment delay)
26.3 22.2 17.1 10.4
Complied with time only (i.e., payment reduction)
5.5 5.0 6.2 7.7
Neither 2.3 2.2 1.6 1.5Total 100.0 100.1 100.1 100.0
Number of observations 553 735 841 961
Mother payees’ reportsFully complied 47.8 46.8 52.4 57.1Complied with amount only (i.e., payment delay)
32.6 32.5 29.3 22.0
Complied with time only (i.e., payment reduction)
4.0 6.6 6.8 10.7
Neither 15.6 14.1 11.5 10.3Total 100.0 100.0 100.0 100.1
Number of observations 706 751 754 731
Note: Percentages may not total exactly 100.0% due to rounding.Source: LSSF W1 2008

197Evaluation of the 2006 family law reforms
Parental responsibility: Decision-making about issues affecting the child and financial support
8.2.3 Sense of fairness regarding child support payment
Parents in the LSSF W1 2008 were asked to indicate their view about the fairness or otherwise of the amount of child support.18
18 In the LSSF W1 2008, regardless of whether respondents said that they paid or received child support or that child support was not supposed to be paid, they were asked to indicate the extent to which they felt that the amount of child support was fair or unfair for: (a) themselves; (b) the focus child’s other parent; and, where applicable, (c) the respondent’s current partner. The latter question was only asked of re-partnered parents who were supposed to be paying child support. The response options offered to the parents were:
Father payersMother payees
20
40
60
80
100
Percentage of nights per annum that focus child spent with each parent
Perc
enta
ge
0Mother 100% & father never sees
Mother 66–99% & father 1–34%
Equal time 48–52%
Mother 100% & father sees daytime only
Mother 53–65% & father 35–47%
Source: LSSF W1 2008
Figure 8.17 Child support payments made in full and on time, by care-time arrangements, father payers’ and mother payees’ reports, 2008
Father payersMother payees
20
40
60
80
100
Percentage of nights per annum that focus child spent with each parent
Perc
enta
ge
0Mother 100% & father never sees
Mother 66–99% & father 1–34%
Equal time 48–52%
Mother 100% & father sees daytime only
Mother 53–65% & father 35–47%
Source: LSSF W1 2008
Figure 8.18 Child support payments paid neither in full nor on time, by care-time arrangements, father payers’ and mother payees’ reports, 2008
198 Australian Institute of Family Studies
Chapter 8
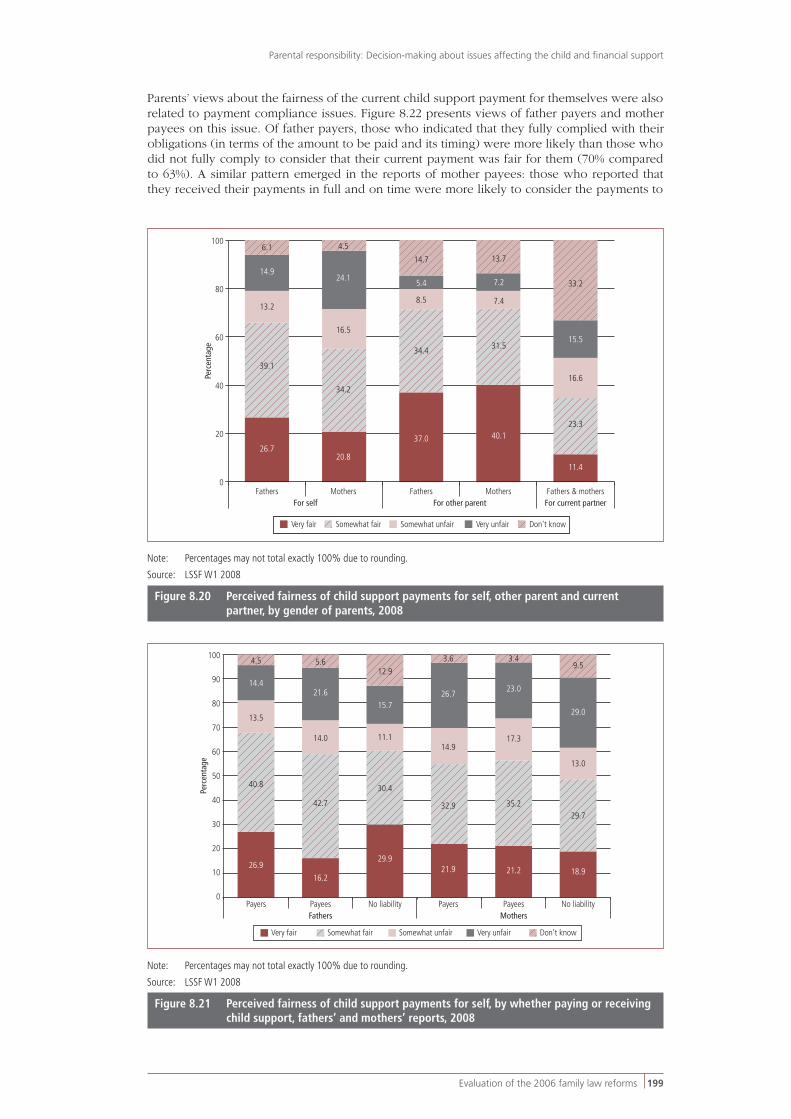
In general, a majority of parents considered that child support payments were fair for each par-ent. Specifically, 66% of all fathers and 55% of all mothers reported that their current amount of child support was fair for themselves, while 29% of fathers and 41% of mothers considered the amount to be unfair for themselves (Figure 8.20). In addition, most fathers and mothers believed that current child support amount was fair for the other parent (72% of mothers and fa-thers), while just 15% of mothers and fathers thought that the amount was unfair for this parent.
In other words, parents were more likely to report that the current child support amount was fair for the other parent than for themselves. This disparity in sense of fairness for self and for the other parent suggests a sentiment among separated parents that the other parent has the “better deal”. Mothers were less likely than fathers to believe that the current amount was fair for themselves, while a similar proportion of fathers and mothers believed that the payments were fair for the other parent.
Parents who had re-partnered and who were paying child support were evenly divided in their views about the fairness of the payment for their current partner: 35% described the payments as fair, 32% considered them to be unfair, and 33% expressed uncertainty about this issue.
Figure 8.21 depicts parents’ sense of fairness about the child support amount for themselves, according to whether they were payers or payees and according to their gender. Among fa-thers, payers were more likely than payees to judge the payment amounts as being fair (68% compared to 59%). Fathers who were not liable to pay child support had similar views to those of father payees, although the former group were more likely than the other fathers to express uncertainty (13% compared to 5–6%). The views of mother payers and payees were similar: 55–56% considered the payments to be fair; however, mothers without a child support liability were slightly less likely to consider this situation to be fair (49%).
Father payers were more likely than mother payees to believe that the current payment was fair (68% compared to 56%). Mother payers and father payees, on the other hand, held similar views: 55% and 59% respectively reported that the child support payment amount was fair.
“very fair”, “somewhat fair”, “somewhat unfair” and “very unfair”. Some respondents expressed uncertainty, although “don’t know” was not suggested to them as a response option. As mentioned in Section 8.3, the LSSF W1 2008 was conducted shortly after the introduction of the new Child Support Formula. This was therefore a transitional period for many parents and it is therefore probable that responses about the fairness of the scheme are a mixture of views about the old and new formulas. It is also likely to be affected by whether the amount of child support the parent was required to pay changed, and if so in what direction.
0
20
40
60
80
100
Shareddecision-making
Other Shareddecision-making
Other
Perc
enta
ge
90
70
50
30
10
EducationHealth care Sporting/social activities
Religious/cultural ties
61.5
53.1
65.1
48.4
58.3
47.8
61.3
48.4
Mother payees
78.173.4
77.2
71.976.2
71.674.6 72.8
Father payers
Source: LSSF W1 2008
Figure 8.19 Full compliance with child support liability, by whether decision-making was shared, father payers’ and mother payees’ reports, 2008
199Evaluation of the 2006 family law reforms
Parental responsibility: Decision-making about issues affecting the child and financial support
Parents’ views about the fairness of the current child support payment for themselves were also related to payment compliance issues. Figure 8.22 presents views of father payers and mother payees on this issue. Of father payers, those who indicated that they fully complied with their obligations (in terms of the amount to be paid and its timing) were more likely than those who did not fully comply to consider that their current payment was fair for them (70% compared to 63%). A similar pattern emerged in the reports of mother payees: those who reported that they received their payments in full and on time were more likely to consider the payments to
26.720.8
37.0 40.1
11.4
39.1
34.2
34.4 31.5
23.3
13.2
16.5
16.6
14.924.1
15.5
14.7 13.7
33.2
7.48.5
5.4 7.2
4.56.1
0
20
40
60
80
100
Fathers Mothers Fathers Mothers Fathers & mothersFor self For other parent For current partner
Very fair Somewhat fair Somewhat unfair Very unfair Don't know
Perc
enta
ge
Note: Percentages may not total exactly 100% due to rounding.
Source: LSSF W1 2008
Figure 8.20 Perceived fairness of child support payments for self, other parent and current partner, by gender of parents, 2008
26.9
16.2
29.921.9 21.2 18.9
40.8
42.7
30.4
32.9 35.229.7
13.5
14.0 11.114.9
17.3
13.0
14.421.6
15.726.7
23.0
29.0
4.5 5.612.9
3.6 3.49.5
0
10
20
30
40
50
60
70
80
90
100
Payers Payees No liability Payers Payees No liabilityFathers Mothers
Perc
enta
ge
Very fair Somewhat fair Somewhat unfair Very unfair Don’t know
Note: Percentages may not total exactly 100% due to rounding.
Source: LSSF W1 2008
Figure 8.21 Perceived fairness of child support payments for self, by whether paying or receiving child support, fathers’ and mothers’ reports, 2008
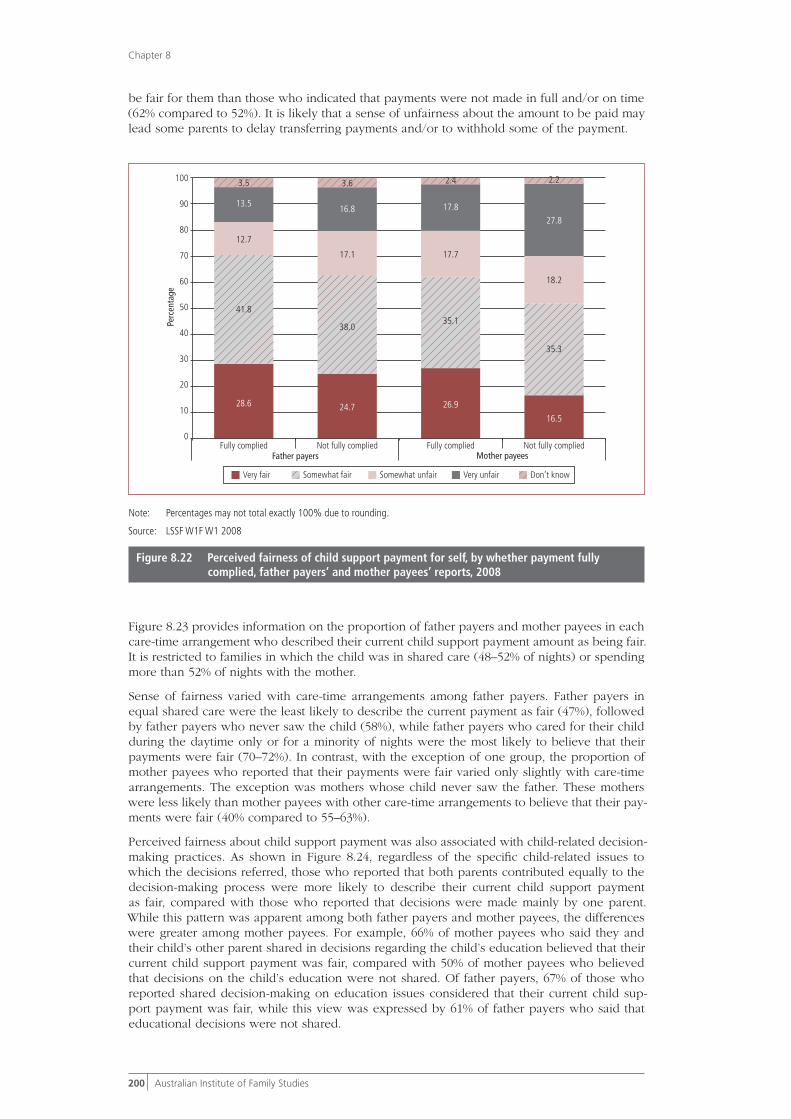
200 Australian Institute of Family Studies
Chapter 8
be fair for them than those who indicated that payments were not made in full and/or on time (62% compared to 52%). It is likely that a sense of unfairness about the amount to be paid may lead some parents to delay transferring payments and/or to withhold some of the payment.
28.6 24.7 26.9
16.5
41.8
38.035.1
35.3
12.7
17.1 17.7
18.2
13.516.8 17.8
27.8
3.5 3.6 2.4 2.2
Fully complied Not fully complied Fully complied Not fully compliedFather payers Mother payees
0
10
20
30
40
50
60
70
80
90
100Pe
rcen
tage
Very fair Somewhat fair Somewhat unfair Very unfair Don’t know
Note: Percentages may not total exactly 100% due to rounding.
Source: LSSF W1F W1 2008
Figure 8.22 Perceived fairness of child support payment for self, by whether payment fully complied, father payers’ and mother payees’ reports, 2008
Figure 8.23 provides information on the proportion of father payers and mother payees in each care-time arrangement who described their current child support payment amount as being fair. It is restricted to families in which the child was in shared care (48–52% of nights) or spending more than 52% of nights with the mother.
Sense of fairness varied with care-time arrangements among father payers. Father payers in equal shared care were the least likely to describe the current payment as fair (47%), followed by father payers who never saw the child (58%), while father payers who cared for their child during the daytime only or for a minority of nights were the most likely to believe that their payments were fair (70–72%). In contrast, with the exception of one group, the proportion of mother payees who reported that their payments were fair varied only slightly with care-time arrangements. The exception was mothers whose child never saw the father. These mothers were less likely than mother payees with other care-time arrangements to believe that their pay-ments were fair (40% compared to 55–63%).
Perceived fairness about child support payment was also associated with child-related decision-making practices. As shown in Figure 8.24, regardless of the specific child-related issues to which the decisions referred, those who reported that both parents contributed equally to the decision-making process were more likely to describe their current child support payment as fair, compared with those who reported that decisions were made mainly by one parent. While this pattern was apparent among both father payers and mother payees, the differences were greater among mother payees. For example, 66% of mother payees who said they and their child’s other parent shared in decisions regarding the child’s education believed that their current child support payment was fair, compared with 50% of mother payees who believed that decisions on the child’s education were not shared. Of father payers, 67% of those who reported shared decision-making on education issues considered that their current child sup-port payment was fair, while this view was expressed by 61% of father payers who said that educational decisions were not shared.

201Evaluation of the 2006 family law reforms
Parental responsibility: Decision-making about issues affecting the child and financial support
8.3 SummaryThe extent to which there is shared decision-making about key issues that have an impact upon the long-term development and wellbeing of children appears to be closely related to the proportion of nights the child spends with each parent. Shared decision-making seems much more likely where there is shared care time than where the child spends most or all nights with one parent. The more unilateral the care arrangement is, the more unilateral the decision-making appears to be, with decisions resting mainly with the parent who has the majority of care. These trends are not surprising given that parents who spend considerable care time with
20
40
60
80
100
Percentage of nights per annum that focus child spent with each parent
Perc
enta
ge
0Mother 100% & father never sees
Mother 66–99% & father 1–34%
Equal time 48–52%
Mother 100% & father sees daytime only
Mother 53–65% & father 35–47%
Father payersMother payees
Source: LSSF W1 2008
Figure 8.23 Perceived fairness of child support payments for self, by care-time arrangements, father payers’ and mother payees’ reports, 2008
65.8
49.9
67.1
61.0
73.2
53.5
73.0
65.166.8
51.7
74.4
62.7
68.3
53.0
71.8
64.9
0
20
40
60
80
100
Shareddecision-making
Other Shareddecision-making
Other
Mother payees Father payers
Perc
enta
ge
90
70
50
30
10
EducationHealth care Sporting/social activities
Religious/cultural ties
Source: LSSF W1 2008
Figure 8.24 Perceived fairness of child support payments for self, by whether decision-making responsibilities were shared, father payers’ and mother payees’ reports, 2008

202 Australian Institute of Family Studies
Chapter 8
their children are more likely to be in the best position to make well-informed decisions in the interests of the long-term welfare of their children.
Nevertheless, when children were mainly or entirely with one parent, the sharing of decision-making was more likely to be reported by parents with the minority of care time than by par-ents with the majority of care time. For some parents, such differences in views on these issues may become a source of conflict.
The sharing of decision-making was closely linked to the extent to which the father was seen to be involved in the child’s day-to-day activities before separation, with higher levels of pre-separation involvement being associated with a greater tendency to report the sharing of child-related decisions post-separation.
While shared decision-making represents an important means by which both separated parents can remain involved in their children’s lives, its advantages are undermined where there are risks of family violence. The experience of family violence during the pre-separation period and current safety concerns linked with ongoing contact with the child’s other parent appeared to influence the likelihood of sharing decisions that have implications for their child’s long-term welfare. Firstly, the sharing of decision-making was less commonly reported by respondents who said that their child’s other parent had emotionally abused them or physically hurt them (especially the latter) than by other parents. Consistent with these trends, parents who had on-going safety concerns for the child and/or themselves were less likely than those without such concerns to report the sharing of decision-making. Despite these trends, a substantial propor-tion of parents who reported a history of family violence or ongoing safety concerns indicated that decision-making was shared.
Finally, parents who had sorted out their parenting arrangements through discussions between themselves were more likely than other parents to indicate that decision-making was shared between the parents. This trend makes sense in that both these matters relate to the tendency to “work things out” together.
While decision-making practices reported by parents varied considerably, legal orders concern-ing parental responsibility demonstrate a strong trend for legal decision-making power to be allocated to both parents. No significant changes in this trend are evident through comparison of pre-and post-reform patterns. Orders made by judicial determination are more likely to al-locate decision-making power to one or other parent (more often the mother) than those made by consent, but even in relation to judicial determinations, shared decision-making power is allocated to both parents in the majority of cases. Cases in which decision-making is removed from one parent commonly involve concerns about family violence and child abuse.
Ongoing financial support for children after parental separation is also central to children’s welfare. Since the establishment of the Child Support Scheme in 1988, some fundamental changes have taken place in society and family life in Australia, as outlined in Chapter 1. The Child Support Scheme was designed to reflect some of these changes, ensure that the ongoing financial needs of children are met and encourage the involvement of both parents in their chil-dren’s lives. This chapter has examined the proportion of parents who were supposed to pay or receive child support after the recent family law and child support reforms were introduced, and the extent to which child support liabilities were paid in full and on time, and parents’ evaluations of the fairness of the child support amount for themselves, their child’s other parent and, if repartnered, their new partner.
Care-time arrangements were linked with the extent to which parents were paying or receiv-ing child support. Father payers and mother payees whose child lived mostly with the mother were more likely to report paying or receiving child support than those with shared care-time arrangements and those whose child was mainly with the father. This trend is likely to be linked with two factors. First, the Child Support Scheme takes into account the number of nights that children spend with each parent. Second, as Chapter 7 showed, mothers with a minority of care time have significantly lower incomes than fathers with a minority of care time and would therefore be likely to have a lower capacity to pay child support.
More than half of parents with a child support liability reported that the liability was fully complied with (in terms of amount and being on time), with payers being more likely than payees to indicate full compliance (especially father payers). Non-compliance seemed to be less common, although 21% of father payees reported that child support was neither paid in full nor on time. Late payment of child support was more common than partial payment. There was no apparent link between father’s reports of child support payment compliance and their
203Evaluation of the 2006 family law reforms
Parental responsibility: Decision-making about issues affecting the child and financial support
care-time arrangements. However, mother payees whose child never saw the father were less likely than other mothers to report full compliance of child support payment. Parents who contributed jointly to decisions about their child were more likely than other parents to indicate full compliance.
Parents typically considered that their current child support payment was fair for themselves and for their child’s other parent. However, perceived fairness for self varied according to payer/payee status, payment compliance, care-time arrangements and whether parents contrib-uted jointly to decisions about issues affecting their children’s long-term welfare. Father payers were more likely than mother payees to believe that their current child support payment was fair for themselves. Sense of fairness was low among father payers with equal care time and those who never saw their child but higher than for mother payees whose child never saw their father. Parents who reported full compliance with child support payments were more likely to describe their current payment as being fair, compared with parents who reported that their payment was not made in full, not made on time or not made at all. In addition, parents who shared decision-making responsibilities about their child were more likely to describe their cur-rent child support payment as being fair compared with other parents.
However, when interpreting the findings on perceived fairness of the child support scheme, it is important to bear in mind that the data were collected just after the new child support formula took effect in July 2008. This was therefore a transitional period for many parents and their re-sponses to the questions about child support may have been affected by this transitional period. The second wave of the LSSF W1, being conducted in the second half of 2009, will provide data on child support more than 12 months after the new formula came into effect.