
Chapter 7: System Implementation Case Studyshodhganga.inflibnet.ac.in › bitstream › 10603 ›...
52
Chapter 7: System Implementation Case Study IPPPIS implementation in a machine tool manufacturing company is presented as a case study in this chapter. Overview of the machine tool industry in international context with its various components, such as, market situation, classification of machine tool industry, export/import scenario, is presented in the first part. Problem areas in the industry, which requires system improvement, were analysed. Case study is then presented with details of the conventional method followed for the process planning and product development. How machine tool manufacturing organization is benefited to achieve objectives on lean and agile manufacturing, by the integration of product and process models used in the IPPPIS is explained. Benefits derived by the way of CE with the IPPPIS implementation for new product development is given at the end part of this chapter. 7.1 Overview of Machine Tool Industry The machine tools industry can be broadly classified into metal-cutting and metal-forming tools, based on the type of operation. Metal cutting accounts for 87 per cent of the total output of machine tools in India. Key metal cutting tools include turning centres, machining centres and grinding centres, which account for nearly two-thirds of the total metal-cutting produce. Based on technology, machine tools can be classified into CNC (Computerised Numerically Controlled) and Conventional tools. CNC machine tools, which are highly productive and cost effective, comprise nearly 70 per cent of machine tools. Of these, CNC turning centres, machining centres and grinding centres are the biggest segments, accounting for nearly 81 per cent of the total [99]. Efforts within the industry are now underway to improve the features of CNC machines, and provide further value additions at lower costs, to meet specific requirements of users. In keeping with the current trends, and 201
Transcript of Chapter 7: System Implementation Case Studyshodhganga.inflibnet.ac.in › bitstream › 10603 ›...
Chapter 7: System Implementation Case Study
IPPPIS implementation in a machine tool manufacturing company is
presented as a case study in this chapter. Overview of the machine tool
industry in international context with its various components, such as,
market situation, classification of machine tool industry, export/import
scenario, is presented in the first part. Problem areas in the industry, which
requires system improvement, were analysed. Case study is then presented
with details of the conventional method followed for the process planning
and product development. How machine tool manufacturing organization is
benefited to achieve objectives on lean and agile manufacturing, by the
integration of product and process models used in the IPPPIS is explained.
Benefits derived by the way of CE with the IPPPIS implementation for new
product development is given at the end part of this chapter.
7.1 Overview of Machine Tool Industry
The machine tools industry can be broadly classified into metal-cutting and
metal-forming tools, based on the type of operation. Metal cutting accounts
for 87 per cent of the total output of machine tools in India. Key metal
cutting tools include turning centres, machining centres and grinding
centres, which account for nearly two-thirds of the total metal-cutting
produce. Based on technology, machine tools can be classified into CNC
(Computerised Numerically Controlled) and Conventional tools. CNC
machine tools, which are highly productive and cost effective, comprise
nearly 70 per cent of machine tools. Of these, CNC turning centres,
machining centres and grinding centres are the biggest segments, accounting
for nearly 81 per cent of the total [99].
Efforts within the industry are now underway to improve the features of
CNC machines, and provide further value additions at lower costs, to meet
specific requirements of users. In keeping with the current trends, and
201

emerging demand, the CNC segment could be the driver of growth for the
machine tools industry in India. The Indian machine tools industry is now
recognized as a provider of low-cost high quality lean manufacturing
solutions. It is a well-known and often repeated fact that the machine tools
industry forms the pillar for the competitiveness of the entire manufacturing
sector since machine tools produce capital goods, which in turn produce the
manufactured goods [100].
In India, indigenous machine tools have the highest impact on capital output
ratios. Machine tools share of Rs.2,500 crore truly supports the
advancement of the country's engineering sector output which is estimated
to be worth over Rs.1,50,000 crore. In India there are about 450
manufacturers manufacturing complete machines, or their components.
There are around 150 units in the organized sector. Almost 73 percent of the
total machine tools production in India is contributed by 10 major
companies in this industry. The industry has an installed capacity of over
Rs.10 billion and employs a workforce directly or indirectly totalling 65,000
skilled and unskilled persons. The government-owned Hindustan Machine
Tools Limited (HMT) alone accounts for nearly 32 per cent of machine
tools manufactured in India.
7.1.1 Market Situation and Demand in India
In India, the vehicle industry is estimated to invest Rs.25,000 to 30,000
crores in the next 4-5 years in capacity building. The auto component
industry is believed to invest Rs.2000 crores yearly since auto component
exports are expected to grow to US$ 20 to 22 billion by 2015, a growth rate
of 33.45 % CAGR. The engineering industry are projected to invest a total
of Rs.2,500 crores in the next two years due to the investment boom in the
construction, mining, power, steel and refining sectors.
202
Ordnance Factories are another major user of machine tools. Defence
production is highly specialized, complex and poses unique challenges.
Products have to be reliable and consistent in quality and hence the
machines producing them need to be of very high technology and accuracy.
The technologies and machines being planned for procurement are mostly
flexible so as to cater to a wide range of products. During the remaining
10th Plan period, an investment of Rs.560 crores is envisaged for the
modernization plan of the Ordnance Factories. The aviation industry in
India is growing at a very high rate with the new entrants coming in with
purchase of one aircraft per month. The international scenario is also equally
optimistic.
7.1.2 Problem Areas Requiring System Improvement
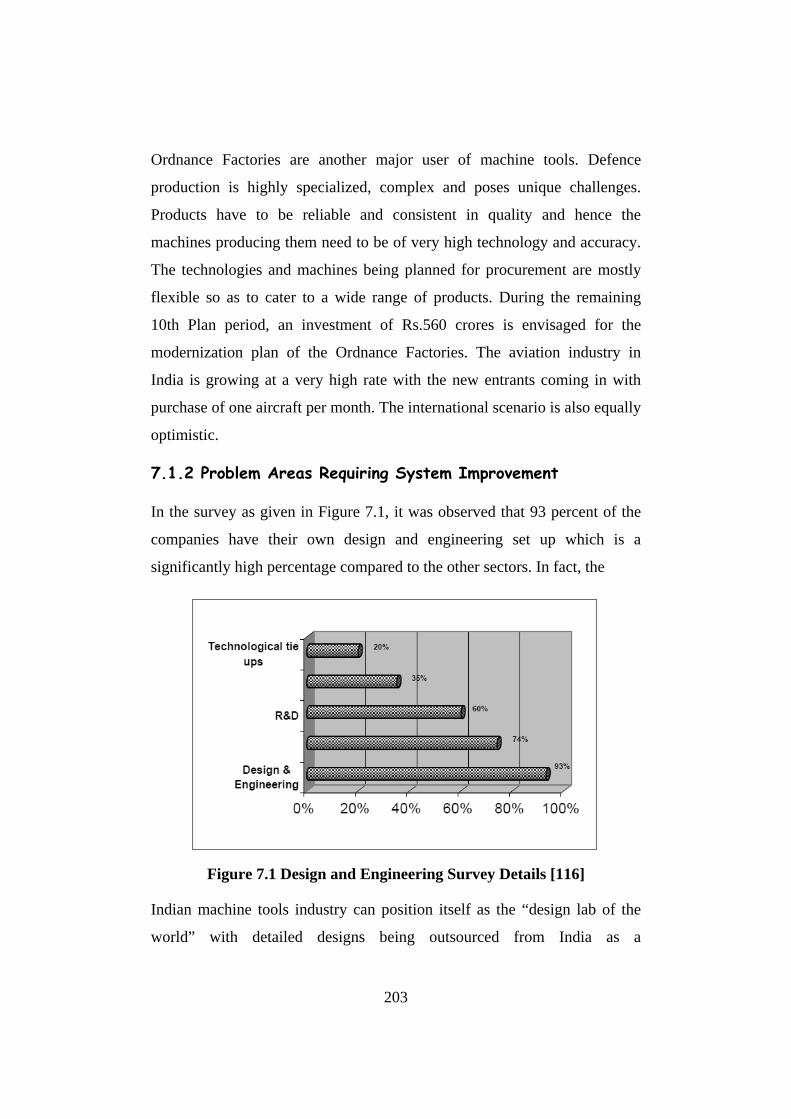
In the survey as given in Figure 7.1, it was observed that 93 percent of the
companies have their own design and engineering set up which is a
significantly high percentage compared to the other sectors. In fact, the
Figure 7.1 Design and Engineering Survey Details [116]
Indian machine tools industry can position itself as the “design lab of the
world” with detailed designs being outsourced from India as a
203

diversification strategy by the industry as a whole. Design tends to be
market driven rather than technology driven, with technology providing the
capability to meet new market needs.
Due to the fragmented nature of the industry and the small size of the
players, most of them have not implemented any of the latest soft
technologies like six sigma, kaizen, lean manufacturing, TPM, CE, etc. and
in fact, many of them are unaware of the benefits provided by these. 33
percent of the companies surveyed have undergone a business process
reengineering in the past three years to make themselves more competitive
in the face of increasing international competition. 26 percent of the
companies underwent downsizing to enhance cost competitiveness [100].
Due to the sudden increase of investments in the automobile, defence and
engineering sector in the last one year or two, the industry is just out of the
recessionary phase and has been unable to cope up with the demand surge
since no additional capacity had been added. On an average, companies
have reported that 60 percent of the orders are delivered on or before time
and another 25 percent within one month of the delivery due date. The
sector needs to upgrade its manufacturing technology and business
processes to improve its productivity and also educate itself on the planning
process to tackle the delays in delivery either by subcontractors, or by the
companies themselves.
The business cycle in machine tool manufacturing closely follows the
general economic cycle and has therefore always been subject to cyclical
fluctuations. Businesses need to compete efficiently and quickly respond to
market needs and niches. There is no doubt that the machine tool
manufacturers are confronted with challenges and looking to implement
improvements in their key activities or processes to cope with the market
fluctuations and increasing customer requirements. With the buoyant,
domestic and international, demand the efforts are required on the part of
204

the Indian machine tools industry to improve technology, quality and
performance and at the same time to reduce cost. There is no doubt, that
with a little effort, this sector can emerge as one of the front runners in
increasing value addition in the country, since the value addition by this
industry is currently one of the highest in the capital goods industry. The
Indian machine tools industry has to reinvent itself in terms of its product
range technology and enhanced quality as well as cost competitiveness
[101].
Agile manufacturing organizations produce high quality products, at a
competitive cost that are flexible enough to be mass customised. These
products are produced in a short lead-time by a manufacturing system that is
intimately integrated with design of the product and manufacturing process
design. The focus in this study is to integrate the manufacturing process
design with product design while designing the product, so that the
operation of the manufacturing process can be more agile. Shorter cycle
times increase flexibility and responsiveness while reducing their costs
[102].
7.2 Case Study
A CE implementation study was carried out in a machine tool
manufacturing company, producing a wide range of machines tools. The
products range from conventional lathe (which is having all India
market.shares of 90%) and CNC turning center ((which is having all India
market share of 30%) [103]. The products are falling under standard
products as well as make to order category. Top-level diagram of the
activities in the factory is given in Figure.7.2.
205

Market/Customers
Sales Engg.
Design
Existing Design
BOM
Planning
Purchase Order List
Stores
Material Warrant
Assembly Inspection / Testing
Despatch
New Design
BOM
Planning
Figure 7.2 Top-level Diagram of Manufacturing Firm (Manufacturing Firm with Standard Products/ Make to Order)
An analysis of orders executed over a period of three years showed that out
of a total 60 projects executed per year, 40 projects had serious problems.To
visually display the many potential root causes of the problems that are
studied, the same is represented as a fishbone chart as shown in Figure 7.3.
206

5. Manufacturing 3. Material 2. Process
Cause1
Cause2
1. Design
Cause2
Cause1
Delivery Problems Time Delay Cost Overun Quality Problem
4. Machine 6. Methods and Systems
Cause1
Cause2 Cause2
Cause1
Cause1 Cause1
Cause2 Cause2
Figure 7.3 Causes for Poor Performance of Machine Tool Factory [Fishbone Chart]
1. Poor performance of machine tool factory-Design
1.1. Poor design 1.2. Design / Engineering changes 1.3. Over design 1.4. Lack of information related to design / process / material 1.5. Lack of information from customer 1.6. Lack of standardisation and rationalisation 1.7. Increased number of components 1.8. Unnecessary Quality specifications, which will increase the cost of
the product 1.9. Time control over the product development is poor. 1.10. Reuse level of the existing components are minimal. 1.11. Cost Optimization is poor. 1.12. Reconciliation of conflicting requirements in product development is
poor. 1.13. Spending too much development time
2. Poor performance of machine tool factory- Process
2.1. High demand on the skilled planner 2.2. Time taken for the process planning is more
2.3. Increase in the process planning cost 2.4.Manufacturing costs increase due to wrong costly process, lack of
information etc
207

2.5.Non-consistent plans 2.6.Accuracy level of the plan is low 2.7.Unnecessary process and reduction in productivity 2.8.Cost estimating procedures and calculation errors more 2.9.Ability to introduce new manufacturing technology and update
process plans is less. 2.10. Lack of planning capability
3. Poor performance of machine tool factory- Material
3.1. Usage of Costly material 3.2. Nonavailable material 3.3. Scrap / Rework 3.4. Material Shortage 4. Poor performance of machine tool factory- Machine
4.1. Process Capability related issues 4.2. Over Loading 4.3. Under utilisation (Idle Time) 4.4. Under utilisation of Costly machines 4.6. Resource Constraints with reference to volume 5. Poor performance of machine tool factory- Manufacture
5.1. Frequent design changes make manufacturing system complex. 5.2. Customer specific tooling 5.3. Customer Orders are highly fluctuating and varying 5.4. Increased number of product variants leads to set up change over/ process resetting 5.5. Scrap and rework related problems /Negligence of operator 5.6. Increased number of parts increases the inventory 5.7. Problem during product introduction Tooling/Work Holding/Special Tools 5.8. Non-value added waiting time / unnecessary movement of material / under utilisation of people. 5.9. Cutter modifications 5.10. Changing production plan 5.11. Less order quantities 5.12. Tooling set-up and reprogramming 5.13. Ineffective machine, equipment
208

6. Poor performance of machine tool factory- Methods and Systems 6.1. Long Lead time to produce a machine tool 6.2. Slow response to Engineering changes 6.3. Information flow is not smooth 6.4. Accuracy of information is low / Lack of information 6.5 Customer Orders are highly fluctuating and varying make the system complex 6.6 Non-consistent plans increase the complexity. 6.7. Increased number of parts increases the systemic complexity. 6.8. Increased number of product variants increases the systemic complexity. 6.9. Systemic complexities of the batch production are more. 6.10. Unnecessary accuracy level increases the complexity of methods. 6.11. Changing specifications or models 6.12. Poor use of technology and information technology 6.13. Poor information sharing 6.14. Poor responsiveness 6.15. Better allocation
Table 7.1 shows the causes for the poor performance of the projects.
A pareto analysis was carried out to identify the vital problems (Figure 7.4).
Table 7.1 Causes for Poor Performance of Projects
Sl. No
Problem Areas Average Three Years
Cum. Fre-quency
1 Cost/Time over run due to 1.1. Productivity related problem by improper
information flow/ poor information sharing/poor response
1.2. Manufacturing costs increase due to non-optimum process, incorrect information
1.3. Visibility and standardisation related problems 1.4. Rationalization, allocation, planning related
problems 1.5. Non-effectiveness of supporting activities 1.6. Poor responsiveness due to complexity and non
standardisation
33 33
209

1.7. Poor common under standing of procedures 1.8. Poor problem identifying 1.9. Non effectiveness in collecting and evaluating the
production information 1.10.Poor ability in making decisions of all level of Employees 1.11. Poor capability of planning team 1.12. Poor decision making by planning and design 1.13. Learning time is more
2 Development time/cost increase due to 2.1. increase in design/engineering changes 2.2. Poor design 2.3. Poor design optimization 2.4. Poor knowledge base related to design /process/ material 2.5. Increased number of parts due to poor rationalization 2.6.Increased number of new parts and hence more design effort and time 2.7. Poor standardisation
25 58
3 Cost/Time increase due to manufacturing related problems 3.1.Poor plant and resource utilisation 3.2. Products diversification is difficult 3.3. Poor response by Manufacturing to market changes 3.4. Late delivery of products by the plant 3.5. High inventory costs 3.6. Machine and equipment cost is more 3.7. Labour and employee cost is more 3.8. Idle time is more
21 79
4 Waste of time/money reduced due to 4.1 Set up change over/ process resetting 4.2 Unnecessary motion 4.3 Unnecessary process 4.4 Scrap/ Rework 4.5 Inventory 4.6 Under utilisation of people 4.7 Other non value added waiting time 4.8 Tooling/Work Holding/Special Tools 4.9 Poor Material availability, improper material usage
12 91
5 Unnecessary Quality/ accuracy/ precision beyond the customer need, Unnecessary tooling etc.
4 95
6 Poor ability to manage new product development 3 98
210
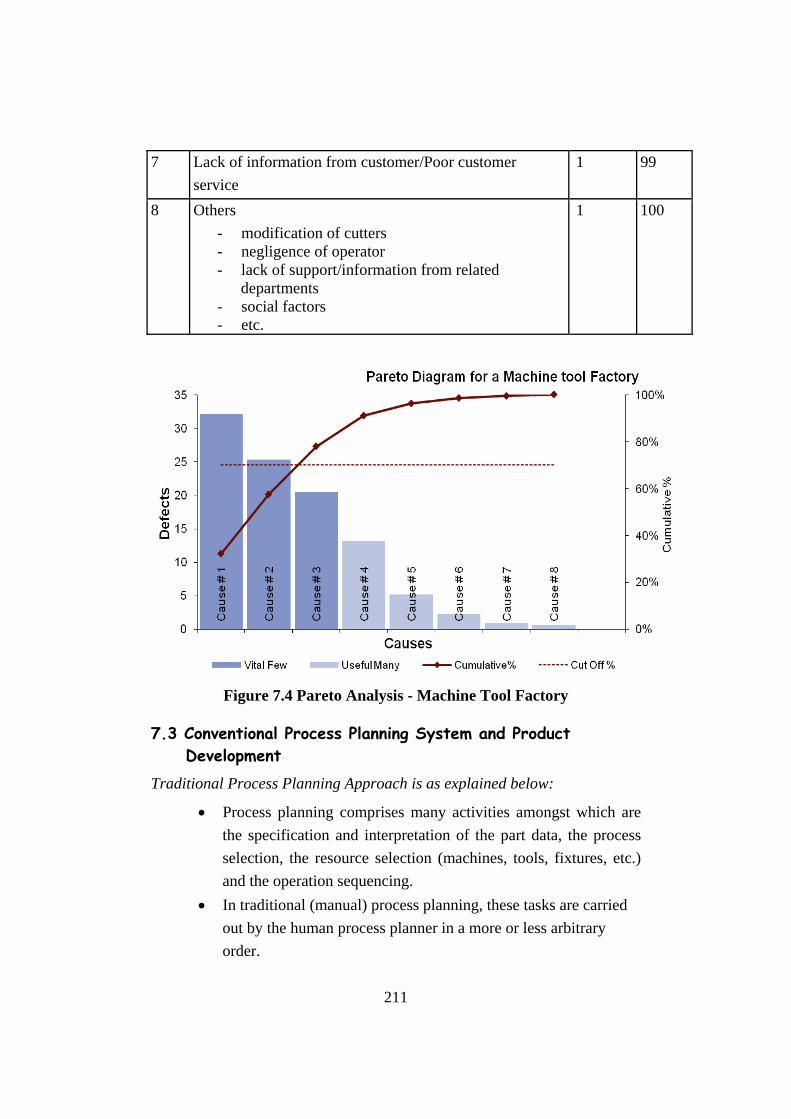
7 Lack of information from customer/Poor customer service
1 99
8 Others - modification of cutters - negligence of operator - lack of support/information from related
departments - social factors - etc.
1 100
Figure 7.4 Pareto Analysis - Machine Tool Factory
7.3 Conventional Process Planning System and Product Development Traditional Process Planning Approach is as explained below:
• Process planning comprises many activities amongst which are the specification and interpretation of the part data, the process selection, the resource selection (machines, tools, fixtures, etc.) and the operation sequencing.
• In traditional (manual) process planning, these tasks are carried out by the human process planner in a more or less arbitrary order.
211
• Product designer may not be knowledgeable of the interrelationships among materials, design and manufacturing as well as overall economics of the operations.
Traditionally, when designing a new product, a team of designers usually
participate in what is known as a product development cycle. In general
terms, the first stage in designing a new product is that of concept design, in
which overall needs and aims are addressed.
Next is the initial design stage. The initial design stage comprises steps of
designing the part, then choosing the materials and determining the process
to make the part, then designing the tool to make the part. For example, if
the part is to be a computer keyboard, first a part engineer determines the
size and shape of the keyboard (i.e., the part). Next, when the part has been
designed, a second engineer determines the design of the tool that can be
used to make the keyboard. Separately, a process engineer determines the
materials and process to make the part, for example, whether the part is to
be made of plastic; metal or some other material; the properties of the
material; the process to be used to make the keyboard (e.g., casting,
injection molding, forming, etc.); what are the process parameters; and the
rate of production of the process.
The next stage, after making the prototyping of the part, revisions on the
design is made. The above steps of part, tool and process design are
repeated until part is produced satisfactory, to both design and cost of
production. Traditionally, each of the above steps is carried out sequentially,
usually by different people. One person may design the part, another the
tool, and a third the process. Collaboration between these designers is
usually minimal. Where many revisions have to be made, numerous
iterations are needed and a long period of time passes until a satisfactory
part is produced.
212

Basic Factors Affecting Process Design are:
• Volume or quantity of product to be manufactured based on sales forecast
• The required quality of the product • The equipment that is available or that can be procured for the
product manufacture Components of Process Planning are as given below:
• Selection of machining operations • Sequencing of machining operations • Selection of cutting tools • Determining the setup requirements • Calculation of cutting parameters • Tool path planning and generation of NC/CNC programs • Design of Jigs/Fixtures
Requirements for Process Planner as given below:
• Must be able to analyze and understand part requirements • Have extensive knowledge of machine tools, cutting tools and
their capabilities • Understand the interactions between the part, manufacturing,
quality and cost A Rough Process Plan is shown in Figure 7.5.
Route Sheet by: T.T. Pullan
Part Number:E80202030 Part Name: Mounting Bracket
SlNo Workstation Time (Min)
1. Matl Rem 2. Mill 02 5 3. Drill 01 4 4. Insp 1
Figure 7.5 A Rough Process Plan
A Detailed Process Plan is show in Figure 7.6.
213

Traditional Process Planning Problems
• Experienced based and performed manually • Variability in planner’s judgment and experience can lead to
differences in the of what constitutes best quality • Problem facing modern industry is the current lack of skilled
labor force to produce machined parts as was done in the past • Chances for the concept of over the wall design • Hence Computer Integrated Manufacturing and Computer Aided
Process Planning
PROCESS PLAN ACE inc
Part No. S0125-F Material: Steel 4340Si Part Name: Housing Original: S.D. Smart Date: 1/10/2011 Changes… Date:…….. Checked: C.S. Good Date: 2/10/2011 No Operation
Description Work station
Setup Tool Time (Min)
10 Mill bottom surface1
Mill 01 See attach#1 for illustration
Face mill 6 teeth/ 4” dia
3 setup 5 machining
20 Mill top surface Mill 01 See attach#1 Face mill 6 teeth/ 4” dia
2 setup 6 machining
30 Drill 4 holes DRL02 Set on surface1
Twist drill ½” dia 2” long
2 setup 3 machining
Figure 7.6 A Detailed Process Plan
Problem with over the wall design is explained as below:
• Designer is assumed Designers job is to design; somebody else’s job is to manufacture.
• No cost optimisation • No value engineering • No saving in time/ Delay in delivery.
214
7.4 Benefits of CE and New Process Planning System in the IPPPIS
Besides the three conventional production modes, mass production, job
production, and batch production, a new production mode, mass
customization, has been introduced into industries to allow customized
products to be made to suit special customer needs while maintaining near
mass production efficiency.
Fundamental concern regarding the product design and manufacturing
platforms for mass customization is that the company must optimize
external variety versus internal complexity that results from product
differentiation. External variety comes from customer preferences and is
reflected in product design, while internal complexity is associated with a
company’s process capabilities, especially on the utilization of
manufacturing resources. An important step toward establishing
manufacturing planning platforms for mass customization is the
development of planning methodologies that provide easy access to
information in the previous manufacturing plans. Due to the
similarity/commonality among production systems or among specific
customized products, reuse suggests itself as a natural technique to facilitate
increasingly efficient and cost effective product development. That is, a new
manufacturing plan that reuses a previous plan at some level or to some
extent should be less expensive to develop than a plan that is designed from
scratch. By reusing prior plans, an engineer can save design time and cost
by leveraging off previously worked-out solutions.
Table 7.2 shows the major characteristics of the above production modes. In
this, batch production mode represents the most suitable model for the
machine tool factory considered for the case study. Currently, most of the
research focuses on job and batch production, with aim to produce
215

customized parts while trying to maintain minimum manufacturing cost by
using of standard cutters, fixtures and machine tools.
The basic tasks of CAPP for metal removal include the following steps:
• Design analysis and interpretation • Process selection • Tolerance analysis • Operation sequencing • Cutting tools, fixtures, and machine tool specification • Cutting parameters determination
Table 7.2 Characteristics of Manufacturing Planning in Different Production Modes
Job production
Batch production
Mass production
Mass customization
Volume <100/year 100- 5000/year >5000/year 100- 8000/year Product variety
Large Medium (Parts are grouped into families)
Small Large (Parts are grouped into families to reduce the variety)
Machine tool General machines
General or special machines
Special machines
CNC machines
Machine layout
Function based layout
Manufacturing cells cells
Transfer lines
CNC machines or Manufacturing cells
Fixture General fixtures or modular fixtures
Dedicated fixtures
Dedicated fixtures
Dedicated fixtures for part families
Cutter General cutters
General or special cutters
Special cutters
Special cutter designed to machine multiple surfaces
Product repeat rate
Little By batch Continuous production
By batch
Productivity Low Medium High High Cost per part High Medium
Low
Low (approaches to mass production cost)
Cycle time Long Medium Short Short Turnaround time
Short Medium
Long
Short
216
7.4.1 Tasks of Manufacturing Plan Generation
It is known that in overall cycle time, non-cutting time, including cutter
change time, cutter rapid traverse time, and machine tool table index time,
takes important portion. In the CAMP, in order to improve productivity and
reduce cycle time, manufacturing plan generation includes the following
steps, in which machine-level decision-making strategies that abstracted
from BOP is applied to achieve optimal cycle time.
1. Machine Tool Selection
Candidate machine tools are those that fulfilled the entire requirement for
machine tool capabilities from setup planning, including the number of axis
of machine tools.
2. Tooling and Fixture Selection
The initial solution of conceptual fixture design is derived from machine-
level BOP, which includes machine tool selection, fixture base selection,
and part layout on fixture bases. The part layout in BOP is based on
previous detail fixture design, which determines the fixture structure and
fixture components. In the meantime, necessary verifications of fixture
performance are needed in detailed fixture design, such as interference free,
chip shedding to avoid chip accumulation, locating accuracy, stability
problems, clamping sequence, error proofing, and ergonomic issues.
3. Global Process Sequence and Tool Path Generation
In order to reduce the non-cutting time on each part, the processes that use
the same cutters are to be carried out sequentially. Hence, a sequence is
needed for all the manufacturing processes on the multi-part fixtures. A
corresponding tool path is generated without interference with fixture
components, machine tools, etc.
217
4. Cycle Time Calculation
Cycle time is the critical factor in choosing the optimal manufacturing plan
in mass customization. Hence, the estimation of cycle time is indispensable
for manufacturing plan generation.
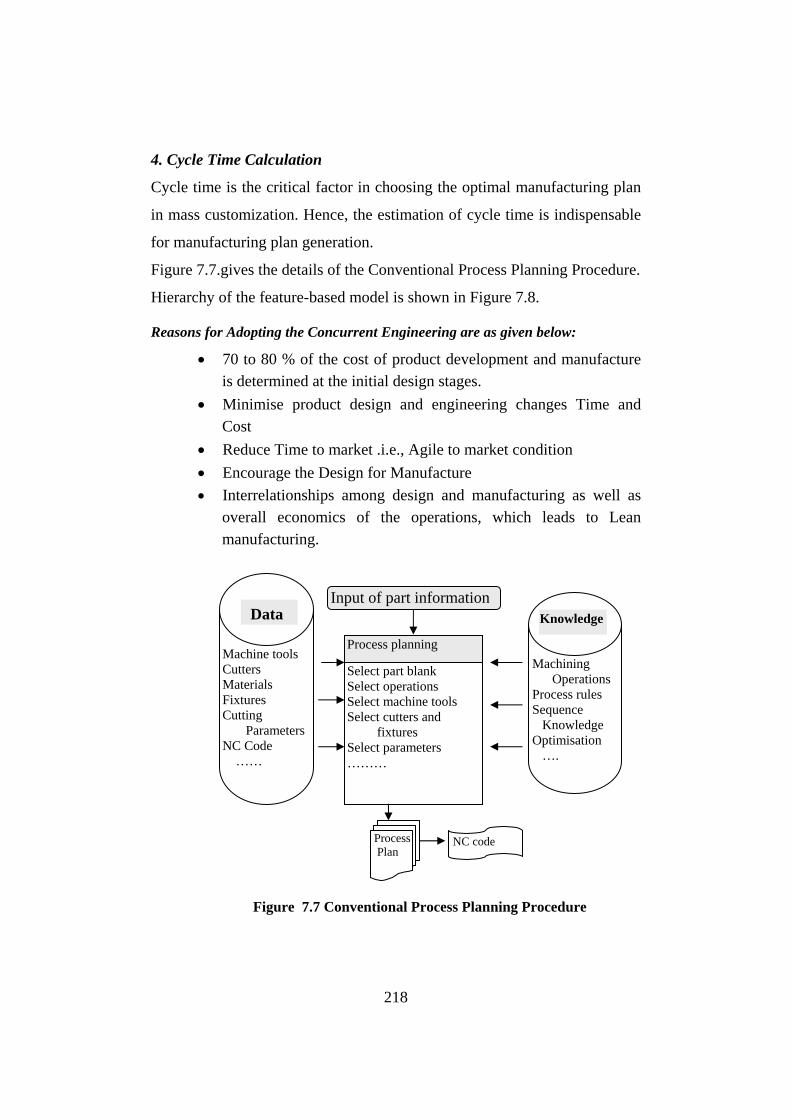
Figure 7.7.gives the details of the Conventional Process Planning Procedure.
Hierarchy of the feature-based model is shown in Figure 7.8.
Reasons for Adopting the Concurrent Engineering are as given below:
• 70 to 80 % of the cost of product development and manufacture is determined at the initial design stages.
• Minimise product design and engineering changes Time and Cost
• Reduce Time to market .i.e., Agile to market condition • Encourage the Design for Manufacture • Interrelationships among design and manufacturing as well as
overall economics of the operations, which leads to Lean manufacturing.
Machine tools Cutters Materials Fixtures Cutting Parameters NC Code ……
Data
Machining Operations Process rules Sequence Knowledge Optimisation ….
Knowledge
Process planning
Select part blank Select operations Select machine tools Select cutters and fixtures Select parameters ………
Input of part information
Process Plan
NC code
Figure 7.7 Conventional Process Planning Procedure
218

Figure 7.8 Hierarchy of the Feature-Based Model [119]
Concurrent Engineering is explained as:
• Product designer must be knowledgeable of the interrelationships among materials, design and manufacturing as well as overall economics of the operations
• Concurrent engineering is a systematic approach integrating the design and manufacturing of product.
Concurrent Design will have some of the Specific Advantages by the way
of:
• Design permits production in the most efficient manner. • Most economical process to produce the required quality,
strength, tolerance, etc.. • Standard machines and cutting tools can be used.
The IPPPIS will Provide:
• Product Designer with more insight into most economical process to produce the required quality, strength, tolerance, etc..
219

• Designer can select design features in initial stage of design in such a way that Standard machines and tools can be used.
• Process planner has an interface or editor for each process planning activity, allowing the systematic, interactive construction of the process plan.
• Similar to the expert systems approach, this will provide reasoning mechanisms and knowledge sources. The kernel should have several knowledge sources (e.g. one for process selection, one for tool selection, etc.,) which can be consulted in an any order to perform some specific planning task.
The methodology for development of the proposed CAPP in IPPPIS is given
in Figure 5.1 in chapter 5.
7.4.2 Information Modelling Technologies
Information models are data structures that represent information contents.
A large amount of information in manufacturing planning needs to be
computerised so that CAPP systems can manipulate them. All this
information is identified and represented by information models. There are
basically four categories of information in the CAPP:
Design Information
Design information is the input of CAPP. Generally, part information,
including part geometry information, tolerance information, functional
information, and production information (production volume, material), are
analyzed and represented in CAPP systems.
Manufacturing Resource Information
Manufacturing resources may include cutting tools, machine tools, fixtures,
and inspection tools. Some of them are standard tools and readily available.
Others are designed specifically for particular processes used in
manufacturing plans.
220
Manufacturing Knowledge
Manufacturing knowledge is the constraint to help engineers make the right
decisions. It is composed of general manufacturing rules and best practice
knowledge that is summarised by manufacturing industries.
Information Generated by CAPP Systems
The result generated by CAPP systems also needs to be described by
information models. This consists of process information; including the
utilization of manufacturing resources and process parameters; setup
information, and manufacturing planning information.
Methodology of CAPP is explained with figures in chapter 5 section 5.5.
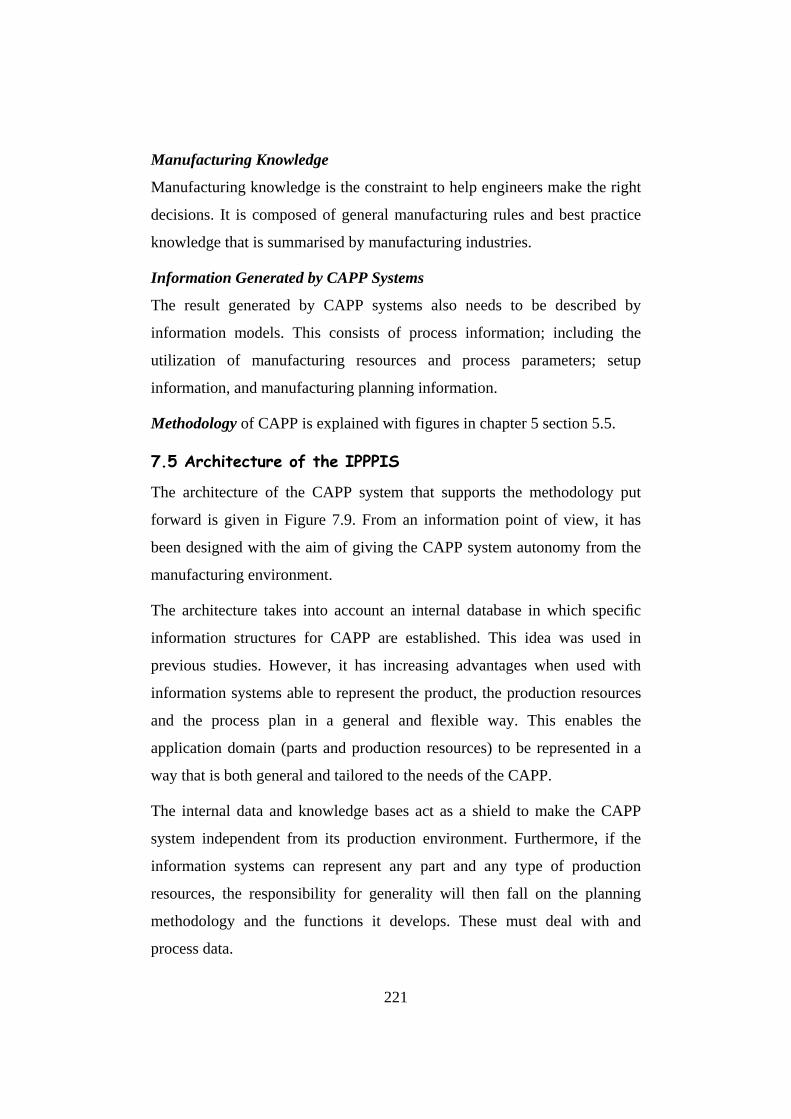
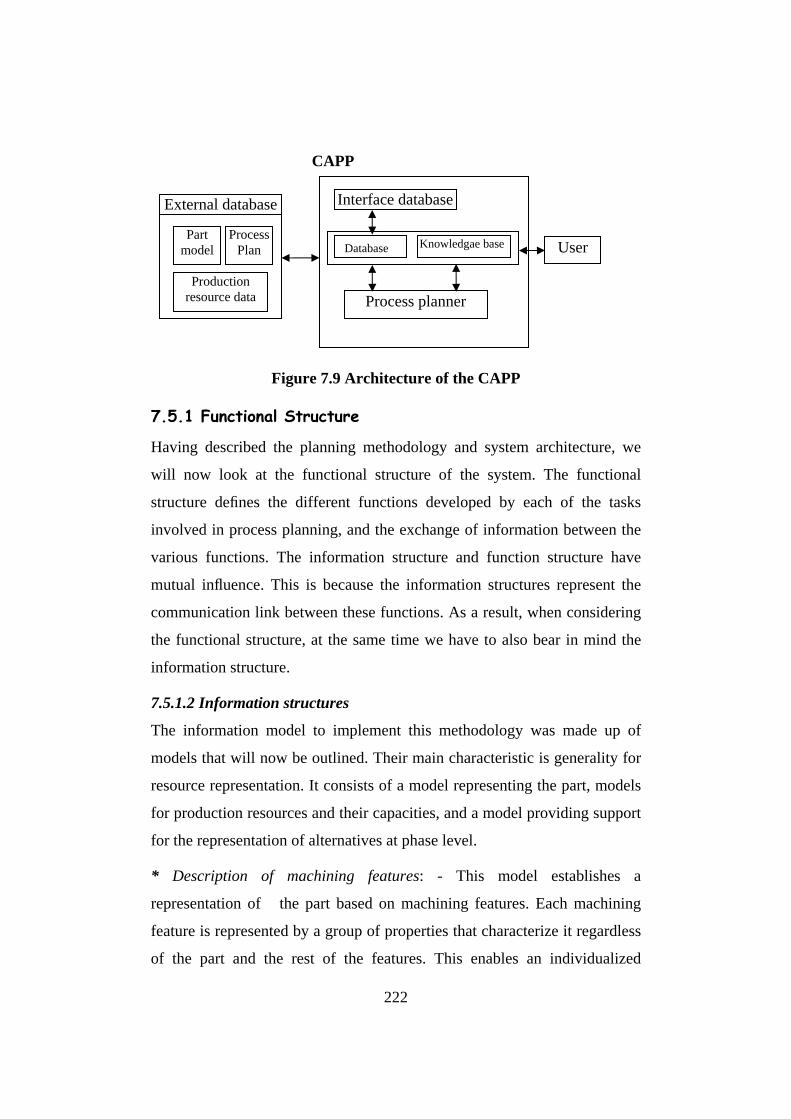
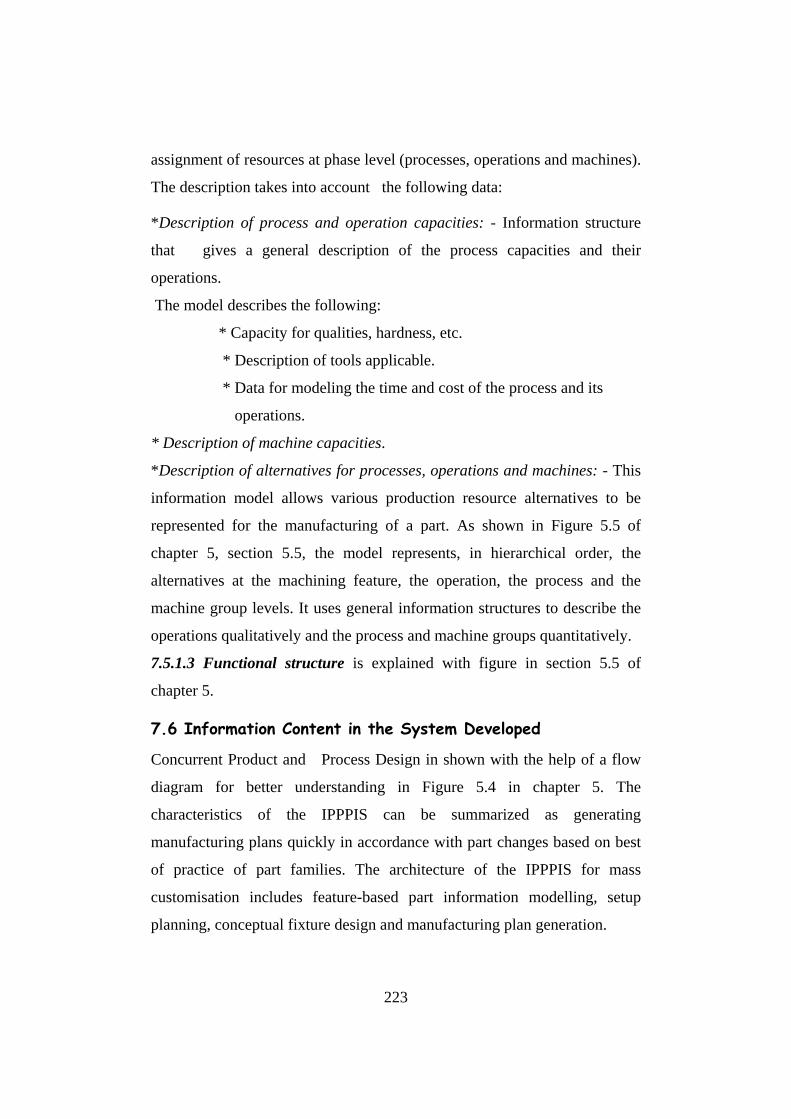
7.5 Architecture of the IPPPIS
The architecture of the CAPP system that supports the methodology put
forward is given in Figure 7.9. From an information point of view, it has
been designed with the aim of giving the CAPP system autonomy from the
manufacturing environment.
The architecture takes into account an internal database in which specific
information structures for CAPP are established. This idea was used in
previous studies. However, it has increasing advantages when used with
information systems able to represent the product, the production resources
and the process plan in a general and flexible way. This enables the
application domain (parts and production resources) to be represented in a
way that is both general and tailored to the needs of the CAPP.
The internal data and knowledge bases act as a shield to make the CAPP
system independent from its production environment. Furthermore, if the
information systems can represent any part and any type of production
resources, the responsibility for generality will then fall on the planning
methodology and the functions it develops. These must deal with and
process data.
221
External database Part
model Process
Plan
Production resource data
Interface database
Process planner
Database Knowledgae base
CAPP
User
Figure 7.9 Architecture of the CAPP
7.5.1 Functional Structure
Having described the planning methodology and system architecture, we
will now look at the functional structure of the system. The functional
structure defines the different functions developed by each of the tasks
involved in process planning, and the exchange of information between the
various functions. The information structure and function structure have
mutual influence. This is because the information structures represent the
communication link between these functions. As a result, when considering
the functional structure, at the same time we have to also bear in mind the
information structure.
7.5.1.2 Information structures
The information model to implement this methodology was made up of
models that will now be outlined. Their main characteristic is generality for
resource representation. It consists of a model representing the part, models
for production resources and their capacities, and a model providing support
for the representation of alternatives at phase level.
* Description of machining features: - This model establishes a
representation of the part based on machining features. Each machining
feature is represented by a group of properties that characterize it regardless
of the part and the rest of the features. This enables an individualized
222
assignment of resources at phase level (processes, operations and machines).
The description takes into account the following data:
*Description of process and operation capacities: - Information structure
describes the following:
that gives a general description of the process capacities and their
operations.
The model
* Capacity for qualities, hardness, etc.
* Description of tools applicable.
* Data for modeling the time and cost of the process and its
operations.
* Description of machine capacities.
ses, operations and machines: - This
mation Content in the System Developed
elp of a flow
*Description of alternatives for proces
information model allows various production resource alternatives to be
represented for the manufacturing of a part. As shown in Figure 5.5 of
chapter 5, section 5.5, the model represents, in hierarchical order, the
alternatives at the machining feature, the operation, the process and the
machine group levels. It uses general information structures to describe the
operations qualitatively and the process and machine groups quantitatively.
7.5.1.3 Functional structure is explained with figure in section 5.5 of
chapter 5.
7.6 Infor
Concurrent Product and Process Design in shown with the h
diagram for better understanding in Figure 5.4 in chapter 5. The
characteristics of the IPPPIS can be summarized as generating
manufacturing plans quickly in accordance with part changes based on best
of practice of part families. The architecture of the IPPPIS for mass
customisation includes feature-based part information modelling, setup
planning, conceptual fixture design and manufacturing plan generation.
223
A systematic information modelling technology was used to represent the
information relationships and associativities from the system perspective.
The OSA approach was used as the primary tool to describe the static and
dynamic characteristics of information. Therefore, the information
associativities within the IPPPIS between part design and manufacturing
planning can be properly described, so can the information in BOP of part
families. A three-level decision-making mechanism was used by making use
of the systematic information modelling technology. At the feature-level,
the combined features and their manufacturing strategies were defined based
on part families.
First, feature-based part information modelling was studied, based on the
BOP of part families. In the IPPPIS, parts are grouped into part families.
The parts in the same family may have similar manufacturing plans, which
are composed of sequences of processes and the manufacturing resources
used to carry out these processes. In the research, the definition of feature is
extended to include combined features, which are associated with particular
processes that are pre-defined by specific part families.
Figure 6.13 in chapter 6, section 6.3 shows the diagram of IPPPIS
architecture. The software contains function modules: (1) The part
information modelling module extracts part information; recognizes
manufacturing features; and associates them with predefined manufacturing
strategies; the module then organize feature based part information (2) The
setup planning module can generate setup plans based on BOP (3) The
conceptual fixture design module (4) The manufacturing plan generation.
Manufacturing plan generation is a special step for mass customization. Part
layout on fixture bases, global process and tool path generation, and cycle
time calculation are discussed at this stage based on the machine-level
decision-making strategies. Cycle time was used as the criterion to evaluate
the manufacturing plans.
224

The Manufacturing knowledge and BOP are stored in relational databases
and knowledge bases. Figure 5.4 in chapter 5, section 5.5, shows the
overview of database relationships, in which part type, feature type, process
type and manufacturing resource type are stored. However, this kind of
databases is not suitable for storing the knowledge that is specified by BOP
because this knowledge is associated with specified manufacturing industry
environments and does not have a unified format.
7.7 Use of Information Model for Lean Manufacturing
Lean manufacturing means eliminating wastes by identifying non-value
added activities thorough out the supply chain. The five fundamental Lean
principles are: to specify value from the point of view of customer, identify
the value stream, make the identified value flow, set the pull system which
means only make as needed; and finally perfection in producing what the
customer wants and by when it is required in the right quantity with
minimum waste [104].
Toyota Production System (TPS), which is known as Lean manufacturing
by in their book “The Machine That Changed the World” has influenced the
manufacturing, practices around the world [105]. The fundamental of TPS is
to eliminate wastes and produce only the items needed at the required time
and in the required quantities. Principles of lean are universal as they are
broadly accepted by many manufacturing operations and have been applied
successfully across many disciplines. It has become an integrated system
composed of highly inter-related elements and a wide variety of
management practices including just in time, quality system, work teams,
cellular manufacturing, etc.
The available models are not fully integrated with each other or with another
information model. Some issues addressed by the IPPPIS model developed
225

to make the organization more responsive to change and minimise the
waste, to make them as lean enterprise are as follows:
• Assure seamless information flow by enabling practices like link databases for key functions throughout the value chain; minimize documentation while ensuring necessary data traceability and availability.
• Implement integrated product and process development. Most published process plan models form detailed process planning, not the preliminary process planning in the early product assesment stage, is extended to the manufacturing information hierarchical structure.
• The type of methods used for manufacturing cost and time estimation is integrated into the manufacturing process model.
7.7.1 Lean Manufacturing through Cellular Manufacturing
Customers demand variety and customization as well as specific quantities
delivered at specific times; a lean producer must remain flexible enough to
serve its customers' needs. CM allows companies to provide their customers
with the right product at the right time. It does this by grouping similar
products into families that can be processed on the same equipment in the
same sequence.
The benefits of CM such as faster throughput times, improved product
quality, lower Work- In-Process (WIP) levels and reduced set-up times,
were achieved through the model built in the IPPPIS. These gains are
achieved because the batch sizes can be significantly reduced. As set-up
times decrease through the use common tools or the collaboration of cell
workers during set-up times, batch size can be reduced. The shorter the set-
up time the smaller the batch size, and as a goal, a batch size of one is
feasible when set-up time is zero. Within a cell, small batch sizes do not
travel very far as machines are collocated, resulting in less work-in-
226
progress, shorter lead times and much less complexity in production
scheduling and shop floor control.
CM offers an opportunity to combine the efficiency of product flow layouts
with the flexibility of functional layouts. In CM, products with similar
process requirements are placed into families and manufactured in a cell
consisting of functionally dissimilar machines dedicated to the production of
one or more part families [106]. By grouping similar products into families,
the volume increases justifying the dedication of equipment. However, since
this volume is justified by process and product similarity, CM warrants
much more flexibility than a pure product-flow layout. In terms of the
product-process matrix, CM allows movement down the vertical axis, i.e., it
allows increasing the continuity of the manufacturing process flow without
demanding that the products be made in large volumes. This is further
explained in section below:
7.7.1.1. Benefits by Machine Grouping
Machines can be grouped depending upon the feature-manufacturing
requirement. Further machine groups are selected as per the design features,
which will lead the system to rationalisation and standardisation of design
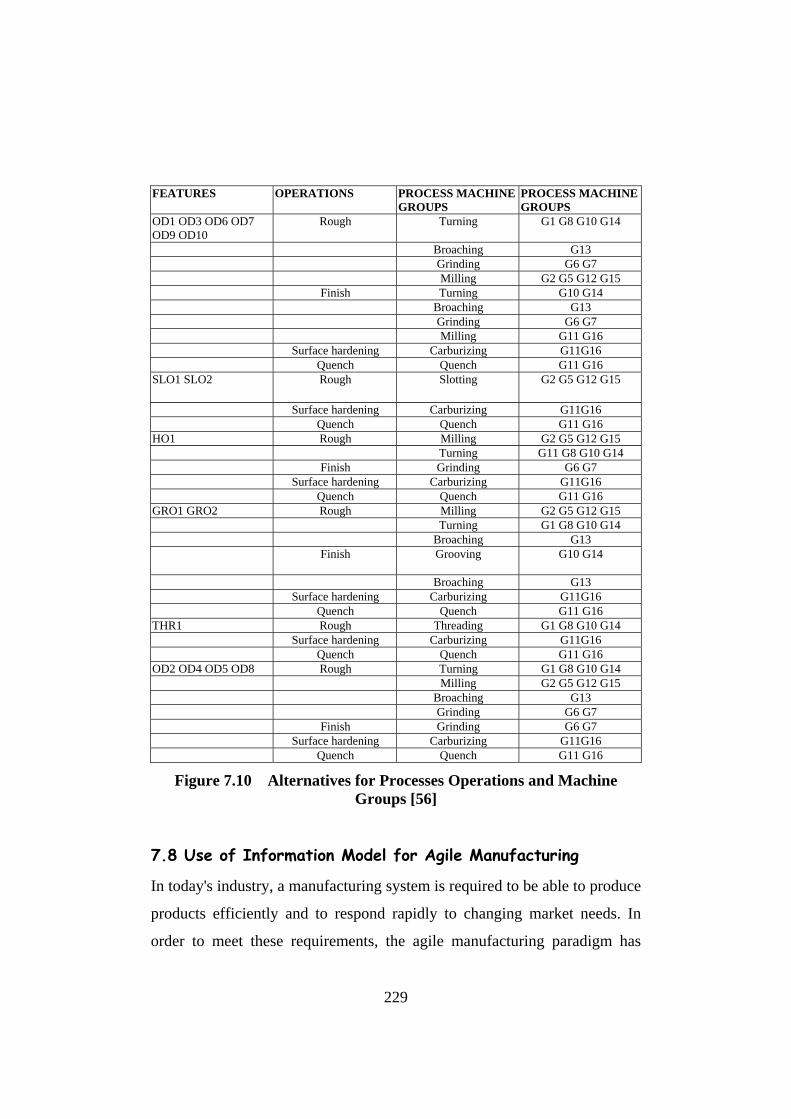
and process. Figure 7.8, Figure 7.9 and Figure 7.10 explain this.
Some other benefits of the CE implementation revealed by the case study
are as given below:
227
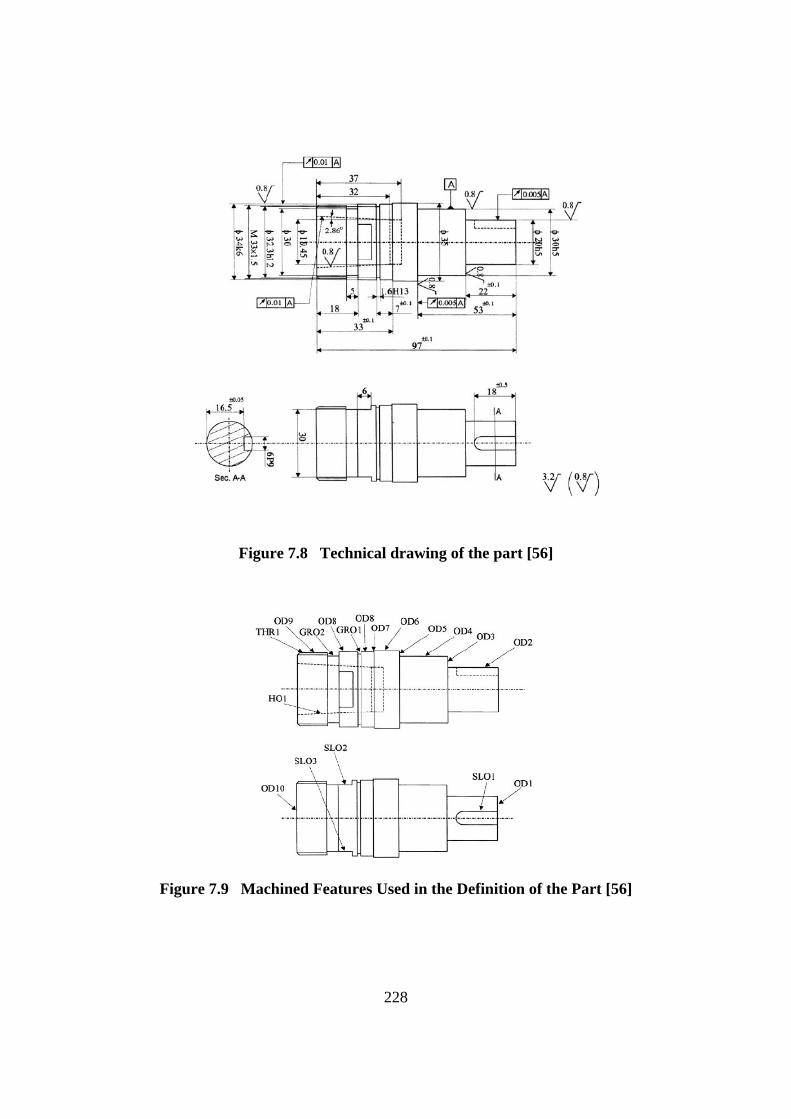
Figure 7.8 Technical drawing of the part [56]
Figure 7.9 Machined Features Used in the Definition of the Part [56]
228
FEATURES OPERATIONS PROCESS MACHINE GROUPS
PROCESS MACHINE GROUPS
OD1 OD3 OD6 OD7 OD9 OD10
Rough Turning G1 G8 G10 G14
Broaching G13 Grinding G6 G7 Milling G2 G5 G12 G15 Finish Turning G10 G14 Broaching G13 Grinding G6 G7 Milling G11 G16 Surface hardening Carburizing G11G16 Quench Quench G11 G16
SLO1 SLO2 Rough Slotting G2 G5 G12 G15
Surface hardening Carburizing G11G16 Quench Quench G11 G16
HO1 Rough Milling G2 G5 G12 G15 Turning G11 G8 G10 G14 Finish Grinding G6 G7 Surface hardening Carburizing G11G16 Quench Quench G11 G16
GRO1 GRO2 Rough Milling G2 G5 G12 G15 Turning G1 G8 G10 G14 Broaching G13 Finish Grooving
G10 G14
Broaching G13 Surface hardening Carburizing G11G16 Quench Quench G11 G16
THR1 Rough Threading G1 G8 G10 G14 Surface hardening Carburizing G11G16 Quench Quench G11 G16
OD2 OD4 OD5 OD8 Rough Turning G1 G8 G10 G14 Milling G2 G5 G12 G15 Broaching G13 Grinding G6 G7 Finish Grinding G6 G7 Surface hardening Carburizing G11G16 Quench Quench G11 G16
Figure 7.10 Alternatives for Processes Operations and Machine Groups [56]
7.8 Use of Information Model for Agile Manufacturing
In today's industry, a manufacturing system is required to be able to produce
products efficiently and to respond rapidly to changing market needs. In
order to meet these requirements, the agile manufacturing paradigm has
229

emerged as an important concept in the development of manufacturing
systems. AM synonymous with responsive manufacturing in a broad sense
that is defined as the capability of surviving and prospering in a rapidly,
continuously and unpredictably changing environment, by responding
quickly and effectively and by taking a customer's views into account [107].
Information technology, virtual manufacturing, concurrent engineering,
standard of the exchange of product model data (STEP), web-based
engineering, design engineering and rapid prototyping are some of the
enablers for AM [5]. Among these, CE is a systematic approach to the
integrated, concurrent design of product and their related processes,
including manufacture and support. It is a useful and beneficial approach to
reduce the development time and manufacturing cost while simultaneously
improving the quality of a product to respond better to the customer
expectations.
In an effort to help designers better assess the downstream life cycle impacts
of their design choices, manufacturing companies and researchers have
developed many design decision support tools referred to as Design for X
(DFX) methodologies. This research is based on concurrent engineering
framework using effective application of information technology. A model
has been developed using object oriented technology, and cellular
manufacturing concept for collaborative design and manufacturing of
machine tool.
7.9 A Framework for Agile Manufacturing System for Machine Tool Industry There are several tools and methods that have been proposed to develop an
agile manufacturing system [108]. For modelling the agile manufacturing
system, we have to clarify what a manufacturing environment and a system
commonly mean. Manufacturing environments are product-dependent. They
are somewhat like natural phenomena, which evolve due to various forces
230

that work in the market place. Attributes defining manufacturing
environments include.
1. Product characteristics: - Features and functions of the product.
2. Product variety: - Different types of products the company should
produce.
3. Lead-time: - Period of time until the product enters the market.
4. Product life cycle (PLC):- Length (or number of periods) and
quantity a product is in demand over its life-cycle.
Such attributes are the defining factors of traditional and agile
manufacturing environments. The means by which the company selects to
deal with attributes of an environment and attempts to control the situation
is referred to as a manufacturing system.
The business cycle in machine tool manufacturing closely follows the
general economic cycle and has therefore always been subject to cyclical
fluctuations. Businesses need to compete efficiently and quickly respond to
market needs and niches. There is no doubt that the machine tool
manufacturers are confronted with challenges and looking to implement
improvements in their key activities or processes to cope with the market
fluctuations and increasing customer requirements. Applying agile
manufacturing philosophy is one of the most important concepts that help
businesses to compete. On analysis of the difficulties experienced by the
Indian machine tool industries to address the customer demand, the
following reasons are indicated as some of the obstacles.
• Lower volume of demand • Decreasing volumes for identical products • Increasing product variety. • Decreasing concept-to-market and, thus, the introduction
time between new products. • The customer orders are highly fluctuating/varying
231

• Customer-specific tooling • Long lead time to produce a machine tool • Frequent changes in design • Resource constraints with reference to volume
The above factors may have a significant influence on day-to-day
operational strategy variation. Many industrial studies conducted have
revealed that most of the machine tool manufacturing activities are highly
influenced by the customers. To cope with such characteristics, the concept
of agile manufacturing comes into play. Agile manufacturing environments
differ from traditional manufacturing environments in the fact that product
life cycles are becoming shorter while the quest for higher qualities are
becoming more consequential, and products are becoming increasingly
diversified and global[109].
The agile manufacturing system should be able to produce a variety of
components at low cost and in a short time period. The design rule reduces
manufacturing lead times in consecutive changes of product models.
Managing change in a manufacturing environment requires a more
systematic method of concurrently designing both the product and the
downstream processes for production and support. Agile manufacturing
requires a rapid product design system with the objective of switching over
to new products as quickly as possible. It is then essential to the
employment of CE during (when realizing) new product development
(NPD), which can be called concurrent new product development for AM,
which is built in the IPPPIS.
7.10 Integration of Product Models and Process Models for Agile manufacturing in the IPPPIS The relations between the product model and process model were analysed
from the viewpoint of integration, and the coupling mechanism of models
was also established in the developed IPPPIS. The logicality of the
232
development process and the completeness of product model information
were emphasized. Therefore, it can promote the development process
evolvement efficiently and make the product development process optimal.
7.10.1 The Relations Between Product Model and Process Model Product model describes the product information and the relations among
information. It is the digital and abstract definition of a realistic product. In
general, product model data is determined by its structure and its content.
The structure is dependent on the nature of the product and the tools used to
model the information as well as to build the necessary schemes for the
database. The content is dependent on the particular product. Process model
is the abstract description of the product development process, and it can be
used to analyze, optimize, and establish the activity process of product
development and to assist the management and monitoring of the whole
process.
Product development process modeling, in its complete sense, consists of
two interrelated aspects: product model and process model. Product models
are referred to product model databases and their associated management
and access algorithms. Process models are also commonly referred to
product development workflow or product modeling processes. The basic
requirement of integrated product and process development is that both the
product model and the process model are integrated in one model frame.
That is to say, it should realize the integration of the two models, i.e.,
coupling. The validity of coupling will determine the quality of product
development.
7.10.2 Development Mode Based on Model Integration
There are three different development modes as shown in Figure 7.11.
1. The product model is the main line of product development. In this
mode, product model is static, and process model is dynamic. The
233

product model is the kernel of the development process. The process
model is improved (or reorganized) continuously to adapt to the product
model, by which the product development is completed.
2. The process model is the main line of product development. In this
mode, the process model is static, and product model is dynamic. The
process model is the kernel of the development process. The product
model is modified based on the development environment to adapt to
the process model.
3. Integrated development mode. In this development mode, the product
model main line and process model main line are integrated. Based on
the practical development environment, both the product model and
process model were modified synchronously to adapt to each other. This
modification is dynamic and mutual. The state of product model
information and process model information change simultaneously.
Figure 7.11 Development Mode Based on Model Integration.
Benefits using IPPPIS, which gives agility in the system was explained in
subsequent section:
234
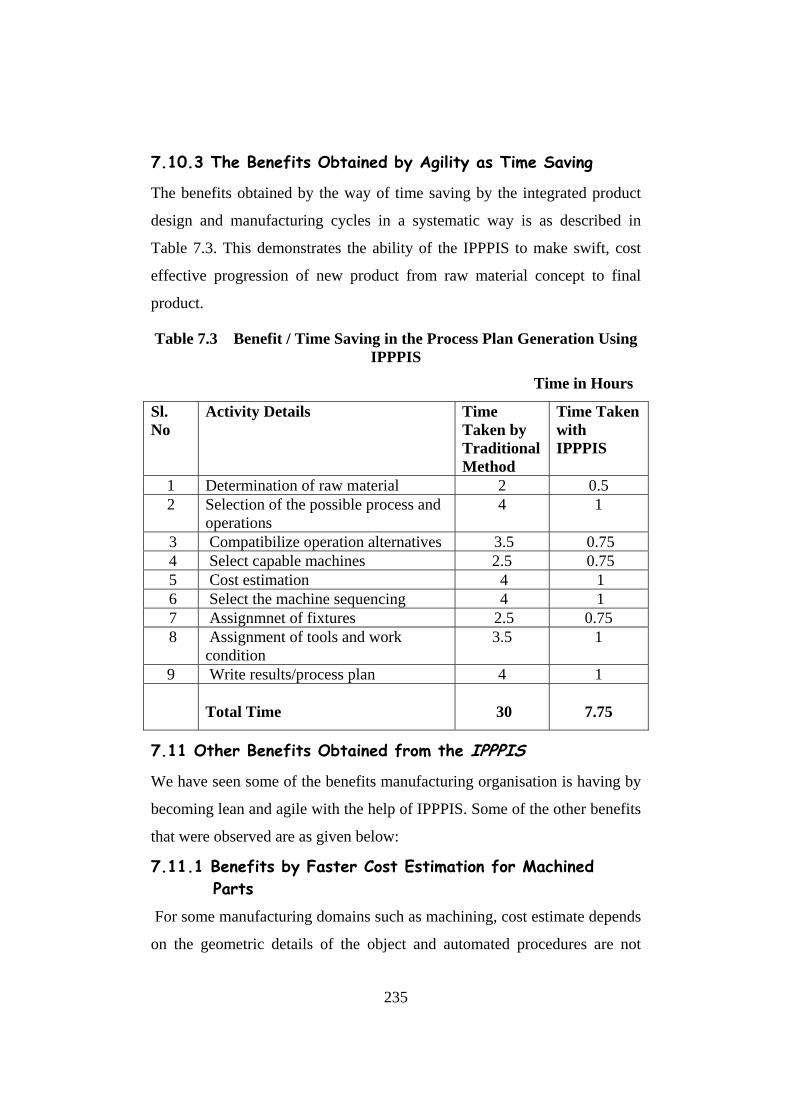
7.10.3 The Benefits Obtained by Agility as Time Saving
The benefits obtained by the way of time saving by the integrated product
design and manufacturing cycles in a systematic way is as described in
Table 7.3. This demonstrates the ability of the IPPPIS to make swift, cost
effective progression of new product from raw material concept to final
product.
Table 7.3 Benefit / Time Saving in the Process Plan Generation Using IPPPIS
Time in Hours
Sl. No
Activity Details Time Taken by Traditional Method
Time Taken with IPPPIS
1 Determination of raw material 2 0.5 2 Selection of the possible process and
operations 4 1
3 Compatibilize operation alternatives 3.5 0.75 4 Select capable machines 2.5 0.75 5 Cost estimation 4 1 6 Select the machine sequencing 4 1 7 Assignmnet of fixtures 2.5 0.75 8 Assignment of tools and work
condition 3.5 1
9 Write results/process plan 4 1
Total Time
30
7.75
7.11 Other Benefits Obtained from the IPPPIS
We have seen some of the benefits manufacturing organisation is having by
becoming lean and agile with the help of IPPPIS. Some of the other benefits
that were observed are as given below:
7.11.1 Benefits by Faster Cost Estimation for Machined Parts For some manufacturing domains such as machining, cost estimate depends
on the geometric details of the object and automated procedures are not
235

available for doing accurate cost estimation. Currently in such cases,
humans perform cost estimation. In the internet era, where designers solicit
many quotes to make a decision, manual cost estimation is not economical.
Cost of manufacturing a new part can be quickly estimated by finding
previously manufactured parts that are similar in shape to the new part.
If a sufficiently similar part can be found in the database of previously
manufactured objects, then the cost of the new part can be estimated by
suitably modifying the actual cost of the previously manufactured similar
part. Figure 7.12 shows a new part and a previously manufactured similar
part that can be used to provide cost estimate for the new part.
Figure 7.12 An Example of Using a Similar Part for Cost Estimation
7.11.2 Benefits by Part Family Formation
In many manufacturing domains such as sheet metal bending, machine tools
can be setup to produce more than one type of part without requiring a setup
or tool change [3, 76]. However, parts need to be shape compatible in order
for them to share common tools and setups. Therefore, in order to find
common tools and setups, geometrically similar and therefore compatible
parts need to be grouped into families. Shared tools and setups can be used
to manufacture objects in the same family and therefore result in significant
cost savings.
236

7.11.3 Benefits by Reduction in Part Proliferations Reusing design/manufacturing information stored would result in a faster
and more efficient design process. While designing a new part the designer
can refer to existing designs and utilize the components used previously. Let
us consider the design of the shaft of a turbine engine. Usually the designer
has two options. The first option is to design the shaft from scratch and go
through the process and manufacturing planning. The second option is to
refer to the database of existing designs and select an existing shaft and
either use it as it is or make minor modifications to it (e.g., drill a few holes
or cut a few slots). The process of creating a preliminary concept of the
shaft and selecting a shaft similar to the proposed concept is illustrated in
Figure 7.13.
Figure 7.13 An Example of Using an Existing Shaft for Reducing Part
Proliferation
With more and more 3D models being added to databases, a need to
organize and index databases of 3D models. This will provide a systematic
and efficient way of retrieving similar models from the database. Group
Technology has traditionally been used to categorize parts having
237
similarities in design and manufacturing. Group Technology (GT) involves
classifying similar products into groups in order to achieve economies of
scale normally associated with high-volume production. In order to
implement GT, one must have a concise coding scheme for describing
products and a method for grouping (or classifying) similar product, such as
the popular Opitz, DCLASS, and MICLASS schemes. In each case, the
basic idea is for the users to use various tables and rules to capture critical
design and manufacturing attributes of a part in an alphanumeric string, or
GT code, which is assigned to that part. However, as the classification is
done manually, it is subject to individual interpretation. It has been shown
that human perception of similarity is subjective. Thus, there are
possibilities of errors in such classifications.
7.11.4 Benefits from Intangible Factors
• Improved communications through common vocabulary
• Increased capacity of existing equipment
• Increased process planning productivity
• Individual expertise knowledge capture
• Improved responsiveness to customers
• Reduced throughput time
• Standardization in process plans, designs, terminology
• Increased process plan and estimate accuracy
• Reduced time for engineering changes
• Reduced cost of quality
• Reduced raw material requirements for tooling
• Increased productivity on a plant-wide basis
• Reduction in setup times
238

7.12 Implementation Example Initial Implementation and Model Testing
A ball screw assembly was used in testing the object model and pilot
implementation of a preliminary process planning system. The reason for
choosing ball screw assembly is that they are widely used in the mechanical
and automotive industries. The manufacturing processing information of
output housing components of a ball screw assembly is used as an example.
Figure 7.14 shows a bearing housing component. The object model has been
tested by populating the manufacturing information into the model. In
addition, the model was used as the basis for implementing a preliminary
process planning system.
Initial Implementation
As shown in Figure 7.15, an integrated knowledge based IPPPIS has been
implemented using a relational database management system Oracle 9i that
supports the Structured Query Language (SQL). The information about an
artifact design, processes, resources, time, and cost structure is stored in the
database. The preliminary process planning system starts with reading the
artifact information from the artefact database, including artifact name, main
shape, shape complexity, symmetry, secondary positive features, secondary
negative features, material, maximum size, tolerance, surface condition, and
production volume. Then, the selection of primary manufacturing processes
follows. This system automatically selects candidate primary manufacturing
processes based on manufacturing knowledge. Next was the selection of
manufacturing resource (machine, fixtures and tool for machining),
estimating manufacturing time and cost, and then selection of the best
manufacturing processes according to estimated manufacturing cost.
Figure 7.16 shows the Artifact information interface and code generation
screen. Different weightages can be given for the different features by
assigning different weights between 0-100 through the screen as shown in
239
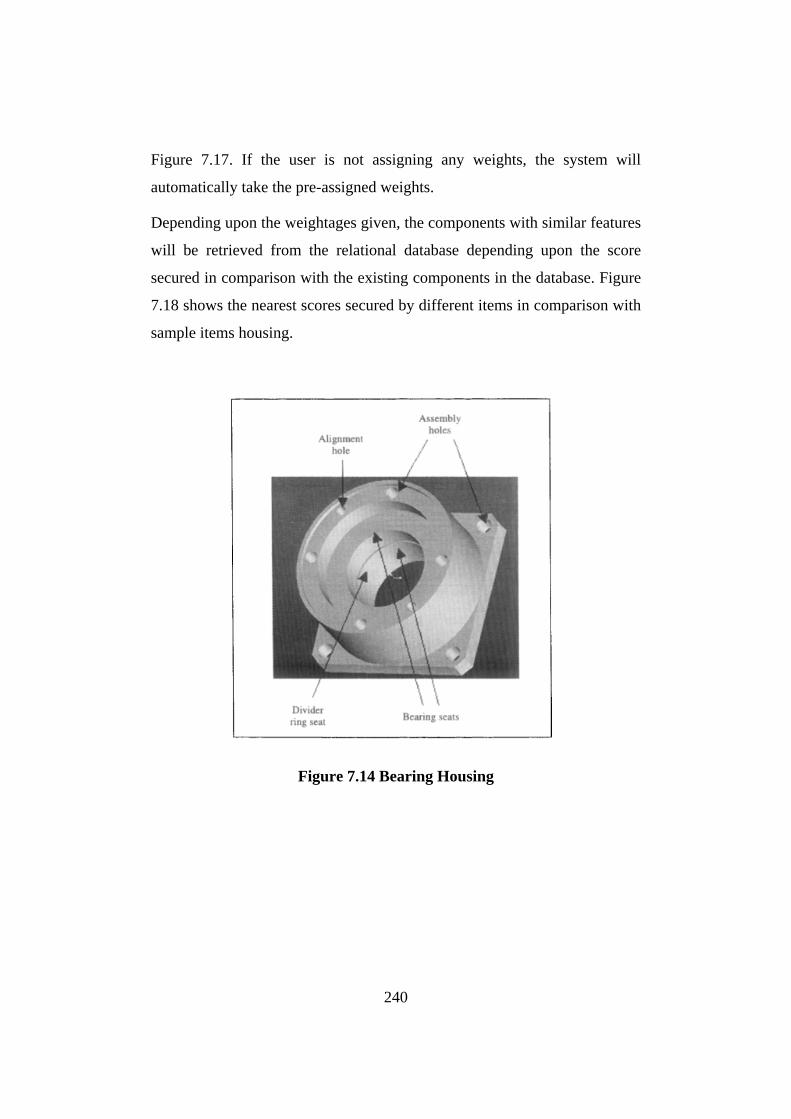
Figure 7.17. If the user is not assigning any weights, the system will
automatically take the pre-assigned weights.
Depending upon the weightages given, the components with similar features
will be retrieved from the relational database depending upon the score
secured in comparison with the existing components in the database. Figure
7.18 shows the nearest scores secured by different items in comparison with
sample items housing.
Figure 7.14 Bearing Housing
240

Figure 7.15 Interface of Integrated Knowledge Based IPPPIS
The information of an artifact design can be directly read from an artifact
database. Figure 7.19 shows the result of selecting manufacturing process
plan based on manufacturing knowledge for the housing component.
Figure 7.20 shows that the manufacturing costs incurred in different
processing step. The optimization can be done on the proposed process plan
by using the alternate processes.
Other screens developed as a part of the system is given as Appendix-10
with its functions explained below with each screen
The structure of the information is stored in a relational database, for the
developed system is shown as Appendix-11.
241

Figure 7.16 Code Generation Screen
Figure 7.17 Screens for Weightage for Different Attributes
242

Figure 7.18 Nearest Scores Secured by Different Items in Comparison
with Sample
243
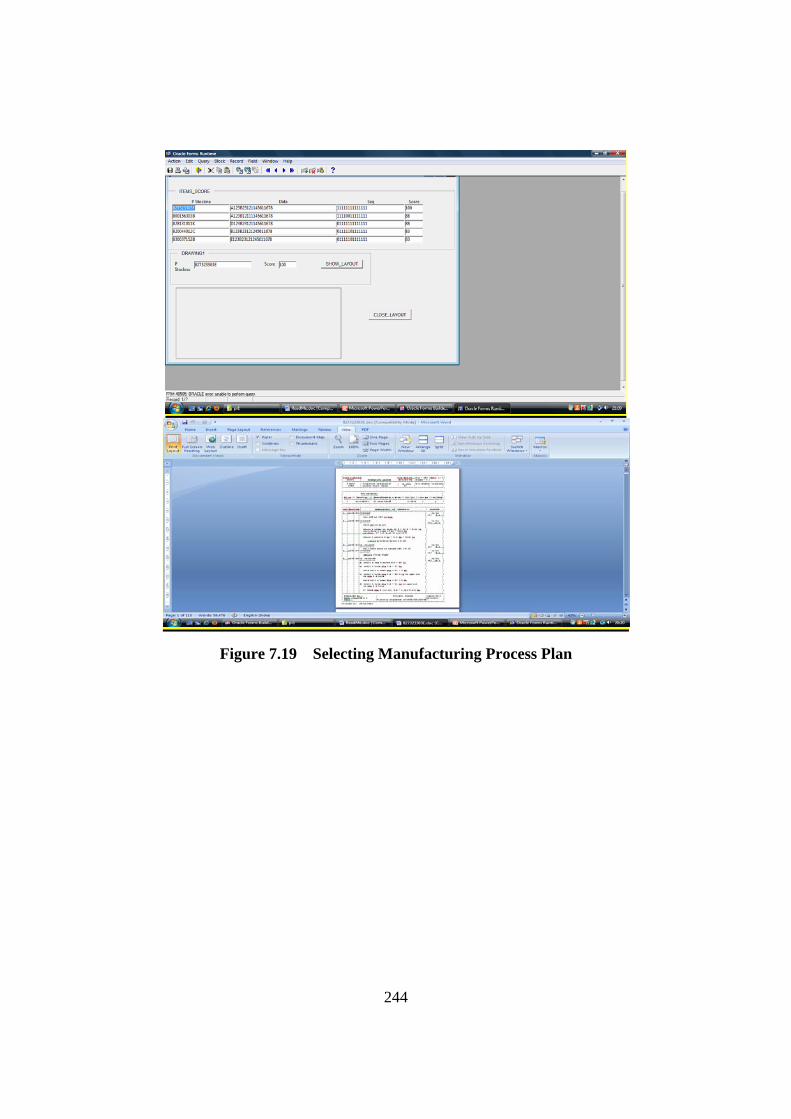
Figure 7.19 Selecting Manufacturing Process Plan
244

Figure 7.20 Screen Showing Manufacturing Costs Incurred in
Different Processing Step
7.13 Conclusion of the Case Study - Benefits of Concurrent Engineering Implementation It is seen that the conventional design process followed in the company was
taking too much time. Time overrun was the primary culprit, cost overrun
and quality problems were also found. Since manufacturing time could not
be reduced much without major capital investment, it was decided to give a
try to reduced time for design. CE is an accepted method to reduce time
taken for the design process and system complexities. CE practices such as
design for manufacture and feature based CAPP were introduced and
practiced for two years. An audit was then undertaken to evaluate the
monetary gains from CE implementation.
Some of the benefits of the CE implementation revealed by the case study
are as given below:
1. Machines can be grouped depending upon the feature-manufacturing
requirement. Further machine groups are selected as per the design
features, which will lead the system to rationalisation and
245

standardisation of design and process. This is explained in section
7.7 , with Figure 7.8, Figure 7.9 and Figure 7.10 of this chapter.
2. Reduction in the number of components for new machines. This is
achieved by reuse of the existing components. This will benefit
organisation directly by the way of reduction in design and
development time and cost of machines. This will further benefit the
organisation by reducing inventory, reducing systemic complexities
etc.
The direct cost benefit derived by reduction in the number of manufacturing
components is explained with Table 7.4, Table 7.5 and Table 7.6.
Table 7.4 gives details of the machines considered for the case study with
Manufacturing Items produced in-house.
Table 7.5 gives Cost details of the components manufactured in the machine
tool factory considered in the case study.
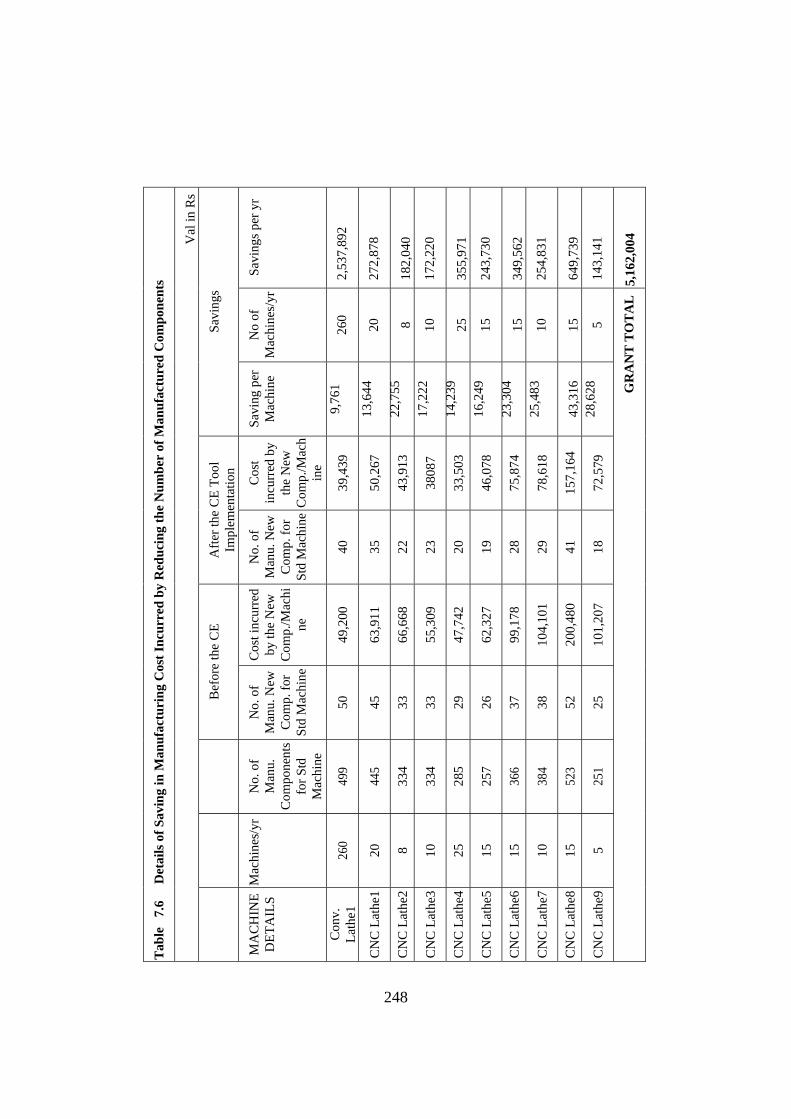
Table 7.6 gives the details of direct saving in manufacturing cost incurred
by reducing the number of manufactured components.
246

Table 7.4 Machines Considered for the Study with Manufacturing Items Details
Machine Details Machine/yr
Total Number of Manu. Items
Number of Manu. Items per Std Machine NEWITEMS
Conventional Lathe 260 1003 499 50 CNC Lathe 1 20 652 445 45 CNC Lathe 2 8 167 334 33 CNC Lathe3 10 1648 334 33 CNC Lathe 4 25 925 285 29 CNC Lathe 5 15 925 257 26 CNC Lathe 6 15 2074 366 37 CNC Lathe 7 10 663 384 38 CNC Lathe 8 15 2774 523 52 CNC Lathe 9 5 155 251 25
Table 7.5 Material and Labour Cost Details of the Components Manufactured
Machine Details
Total Number of Manu.
Items
Number of Manu. Items per
Std Machine
Material total value
Labour total value
Material average value
Labour Average
value Conventional Lathe 1003 499 1,90,399 3,01,605 382 604 CNC Lathe 1 652 445 3,12,924 3,26,184 703 733 CNC Lathe 2 167 334 3,00,087 3,66,588 898 1098 CNC Lathe3 1648 334 2,46,279 3,06,815 737 919 CNC Lathe 4 925 285 1,73,643 3,03,776 609 1066 CNC Lathe 5 925 257 2,71,079 3,52,193 1055 1370 CNC Lathe 6 2074 366 4,57,659 5,34,116 1250 1459 CNC Lathe 7 663 384 4,79,658 5,61,349 1249 1462 CNC Lathe 8 2774 523 9,27,735 10,77,061 1774 2059 CNC Lathe 9 155 251 5,71,253 4,40,814 2276 1756
247
Savi
ngs p
er y
r
2,53
7,89
2
272,
878
182,
040
172,
220
355,
971
243,
730
349,
562
254,
831
649,
739
143,
141
5,16
2,00
4
No
of
Mac
hine
s/yr
260
20
8 10
25
15
15
10
15
5 Savi
ngs
Savi
ng p
er
Mac
hine
9,76
1
13,6
44
22,7
55
17,2
22
14,2
39
16,2
49
23,3
04
25,4
83
43,3
16
28,6
28
Cos
t in
curr
ed b
y th
e N
ew
Com
p./M
ach
ine
39,4
39
50,2
67
43,9
13
3808
7
33,5
03
46,0
78
75,8
74
78,6
18
157,
164
72,5
79
Afte
r the
CE
Tool
Im
plem
enta
tion
No.
of
Man
u. N
ew
Com
p. fo
r St
d M
achi
ne
40
35
22
23
20
19
28
29
41
18
Cos
t inc
urre
d by
the
New
C
omp.
/Mac
hine
49,2
00
63,9
11
66,6
68
55,3
09
47,7
42
62,3
27
99,1
78
104,
101
200,
480
101,
207
Bef
ore
the
CE
No.
of
Man
u. N
ew
Com
p. fo
r St
d M
achi
ne
50
45
33
33
29
26
37
38
52
25
No.
of
Man
u.
Com
pone
nts
for S
td
Mac
hine
499
445
334
334
285
257
366
384
523
251
Mac
hine
s/yr
260
20
8 10
25
15
15
10
15
5
Tab
le
7.6
D
etai
ls o
f Sav
ing
in M
anuf
actu
ring
Cos
t Inc
urre
d by
Red
ucin
g th
e N
umbe
r of
Man
ufac
ture
d C
ompo
nent
s
Val
in R
s
MA
CH
INE
DET
AIL
S
Con
v.
Lath
e1
CN
C L
athe
1
CN
C L
athe
2
CN
C L
athe
3
CN
C L
athe
4
CN
C L
athe
5
CN
C L
athe
6
CN
C L
athe
7
CN
C L
athe
8
CN
C L
athe
9
GR
AN
T T
OT
AL
248

A summary of the monetary benefits are shown in Table 7.7.
Table 7.7 Benefits of Concurrent Engineering Implementation
Sl.
No
Benefits and Metrics Related Design/Process Cost incurred
In INR / year
Benefits in INR
Before After CE Savings As
%
1 Cost/Time reduction by better production planning control
by the way of
1.14. Productivity improvement by proper information
flow/ information sharing/better response
1.15. Manufacturing costs decrease due to optimum
process, correct information
1.16. Visibility and standardisation of processes
1.17. Rationalization, better allocation, effective planning
1.18. Effectiveness of supporting activities
1.19. Improved responsiveness by reduced complexity and
standardisation
1.20. Better common under standing by documented key
procedures
1.21. Better in identifying the problems by improved
processes
1.22. Effectiveness of collecting and evaluating the
production information
1.23. Improved ability in making decisions of all level of
employees
1.24. Encourage and promote capability of planning team
1.25. Better decision making by planning and design
1.26. Reduction in learning time
66,03,750 16,87,500 47,16,250 74
2 Development time/cost reduced due to
2.1. decrease in design/engineering changes
2.2. Improved design
2.3. Better design optimization
2.4. knowledge base related to design /process/material
2.5. Reduced number of parts due to rationalization
50,99,000 15,18,750 35,80,250 70
249

2.6.Reduced number of new parts and hence less design
effort
2.7. Better standardisation
3 Cost/Time reduction by flexibility in manufacturing
3.1.Better plant and resource utilisation
3.2. Different products can be produced effectively
3.3. Manufacturing can effectively respond to market
changes
3.4. Plant can reduce late delivery of products
3.5. Reduction in inventory costs
3.6. Reduction in machine and equipment costs
3.7. Reduction in labour and employee costs
3.8. Reduction in idle time
39,21,500 14,20,500
25,01,000 64
4 Waste of time/money reduced due to
4.1. Decrease in set up change over/ process resetting
4.2. Reduction in unnecessary motion
4.3. Reduction in unnecessary process
4.4. Reduction in Scrap/ Rework
4.5. Reduction in Inventory
4.6. Decrease in Under utilisation of people
4.7. Reduction in other non value added waiting time
4.8. Reduction in Tooling/Work Holding/Special Tools
4.9. Material availability, proper material usage
29,37,500 13,50,000 15,87,500 54
5 Improved Quality - required accuracy, precision as per
customer need, testing as per requirement
22,60,000 11,47,500 11,12,500 49
6 Others Benefits
6a Improved customer service and reducing the scrap 9,02,500
6b Better ability to manage new product development 8,43,750
TOTAL 1,52,43,750
250

Benefit obtained average per year = 1,52,43,750
Average turn over of the company after CE = 50,50,00,000
Benefit obtained as percentage
of turnover = 1,52,43.750 / 50,50,00,000 X100
= 3.02 %
Profit before CE =2,60,00,000
Average turn over of the company before CE = 45,50,00,000
Profit before CE as Percentage = 2,60,00,000 / 45,50,00,000 X100
= 5.72 %
Profit After CE = 3,50,43,750
Profit after CE as Percentage = 5,10,43,750 / 50,50,00,000 X 100
= 10.1 %
After introducing CE, 10 projects were facing problems problems out of 68
projects executed on an average per year. The company which has made
5.72 percent profit(Rs. 2,60,00,000 /yr ) on an average turnover of Rs.
45,50,00,000 is able to increase the profit margin to 10.1 percent profit ( Rs.
5,10,43,750/yr ) on increased turnover turnover of Rs 50,50,00,000.
7.14 Conclusion
A system implementation case study has been presented in this chapter to
demonstrate the benefits a machine tool manufacturing industry had from
the concurrent engineering IPPPIS. Overview of the machine tool industry
was given in the initial part of this chapter, which gave give structure and
current scenario of Indian machine industry. Problem areas, which requires
improvement were analysed in detail in the subsequent sections of this
chapter. The case study of IPPPIS in the machine tool manufacturing
company has shown its implementability. Conventional process planning
system and product development followed in the company were discussed
along with the general architecture of the IPPPIS used. Information content
251
and new process planning method in the IPPPIS were given detailed along
with the benefits that achieved by the system.
Using IPPPIS, information model developed, how the benefits of cellular
manufacturing make machine tool manufacturing firms to become lean have
been outlined. A framework for agile manufacturing for machine tool
industry was also discussed in this chapter. The relation between product
model and process model, the model integration are also detailed. The
benefits of integrated product and process model in IPPPIS for agile
manufacturing were brought out in the last part of this chapter. The details
of benefits that can be obtained by use of the IPPPIS by the way of time
saving, machine grouping, faster cost estimation, part family formation,
reduction in part proliferations by reusing previously designed parts, etc.
have been clearly explained.
From the case study it is clear that the IPPPIS is implementable in a
machine tool factory and significant saving in cost, time and effort are
possible with the CE implementation using the IPPPIS.
252