European Union: Single European Act till Maastricht Treaty (1956-1986)
A Clustering Approach
325
Chapter 7 Results using Maastricht Treaty Criteria
While the preceding chapter delivers the OCA-based findings, the present chapter
presents the findings addressing research questions involving the Maastricht Treaty
criteria. This chapter is also significant in a way as it also compares the results by the
real OCA dimensions of the previous chapter with those by the nominal Maastricht
dimensions of this chapter.
The research questions concerned in this chapter are highlighted in Table 7.1.
Questions 4, 6, and 7 involve only OCA criteria and hence are not discussed here. Other
questions will be answered using Maastricht variables. As with the OCA results, the
discussion on how the research questions would have been answered by the Maastricht
results will be detailed in Chapter 8.
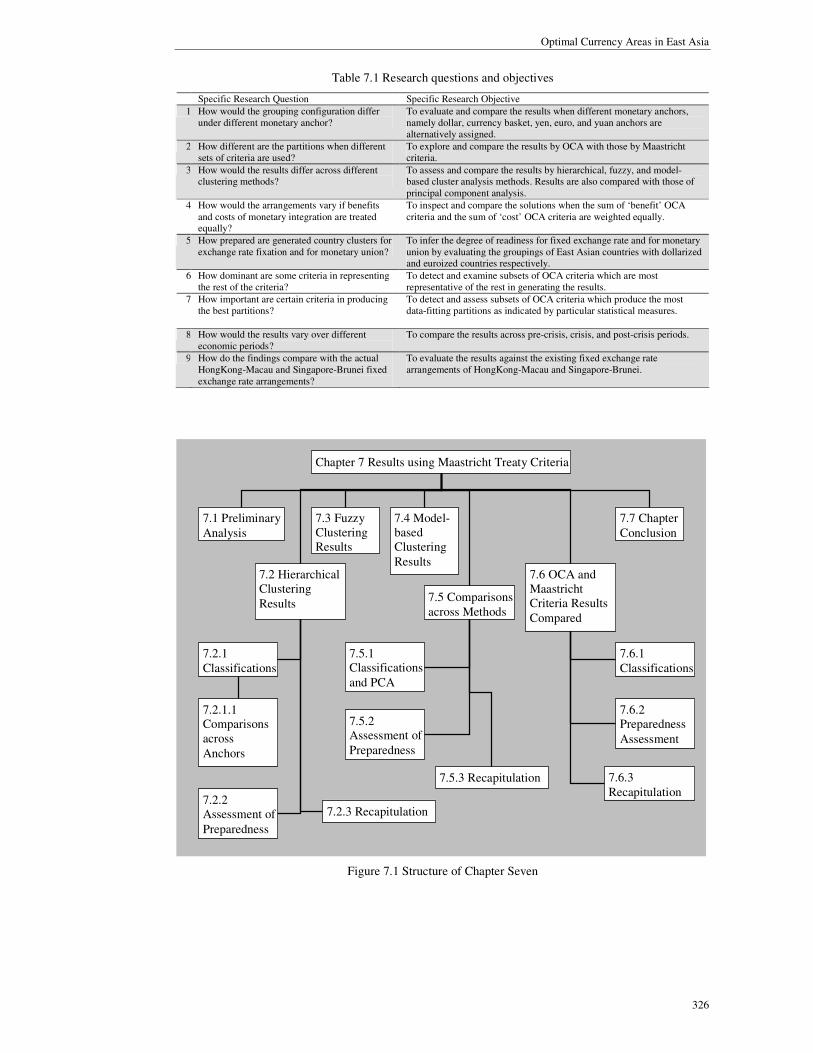
The structure of the chapter is depicted in Figure 7.1. Firstly, the chapter
commences with preliminary analysis in Section 7.1. The chapter then proceeds with the
findings by hierarchical cluster analysis (HCM) in Section 7.2, fuzzy cluster analysis
(FCM) in Section 7.3, and model-based cluster analysis (MBC) in Section 7.4. Each of
these cluster analysis sections contains classifications, assessment of preparedness, and
a recapitulation. The results are then compared and contrasted across methods in
Section 7.5. Lastly, OCA and Maastricht findings are compared in Section 7.6 in terms
of classifications and preparedness assessment. The chapter concludes in Section 7.7.
Optimal Currency Areas in East Asia
326
Table 7.1 Research questions and objectives
Specific Research Question Specific Research Objective
1 How would the grouping configuration differ under different monetary anchor?
To evaluate and compare the results when different monetary anchors, namely dollar, currency basket, yen, euro, and yuan anchors are alternatively assigned.
2 How different are the partitions when different sets of criteria are used?
To explore and compare the results by OCA with those by Maastricht criteria.
3 How would the results differ across different clustering methods?
To assess and compare the results by hierarchical, fuzzy, and model-based cluster analysis methods. Results are also compared with those of principal component analysis.
4 How would the arrangements vary if benefits and costs of monetary integration are treated equally?
To inspect and compare the solutions when the sum of ‘benefit’ OCA criteria and the sum of ‘cost’ OCA criteria are weighted equally.
5 How prepared are generated country clusters for exchange rate fixation and for monetary union?
To infer the degree of readiness for fixed exchange rate and for monetary union by evaluating the groupings of East Asian countries with dollarized and euroized countries respectively.
6 How dominant are some criteria in representing the rest of the criteria?
To detect and examine subsets of OCA criteria which are most representative of the rest in generating the results.
7 How important are certain criteria in producing the best partitions?
To detect and assess subsets of OCA criteria which produce the most data-fitting partitions as indicated by particular statistical measures.
8 How would the results vary over different economic periods?
To compare the results across pre-crisis, crisis, and post-crisis periods.
9 How do the findings compare with the actual HongKong-Macau and Singapore-Brunei fixed exchange rate arrangements?
To evaluate the results against the existing fixed exchange rate arrangements of HongKong-Macau and Singapore-Brunei.
Figure 7.1 Structure of Chapter Seven
7.2.1 Classifications
7.2.2 Assessment of
Preparedness
7.2 Hierarchical Clustering
Results
Chapter 7 Results using Maastricht Treaty Criteria
7.3 Fuzzy Clustering Results
7.4 Model-based Clustering
Results
7.1 Preliminary
Analysis
7.7 Chapter
Conclusion
7.5 Comparisons across Methods
7.5.1 Classifications
and PCA
7.5.2 Assessment of
Preparedness
7.2.1.1 Comparisons across
Anchors
7.6 OCA and Maastricht Criteria Results
Compared
7.6.1 Classifications
7.6.2 Preparedness
Assessment
7.2.3 Recapitulation
7.5.3 Recapitulation 7.6.3 Recapitulation

A Clustering Approach
327
7.1 Preliminary Analysis
The analysis begins with a general description of the Maastricht variables. The variables
are government budget deficit as percent of GDP (DEF), CPI inflation rate differential
(INF), standard deviation (x102) of the log difference in bilateral nominal exchange rate
(NER), and interest rate differential (INT). The latter three variables are measured
against a reference. Comparisons are made across reference countries and periods.
-12
-10
-8
-6
-4
-2
0
2
4
6
8
CHN HKG KOR TWN KHM IDN LAO MYS MMR PHL SGP THA VNM IND MAC BRN JPN AUS NZL CAN
Growth (Pre-crisis) Crisis Post-crisis
Figure 7.2 Budget deficit as percent of GDP
Figure 7.2 depicts the budget deficit ratios. Positive values represent budget
surpluses and negative values signify budget deficits. Only four countries, Singapore,
Macau, Brunei, and New Zealand consistently report a surplus across the periods. On
the contrary, high public deficits are reported by Laos, Vietnam, India, and Japan.
Consistently improving budget balance can be seen from China, Laos, Vietnam,
India, Brunei, and New Zealand whereas constantly deteriorating budget balance is
shown by Hong Kong, Taiwan, the Philippines, and Japan.
For the effective dollar areas of Hong Kong and Macau, Hong Kong exhibits a
budget deficit only for the post-crisis period which is relatively small whereas Macau
displays consistent surplus over the periods and even a remarkable surplus for the post-

Optimal Currency Areas in East Asia
328
crisis period. For the monetary union constituents of Singapore and Brunei, both had
been having consistent positive budget balances over the periods and Singapore even
reported the largest surplus amongst the countries in almost all periods. These healthy
budget balances appear to support the fixed exchange regimes implemented by these
economies.
67.30
0
3
6
9
12
15
18
21
24
27
30
PRE CRS PST
US
68.11
0
3
6
9
12
15
18
21
24
27
30
PRE CRS PST
G3
69.31
0
3
6
9
12
15
18
21
24
27
30
PRE CRS PST
JPN
68.45
0
3
6
9
12
15
18
21
24
27
30
PRE CRS PST
DEU
69.46
0
3
6
9
12
15
18
21
24
27
30
PRE CRS PST
CHNCHN
CHN HKG KOR TWN KHM IDN LAO MYS MMR PHL
SGP THA VNM IND MAC BRN JPN AUS NZL CAN
Figure 7.3 Inflation rate differential (%)
Inflation rate differentials measuring convergence in inflation with each of the
reference countries are portrayed in Figure 7.3. Immediately, one can see a general rise
in inflation convergence depicted by lower differentials toward each of the reference

A Clustering Approach
329
levels since the Asian crisis. Nevertheless, dispersion in the rate of inflation in the less
developed Indonesia and the two least liberalized economies of Laos and Myanmar had
remained high.
For Hong Kong and Macau, their degrees of inflation convergence with US and
with China had been increasing and even converged in the post-crisis period, in line
with the hard dollar pegs in Hong Kong and Macau. This is straightforward because the
inflation in China had also been converging toward that in US, coherent with the yuan-
dollar rate fixation during that time. For Singapore and Brunei, their levels of inflation
convergence with the G3 reference had been rising before converging in the post-crisis
period, consistent with their prevailing common currency basket peg led by Singapore.
Figure 7.4 puts together the standard deviations measuring nominal exchange rate
volatility with each of the reference countries. It is apparent that variability was
precipitously high in the crisis period particularly against the German mark/euro. After
the crisis period, the region’s exchange rates had been ever stabler against every
reference currency especially against the dollar and the yuan.
Notice that the distributions over countries for US and China references are
virtually the same for the crisis and the post-crisis period because the nominal rate of
the Chinese renminbi had been pegged to the US dollar in those periods.
For Hong Kong and Macau, their nominal dollar rates had been equally highly
stable throughout, exemplifying their hard dollar pegs and Macanese currency board on
the HK dollar. For Singapore and Brunei, their exchange rate variations are constantly
symmetrical, reflecting their monetary union arrangement.

Optimal Currency Areas in East Asia
330
10.9
16.716.8
0
2
4
6
8
10
12
PRE CRS PST
US
11.2
17.5 12.525.5
0
2
4
6
8
10
12
PRE CRS PST
G3
11.5
16.4
14.812.0
33.3
0
2
4
6
8
10
12
PRE CRS PST
JPN
12.1
11.4
19.714.9 14.633.1
0
2
4
6
8
10
12
PRE CRS PST
DEU
7.6
11.916.7
15.0
11.4
32.9
0
2
4
6
8
10
12
PRE CRS PST
CHNCHN
CHN HKG KOR TWN KHM IDN LAO MYS MMR PHL
SGP THA VNM IND MAC BRN JPN AUS NZL CAN
Figure 7.4 Standard deviation (x102) of the log difference in bilateral nominal exchange rate
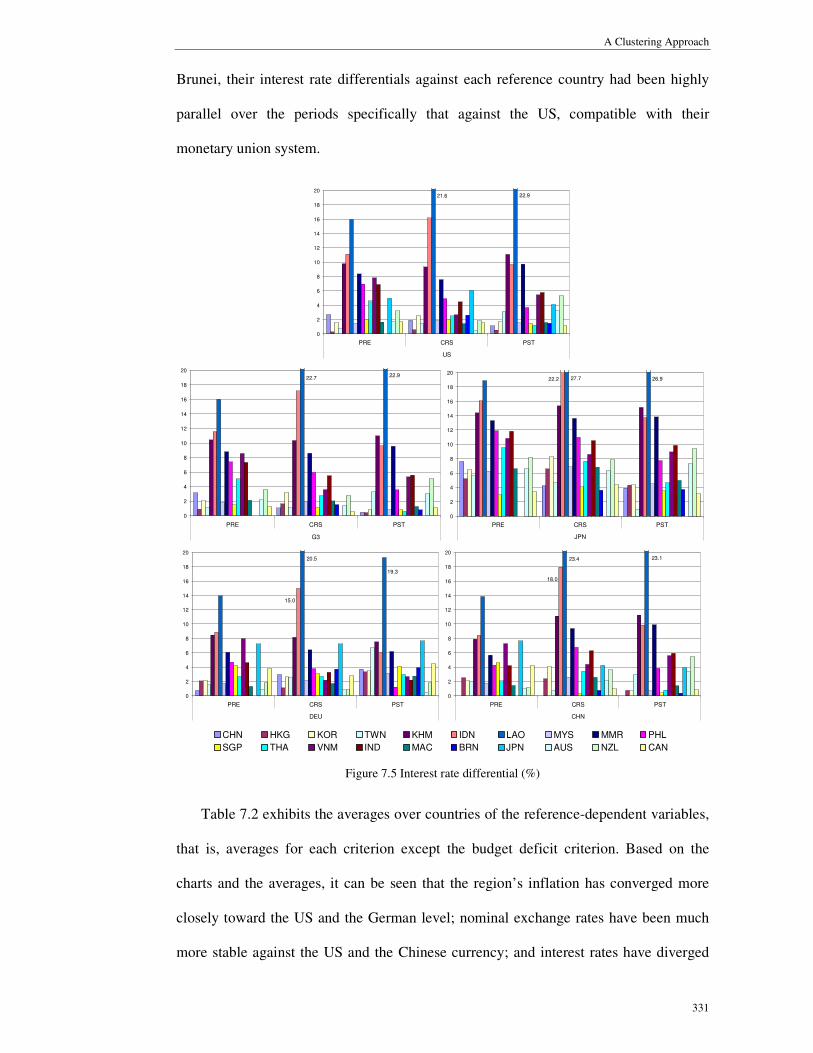
Figure 7.5 depicts the interest (lending) rate differentials with the reference rates.
By and large, the patterns over the countries are similar over the periods. Noticeably,
the rates are comparatively divergent from the Japanese rate. This is not unexpected
given the lost decade and the near-zero nominal interest rates in Japan since around
1990. Amongst the countries, consistently higher spreads are shown by Indonesia, Laos,
Cambodia, and Myanmar.
For Hong Kong and Macau, their interest rates had been most parallel to the US
rates throughout, in line with their effective hard dollar pegs. As for Singapore and
A Clustering Approach
331
Brunei, their interest rate differentials against each reference country had been highly
parallel over the periods specifically that against the US, compatible with their
monetary union system.
22.921.6
0
2
4
6
8
10
12
14
16
18
20
PRE CRS PST
US 22.9
22.7
0
2
4
6
8
10
12
14
16
18
20
PRE CRS PST
G3
22.2 26.927.7
0
2
4
6
8
10
12
14
16
18
20
PRE CRS PST
JPN
15.0
19.3
20.5
0
2
4
6
8
10
12
14
16
18
20
PRE CRS PST
DEU
18.0
23.123.4
0
2
4
6
8
10
12
14
16
18
20
PRE CRS PST
CHNCHN
CHN HKG KOR TWN KHM IDN LAO MYS MMR PHL
SGP THA VNM IND MAC BRN JPN AUS NZL CAN
Figure 7.5 Interest rate differential (%)
Table 7.2 exhibits the averages over countries of the reference-dependent variables,
that is, averages for each criterion except the budget deficit criterion. Based on the
charts and the averages, it can be seen that the region’s inflation has converged more
closely toward the US and the German level; nominal exchange rates have been much
more stable against the US and the Chinese currency; and interest rates have diverged

Optimal Currency Areas in East Asia
332
considerably from the Japanese rate. With respect to public budget balance, only four
countries have consistently reported a surplus.
In another respect, pairs of economies associated with fixed exchange rates, Hong
Kong and Macau, and Singapore and Brunei are somewhat parallel across all the
nominal Maastricht dimensions.
Table 7.2 Maastricht criteria averages
US G3 Japan Germany/EMU China
PRE CRS PST PRE CRS PST PRE CRS PST PRE CRS PST PRE CRS PST
INF 6.017 8.154 3.485 6.694 8.494 3.906 7.619 8.700 4.931 6.671 8.011 3.645 10.600 8.971 4.061NER 2.867 3.866 1.498 4.595 6.365 2.048 6.150 5.592 2.694 6.103 10.845 2.504 6.784 4.070 1.609INT 4.901 4.671 4.788 5.271 5.002 4.544 9.212 9.492 7.939 4.499 4.682 4.692 4.565 5.635 4.800
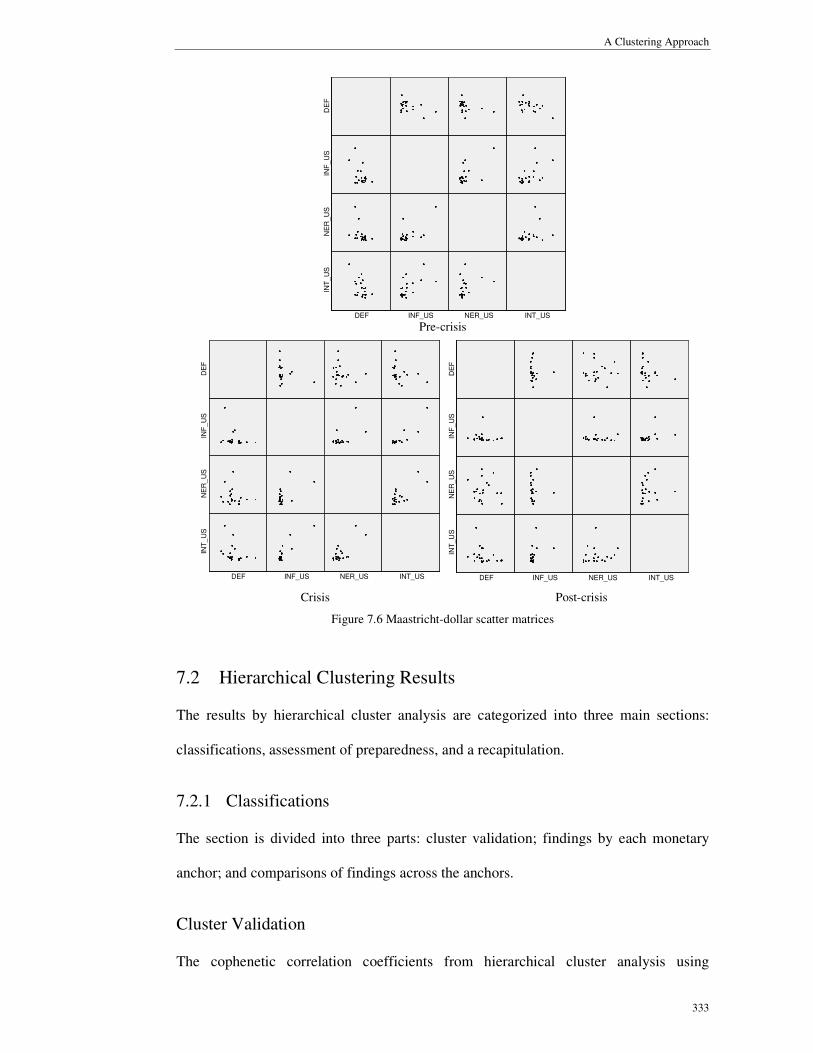
The scatter matrices depicting the Maastricht features against the US for the periods
are collected in Figure 7.6. The scatterplot matrices by other reference countries are
placed in Appendix D. Similar to the OCA variables, the grouping of the Maastricht
data varies for each variable so there is no simple way to classify the data. Hence,
multivariate clustering analysis used here is one appropriate method to classify the
objects into symmetrical groups with respect to the Maastricht criteria.
The ensuing section presents the Maastricht criteria findings by hierarchical cluster
analysis.
A Clustering Approach
333
INT_USNER_USINF_USDEF
DE
FIN
F_
US
NE
R_U
SIN
T_
US
Pre-crisis
INT_USNER_USINF_USDEF
DE
FIN
F_U
SN
ER
_U
SIN
T_
US
INT_USNER_USINF_USDEF
DE
FIN
F_
US
NE
R_U
SIN
T_U
S
Crisis Post-crisis
Figure 7.6 Maastricht-dollar scatter matrices
7.2 Hierarchical Clustering Results
The results by hierarchical cluster analysis are categorized into three main sections:
classifications, assessment of preparedness, and a recapitulation.
7.2.1 Classifications
The section is divided into three parts: cluster validation; findings by each monetary
anchor; and comparisons of findings across the anchors.
Cluster Validation
The cophenetic correlation coefficients from hierarchical cluster analysis using
Optimal Currency Areas in East Asia
334
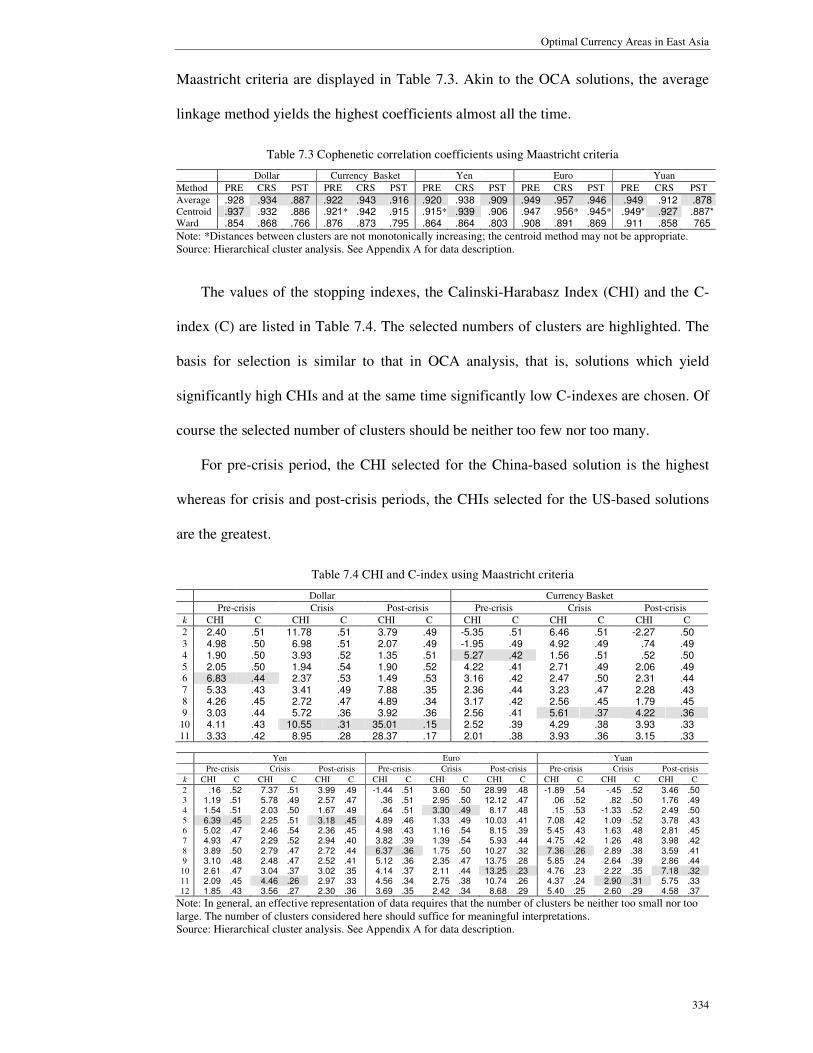
Maastricht criteria are displayed in Table 7.3. Akin to the OCA solutions, the average
linkage method yields the highest coefficients almost all the time.
Table 7.3 Cophenetic correlation coefficients using Maastricht criteria
Dollar Currency Basket Yen Euro Yuan
Method PRE CRS PST PRE CRS PST PRE CRS PST PRE CRS PST PRE CRS PST
Average .928 .934 .887 .922 .943 .916 .920 .938 .909 .949 .957 .946 .949 .912 .878 Centroid .937
.932 .886
.921*
.942 .915 .915*
.939 .906 .947 .956*
.945*
.949* .927 .887* Ward .854 .868 .766 .876 .873 .795 .864 .864 .803 .908 .891 .869 .911 .858 765
Note: *Distances between clusters are not monotonically increasing; the centroid method may not be appropriate. Source: Hierarchical cluster analysis. See Appendix A for data description.
The values of the stopping indexes, the Calinski-Harabasz Index (CHI) and the C-
index (C) are listed in Table 7.4. The selected numbers of clusters are highlighted. The
basis for selection is similar to that in OCA analysis, that is, solutions which yield
significantly high CHIs and at the same time significantly low C-indexes are chosen. Of
course the selected number of clusters should be neither too few nor too many.
For pre-crisis period, the CHI selected for the China-based solution is the highest
whereas for crisis and post-crisis periods, the CHIs selected for the US-based solutions
are the greatest.
Table 7.4 CHI and C-index using Maastricht criteria
Dollar Currency Basket
Pre-crisis Crisis Post-crisis Pre-crisis Crisis Post-crisis
k CHI C CHI C CHI C CHI C CHI C CHI C
2 2.40 .51 11.78 .51 3.79 .49 -5.35 .51 6.46 .51 -2.27 .50 3 4.98 .50 6.98 .51 2.07 .49 -1.95 .49 4.92 .49 .74 .49 4 1.90 .50 3.93 .52 1.35 .51 5.27 .42 1.56 .51 .52 .50 5 2.05 .50 1.94 .54 1.90 .52 4.22 .41 2.71 .49 2.06 .49 6 6.83 .44 2.37 .53 1.49 .53 3.16 .42 2.47 .50 2.31 .44 7 5.33 .43 3.41 .49 7.88 .35 2.36 .44 3.23 .47 2.28 .43 8 4.26 .45 2.72 .47 4.89 .34 3.17 .42 2.56 .45 1.79 .45 9 3.03 .44 5.72 .36 3.92 .36 2.56 .41 5.61 .37 4.22 .36
10 4.11 .43 10.55 .31 35.01 .15 2.52 .39 4.29 .38 3.93 .33 11 3.33 .42 8.95 .28 28.37 .17 2.01 .38 3.93 .36 3.15 .33
Yen Euro Yuan
Pre-crisis Crisis Post-crisis Pre-crisis Crisis Post-crisis Pre-crisis Crisis Post-crisis
k CHI C CHI C CHI C CHI C CHI C CHI C CHI C CHI C CHI C
2 .16 .52 7.37 .51 3.99 .49 -1.44 .51 3.60 .50 28.99 .48 -1.89 .54 -.45 .52 3.46 .50 3 1.19 .51 5.78 .49 2.57 .47 .36 .51 2.95 .50 12.12 .47 .06 .52 .82 .50 1.76 .49 4 1.54 .51 2.03 .50 1.67 .49 .64 .51 3.30 .49 8.17 .48 .15 .53 -1.33 .52 2.49 .50 5 6.39 .45 2.25 .51 3.18 .45 4.89 .46 1.33 .49 10.03 .41 7.08 .42 1.09 .52 3.78 .43 6 5.02 .47 2.46 .54 2.36 .45 4.98 .43 1.16 .54 8.15 .39 5.45 .43 1.63 .48 2.81 .45 7 4.93 .47 2.29 .52 2.94 .40 3.82 .39 1.39 .54 5.93 .44 4.75 .42 1.26 .48 3.98 .42 8 3.89 .50 2.79 .47 2.72 .44 6.37 .36 1.75 .50 10.27 .32 7.36 .26 2.89 .38 3.59 .41 9 3.10 .48 2.48 .47 2.52 .41 5.12 .36 2.35 .47 13.75 .28 5.85 .24 2.64 .39 2.86 .44 10 2.61 .47 3.04 .37 3.02 .35 4.14 .37 2.11 .44 13.25 .23 4.76 .23 2.22 .35 7.18 .32 11 2.09 .45 4.46 .26 2.97 .33 4.56 .34 2.75 .38 10.74 .26 4.37 .24 2.90 .31 5.75 .33 12 1.85 .43 3.56 .27 2.30 .36 3.69 .35 2.42 .34 8.68 .29 5.40 .25 2.60 .29 4.58 .37
Note: In general, an effective representation of data requires that the number of clusters be neither too small nor too large. The number of clusters considered here should suffice for meaningful interpretations. Source: Hierarchical cluster analysis. See Appendix A for data description.
A Clustering Approach
335
Dollar Anchor Results
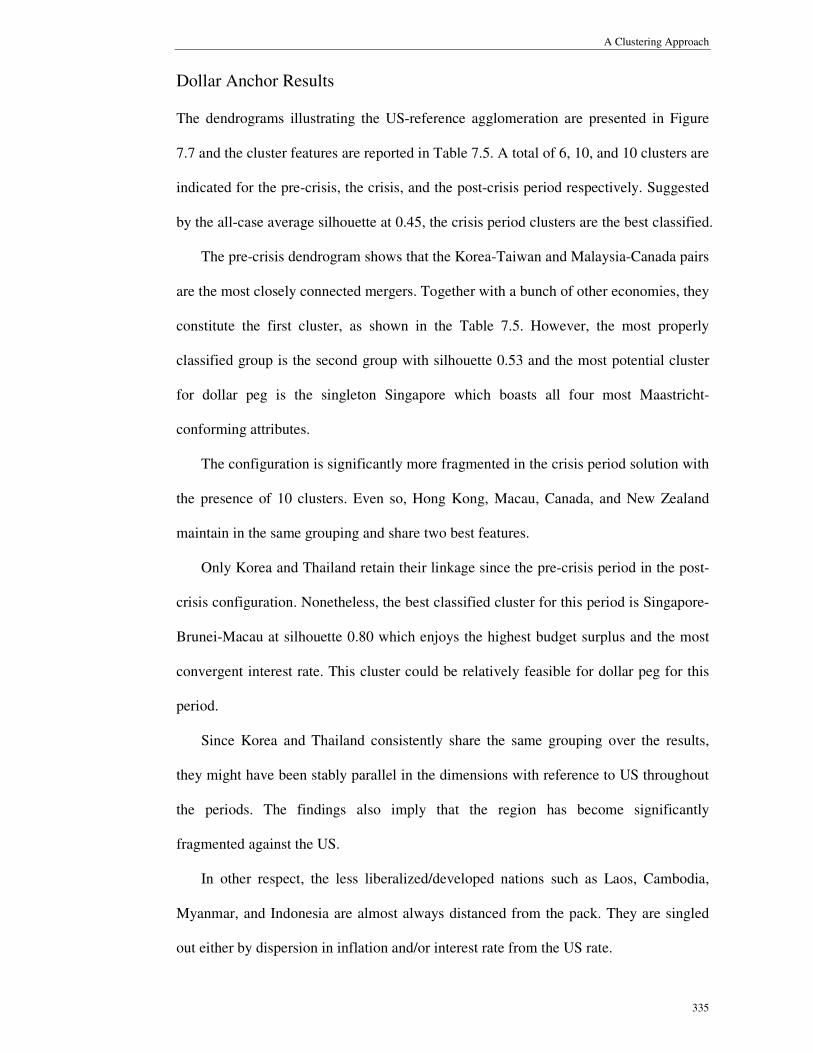
The dendrograms illustrating the US-reference agglomeration are presented in Figure
7.7 and the cluster features are reported in Table 7.5. A total of 6, 10, and 10 clusters are
indicated for the pre-crisis, the crisis, and the post-crisis period respectively. Suggested
by the all-case average silhouette at 0.45, the crisis period clusters are the best classified.
The pre-crisis dendrogram shows that the Korea-Taiwan and Malaysia-Canada pairs
are the most closely connected mergers. Together with a bunch of other economies, they
constitute the first cluster, as shown in the Table 7.5. However, the most properly
classified group is the second group with silhouette 0.53 and the most potential cluster
for dollar peg is the singleton Singapore which boasts all four most Maastricht-
conforming attributes.
The configuration is significantly more fragmented in the crisis period solution with
the presence of 10 clusters. Even so, Hong Kong, Macau, Canada, and New Zealand
maintain in the same grouping and share two best features.
Only Korea and Thailand retain their linkage since the pre-crisis period in the post-
crisis configuration. Nonetheless, the best classified cluster for this period is Singapore-
Brunei-Macau at silhouette 0.80 which enjoys the highest budget surplus and the most
convergent interest rate. This cluster could be relatively feasible for dollar peg for this
period.
Since Korea and Thailand consistently share the same grouping over the results,
they might have been stably parallel in the dimensions with reference to US throughout
the periods. The findings also imply that the region has become significantly
fragmented against the US.
In other respect, the less liberalized/developed nations such as Laos, Cambodia,
Myanmar, and Indonesia are almost always distanced from the pack. They are singled
out either by dispersion in inflation and/or interest rate from the US rate.
Optimal Currency Areas in East Asia
336
3 4 2 15 18 12 16 19 17 1 14 8 20 6 9 10 11 5 7 13
0.5
1
1.5
2
2.5
3
3.5
4
4.5
5
Pre-crisis
2 15 20 19 16 1 13 4 18 3 12 8 10 14 17 5 9 11 6 70
0.5
1
1.5
2
2.5
3
3.5
4
4.5
5
Crisis
3 20 12 18 19 1 2 8 13 4 10 14 5 17 11 16 15 6 7 9
0.5
1
1.5
2
2.5
3
3.5
4
4.5
Post-crisis
CHN HKG KOR TWN KHM IDN LAO MYS MMR PHL SGP THA VNM IND MAC BRN JPN AUS NZL CAN
1 2 3 4 5 6 7 8 9 10 11 12 13 14 15 16 17 18 19 20
Source: Hierarchical cluster analysis. See Appendix A for data description.
Figure 7.7 Maastricht-dollar dendrograms

A Clustering Approach
337
Table 7.5 Maastricht-HCM-dollar clusters
Averages
Cluster SW DEF (%)1 INF (%) NER2 INT (%) N3
Pre-crisis
All Cases .29 -1.726 6.017 2.867 4.901 1 CHN, HKG, KOR, TWN, MYS, THA, IND, MAC, BRN,
JPN, AUS, NZL, CAN .33 -1.292 3.636 1.669 2.606 0 2 IDN, MMR, PHL .53 -1.402 9.326 1.367 8.799 0 3 SGP .00 6.269 1.941 1.032 1.971 4 4 KHM .00 -3.467 2.928 10.921 9.748 0 5 LAO .00 -10.466 16.120 2.778 15.935 0 6 VNM .00 -5.860 24.109 16.810 7.797 0
Crisis All Cases .45 -1.027 8.154 3.866 4.671
1 HKG, MAC, CAN, NZL .58 1.268 2.479 1.266 1.357 2 2 BRN .00 4.162 1.771 2.439 2.583 0 3 CHN, VNM, TWN, AUS .70 -2.384 2.331 1.553 1.622 0 4 KOR, THA, MYS, PHL .67 -1.976 2.748 4.758 2.683 0 5 IND, JPN .61 -5.615 3.726 2.547 5.253 0 6 KHM .00 -1.658 6.694 2.349 9.303 0 7 MMR .00 -.535 24.586 1.730 7.548 0 8 SGP .00 7.572 1.652 2.439 1.995 2 9 IDN .00 -1.199 21.576 16.679 16.132 0
10 LAO .00 -4.645 67.298 11.438 21.618 0 Post-crisis All Cases .36 -.553 3.485 1.498 4.788
1 KOR, CAN, THA, AUS .37 .114 .909 2.205 1.832 0 2 NZL .00 3.501 .492 3.298 5.315 1 3 CHN, HKG, MYS, VNM .33 -2.265 2.536 .408 2.145 1 4 TWN, PHL, IND .70 -3.255 2.143 1.390 4.196 0 5 KHM .00 -2.149 2.149 .563 11.075 0 6 JPN .00 -7.050 2.968 2.573 4.091 0 7 SGP, BRN, MAC .80 6.272 2.462 .871 1.499 2 8 IDN .00 -1.330 6.663 3.639 9.675 0 9 LAO .00 -3.641 6.162 1.398 22.913 0
10 MMR .00 -.846 23.681 1.254 9.705 0
Note: 1 Positive value indicates surplus. 2 Standard deviation (x102) of the log difference in bilateral nominal exchange rate. 3 Number of variables with highest degree of conformity to Maastricht Treaty. Source: Hierarchical cluster analysis. See Appendix A for data description.
Currency Basket Anchor Results
The G3-based merging progressions are illustrated in Figure 7.8. Table 7.6 exhibits the
groupings and descriptions. 4, 9, and 9 clusters are present for the three periods
respectively, signifying increased degree of fragmentation since the crisis period against
the weighted G3 countries, the US, Japan, and Germany/EMU with respective weights
of 0.47, 0.23, and 0.30.
The pre-crisis dendrogram reveals that the most closely connected mergers are
Macau-Australia, Korea-Taiwan, Brunei-NewZealand, and Malaysia-Canada which
constitute part of the first group. Not only the largest, the first group of 13 countries also
enjoys the highest silhouette at 0.50 and all 4 attributes most compatible for fixed basket
peg.
A couple of nations retain their pre-crisis links in the crisis period setting.

Optimal Currency Areas in East Asia
338
Nonetheless, it is Singapore, possessing 3 most conforming features which might be
most prospective for fixed peg in the crisis period.
15 17 2 3 4 12 16 18 11 1 14 8 19 5 6 9 10 7 13
0.5
1
1.5
2
2.5
3
3.5
4
4.5
5
Pre-crisis
2 15 19 18 16 1 4 17 13 3 12 8 10 14 5 9 11 6 70
0.5
1
1.5
2
2.5
3
3.5
4
4.5
5
Crisis
1 2 12 4 8 13 10 14 5 3 19 17 18 11 15 16 6 7 90
0.5
1
1.5
2
2.5
3
3.5
4
4.5
Post-crisis
CHN HKG KOR TWN KHM IDN LAO MYS MMR PHL SGP THA VNM IND MAC BRN AUS NZL CAN
1 2 3 4 5 6 7 8 9 10 11 12 13 14 15 16 17 18 19
Source: Hierarchical cluster analysis. See Appendix A for data description.
Figure 7.8 Maastricht-basket dendrograms
In the post-crisis finding, Singapore, Macau, and Brunei restore their pre-crisis
linkage and make up the most tightly classified cluster with remarkable silhouette 0.94

A Clustering Approach
339
exhibiting 2 best attributes, the highest surplus and most parallel interest rate.
Throughout the solutions, China-Taiwan, Malaysia-Thailand and Macau-Brunei
consistently share the same groupings. Akin to the US-based results, the findings here
also suggest that the region has become significantly divergent since the crisis period.
This is not surprising since US has the greatest weight in the currency basket.
Table 7.6 Maastricht-HCM-basket clusters
Averages
Cluster SW DEF (%)1 INF (%) NER2 INT (%) N3
Pre-crisis
All Cases .43 -1.747 6.694 4.595 5.271 1 MAC, AUS, HKG, KOR, TWN, THA, BRN, NZL, SGP,
CHN, IND, MYS, CAN .50 -.707 4.052 2.568 2.676 4 2 KHM, IDN, MMR, PHL .42 -1.918 8.368 4.816 9.554 0 3 LAO .00 -10.466 16.519 9.182 16.008 0 4 VNM .00 -5.860 24.510 25.481 8.544 0
Crisis All Cases .41 -.765 8.494 6.365 5.002
1 HKG, MAC, CAN, NZL, BRN .50 2.078 2.790 4.254 1.727 1 2 CHN, TWN, AUS, VNM .68 -2.384 2.189 4.566 1.770 0 3 KOR, THA, MYS, PHL .50 -2.135 3.335 7.704 3.480 0 4 IND .00 -5.231 5.950 4.335 5.493 0 5 KHM .00 -1.658 6.631 5.161 10.351 0 6 MMR .00 -.535 24.978 4.496 8.597 0 7 SGP .00 7.572 1.186 5.041 1.137 3 8 IDN .00 -1.199 21.985 17.533 17.181 0 9 LAO .00 -4.645 68.106 12.501 22.666 0
Post-crisis All Cases .44 -0.211 3.906 2.048 4.544 0
1 CHN, HKG, THA, TWN, MYS, VNM .35 -1.984 2.289 1.638 1.830 0 2 PHL, IND .78 -3.782 3.226 2.181 4.586 0 3 KHM .00 -2.149 2.658 1.588 10.987 0 4 KOR, AUS, CAN .60 .366 1.474 2.648 1.681 0 5 NZL .00 3.501 1.174 3.253 5.139 1 6 SGP, MAC, BRN .94 6.272 2.134 1.555 .970 2 7 IDN .00 -1.330 7.663 3.803 9.628 0 8 LAO .00 -3.641 7.151 2.026 22.923 0 9 MMR .00 -0.846 24.559 1.441 9.550 1
Note: 1 Positive value indicates surplus. 2 Standard deviation (x102) of the log difference in bilateral nominal exchange rate. 3 Number of variables with highest degree of conformity to Maastricht Treaty. Source: Hierarchical cluster analysis. See Appendix A for data description.
Yen Anchor Results
The agglomerations using Japan as the anchor are illustrated in Figure 7.9 and the
characteristics of the groupings are found in Table 7.7. The stopping rules suggest 5, 11,
and 5 clusters respectively for pre-crisis, crisis, and post-crisis periods. The significantly
more clusters for the crisis period could indicate increased divergence vis-à-vis Japan in
the crisis period. The silhouette over all objects of the post-crisis solution at 0.55 is the
largest.
The pre-crisis dendrogram reveals that the Macau-Australia and Brunei-

Optimal Currency Areas in East Asia
340
NewZealand pairs are the most closely linked subclusters. In combination with 6 other
countries, they constitute the first group which is not only the dominant group but is
also the most tightly classified cluster at silhouette 0.62. Nevertheless, displaying the
most favorable conditions, the one most appropriate for yen adoption is the singleton
Singapore.
15 17 2 12 16 18 3 4 8 19 1 14 9 10 5 6 11 7 13
0.5
1
1.5
2
2.5
3
3.5
4
4.5
5
Pre-crisis
2 15 18 19 16 1 4 17 3 12 8 10 13 14 5 9 11 6 70
0.5
1
1.5
2
2.5
3
3.5
4
4.5
5
Crisis
1 2 4 12 3 8 10 14 13 17 19 5 11 16 15 6 18 7 90
0.5
1
1.5
2
2.5
3
3.5
4
4.5
Post-crisis
CHN HKG KOR TWN KHM IDN LAO MYS MMR PHL SGP THA VNM IND MAC BRN AUS NZL CAN
1 2 3 4 5 6 7 8 9 10 11 12 13 14 15 16 17 18 19
Source: Hierarchical cluster analysis. See Appendix A for data description.
Figure 7.9 Maastricht-yen dendrograms

A Clustering Approach
341
A few countries retain their pre-crisis groupings in the crisis period arrangement.
Amongst them, HongKong-Macau-NewZealand-Canada is best classified.
The subclusters of Korea-Malaysia-Thailand, Taiwan-Australia, and HongKong-
Canada are robust from the pre-crisis till the post-crisis solution. For post-crisis period,
it is the group of Singapore-Brunei-Macau which is the best classified at silhouette 0.88
and the most prospective cluster with 3 most favorable conditions.
Table 7.7 Maastricht-HCM-yen clusters
Averages
Cluster SW DEF (%)1 INF (%) NER2 INT (%) N3
Pre-crisis
All Cases .46 -1.747 7.619 6.150 9.212 1 MAC, AUS, HKG, THA, BRN, NZL, KOR, TWN, MYS,
CAN .62 -.606 4.312 3.410 6.445 0 2 CHN, IND, MMR, PHL, KHM, IDN .42 -2.845 9.509 5.312 12.521 0 3 SGP .00 6.269 1.340 2.776 2.988 4 4 LAO .00 -10.466 17.197 14.842 18.874 0 5 VNM .00 -5.860 26.045 33.265 10.821 0
Crisis All Cases .45 -.765 8.700 5.592 9.492
1 HKG, MAC, NZL, CAN .86 1.268 2.082 4.072 6.423 0 2 CHN, TWN, AUS .85 -2.083 1.767 3.930 5.096 0 3 KOR, THA, MYS .75 -2.049 3.277 7.104 7.585 0 4 PHL, VNM .20 -2.841 4.381 4.761 9.791 0 5 IND .00 -5.231 6.971 3.655 10.506 0 6 BRN .00 4.162 1.032 3.757 3.594 2 7 MMR .00 -.535 25.494 3.278 13.610 1 8 SGP .00 7.572 1.038 3.757 4.078 1 9 KHM .00 -1.658 6.546 4.506 15.365 0
10 IDN .00 -1.199 22.682 16.431 22.194 0 11 LAO .00 -4.645 69.312 11.962 27.680 0
Post-crisis All Cases .55 -.211 4.931 2.694 7.939
1 CHN, HKG, KOR, THA, TWN, MYS, PHL, IND, VNM, AUS, CAN, KHM .58 -1.710 3.346 2.687 6.226 0
2 SGP, BRN, MAC .88 6.272 1.882 2.236 4.073 3 3 IDN, NZL .39 1.086 6.238 3.830 11.582 0 4 LAO .00 -3.641 9.059 2.607 26.941 0 5 MMR .00 -.846 26.361 1.955 13.812 1
Note: 1 Positive value indicates surplus. 2 Standard deviation (x102) of the log difference in bilateral nominal exchange rate. 3 Number of variables with highest degree of conformity to Maastricht Treaty. Source: Hierarchical cluster analysis. See Appendix A for data description.
Euro Anchor Results
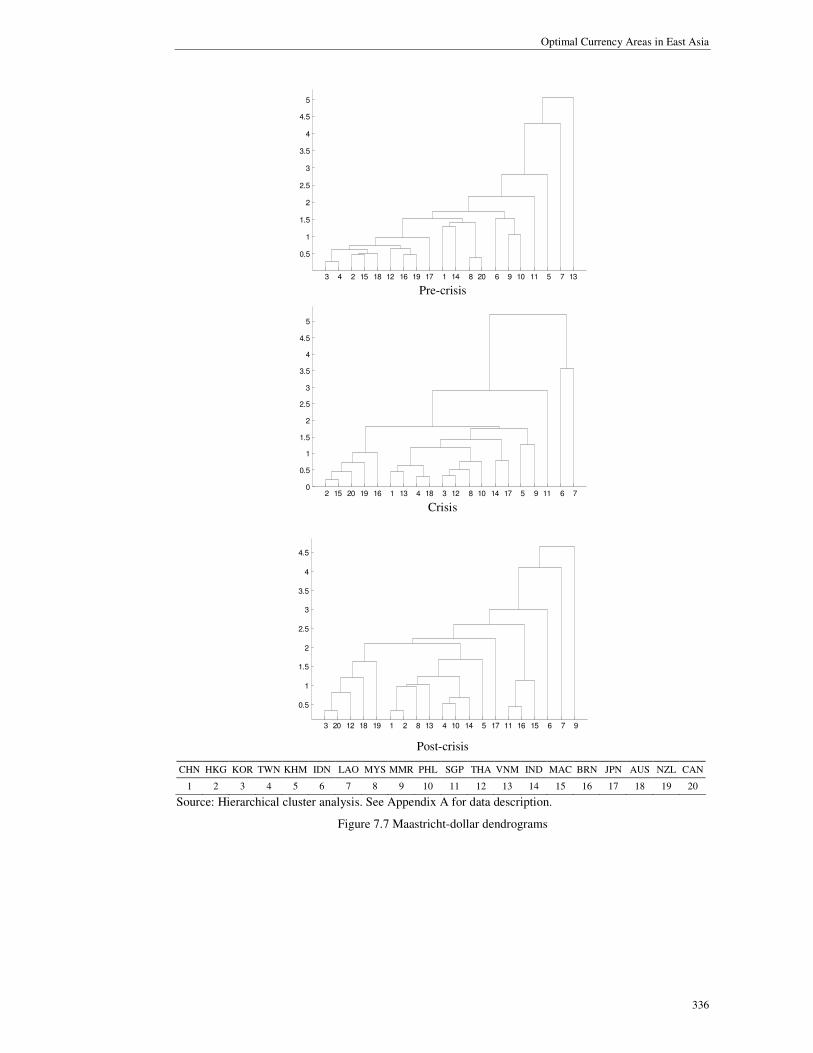
The Germany/EMU-based dendrograms are exhibited in Figure 7.10 and the
characteristics of the clusters are listed in Table 7.8. The number of groups for the pre-
crisis, crisis, and post-crisis periods are 8, 4, and 10 clusters respectively, suggesting a
substantially convergent region in the crisis period. Indicated by the all-case average
silhouette at 0.56, the crisis period configuration is also the best partitioned.
For the pre-crisis period, HongKong-NewZealand and Macau-Australia are the
Optimal Currency Areas in East Asia
342
early mergers which are joined by Korea, Thailand, Taiwan, and Brunei. They form the
largest group which is also most tightly classified at silhouette 0.80. In respect of
conformity to Maastricht conditions, Singapore is most favorable in the budget,
inflation, and exchange rate dimensions.
2 19 15 18 3 12 4 16 1 8 14 20 9 10 5 6 17 11 7 130
0.5
1
1.5
2
2.5
3
3.5
4
4.5
5
Pre-crisis
2 15 19 20 16 1 4 10 13 18 3 8 12 5 14 17 9 11 6 70
1
2
3
4
5
Crisis
1 2 13 12 8 10 14 18 4 5 3 20 19 17 11 16 15 6 7 90
0.5
1
1.5
2
2.5
3
3.5
4
4.5
5
Post-crisis
CHN HKG KOR TWN KHM IDN LAO MYS MMR PHL SGP THA VNM IND MAC BRN JPN AUS NZL CAN
1 2 3 4 5 6 7 8 9 10 11 12 13 14 15 16 17 18 19 20
Source: Hierarchical cluster analysis. See Appendix A for data description.
Figure 7.10 Maastricht-euro dendrograms
A Clustering Approach
343
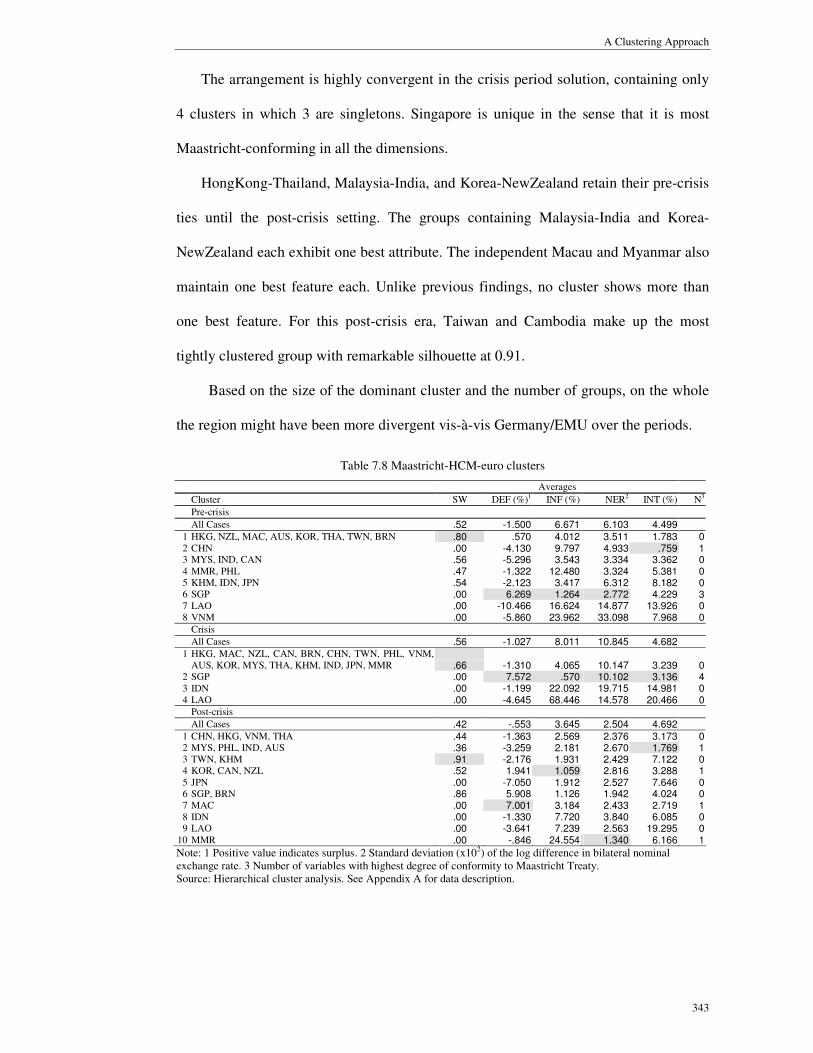
The arrangement is highly convergent in the crisis period solution, containing only
4 clusters in which 3 are singletons. Singapore is unique in the sense that it is most
Maastricht-conforming in all the dimensions.
HongKong-Thailand, Malaysia-India, and Korea-NewZealand retain their pre-crisis
ties until the post-crisis setting. The groups containing Malaysia-India and Korea-
NewZealand each exhibit one best attribute. The independent Macau and Myanmar also
maintain one best feature each. Unlike previous findings, no cluster shows more than
one best feature. For this post-crisis era, Taiwan and Cambodia make up the most
tightly clustered group with remarkable silhouette at 0.91.
Based on the size of the dominant cluster and the number of groups, on the whole
the region might have been more divergent vis-à-vis Germany/EMU over the periods.
Table 7.8 Maastricht-HCM-euro clusters
Averages
Cluster SW DEF (%)1 INF (%) NER2 INT (%) N3
Pre-crisis
All Cases .52 -1.500 6.671 6.103 4.499 1 HKG, NZL, MAC, AUS, KOR, THA, TWN, BRN .80 .570 4.012 3.511 1.783 0 2 CHN .00 -4.130 9.797 4.933 .759 1 3 MYS, IND, CAN .56 -5.296 3.543 3.334 3.362 0 4 MMR, PHL .47 -1.322 12.480 3.324 5.381 0 5 KHM, IDN, JPN .54 -2.123 3.417 6.312 8.182 0 6 SGP .00 6.269 1.264 2.772 4.229 3 7 LAO .00 -10.466 16.624 14.877 13.926 0 8 VNM .00 -5.860 23.962 33.098 7.968 0
Crisis All Cases .56 -1.027 8.011 10.845 4.682
1 HKG, MAC, NZL, CAN, BRN, CHN, TWN, PHL, VNM, AUS, KOR, MYS, THA, KHM, IND, JPN, MMR .66 -1.310 4.065 10.147 3.239 0
2 SGP .00 7.572 .570 10.102 3.136 4 3 IDN .00 -1.199 22.092 19.715 14.981 0 4 LAO .00 -4.645 68.446 14.578 20.466 0
Post-crisis All Cases .42 -.553 3.645 2.504 4.692
1 CHN, HKG, VNM, THA .44 -1.363 2.569 2.376 3.173 0 2 MYS, PHL, IND, AUS .36 -3.259 2.181 2.670 1.769 1 3 TWN, KHM .91 -2.176 1.931 2.429 7.122 0 4 KOR, CAN, NZL .52 1.941 1.059 2.816 3.288 1 5 JPN .00 -7.050 1.912 2.527 7.646 0 6 SGP, BRN .86 5.908 1.126 1.942 4.024 0 7 MAC .00 7.001 3.184 2.433 2.719 1 8 IDN .00 -1.330 7.720 3.840 6.085 0 9 LAO .00 -3.641 7.239 2.563 19.295 0
10 MMR .00 -.846 24.554 1.340 6.166 1
Note: 1 Positive value indicates surplus. 2 Standard deviation (x102) of the log difference in bilateral nominal exchange rate. 3 Number of variables with highest degree of conformity to Maastricht Treaty. Source: Hierarchical cluster analysis. See Appendix A for data description.

Optimal Currency Areas in East Asia
344
Yuan Anchor Results
The China-centered solutions are shown in Figure 7.11 and Table 7.9. The numbers of
clusters indicated for pre-crisis, crisis, and post-crisis periods are 8, 11, and 10. The pre-
crisis silhouette for all objects is the largest at 0.49.
The pre-crisis dendrogram reveals that the most closely linked countries in that
period are Korea and Thailand, and Macau and Australia. It might be interesting to find
the tight linkage between Macau and Australia vis-à-vis China before the crisis.
Anyway, these countries make up part of the best classified cluster with silhouette 0.83
and also the largest group which displays the most convergent interest rate toward the
Chinese rate. Meantime, Singapore has the most favorable budget balance and stable
yuan rate while the Indonesian inflation is the closest to the Chinese one.
Taiwan and Australia maintain their pre-crisis link and form the best classified
cluster for the crisis period. Singapore, having the highest surplus in budget balance and
the most parallel interest rate to the Chinese rate, might still the most conforming
country in this period of distress.
Singapore, in combination with Brunei and Macau, is still the most prospective
nation for a fixed yuan peg in the post-crisis arrangement. The three economies share
the highest silhouette 0.88, the best budget position, and the highest degree of symmetry
in inflation and interest rate with China.
No counties are constantly put together in the same grouping over the results. By
looking at the size of the dominant group and the number of clusters, the region could
have been more divergent in relation to China since the crisis period.

A Clustering Approach
345
2 11 3 1 14 17 18 7 13 19 9 4 8 15 16 5 10 6 120
0.5
1
1.5
2
2.5
3
3.5
4
4.5
5
Pre-crisis
1 14 19 18 15 2 11 7 9 3 17 12 13 16 4 8 10 5 60
0.5
1
1.5
2
2.5
3
3.5
4
4.5
Crisis
2 19 17 18 5 1 7 12 3 11 9 13 4 16 10 15 14 6 8
0.5
1
1.5
2
2.5
3
3.5
4
4.5
Post-crisis
HKG KOR TWN KHM IDN LAO MYS MMR PHL SGP THA VNM IND MAC BRN JPN AUS NZL CAN
1 2 3 4 5 6 7 8 9 10 11 12 13 14 15 16 17 18 19
Source: Hierarchical cluster analysis. See Appendix A for data description.
Figure 7.11 Maastricht-yuan dendrograms

Optimal Currency Areas in East Asia
346
Table 7.9 Maastricht-HCM-yuan clusters
Averages
Cluster SW DEF (%)1 INF (%) NER2 INT (%) N3
Pre-crisis
All Cases .49 -1.600 10.600 6.784 4.565 1 KOR, THA, TWN, HKG, MAC, AUS, NZL .83 .465 8.850 4.243 1.775 1 2 MYS, IND, CAN, PHL .53 -4.473 8.796 4.275 3.594 0 3 KHM .00 -3.467 11.432 11.918 7.895 0 4 MMR, BRN, JPN .47 -.224 11.974 4.361 6.648 0 5 IDN .00 -1.563 6.811 5.204 8.442 1 6 SGP .00 6.269 10.232 3.987 4.651 2 7 LAO .00 -10.466 16.614 14.963 13.823 0 8 VNM .00 -5.860 23.264 32.948 7.269 0
Crisis All Cases .33 -.949 8.971 4.070 5.635
1 HKG, MAC, CAN, NZL .59 1.268 2.214 1.266 2.385 1 2 BRN .00 4.162 1.113 2.438 .746 1 3 KOR, THA, MYS, PHL .47 -2.135 4.081 5.973 4.197 0 4 TWN, AUS .87 -1.871 2.316 2.405 1.472 0 5 VNM, IND .20 -4.260 5.739 1.299 5.316 0 6 JPN .00 -6.000 1.360 3.893 4.237 0 7 KHM .00 -1.658 7.048 2.351 11.128 0 8 MMR .00 -.535 25.923 1.732 9.373 0 9 SGP .00 7.572 1.231 2.438 .272 2
10 IDN .00 -1.199 23.022 16.679 17.957 0 11 LAO .00 -4.645 69.459 11.440 23.443 0
Post-crisis All Cases .37 -.508 4.061 1.609 4.800
1 KOR, CAN, AUS .58 .366 2.243 2.505 1.638 0 2 NZL .00 3.501 2.083 3.338 5.494 0 3 IDN .00 -1.330 7.336 3.680 9.854 0 4 HKG, MYS, VNM .29 -2.551 2.910 .526 2.353 1 5 TWN, THA, PHL, IND .46 -2.602 2.621 1.428 3.392 0 6 KHM .00 -2.149 2.651 .722 11.254 0 7 JPN .00 -7.050 2.357 2.552 3.912 0 8 SGP, BRN, MAC .88 6.272 1.889 .946 .725 3 9 LAO .00 -3.641 7.225 1.345 23.092 0
10 MMR .00 -.846 23.901 1.285 9.884 0
Note: 1 Positive value indicates surplus. 2 Standard deviation (x102) of the log difference in bilateral nominal exchange rate. 3 Number of variables with highest degree of conformity to Maastricht Treaty. Source: Hierarchical cluster analysis. See Appendix A for data description.
7.2.1.1 Comparisons across Anchors
The hierarchical clustering solutions using Maastricht criteria are put together in Table
7.10. The average silhouettes over all cases suggest that euro solutions are most
appropriately classified for the former two periods and yen solution is best classified for
the latter period. Amongst all clusters, higher silhouettes are obtained by the post-crisis
clusters containing Singapore and Brunei.
Overall, there are fewer clusters for the pre-crisis period, indicating higher regional
homogeneity in terms of the Maastricht dimensions in that period in which the most
convergent configurations are by US, G3, and Japan references. In the crisis period
setting, the Germany/EMU-based configuration is highly symmetrical in the sense that
one cluster almost encompasses all the cases. Similarly, in the post-crisis configuration
A Clustering Approach
347
the Japan-based solution is exceptionally homogenous.
To evaluate how the levels of convergence might have changed, it is best to look at
the configurations over the periods. On the whole, it appears that only the Japan solution
has become slightly more convergent whereas the US and the G3 ones have been more
divergent.
Based on the above, in general the Japan reference is associated with more
convergent cluster configurations.
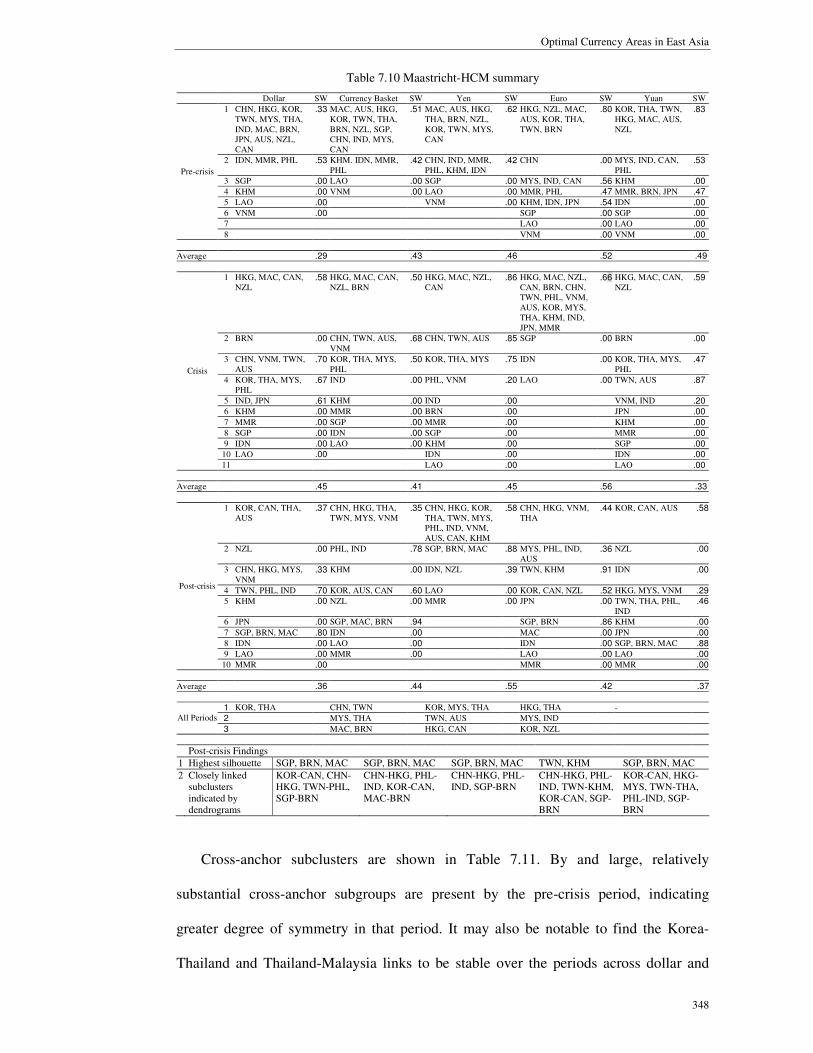
Whilst no full groupings are consistently stable over the periods, one can find
subgroups which are robust in the rows labeled ‘All Periods’. With respect to these
cross-period subclusters, none are present by the China reference. A number of cross-
period linkages are present by other references.
How parallel are the countries associated with fixed exchange rates? The effective
dollar areas of Hong Kong and Macau are put together over all anchors for the pre-crisis
and crisis periods but not by any anchor for the post-crisis period. As for Singapore and
Brunei, for pre-crisis period they are only placed together by the basket anchor while for
post-crisis period they are placed together over all anchors. Hence, despite maintaining
similar policies, these pairs of economies are not indicated to be consistently
symmetrical over the periods.
Two features of the post-crisis findings are presented in the second part of Table
7.10. The first row shows the groups with the greatest silhouettes and the second row
displays the highly closely linked subclusters depicted by the dendrograms. First, for
post-crisis period the greatest silhouettes are attained by Singapore-Brunei-Macau for
all anchors except for euro anchor. As these economies individually adopt some form of
fixed exchange rate in practice, it is not surprising that they are highly parallel in the
Maastricht conditions. Second, amongst the closely linked subgroupings, Korea-Canada,
China-HongKong, Singapore-Brunei, and Philippines-India are common for all anchors.
Optimal Currency Areas in East Asia
348
Table 7.10 Maastricht-HCM summary
Dollar SW Currency Basket SW Yen SW Euro SW Yuan SW
1 CHN, HKG, KOR, TWN, MYS, THA, IND, MAC, BRN, JPN, AUS, NZL, CAN
.33 MAC, AUS, HKG, KOR, TWN, THA, BRN, NZL, SGP, CHN, IND, MYS, CAN
.51 MAC, AUS, HKG, THA, BRN, NZL, KOR, TWN, MYS, CAN
.62 HKG, NZL, MAC, AUS, KOR, THA, TWN, BRN
.80 KOR, THA, TWN, HKG, MAC, AUS, NZL
.83
2 IDN, MMR, PHL .53 KHM. IDN, MMR, PHL
.42 CHN, IND, MMR, PHL, KHM, IDN
.42 CHN .00 MYS, IND, CAN, PHL
.53
3 SGP .00 LAO .00 SGP .00 MYS, IND, CAN .56 KHM .00
4 KHM .00 VNM .00 LAO .00 MMR, PHL .47 MMR, BRN, JPN .47
5 LAO .00 VNM .00 KHM, IDN, JPN .54 IDN .00
6 VNM .00 SGP .00 SGP .00
7 LAO .00 LAO .00
Pre-crisis
8 VNM .00 VNM .00
Average .29 .43 .46 .52 .49
1 HKG, MAC, CAN, NZL
.58 HKG, MAC, CAN, NZL, BRN
.50 HKG, MAC, NZL, CAN
.86 HKG, MAC, NZL, CAN, BRN, CHN, TWN, PHL, VNM, AUS, KOR, MYS, THA, KHM, IND, JPN, MMR
.66 HKG, MAC, CAN, NZL
.59
2 BRN .00 CHN, TWN, AUS, VNM
.68 CHN, TWN, AUS .85 SGP .00 BRN .00
3 CHN, VNM, TWN, AUS
.70 KOR, THA, MYS, PHL
.50 KOR, THA, MYS .75 IDN .00 KOR, THA, MYS, PHL
.47
4 KOR, THA, MYS, PHL
.67 IND .00 PHL, VNM .20 LAO .00 TWN, AUS .87
5 IND, JPN .61 KHM .00 IND .00 VNM, IND .20
6 KHM .00 MMR .00 BRN .00 JPN .00
7 MMR .00 SGP .00 MMR .00 KHM .00
8 SGP .00 IDN .00 SGP .00 MMR .00
9 IDN .00 LAO .00 KHM .00 SGP .00
10 LAO .00 IDN .00 IDN .00
Crisis
11 LAO .00 LAO .00
Average .45 .41 .45 .56 .33
1 KOR, CAN, THA, AUS
.37 CHN, HKG, THA, TWN, MYS, VNM
.35 CHN, HKG, KOR, THA, TWN, MYS, PHL, IND, VNM, AUS, CAN, KHM
.58 CHN, HKG, VNM, THA
.44 KOR, CAN, AUS .58
2 NZL .00 PHL, IND .78 SGP, BRN, MAC .88 MYS, PHL, IND, AUS
.36 NZL .00
3 CHN, HKG, MYS, VNM
.33 KHM .00 IDN, NZL .39 TWN, KHM .91 IDN .00
4 TWN, PHL, IND .70 KOR, AUS, CAN .60 LAO .00 KOR, CAN, NZL .52 HKG, MYS, VNM .29
5 KHM .00 NZL .00 MMR .00 JPN .00 TWN, THA, PHL, IND
.46
6 JPN .00 SGP, MAC, BRN .94 SGP, BRN .86 KHM .00
7 SGP, BRN, MAC .80 IDN .00 MAC .00 JPN .00
8 IDN .00 LAO .00 IDN .00 SGP, BRN, MAC .88
9 LAO .00 MMR .00 LAO .00 LAO .00
Post-crisis
10 MMR .00 MMR .00 MMR .00
Average .36 .44 .55 .42 .37
1 KOR, THA CHN, TWN KOR, MYS, THA HKG, THA -
2 MYS, THA TWN, AUS MYS, IND All Periods
3 MAC, BRN HKG, CAN KOR, NZL
Post-crisis Findings
1 Highest silhouette SGP, BRN, MAC SGP, BRN, MAC SGP, BRN, MAC TWN, KHM SGP, BRN, MAC
2 Closely linked subclusters indicated by dendrograms
KOR-CAN, CHN-HKG, TWN-PHL, SGP-BRN
CHN-HKG, PHL-IND, KOR-CAN, MAC-BRN
CHN-HKG, PHL-IND, SGP-BRN
CHN-HKG, PHL-IND, TWN-KHM, KOR-CAN, SGP-BRN
KOR-CAN, HKG-MYS, TWN-THA, PHL-IND, SGP-BRN
Cross-anchor subclusters are shown in Table 7.11. By and large, relatively
substantial cross-anchor subgroups are present by the pre-crisis period, indicating
greater degree of symmetry in that period. It may also be notable to find the Korea-
Thailand and Thailand-Malaysia links to be stable over the periods across dollar and

A Clustering Approach
349
yen, and basket and yen, respectively. As for the most recent period, the post-crisis
period, HongKong-Vietnam, Korea-Canada, Singapore-Brunei, and Philippines-India
are robust over all anchors.
Table 7.11 Maastricht-HCM cross-anchor subclusters
PRE CRS PST All PRE CRS PST All
1 CHN, HKG, KOR, TWN, MYS, THA, IND, MAC, BRN, AUS, NZL, CAN
HKG, MAC, CAN, NZL
CHN, HKG, MYS, VNM
- DY HKG, KOR, TWN, MYS, THA, MAC, BRN, AUS, NZL, CAN
HKG, MAC, NZL, CAN
KOR, THA, AUS, CAN
KOR, THA
2 IDN, MMR, PHL CHN, VNM, TWN, AUS
KOR, AUS, CAN IDN, MMR, PHL CHN, TWN, AUS CHN, HKG, MYS, VNM
3 KOR, THA, MYS, PHL
SGP, BRN, MAC CHN, IND KOR, THA, MYS TWN, PHL, IND
DB
4 PHL, IND SGP, BRN, MAC
1 HKG, KOR, TWN, THA, MAC, BRN, AUS, NZL
HKG, MAC, CAN, NZL
CHN, HKG, VNM
- DR KOR, THA, TWN, HKG, MAC, AUS, NZL
HKG, MAC, CAN, NZL
KOR, CAN, AUS -
2 MYS, IND, CAN CHN, VNM, TWN, AUS
KOR, CAN MYS, IND, CAN TWN, AUS HKG, MYS, VNM
3 MMR, PHL KOR, THA, MYS, PHL
PHL, IND BRN, JPN KOR, THA, MYS, PHL
TWN, PHL, IND
DE
4 IND, JPN SGP, BRN SGP, BRN, MAC
1 MAC, AUS, HKG, KOR, TWN, THA, BRN, NZL, MYS, CAN
HKG, MAC, CAN, NZL
CHN, HKG, THA, TWN, MYS, VNM
THA, MYS
BE HKG, NZL, MAC, AUS, KOR, THA, TWN, BRN
HKG, MAC, CAN, NZL, BRN
CHN, HKG, THA, VNM
-
2 KHM, IDN, MMR, PHL
CHN, TWN, AUS KOR, AUS, CAN MYS, IND, CAN CHN, TWN, AUS, VNM
PHL, IND
3 CHN, IND KOR, THA, MYS SGP, MAC, BRN MMR, PHL KOR, THA, MYS, PHL
KOR, CAN
BY
4 PHL, IND KHM, IDN SGP, BRN
1 KOR, THA, TWN, HKG, MAC, AUS, NZL
HKG, MAC, CAN, NZL
KOR, CAN, AUS - YE MAC, AUS, HKG, THA, BRN, NZL, KOR, TWN,
HKG, MAC, NZL, CAN
CHN, HKG, VNM, THA
-
2 MYS, IND, CAN TWN, AUS HKG, MYS, VNM
MYS, CAN CHN, TWN, AUS MYS, PHL, IND, AUS
3 KOR, THA, MYS, PHL
TWN, IND KHM, IDN KOR, THA, MYS TWN, KHM
4 SGP, BRN, MAC MMR, PHL PHL, VNM KOR, CAN
BR
5 SGP, BRN
1 KOR, THA, TWN, HKG, MAC, AUS, NZL
HKG, MAC, NZL, CAN
KOR, CAN, AUS - KOR, THA, TWN, HKG, MAC, AUS, NZL
HKG, MAC, CAN, NZL
HKG, VNM -
2 MYS, CAN TWN, AUS HKG, MYS, VNM
MYS, IND, CAN KOR, THA, MYS, PHL
PHL, IND
3 IND, PHL KOR, THA, MYS TWN, THA, PHL, IND
TWN, AUS KOR, CAN
YR
4 SGP, BRN, MAC
ER
VNM, IND SGP, BRN
1 HKG, KOR, TWN, MYS, THA, MAC, BRN, AUS, NZL, CAN
HKG, MAC, CAN, NZL
CHN, HKG, MYS, VNM
- DBE HKG, KOR, TWN, THA, MAC, BRN, AUS, NZL
HKG, MAC, CAN, NZL
CHN, HKG, VNM
-
2 IDN, MMR, PHL CHN, TWN, AUS KOR, AUS, CAN MYS, IND, CAN CHN, VNM, TWN, AUS
KOR, CAN
3 CHN, IND KOR, THA, MYS SGP, BRN, MAC MMR, PHL KOR, THA, MYS, PHL
SGP, BRN
DBY
4 PHL, IND PHL, IND

Optimal Currency Areas in East Asia
350
Table 7.11 Maastricht-HCM cross-anchor subclusters (continued)
PRE CRS PST All PRE CRS PST All
1 KOR, THA, TWN, HKG, MAC, AUS, NZL
HKG, MAC, CAN, NZL
HKG, MYS, VNM
- DYE HKG, KOR, TWN, THA, MAC, BRN, AUS, NZL
HKG, MAC, NZL, CAN
CHN, HKG, VNM
-
2 MYS, IND, CAN TWN, AUS KOR, AUS, CAN MYS, CAN CHN, TWN, AUS KOR, CAN
3 KOR, THA, MYS, PHL
SGP, BRN, MAC MMR, PHL KOR, THA, MYS PHL, IND
DBR
4 PHL, IND SGP, BRN
1 KOR, THA, TWN, HKG, MAC, AUS, NZL
HKG, MAC, NZL, CAN
KOR, AUS, CAN - KOR, THA, TWN, HKG, MAC, AUS, NZL
HKG, MAC, CAN, NZL
HKG, VNM -
2 MYS, CAN TWN, AUS HKG, MYS, VNM
MYS, IND, CAN TWN, AUS KOR, CAN
3 KOR, THA, MYS TWN, PHL, IND KOR, THA, MYS, PHL
PHL, IND
DYR
4 SGP, BRN, MAC
DER
SGP, BRN
1 MAC, AUS, HKG, KOR, TWN, THA, BRN, NZL
HKG, MAC, CAN, NZL
CHN, HKG, THA, VNM
- BYR KOR, THA, TWN, HKG, MAC, AUS, NZL
HKG, MAC, CAN, NZL
HKG, MYS, VNM
-
2 MYS, CAN CHN, TWN, AUS KOR, CAN MYS, CAN TWN, AUS THA, TWN
3 KHM, IDN KOR, THA, MYS SGP, BRN KOR, THA, MYS KOR, AUS, CAN
4 MMR, PHL PHL, IND SGP, MAC, BRN
BYE
5 PHL, IND
1 KOR, THA, TWN, HKG, MAC, AUS, NZL
HKG, MAC, CAN, NZL
HKG, VNM - KOR, THA, TWN, HKG, MAC, AUS, NZL
HKG, MAC, NZL, CAN
HKG, VNM -
2 MYS, IND, CAN TWN, AUS PHL, IND MYS, CAN TWN, AUS PHL, IND
3 KOR, THA, MYS, PHL
KOR, CAN KOR, THA, MYS KOR, CAN
BER
4 SGP, BRN
YER
SGP, BRN
1 HKG, KOR, TWN, THA, MAC, BRN, AUS, NZL
HKG, MAC, NZL, CAN
CHN, HKG, VNM
- DBYR KOR, THA, TWN, HKG, MAC, AUS, NZL
HKG, MAC, CAN, NZL
HKG, VNM -
2 MMR, PHL CHN, TWN, AUS KOR, CAN MYS, CAN TWN, AUS KOR, AUS, CAN
3 KOR, THA, MYS SGP, BRN KOR, THA, MYS SGP, BRN, MAC
DBYE
4 PHL, IND PHL, IND
1 KOR, THA, TWN, HKG, MAC, AUS, NZL
HKG, MAC, CAN, NZL
HKG, VNM - DYER KOR, THA, TWN, HKG, MAC, AUS, NZL
HKG, MAC, NZL, CAN
HKG, VNM -
2 MYS, IND, CAN TWN, AUS KOR, CAN MYS, CAN TWN, AUS KOR, CAN
3 KOR, THA, MYS, PHL
SGP, BRN KOR, THA, MYS PHL,IND
DBER
4 PHL, IND SGP, BRN
1 KOR, THA, TWN, HKG, MAC, AUS, NZL
HKG, MAC, CAN, NZL
HKG, VNM - DBYER KOR, THA, TWN, HKG, MAC, AUS, NZL
HKG, MAC, NZL, CAN
HKG, VNM -
2 MYS, CAN TWN, AUS KOR, CAN TWN, AUS KOR, CAN
BYER
3 KOR, THA, MYS SGP, BRN KOR, THA, MYS SGP, BRN
PHL, IND PHL, IND
Note: D=Dollar; B=Currency Basket; Y=Yen; E=Euro/Mark; R=Yuan (Renminbi)

A Clustering Approach
351
7.2.2 Assessment of Preparedness
This section compares the Asian-only with the Asian-plus-EMU solutions. Associations
with the euroized cases are expected to infer the levels of preparedness for EMU-like
currency union amongst the Asian economies. Recall that EMU1, EMU2, and EMU3
represent pre-Maastricht, post-Maastricht, and post-euro periods respectively.
Associations with the latter periods may indicate higher readiness. Common subsets
between the Asian-only and the Asian-plus-EMU solutions should indicate common
sharing of Maastricht features and degree of preparedness.58
Results are reported in Table 7.12. Columns ‘1’ contain the original groupings
comprising of Asian cases only and columns ‘2’ contain the solutions involving the
Asian and EMU cases. Cells containing EMU cases are highlighted.
Based on the number of Asian cases linked with the euroized benchmarks, the
region could have been more ready for dollar and basket pegs in the pre-crisis period,
for dollar and yuan pegs in the crisis period, and for basket and yen pegs in the post-
crisis period. For post-crisis period, though fewer Asian cases are linked with the EMU
benchmarks by dollar and yuan anchors, they are nevertheless connected with EMU3,
the post-euro benchmark.
Along these lines, on the whole over the periods the region could have been
comparatively prepared by dollar, basket, or yen anchor.
Obviously, the groupings of the Asian cases are somewhat different when
benchmark cases are added in the analysis. Hence, it is straightforward to identify
common groupings between the two results. When a subset of Asian countries in
column 1 intersects with that in column 2, the common sets of countries might most
probably possess common Maastricht features and levels of preparedness.
58 Cophenetic correlations indicate that group average linkage produces the best partitions, except for the post-crisis yen and euro results where the centroid method yields the largest coefficients. Previous HCM procedures apply.

Optimal Currency Areas in East Asia
352
The second part of the table lists the non-singleton common subsets. Generally
speaking, over the periods more sets of countries jointly share Maastricht dimensions
and degree of preparedness when US is the reference.
The cross-period common sets are listed at the bottom rows. Korea-Thailand is one
by the US reference while Taiwan-Australia is one by Japan reference.
The effective dollar areas of Hong Kong and Macau are placed together for the pre-
crisis and crisis periods by the US reference, in line with their dollar pegs but not for the
post-crisis period. They are also placed together by some reference for some period but
not consecutively over periods. Regarding Singapore and Brunei, Singapore is not seen
in any common set.
The cross-anchor common sets of economies are exhibited in Table 7.13. Since no
subgroups are stable over all periods across all anchors, it may be worthwhile to note
those which are stable over all anchors and since the post-crisis period is the most recent
period, it is compelling to focus on this period. For post-crisis period HongKong-
Vietnam and Philippines-India are robust across all anchors.
The characteristics of the Asian-plus-EMU groups are put together in Table 7.14.
Most of the time, Singapore alone or groups containing Singapore show more
conforming attributes than even some of the Asian-plus-EMU clusters. Hence, though
not associated with the EMU benchmarks, Singapore might also be highly prepared for
EMU-like monetary arrangement.

A Clustering Approach
353
Table 7.12 Maastricht-HCM preparedness assessment
Dollar Currency Basket Yen Euro Yuan
1 2 1 2 1 2 1 2 1 2
1 CHN, HKG, KOR, TWN, MYS, THA, IND, MAC, BRN, JPN, AUS, NZL, CAN
CHN, HKG,
KOR, TWN,
MYS, THA,
IND, MAC,
BRN, JPN,
AUS, NZL,
CAN, EMU1, EMU2, EMU3
MAC, HKG, KOR, TWN, THA, BRN, AUS, MYS, NZL, CAN, SGP, CHN, IND
MAC, HKG,
KOR, TWN,
THA, BRN,
AUS, MYS,
NZL, CAN, EMU1, EMU2, EMU3
MAC, AUS, HKG, THA, BRN, NZL, KOR, TWN, MYS, CAN
HKG, KOR,
TWN, THA,
MAC, BRN,
AUS, NZL, EMU3
HKG, NZL, MAC, AUS, KOR, THA, TWN, BRN
HKG, KOR,
TWN, THA,
MAC, BRN,
AUS, NZL, EMU3
KOR, THA, TWN, HKG, MAC, AUS, NZL
HKG, KOR, TWN, MMR, THA, MAC, BRN, AUS, NZL
2 IDN, MMR, PHL
IDN, MMR, PHL
KHM. IDN, MMR, PHL
IDN, MMR, PHL, CHN, IND
CHN, IND, MMR, PHL, KHM, IDN
MYS, CAN, EMU1, EMU2
MYS, IND, CAN
MYS, IND,
CAN, EMU1, EMU2
MYS, IND, CAN, PHL
EMU1, EMU2, EMU3
3 SGP SGP LAO SGP SGP CHN, MMR, PHL, IND
KHM, IDN, JPN
KHM, IDN, JPN
MMR, BRN, JPN
MYS, PHL, IND, CAN
4 KHM KHM VNM KHM LAO KHM, IDN MMR, PHL MMR, PHL KHM KHM, IDN, JPN
5 LAO LAO LAO VNM SGP SGP SGP IDN SGP
6 VNM VNM VNM LAO LAO LAO LAO LAO
7 VNM VNM VNM VNM VNM
Pre-crisis
8 CHN CHN SGP
1 HKG, MAC, CAN, NZL
CHN, TWN,
VNM, AUS,
KOR, MYS,
PHL, THA, EMU1, EMU2
HKG, MAC, CAN, NZL, BRN
CHN, TWN,
VNM, AUS, EMU1, EMU2
HKG, MAC, NZL, CAN
CHN, TWN,
AUS, EMU1, EMU2
HKG, MAC, NZL, CAN, BRN, CHN, TWN, PHL, VNM, AUS, KOR, MYS, THA, KHM, IND, JPN, MMR
CHN, HKG, KOR, TWN, KHM, MYS, PHL, THA, VNM, IND, MAC, BRN, JPN, AUS, NZL, CAN
HKG, MAC, CAN, NZL
KOR, TWN,
MYS, PHL,
THA, VNM,
AUS, EMU1, EMU2
2 CHN, VNM, TWN, AUS
HKG, MAC,
NZL, CAN, EMU3
CHN, TWN, AUS, VNM
HKG, MAC, BRN, NZL, CAN
CHN, TWN, AUS
KOR, MYS, PHL, THA, VNM
SGP EMU1, EMU2, EMU3
KOR, THA, MYS, PHL
HKG, MAC,
NZL, CAN, EMU3
3 KOR, THA, MYS, PHL
KHM, MMR KOR, THA, MYS, PHL
KOR, MYS, PHL, THA
KOR, THA, MYS
HKG, MAC, NZL, CAN
IDN SGP TWN, AUS KHM, MMR
4 IND, JPN IND, JPN IND MMR PHL, VNM EMU3 LAO IDN VNM, IND SGP, BRN
5 KHM SGP, BRN KHM IND IND BRN LAO BRN IND, JPN
6 MMR IDN MMR KHM BRN IND MMR JPN IDN
7 SGP LAO SGP SGP MMR KHM KHM LAO
8 IDN IDN IDN SGP MMR MMR
9 LAO LAO LAO KHM SGP SGP
10 BRN EMU3 IDN IDN IDN
Crisis
11 LAO LAO LAO
1 KOR, CAN, THA, AUS
CHN, HKG,
MYS, VNM,
TWN, PHL,
IND, EMU3
CHN, HKG, THA, TWN, MYS, VNM
CHN, HKG,
KOR, TWN,
KHM, IDN,
MYS, PHL,
THA, VNM,
IND, AUS,
NZL, CAN, EMU1, EMU2
CHN, HKG, KOR, THA, TWN, MYS, PHL, IND, VNM, AUS, CAN, KHM
CHN, HKG,
KOR, TWN,
KHM, IDN,
MYS, PHL,
THA, VNM,
IND, AUS,
NZL, CAN, EMU1, EMU2
CHN, HKG, VNM, THA
CHN, HKG,
MYS, PHL,
THA, VNM,
IND, AUS, EMU2
KOR, CAN, AUS
HKG, TWN,
KHM, MYS,
PHL, THA,
VNM, IND, EMU3
2 CHN, HKG, MYS, VNM
KOR, THA,
AUS, CAN, EMU2
KOR, AUS, CAN
SGP, MAC, BRN
SGP, BRN, MAC
SGP, MAC, BRN
MYS, PHL, IND, AUS
KOR, NZL, CAN
TWN, THA, PHL, IND
KOR, JPN,
AUS, NZL,
CAN, EMU1, EMU2
3 TWN, PHL, IND
SGP, MAC, BRN
SGP, MAC, BRN
EMU3 IDN, NZL EMU3 KOR, CAN, NZL
SGP, MAC, BRN
HKG, MYS, VNM
SGP, MAC, BRN
4 SGP, BRN, MAC
EMU1 PHL, IND LAO LAO LAO TWN, KHM TWN, KHM SGP, BRN, MAC
LAO
5 KHM KHM KHM MMR MMR MMR SGP, BRN EMU3 NZL MMR
6 JPN JPN IDN MAC EMU1 KHM IDN
7 IDN IDN LAO IDN JPN JPN
8 LAO LAO MMR LAO IDN IDN
9 MMR MMR NZL MMR LAO LAO
Post-crisis
10 NZL NZL JPN MMR MMR
1 KOR, THA CHN, HKG, KOR, TWN, MYS, THA, AUS, CAN
CHN, TWN TWN, AUS KOR, MYS, THA
TWN, AUS HKG, THA - - -
2 MYS, THA TWN, AUS MYS, IND
All Periods
3 MAC, BRN HKG, CAN KOR, NZL
Common sets of countries
Dollar Currency Basket Yen Euro Yuan
1 CHN, HKG, KOR, TWN, MYS, THA, IND, MAC, BRN, JPN, AUS, NZL, CAN
MAC, HKG, KOR, TWN, THA, BRN, AUS, MYS, NZL, CAN
MAC, AUS, HKG, THA, BRN, NZL, KOR, TWN
HKG, NZL, MAC, AUS, KOR, THA, TWN, BRN
- Pre-crisis
2 MYS, CAN MYS, IND, CAN
1 HKG, MAC, CAN, NZL CHN, TWN, AUS, VNM CHN, TWN, AUS - HKG, MAC, CAN, NZL
2 CHN, VNM, TWN, AUS KOR, THA, MYS, PHL Crisis
3 KOR, THA, MYS, PHL TWN, AUS
1 KOR, CAN, THA, AUS CHN, HKG, THA, TWN, MYS, VNM
CHN, HKG, KOR, THA, TWN, MYS, PHL, IND, VNM, AUS, CAN, KHM
CHN, HKG, VNM, THA TWN, THA, PHL, IND
2 CHN, HKG, MYS, VNM KOR, AUS, CAN IDN, NZL MYS, PHL, IND, AUS HKG, MYS, VNM
Post-crisis
3 TWN, PHL, IND PHL, IND KOR, CAN, AUS
All Periods
1 KOR, THA - TWN, AUS - -

Optimal Currency Areas in East Asia
354
Table 7.13 Maastricht-HCM-preparedness cross-anchor subclusters
PRE CRS PST All PRE CRS PST All
1 HKG, KOR, TWN, MYS, THA, MAC, BRN, AUS, NZL, CAN
CHN, TWN, VNM, AUS
KOR, CAN, THA, AUS
- DY HKG, KOR, TWN, THA, MAC, BRN, AUS, NZL
CHN, TWN, AUS KOR, CAN, THA, AUS
-
2 CHN, HKG, MYS, VNM
MYS, CAN CHN, HKG, MYS, VNM
DB
3 TWN, PHL, IND TWN, PHL, IND
1 HKG, KOR, TWN, THA, MAC, BRN, AUS, NZL
- CHN, HKG, VNM - DR - HKG, MAC, CAN, NZL
KOR, CAN, AUS -
2 MYS, IND, CAN PHL, IND KOR, THA, MYS, PHL
HKG, MYS, VNM
DE
3 TWN, PHL, IND
1 MAC, HKG, KOR, TWN, THA, BRN, AUS
CHN, TWN, AUS CHN, HKG, THA, TWN, MYS, VNM
- BE MAC, HKG, KOR, TWN, THA, BRN, AUS
- CHN, HKG, THA, VNM
-
2 MYS, CAN PHL, IND MYS, CAN PHL, IND
BY
3 KOR, AUS, CAN
1 - - HKG, MYS, VNM - MAC, AUS, HKG, THA, BRN, NZL, KOR, TWN
- CHN, HKG, THA, VNM
-
2 THA, TWN MYS, CAN MYS, PHL, IND, AUS
3 KOR, AUS, CAN
BR
4 PHL, IND
YE
1 - - HKG, MYS, VNM - - - HKG, VNM -
2 KOR, AUS, CAN PHL, IND
YR
3 TWN, THA, PHL, IND
ER
1 HKG, KOR, TWN, THA, MAC, BRN, AUS, NZL
CHN, TWN, AUS KOR, CAN, THA, AUS
- HKG, KOR, TWN, THA, MAC, BRN, AUS, NZL
- CHN, HKG, VNM -
2 MYS, CAN CHN, HKG, MYS, VNM
MYS, CAN PHL, IND
DBY
3 TWN, PHL, IND
DBE
1 - - KOR, CAN, AUS - HKG, KOR, TWN, THA, MAC, BRN, AUS, NZL
- CHN, HKG, VNM -
2 HKG, MYS, VNM MYS, CAN PHL, IND
DBR
3 TWN, PHL, IND
DYE
1 - - KOR, CAN, AUS - - - HKG, VNM -
2 HKG, MYS, VNM PHL, IND
DYR
3 TWN, PHL, IND
DER
1 MAC, HKG, KOR, TWN, THA, BRN, AUS
- CHN, HKG, THA, VNM
- - - HKG, MYS, VNM
2 MYS, CAN PHL, IND THA, TWN
3 PHL, IND
BYE
4
BYR
KOR, AUS, CAN
1 - - PHL, IND - - - HKG, VNM - BER
2
YER
PHL, IND
1 HKG, KOR, TWN, THA, MAC, BRN, AUS, NZL
- CHN, HKG, VNM - - - KOR, CAN, AUS -
2 MYS, CAN PHL, IND HKG, MYS, VNM
DBYE
3
DBYR
TWN, PHL, IND
1 - - HKG, VNM - - - HKG, VNM - DBER
2 PHL, IND
DYER
PHL, IND
1 - - HKG, VNM - - - HKG, VNM BYER
2 PHL, IND -
DBYER
PHL, IND
Note: D=Dollar; B=Currency Basket; Y=Yen; E=Euro/Mark; R=Yuan (Renminbi)

A Clustering Approach
355
Table 7.14 Maastricht-HCM preparedness clusters
Dollar
Cluster DEF (%)1 INF (%) NER2 INT (%) N3
Pre-crisis
All Cases -1.807 5.411 2.760 4.614
1 CHN, HKG, KOR, TWN, MYS, THA, IND, MAC, BRN, JPN, AUS,
NZL, CAN, EMU1, EMU2, EMU3 -1.490 3.211 1.740 2.644 0 2 IDN, MMR, PHL -1.402 9.326 1.367 8.799 0 3 SGP 6.269 1.941 1.032 1.971 4 4 KHM -3.467 2.928 10.921 9.748 0 5 LAO -10.466 16.120 2.778 15.935 0 6 VNM -5.860 24.109 16.810 7.797 0
Crisis
All Cases -1.231 7.553 3.794 4.447
1 CHN, TWN, VNM, AUS, KOR, MYS, PHL, THA, EMU1, EMU2 -2.463 2.521 3.625 2.273 0 2 HKG, MAC, NZL, CAN, EMU3 .916 2.189 1.013 1.876 2 3 IND, JPN -5.615 3.726 2.547 5.253 0 4 KHM, MMR -1.097 15.640 2.039 8.425 0 5 SGP, BRN 5.867 1.712 2.439 2.289 2 6 IDN -1.199 21.576 16.679 16.132 0 7 LAO -4.645 67.298 11.438 21.618 0
Post-crisis
All Cases -.787 3.209 1.570 4.528 0
1 CHN, HKG, MYS, VNM, TWN, PHL, IND, EMU3 -2.415 2.200 .725 3.140 0 2 KOR, THA, AUS, CAN, EMU2 -.498 .909 2.251 2.113 0 3 EMU1 -3.605 2.163 3.712 1.186 1 4 NZL 3.501 .492 3.298 5.315 1 5 KHM -2.149 2.149 .563 11.075 1 6 JPN -7.050 2.968 2.573 4.091 0 7 SGP, MAC, BRN 6.272 2.462 .871 1.499 1 8 IDN -1.330 6.663 3.639 9.675 0 9 LAO -3.641 6.162 1.398 22.913 0
10 MMR -.846 23.681 1.254 9.705 0
Currency Basket
Cluster DEF (%)1 INF (%) NER2 INT (%) N3
Pre-crisis
All Cases -1.829 5.968 4.248 4.917
1 MAC, HKG, KOR, TWN, THA, BRN, AUS, MYS, NZL, CAN, EMU1, EMU2, EMU3 -1.008 3.008 2.279 2.375 0
2 IDN, MMR, PHL, CHN, IND -2.720 9.256 3.204 7.653 0 3 SGP 6.269 1.599 1.955 1.508 4 4 KHM -3.467 3.276 11.193 10.430 0 5 LAO -10.466 16.519 9.182 16.008 0 6 VNM -5.860 24.510 25.481 8.544 0
Crisis
All Cases -.981 7.523 5.777 4.701
1 CHN, TWN, VNM, AUS, EMU1, EMU2 -2.681 1.972 4.069 1.917 0 2 KOR, MYS, PHL, THA -2.135 3.335 7.704 3.480 0 3 KHM -1.658 6.631 5.161 10.351 0 4 MMR -.535 24.978 4.496 8.597 0 5 IND -5.231 5.950 4.335 5.493 0 6 HKG, MAC, BRN, NZL, CAN 1.847 2.092 4.557 1.722 1 7 SGP 7.572 1.186 5.041 1.137 1 8 IDN -1.199 21.985 17.533 17.181 0 9 LAO -4.645 68.106 12.501 22.666 0
10 EMU3 -.491 1.030 .000 3.952 2 Post-crisis
All Cases -.503 3.560 2.048 4.305
1 CHN, HKG, KOR, TWN, KHM, IDN, MYS, PHL, THA, VNM, IND,
AUS, NZL, CAN, EMU1, EMU2 -1.556 2.449 2.308 3.461 0 2 SGP, MAC, BRN 6.272 2.134 1.555 .970 2 3 EMU3 -.491 1.030 .000 3.952 2 4 LAO -3.641 7.151 2.026 22.923 0 5 MMR -.846 24.559 1.441 9.550 0

Optimal Currency Areas in East Asia
356
Table 7.14 Maastricht-HCM preparedness clusters (continued)
Yen
Cluster DEF (%)1 INF (%) NER2 INT (%) N3
Pre-crisis All Cases -1.829 6.766 5.591 8.295
1 HKG, KOR, TWN, THA, MAC, BRN, AUS, NZL, EMU3 .452 4.341 3.067 6.530 0 2 MYS, CAN, EMU1, EMU2 -4.294 2.039 3.163 3.535 0 3 CHN, MMR, PHL, IND -3.010 11.444 3.883 11.165 0 4 KHM, IDN -2.515 5.638 8.170 15.232 0 5 SGP 6.269 1.340 2.776 2.988 4 6 LAO -10.466 17.197 14.842 18.874 0 7 VNM -5.860 26.045 33.265 10.821 0
Crisis All Cases -.981 7.700 5.109 8.578
1 CHN, TWN, AUS, EMU1, EMU2 -2.560 1.675 3.588 3.942 0 2 KOR, MYS, PHL, THA, VNM -2.366 3.718 6.167 8.467 0 3 HKG, MAC, NZL, CAN 1.268 2.082 4.072 6.423 0 4 EMU3 -.491 1.030 .000 3.952 2 5 BRN 4.162 1.032 3.757 3.594 1 6 IND -5.231 6.971 3.655 10.506 0 7 KHM -1.658 6.546 4.506 15.365 0 8 MMR -.535 25.494 3.278 13.610 0 9 SGP 7.572 1.038 3.757 4.078 1
10 IDN -1.199 22.682 16.431 22.194 0 11 LAO -4.645 69.312 11.962 27.680 0
Post-crisis All Cases -.503 4.445 2.606 7.237
1 CHN, HKG, KOR, TWN, KHM, IDN, MYS, PHL, THA, VNM, IND, AUS, NZL,
CAN, EMU1, EMU2 -1.556 3.482 2.879 6.394 0 2 SGP, MAC, BRN 6.272 1.882 2.236 4.073 1 3 EMU3 -.491 1.030 .000 3.952 3 4 LAO -3.641 9.059 2.607 26.941 0 5 MMR -.846 26.361 1.955 13.812 0
Euro
Cluster DEF (%)1 INF (%) NER2 INT (%) N3
Pre-crisis
All Cases -1.807 5.813 5.457 4.233 1 HKG, KOR, TWN, THA, MAC, BRN, AUS, NZL, EMU3 .452 3.681 3.121 2.054 0 2 MYS, IND, CAN, EMU1, EMU2 -4.488 2.741 3.230 2.902 0 3 KHM, IDN, JPN -2.123 3.417 6.312 8.182 0 4 MMR, PHL -1.322 12.480 3.324 5.381 0 5 SGP 6.269 1.264 2.772 4.229 3 6 LAO -10.466 16.624 14.877 13.926 0 7 VNM -5.860 23.962 33.098 7.968 0 8 CHN -4.130 9.797 4.933 .759 1
Crisis
All Cases -1.199 7.144 9.697 4.436
1 CHN, HKG, KOR, TWN, KHM, MYS, PHL, THA, VNM, IND, MAC, BRN, JPN, AUS, NZL, CAN -1.358 2.744 10.171 3.042 0
2 MMR -.535 25.197 9.765 6.396 0 3 EMU1, EMU2, EMU3 -2.347 1.369 2.050 2.792 2 4 SGP 7.572 .570 10.102 3.136 2 5 IDN -1.199 22.092 19.715 14.981 0 6 LAO -4.645 68.446 14.578 20.466 0
Post-crisis
All Cases -.553 3.645 2.504 4.692
1 CHN, HKG, MYS, PHL, THA, VNM, IND, AUS, EMU2 -2.382 2.213 2.514 2.556 0 2 KOR, NZL, CAN 1.941 1.059 2.816 3.288 0 3 SGP, MAC, BRN 6.272 1.812 2.105 3.589 1 4 TWN, KHM -2.176 1.931 2.429 7.122 0 5 EMU3 -.491 1.030 .000 3.952 2 6 EMU1 -3.605 2.163 3.712 1.186 1 7 JPN -7.050 1.912 2.527 7.646 0 8 IDN -1.330 7.720 3.840 6.085 0 9 LAO -3.641 7.239 2.563 19.295 0
10 MMR -.846 24.554 1.340 6.166 0
Yuan
Cluster DEF (%)1 INF (%) NER2 INT (%) N3
Pre-crisis
All Cases -1.702 9.341 6.139 4.312
1 HKG, KOR, TWN, MMR, THA, MAC, BRN, AUS, NZL .436 9.644 4.203 2.260 1 2 EMU1, EMU2, EMU3 -2.347 1.369 2.050 2.792 2 3 MYS, PHL, IND, CAN -4.473 8.796 4.275 3.594 0 4 KHM, IDN, JPN -2.123 9.771 7.359 7.992 0 5 SGP 6.269 10.232 3.987 4.651 1 6 LAO -10.466 16.614 14.963 13.823 0 7 VNM -5.860 23.264 32.948 7.269 0
Crisis
All Cases -1.140 7.934 3.795 5.247
1 KOR, TWN, MYS, PHL, THA, VNM, AUS, EMU1, EMU2 -2.458 3.154 4.027 3.169 0 2 HKG, MAC, NZL, CAN, EMU3 .916 1.978 1.013 2.698 1 3 KHM, MMR -1.097 16.485 2.042 10.250 0 4 SGP, BRN 5.867 1.172 2.438 .509 3 5 IND, JPN -5.615 4.239 2.549 5.253 0 6 IDN -1.199 23.022 16.679 17.957 0 7 LAO -4.645 69.459 11.440 23.443 0
Post-crisis
All Cases -1.140 7.934 3.795 5.247
1 HKG, TWN, KHM, MYS, PHL, THA, VNM, IND, EMU3 -2.021 4.151 2.576 4.624 0 2 KOR, JPN, AUS, NZL, CAN, EMU1, EMU2 -1.875 2.136 3.643 2.778 0 3 SGP, MAC, BRN 4.205 1.278 1.649 1.199 4 4 LAO -4.645 69.459 11.440 23.443 0 5 MMR -.535 25.923 1.732 9.373 0 6 IDN -1.199 23.022 16.679 17.957 0
Note: 1 Positive value indicates surplus. 2 Standard deviation (x102) of the log difference in bilateral nominal exchange rate. 3 Number of variables with highest degree of conformity to Maastricht Treaty. Source: Hierarchical cluster analysis. See Appendix A for data description.

A Clustering Approach
357
7.2.3 Recapitulation
The section has discussed the results using hierarchical cluster analysis and Maastricht
criteria. The following are the key findings.
Classifications
Based on the average silhouettes over all objects, euro solutions are most appropriately
classified for pre-crisis and crisis periods and yen solution is best classified for post-
crisis period.
Based on the partitioning, in general the Japan reference is associated with more
convergent cluster configurations and the pre-crisis period is associated with more
convergent arrangements regardless of reference country.
Amongst subgroups which are stable over periods, notably Korea and Thailand, and
Thailand and Malaysia are respectively linked across dollar and yen anchors, and basket
and yen anchors.
There are linkages which are stable over all anchors for the post-crisis period. These
linkages are HongKong-Vietnam, Korea-Canada, Singapore-Brunei, and Philippines-
India.
The effective dollar areas of Hong Kong and Macau are put together only for the
pre-crisis and crisis periods. As for the monetary union members of Singapore and
Brunei, they are only placed together for post-crisis period. Hence, these pairs of
economies are not indicated to be consistently symmetrical over the periods despite
maintaining similar exchange rate policies.
Assessment of Preparedness
Based on the number of Asian cases linked with the EMU benchmarks, overall the
region could have been comparatively prepared for dollar, basket, or yen anchor.

Optimal Currency Areas in East Asia
358
Korea and Thailand, and Taiwan and Australia might have constantly shared
common Maastricht features and degrees of preparedness over the periods by the US
and the Japan reference respectively.
Hong Kong and Macau are, amongst others, placed together for the pre-crisis and
crisis periods by the US reference, in line with their dollar pegs but not for the post-
crisis period. Regarding Singapore and Brunei, Singapore is not indicated to share
common Maastricht conditions and degree of preparedness with Brunei or with nay
country.
For post-crisis period, Hong Kong and Vietnam, and Philippines and India are
shown to possess those common features over all anchors.
Most of the time, Singapore alone or groups containing Singapore show more
conforming Maastricht attributes.
7.3 Fuzzy Clustering Results
The results by fuzzy cluster analysis are categorized into three main sections:
classifications, assessment of preparedness, and a recapitulation.
7.3.1 Classifications
The section is divided into three parts: cluster validation; findings by each monetary
anchor; and comparisons of findings across the anchors.
Cluster Validation
Recall that Xie-Beni’s index (XBI) is used to determine the number of clusters or
cluster solution for fuzzy cluster analysis. The lower the value, the better the fuzzy
partition fits the structure of the data. Meantime, Normalized Dunn’s Partition
Coefficient (DPC) is used to measure the degree of fuzziness in the data in which a
value close to 1 indicates no fuzziness whilst a value close to 0 indicates complete
fuzziness. Table 7.15 exhibits the XBI and DPC values for a range of cluster solutions.

A Clustering Approach
359
Sometimes a compromise between the two measures has to be made to ensure more
interpretable results. The selected cluster solutions are highlighted.
The smallest XBI for the pre-crisis period is obtained by the yen solution. The yuan
solution produces the lowest XBI for the crisis period and the euro anchor solution
attains the lowest XBI for the post-crisis period. Hence, the reference country
corresponding to the best partitioning is different for different period. Nevertheless, the
XBI values are similar across the selected solutions, signifying similar degrees of
goodness-of-fit between the partitions and data over the solutions.
Table 7.15 XBI and DPC using Maastricht criteria
Dollar Currency Basket
Pre-crisis Crisis Post-crisis Pre-crisis Crisis Post-crisis
k XBI DPC XBI DPC XBI DPC XBI DPC XBI DPC XBI DPC
2 1.91 .45 1.87 .75 1.73 .25 1.94 .57 1.62 .76 1.58 .23 3 1.72 .52 1.60 .55 2.03 .34 1.68 .56 1.49 .59 1.91 .43 4 1.38 .45 1.43 .47 1.49 .45 1.48 .52 1.18 .47 1.50 .52 5 1.44 .47 1.33 .47 1.27 .44 1.49 .44 1.22 .51 1.13 .49 6 1.44 .51 1.76 .53 1.41 .50 1.88 .60 1.34 .56 1.40 .57 7 1.24 .49 1.32 .56 1.66 .52 1.31 .54 1.26 .61 1.59 .57 8 1.49 .49 1.32 .59 1.59 .55 1.30 .57 1.40 .66 1.42 .60 9 1.41 .56 1.44 .60 2.61 .59 1.57 .61 1.56 .68 1.86 .65
10 1.47 .57 1.44 .66 1.52 .64 1.45 .61 1.46 .74 1.51 .64 11 1.40 .65 1.29 .67 1.84 .64 1.51 .67 1.52 .76 1.87 .70
Yen Euro Yuan
Pre-crisis Crisis Post-crisis Pre-crisis Crisis Post-crisis Pre-crisis Crisis Post-crisis
k XBI DPC XBI DPC XBI DPC XBI DPC XBI DPC XBI DPC XBI DPC XBI DPC XBI DPC
2 2.54 .47 1.76 .77 4.43 .29 1.99 .71 2.15 .79 1.49 .28 1.87 .74 2.03 .74 1.75 .26 3 1.95 .57 1.44 .59 1.23 .44 1.29 .51 2.68 .62 1.41 .46 1.69 .52 1.51 .56 1.33 .38 4 1.83 .53 1.46 .46 2.09 .46 1.34 .51 1.36 .53 1.34 .46 1.60 .53 1.24 .46 1.37 .48 5 1.92 .53 1.54 .51 2.14 .51 1.18 .51 1.21 .48 1.11 .44 1.51 .53 1.11 .49 1.35 .50 6 1.84 .58 1.32 .54 2.05 .59 1.18 .56 1.21 .61 1.12 .51 1.64 .58 1.07 .53 1.54 .52 7 1.15 .50 1.55 .65 1.65 .53 1.39 .49 1.52 .61 1.44 .55 1.46 .53 1.54 .55 1.63 .50 8 1.24 .54 1.51 .67 1.57 .57 1.45 .56 1.56 .64 1.58 .55 1.95 .55 1.42 .59 1.40 .56 9 1.22 .59 1.64 .69 1.69 .63 1.35 .57 1.50 .70 1.73 .61 1.68 .56 1.52 .62 1.38 .62
10 1.34 .61 1.52 .75 1.76 .64 1.47 .58 1.53 .69 1.58 .65 2.05 .63 1.35 .68 1.50 .61 11 1.56 .62 1.59 .74 1.95 .68 1.42 .66 1.49 .68 1.61 .64 1.78 .67 1.57 .68 1.83 .66
Note: In general, an effective representation of data requires that the number of clusters be neither too small nor too large. The number of clusters considered here should suffice for meaningful interpretations. Source: Hierarchical cluster analysis. See Appendix A for data description.
Dollar Anchor Results
The partitions using US as the reference are discussed here. The memberships for
belonging are collected in the first part of Table 7.16. The greater the coefficient for a
group, the greater the belongingness to that group. The highest membership coefficients
are highlighted. On the whole, the solutions provide clear-cut data partitions with
significantly large degree of belongingness to only one group. The Maastricht features

Optimal Currency Areas in East Asia
360
are shown in the second part of the table.
XBI values indicate the presence of 7 clusters for pre-crisis and crisis periods, and 5
clusters for post-crisis period. The reduced number of clusters might indicate enhanced
degree of regional symmetry against US. The average silhouettes for all objects suggest
that the crisis period partition with silhouette 0.60 fits the data best.
The pre-crisis solution reveals that the Malaysia-Canada pair obtains the highest
group silhouette at 0.95. Accordingly, the membership coefficients of all other countries
for belonging to this group are very small, indicating that these two economies share
common features which are far from being fully shared by others. In this period before
the Asian turmoil, the pair’s inflation is closest to the US level. Despite this, it is the
first group that possesses the most number of best features.
Hong Kong and Macau retain their pre-crisis link in the crisis period setting. In
combination with New Zealand and Canada, they make up the group with the greatest
silhouette and 2 best attributes for the crisis period. Singapore-Brunei too has 2 best
features.
For the post-crisis period, Singapore reestablishes its pre-crisis linkage with Macau.
Together with Brunei, this trio with 2 most Maastricht-compliant conditions is best
classified at silhouette 0.85 and hence might be comparatively prospective for adopting
the US monetary policy.
Throughout the findings no countries are consistently put together in the same
grouping. The reduced number and increased size of clusters in the post-crisis finding
might signify greater degree of symmetry vis-à-vis US. From another perspective,
economies which are clustered with Hong Kong, an effective dollar area could be
relatively feasible for a hard dollar peg.

A Clustering Approach
361
Table 7.16 Maastricht-FCM-dollar clusters
Membership coefficients (%) Pre-crisis Crisis Post-crisis I II III IV V VI VII I II III IV V VI VII I II III IV V
1 CHN 12.01 3.09 18.59 29.13 13.18 2.51 21.49 8.68 .34 6.58 4.97 1.40 3.61 74.42 2.65 .66 2.09 5.72 88.88
2 HKG 79.47 .37 3.08 1.95 12.40 .32 2.42 83.33 .24 1.70 2.67 2.67 2.65 6.74 5.88 1.38 3.83 9.04 79.87
3 KOR 59.53 .53 8.25 3.71 23.97 .38 3.63 2.18 .24 2.52 89.17 .83 1.63 3.45 14.46 2.02 57.49 14.89 11.14
4 TWN 53.08 .77 14.83 5.16 21.01 .58 4.56 3.71 .10 1.76 2.59 .47 1.05 90.32 3.42 1.26 6.41 53.90 35.01
5 KHM 10.80 8.27 12.64 28.47 13.58 7.85 18.39 12.15 1.45 19.30 14.55 4.11 29.56 18.87 10.27 14.59 12.14 32.04 30.96
6 IDN 9.65 5.06 9.10 24.22 16.89 1.91 33.18 10.33 20.84 13.91 17.94 9.21 16.54 11.24 10.62 14.04 40.30 23.04 12.00
7 LAO .01 99.92 .01 .02 .01 .01 .02 .06 99.58 .08 .07 .05 .11 .06 .43 97.56 .59 .80 .62
8 MYS .90 .11 96.71 .91 .82 .07 .48 5.33 .32 5.65 69.68 1.29 2.82 14.90 4.54 2.13 6.44 30.02 56.88
9 MMR 7.39 4.53 5.47 12.40 10.58 2.51 57.11 .88 .15 .71 .74 .37 96.23 .93 17.19 24.15 17.52 20.91 20.23
10 PHL .92 .27 .80 3.18 1.64 .14 93.05 7.65 .64 17.60 40.04 2.00 8.16 23.91 .58 .30 1.89 94.48 2.75
11 SGP 37.88 2.22 8.62 7.63 31.50 1.97 10.18 1.14 .09 .27 .45 97.09 .48 .48 92.35 .50 2.76 1.84 2.55
12 THA 19.87 .68 5.91 5.12 62.51 .43 5.48 .61 .06 1.01 96.32 .20 .48 1.31 10.55 2.17 23.55 34.67 29.06
13 VNM .00 .01 .00 .01 .00 99.97 .01 4.45 .27 9.72 5.40 .90 2.98 76.28 4.81 2.63 4.79 19.32 68.46
14 IND 1.01 .50 2.41 91.23 1.44 .22 3.19 4.37 .62 63.63 6.99 1.31 5.14 17.93 1.80 1.53 4.34 82.54 9.78
15 MAC 74.24 .33 2.45 1.70 18.76 .25 2.27 86.24 .18 1.41 2.14 1.83 2.09 6.10 74.47 2.53 6.44 6.14 10.42
16 BRN 13.20 .51 2.60 3.28 73.67 .35 6.39 32.40 .77 3.38 6.60 42.98 6.30 7.58 94.90 .42 1.85 1.21 1.61
17 JPN 17.28 1.29 12.69 18.65 36.79 .87 12.43 1.06 .23 91.00 2.89 .39 1.37 3.07 6.50 6.94 23.41 47.41 15.73
18 AUS 76.63 .26 2.31 1.62 17.15 .21 1.82 10.10 .33 5.67 12.73 1.57 3.10 66.51 3.15 1.47 81.88 9.51 3.99
19 NZL 19.20 .18 1.39 1.28 76.01 .14 1.80 61.66 .54 3.63 9.78 7.91 5.37 11.12 13.21 4.44 62.32 12.04 7.99
20 CAN 1.81 .36 91.74 2.82 1.75 .22 1.31 95.08 .06 .49 .96 .76 .67 1.99 7.31 1.43 72.92 11.29 7.05
Maastricht Features Averages Cluster SW DEF (%)1 INF (%) NER2 INT (%) N3
Pre-crisis
All Cases .25 -1.726 6.017 2.867 4.901 1 HKG, KOR, TWN, SGP, MAC, AUS .11 1.441 3.006 1.112 1.306 3 2 LAO .00 -10.466 16.120 2.778 15.935 0 3 MYS, CAN .95 -5.312 1.444 1.208 1.568 1 4 CHN, KHM, IND -.14 -4.287 5.837 6.070 6.432 0 5 THA, BRN, JPN, NZL .54 .212 3.425 1.586 4.243 0 6 VNM .00 -5.860 24.109 16.810 7.797 0 7 IDN, MMR, PHL .26 -1.402 9.326 1.367 8.799 0
Crisis All Cases .60 -1.027 8.154 3.866 4.671
1 HKG, MAC, NZL, CAN .77 1.268 2.479 1.266 1.357 2 2 IDN, LAO .29 -2.922 44.437 14.058 18.875 0 3 IND, JPN .61 -5.615 3.726 2.547 5.253 0 4 KOR, MYS, PHL, THA .67 -2.135 3.202 5.971 2.953 0 5 SGP, BRN .34 5.867 1.712 2.439 2.289 2 6 KHM, MMR .43 -1.097 15.640 2.039 8.425 0 7 CHN, TWN, VNM, AUS .70 -2.384 2.331 1.553 1.622 0
Post-crisis All Cases .36 -.553 3.485 1.498 4.788
1 SGP, MAC, BRN .85 6.272 2.462 .871 1.499 2 2 LAO, MMR -.10 -2.243 14.922 1.326 16.309 0 3 KOR, IDN, AUS, NZL, CAN .40 .654 1.967 2.847 4.223 1 4 TWN, KHM, PHL, THA, IND, JPN .04 -3.268 2.083 1.471 4.826 0 5 CHN, HKG, MYS, VNM .65 -2.265 2.536 .408 2.145 1
Note: 1 Positive value indicates surplus. 2 Standard deviation (x102) of the log difference in bilateral nominal exchange rate. 3 Number of variables with highest degree of conformity to Maastricht Treaty. Source: Fuzzy cluster analysis. See Appendix A for data description.
Currency Basket Anchor Results
Table 7.17 reports the solutions by weighted-G3 reference. Except for a few cases, the
membership coefficients are substantially large for belonging to only one group. 8, 4,
and 5 clusters are present for the respective periods. Reduction in the number of clusters
may indicate increased degree of symmetry against the weighted group of US, Japan,

Optimal Currency Areas in East Asia
362
and Germany/EMU (with respective weights of 0.47, 0.23, and 0.30 for this study). The
average silhouettes for all objects signify that the post-crisis cases with silhouette 0.40
are most appropriately classified.
The most tightly classified cluster for the pre-crisis period is Malaysia-Canada at
silhouette 0.94, as shown by its silhouette and membership coefficients. It demonstrates
the most convergent inflation and interest rate to the G3 levels. The third group and
Myanmar enjoy one most compliant condition each.
Table 7.17 Maastricht-FCM-basket clusters
Membership coefficients (%) Pre-crisis Crisis Post-crisis
I II III IV V VI VII VIII I II III IV I II III IV V
1 CHN 7.90 6.93 11.40 1.70 11.25 12.51 17.65 30.66 .47 10.24 5.78 83.52 1.45 .42 1.42 4.10 92.61 2 HKG 1.25 .90 79.67 .24 1.38 12.47 2.46 1.62 .56 7.95 78.88 12.61 3.66 .96 2.92 7.83 84.62 3 KOR 2.55 1.79 53.18 .37 2.15 27.96 8.12 3.89 .79 80.42 6.00 12.79 15.00 2.54 42.17 16.01 24.28 4 TWN 3.53 2.79 44.88 .60 2.86 23.07 16.76 5.52 .40 12.36 6.62 80.62 2.45 1.20 4.85 35.18 56.32 5 KHM .34 98.76 .12 .05 .14 .16 .13 .31 2.95 42.47 16.49 38.08 8.09 13.82 11.41 42.72 23.96 6 IDN 98.36 .32 .15 .03 .32 .26 .13 .43 40.20 26.04 16.02 17.74 9.45 14.95 40.81 21.51 13.29 7 LAO 15.35 17.63 6.51 11.81 15.39 7.66 8.37 17.28 97.46 .99 .70 .84 .39 97.54 .59 .90 .58 8 MYS .51 .45 1.19 .09 .37 1.13 95.00 1.26 .51 65.04 5.64 28.81 4.15 2.36 6.83 31.03 55.62 9 MMR .54 .21 .25 .07 97.98 .34 .17 .44 5.97 34.39 25.35 34.29 16.32 25.05 16.36 22.53 19.74
10 PHL 17.51 6.45 6.89 1.01 25.58 11.47 5.43 25.66 .55 68.92 4.08 26.44 1.76 1.30 7.01 78.04 11.90 11 SGP 7.35 5.39 36.49 1.68 6.81 27.75 8.08 6.45 3.93 16.99 62.38 16.70 92.82 .51 2.04 1.63 3.00 12 THA 4.54 2.38 17.43 .37 2.52 63.48 4.86 4.43 .50 83.07 3.58 12.85 4.20 1.03 6.06 11.67 77.04 13 VNM .01 .02 .01 99.92 .01 .01 .01 .01 .30 8.97 2.41 88.32 4.63 3.30 6.05 46.94 39.08 14 IND 1.25 .79 .48 .09 .66 .67 1.00 95.06 2.37 30.46 9.26 57.91 1.36 1.55 3.88 84.92 8.29 15 MAC .46 .31 88.90 .07 .45 8.54 .74 .53 .66 10.38 71.22 17.74 93.53 .65 1.79 1.54 2.49 16 BRN 2.54 1.17 10.47 .21 1.98 79.79 1.74 2.10 .79 6.24 86.60 6.38 97.44 .23 .79 0.59 .95 17 AUS .52 .38 87.53 .08 .46 9.44 .94 .63 .33 13.58 5.08 81.01 2.65 1.55 80.14 9.59 6.06 18 NZL 1.19 .71 19.49 .14 1.08 74.61 1.42 1.36 .29 4.68 90.27 4.76 10.21 4.18 66.31 10.34 8.95 19 CAN .80 .77 1.49 .17 .63 1.42 92.49 2.22 .50 7.81 80.51 11.19 5.01 1.44 75.97 8.62 8.96
Maastricht Features Averages Cluster SW DEF (%)1 INF (%) NER2 INT (%) N3
Pre-crisis
All Cases .18 -1.747 6.694 4.595 5.271 1 IDN .00 -1.563 5.516 2.659 11.585 0 2 KHM, LAO -.36 -6.966 9.898 10.188 13.219 0 3 HKG, KOR, TWN, SGP, MAC, AUS -.10 1.441 3.385 2.351 1.641 1 4 VNM .00 -5.860 24.510 25.481 8.544 0 5 MMR .00 -.640 14.949 1.836 8.800 1 6 THA, BRN, NZL .70 .729 4.181 2.257 4.348 0 7 MYS, CAN .94 -5.312 1.871 2.275 1.548 2 8 CHN, PHL, IND .24 -3.799 8.605 3.842 5.959 0
Crisis All Cases .36 -1.747 6.694 4.595 5.271
1 IDN, LAO .30 -6.014 11.018 5.921 13.796 0 2 KOR, KHM, MYS, MMR, PHL, THA -.04 -1.871 5.850 3.797 5.915 0 3 HKG, SGP, MAC, BRN, NZL, CAN .55 .867 3.991 2.270 1.897 4 4 CHN, TWN, VNM, IND, AUS .65 -3.026 9.220 7.813 4.463 0
Post-crisis All Cases .40 -.211 3.906 2.048 4.544
1 SGP, MAC, BRN .94 6.272 2.134 1.555 .970 3 2 LAO, MMR -.24 -2.243 15.855 1.733 16.236 0 3 KOR, IDN, AUS, NZL, CAN .25 .654 2.652 3.000 3.962 0 4 KHM, PHL, VNM, IND .19 -3.006 3.506 1.872 6.377 0 5 CHN, HKG, TWN, MYS, THA .65 -1.918 1.764 1.657 1.127 1
Note: 1 Positive value indicates surplus. 2 Standard deviation (x102) of the log difference in bilateral nominal exchange rate. 3 Number of variables with highest degree of conformity to Maastricht Treaty. Source: Fuzzy cluster analysis. See Appendix A for data description.

A Clustering Approach
363
The pre-crisis subclusters of HongKong-Singapore-Macau and Brunei-NewZealand
keep their linkages in the crisis period arrangement. Merged by Canada, they share high
group silhouette and all four most Maastricht-conforming conditions.
For post-crisis period, Singapore, Macau, and Brunei carry on their crisis period
grouping and constitute the best classified and most feasible group for currency union
which boasts silhouette 0.94 and 3 most supportive attributes. Singapore and Macau
have retained their tie since the pre-crisis period.
Yen Anchor Results
The Japan-based solutions are collected in Table 7.18. The numbers of clusters for pre-
crisis, crisis, and post-crisis periods are 7, 6, and 3 respectively. The remarkably fewer
groupings in the post-crisis solution may indicate increased regional symmetry against
Japan in that period. Signified by the average silhouettes for all objects, the post-crisis
economies with average silhouette 0.45 are more appropriately clustered.
The most tightly linked cluster for the pre-crisis period is the Thailand-Brunei-
NewZealand trio with 0.81 group silhouette and high membership coefficients. An
equally well-classified cluster is Malaysia-Canada which boasts the highest degree of
inflation convergence, exchange rate stability, and interest rate symmetry with Japan.
The HongKong-Singapore-Macau and Brunei-NewZealand subclusters from the
pre-crisis period plus Canada get together and share 2 best features in the crisis period
setting. The most tightly linked China-Taiwan-Australia cluster and unconnected
Myanmar each display one best characteristic.
Singapore, Macau, and Brunei continue their crisis period linkage and in
combination with Korea, they make up the best classified group for the post-crisis
period with 0.69 group silhouette. They also share 3 most compliant conditions. Indeed,
Singapore and Macau have been placed together since the pre-crisis findings. Hence,
they might have been constantly sharing parallel features against Japan.
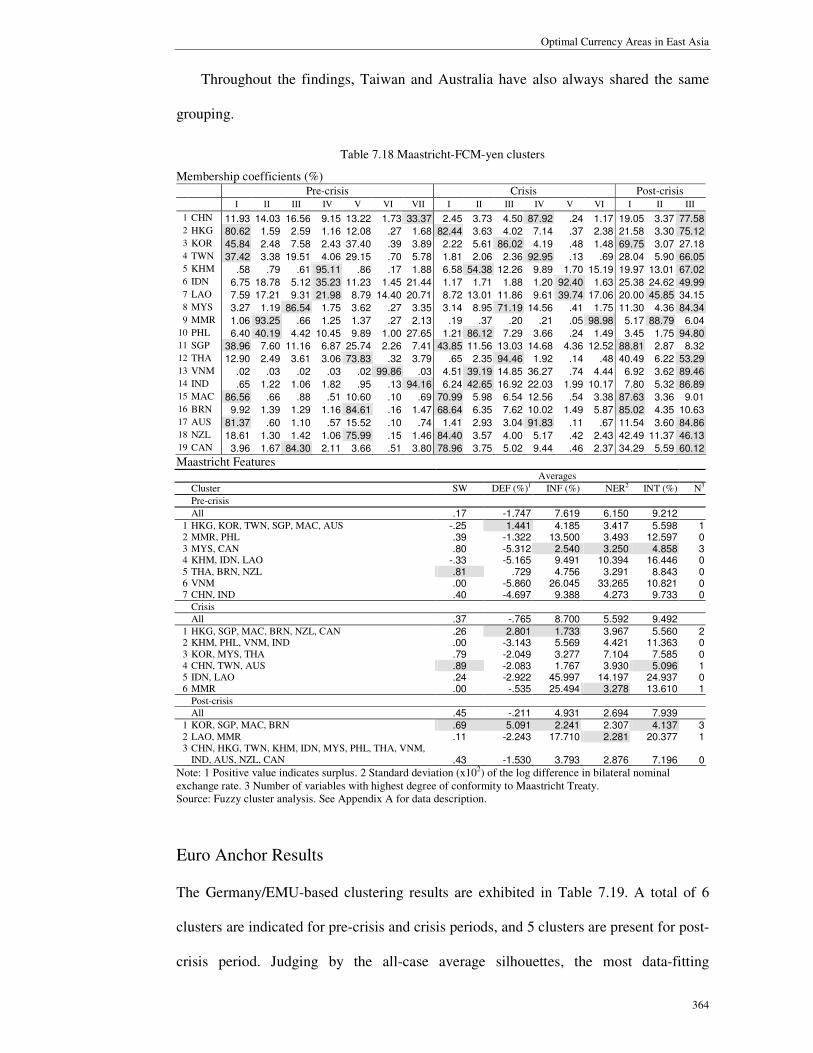
Optimal Currency Areas in East Asia
364
Throughout the findings, Taiwan and Australia have also always shared the same
grouping.
Table 7.18 Maastricht-FCM-yen clusters
Membership coefficients (%) Pre-crisis Crisis Post-crisis I II III IV V VI VII I II III IV V VI I II III
1 CHN 11.93 14.03 16.56 9.15 13.22 1.73 33.37 2.45 3.73 4.50 87.92 .24 1.17 19.05 3.37 77.58 2 HKG 80.62 1.59 2.59 1.16 12.08 .27 1.68 82.44 3.63 4.02 7.14 .37 2.38 21.58 3.30 75.12 3 KOR 45.84 2.48 7.58 2.43 37.40 .39 3.89 2.22 5.61 86.02 4.19 .48 1.48 69.75 3.07 27.18 4 TWN 37.42 3.38 19.51 4.06 29.15 .70 5.78 1.81 2.06 2.36 92.95 .13 .69 28.04 5.90 66.05 5 KHM .58 .79 .61 95.11 .86 .17 1.88 6.58 54.38 12.26 9.89 1.70 15.19 19.97 13.01 67.02 6 IDN 6.75 18.78 5.12 35.23 11.23 1.45 21.44 1.17 1.71 1.88 1.20 92.40 1.63 25.38 24.62 49.99 7 LAO 7.59 17.21 9.31 21.98 8.79 14.40 20.71 8.72 13.01 11.86 9.61 39.74 17.06 20.00 45.85 34.15 8 MYS 3.27 1.19 86.54 1.75 3.62 .27 3.35 3.14 8.95 71.19 14.56 .41 1.75 11.30 4.36 84.34 9 MMR 1.06 93.25 .66 1.25 1.37 .27 2.13 .19 .37 .20 .21 .05 98.98 5.17 88.79 6.04
10 PHL 6.40 40.19 4.42 10.45 9.89 1.00 27.65 1.21 86.12 7.29 3.66 .24 1.49 3.45 1.75 94.80 11 SGP 38.96 7.60 11.16 6.87 25.74 2.26 7.41 43.85 11.56 13.03 14.68 4.36 12.52 88.81 2.87 8.32 12 THA 12.90 2.49 3.61 3.06 73.83 .32 3.79 .65 2.35 94.46 1.92 .14 .48 40.49 6.22 53.29 13 VNM .02 .03 .02 .03 .02 99.86 .03 4.51 39.19 14.85 36.27 .74 4.44 6.92 3.62 89.46 14 IND .65 1.22 1.06 1.82 .95 .13 94.16 6.24 42.65 16.92 22.03 1.99 10.17 7.80 5.32 86.89 15 MAC 86.56 .66 .88 .51 10.60 .10 .69 70.99 5.98 6.54 12.56 .54 3.38 87.63 3.36 9.01 16 BRN 9.92 1.39 1.29 1.16 84.61 .16 1.47 68.64 6.35 7.62 10.02 1.49 5.87 85.02 4.35 10.63 17 AUS 81.37 .60 1.10 .57 15.52 .10 .74 1.41 2.93 3.04 91.83 .11 .67 11.54 3.60 84.86 18 NZL 18.61 1.30 1.42 1.06 75.99 .15 1.46 84.40 3.57 4.00 5.17 .42 2.43 42.49 11.37 46.13 19 CAN 3.96 1.67 84.30 2.11 3.66 .51 3.80 78.96 3.75 5.02 9.44 .46 2.37 34.29 5.59 60.12
Maastricht Features Averages
Cluster SW DEF (%)1 INF (%) NER2 INT (%) N3
Pre-crisis
All .17 -1.747 7.619 6.150 9.212 1 HKG, KOR, TWN, SGP, MAC, AUS -.25 1.441 4.185 3.417 5.598 1 2 MMR, PHL .39 -1.322 13.500 3.493 12.597 0 3 MYS, CAN .80 -5.312 2.540 3.250 4.858 3 4 KHM, IDN, LAO -.33 -5.165 9.491 10.394 16.446 0 5 THA, BRN, NZL .81 .729 4.756 3.291 8.843 0 6 VNM .00 -5.860 26.045 33.265 10.821 0 7 CHN, IND .40 -4.697 9.388 4.273 9.733 0
Crisis All .37 -.765 8.700 5.592 9.492
1 HKG, SGP, MAC, BRN, NZL, CAN .26 2.801 1.733 3.967 5.560 2 2 KHM, PHL, VNM, IND .00 -3.143 5.569 4.421 11.363 0 3 KOR, MYS, THA .79 -2.049 3.277 7.104 7.585 0 4 CHN, TWN, AUS .89 -2.083 1.767 3.930 5.096 1 5 IDN, LAO .24 -2.922 45.997 14.197 24.937 0 6 MMR .00 -.535 25.494 3.278 13.610 1
Post-crisis All .45 -.211 4.931 2.694 7.939
1 KOR, SGP, MAC, BRN .69 5.091 2.241 2.307 4.137 3 2 LAO, MMR .11 -2.243 17.710 2.281 20.377 1 3 CHN, HKG, TWN, KHM, IDN, MYS, PHL, THA, VNM,
IND, AUS, NZL, CAN .43 -1.530 3.793 2.876 7.196 0
Note: 1 Positive value indicates surplus. 2 Standard deviation (x102) of the log difference in bilateral nominal exchange rate. 3 Number of variables with highest degree of conformity to Maastricht Treaty. Source: Fuzzy cluster analysis. See Appendix A for data description.
Euro Anchor Results
The Germany/EMU-based clustering results are exhibited in Table 7.19. A total of 6
clusters are indicated for pre-crisis and crisis periods, and 5 clusters are present for post-
crisis period. Judging by the all-case average silhouettes, the most data-fitting

A Clustering Approach
365
partitioning is from the pre-crisis solution with average silhouette 0.55.
In the pre-crisis solution, the fourth group of nine economies which is the largest
cluster obtains the highest silhouette at 0.68, a positive budget balance, and the highest
degree of interest rate symmetry with Germany. The second and the third cluster each
exhibit one best condition.
Table 7.19 Maastricht-FCM-euro clusters
Membership coefficients (%) Pre-crisis Crisis Post-crisis I II III IV V VI I II III IV V VI I II III IV V
1 CHN 33.35 10.26 31.52 19.82 2.83 2.22 3.21 6.77 2.55 87.02 .27 .19 20.32 1.17 31.00 43.51 4.00 2 HKG 2.51 2.29 4.19 90.48 .29 .24 85.36 2.16 3.87 7.96 .39 .26 22.43 1.23 25.95 45.55 4.84 3 KOR 8.11 4.56 6.19 80.28 .49 .37 14.28 14.69 10.50 57.63 1.87 1.02 84.99 .54 4.95 6.08 3.44 4 TWN 17.34 7.89 8.61 64.46 .97 .74 3.92 3.92 2.23 89.55 .23 .16 3.01 .60 91.01 4.27 1.10 5 KHM 15.72 52.62 14.33 9.64 5.08 2.62 12.99 24.38 30.53 28.56 2.05 1.49 3.11 .81 90.83 4.11 1.15 6 IDN 4.40 81.95 8.10 3.72 1.23 .61 .00 .00 .00 .00 99.99 .00 29.54 11.94 22.11 25.49 10.91 7 LAO .00 .00 .00 .00 99.98 .01 .00 .00 .00 .00 .00 100.0 .26 98.82 .44 .27 .21 8 MYS 74.16 6.50 6.69 10.83 1.09 .73 2.71 3.23 1.76 91.93 .22 .14 10.33 1.59 26.21 58.65 3.23 9 MMR 9.05 13.15 61.24 10.87 3.45 2.23 1.18 1.04 95.93 1.44 .21 .20 17.81 18.86 21.84 20.59 20.91
10 PHL 1.59 1.75 94.78 1.53 .21 .14 3.27 7.83 3.77 84.57 .33 .23 9.49 .85 7.58 80.08 1.99 11 SGP 12.72 20.79 17.32 43.10 3.29 2.78 48.67 9.35 17.85 16.10 4.91 3.11 2.60 .49 1.86 1.56 93.50 12 THA 6.44 5.18 5.29 82.24 .48 .36 6.52 12.12 5.72 74.30 .84 .51 22.02 2.52 30.29 30.47 14.69 13 VNM .00 .00 .00 .00 .00 100.0 4.67 16.66 4.51 73.26 .52 .38 8.73 .88 12.42 75.60 2.38 14 IND 59.85 12.13 17.85 7.41 1.80 .96 3.15 74.99 4.53 16.14 .66 .53 8.00 1.11 11.29 77.57 2.03 15 MAC 2.45 2.05 2.83 92.14 .29 .24 82.15 2.56 4.17 10.44 .41 .28 18.85 2.30 7.60 7.95 63.30 16 BRN 9.09 17.06 17.65 54.14 1.19 .87 71.45 4.86 10.50 10.48 1.66 1.05 2.26 .48 1.50 1.32 94.44 17 JPN 9.26 72.81 7.86 8.21 1.19 .67 2.62 83.31 3.96 8.54 .90 .68 12.42 8.14 48.21 25.60 5.63 18 AUS 3.46 2.49 3.87 89.49 .38 .32 12.18 9.82 6.13 70.66 .70 .50 31.02 1.39 11.46 51.14 4.99 19 NZL 3.14 2.57 5.14 88.53 .34 .28 93.32 1.10 1.79 3.43 .22 .15 65.50 1.93 8.92 12.68 10.97 20 CAN 89.97 3.42 3.09 2.64 .56 .32 87.40 1.95 3.30 6.80 .33 .22 79.99 .93 7.62 8.48 2.98
Maastricht Features Averages
Cluster SW DEF (%)1 INF (%) NER2 INT (%) N3
Pre-crisis
All Cases .55 -1.726 6.479 5.968 4.461 1 CHN, MYS, IND, CAN .49 -5.005 5.107 3.733 2.711 0 2 KHM, IDN, JPN .58 -2.123 3.417 6.312 8.182 1 3 MMR, PHL .61 -1.322 12.480 3.324 5.381 1 4 HKG, KOR, TWN, SGP, THA, MAC, BRN, AUS, NZL .68 1.203 3.707 3.429 2.089 2 5 LAO .00 -10.466 16.624 14.877 13.926 0 6 VNM .00 -5.860 23.962 33.098 7.968 0
Crisis All Cases .50 -1.027 8.011 10.845 4.682
1 HKG, SGP, MAC, BRN, NZL, CAN .42 2.801 1.659 9.822 2.225 4 2 IND, JPN .48 -5.615 3.632 10.028 5.253 0 3 KHM, MMR .23 -1.097 15.897 9.917 7.274 0 4 CHN, KOR, TWN, MYS, PHL, THA, VNM, AUS .76 -2.260 2.583 10.472 2.475 0 5 IDN .00 -1.199 22.092 19.715 14.981 0 6 LAO .00 -4.645 68.446 14.578 20.466 0
Post-crisis All Cases .30 -0.553 3.645 2.504 4.692
1 KOR, IDN, NZL, CAN -.08 1.123 2.724 3.072 3.987 0 2 LAO .00 -3.641 7.239 2.563 19.295 0 3 TWN, KHM, MMR, JPN -.54 -3.062 7.582 2.181 7.014 1 4 CHN, HKG, MYS, PHL, THA, VNM, IND, AUS .75 -2.311 2.375 2.523 2.471 1 5 SGP, MAC, BRN .33 1.680 2.051 2.301 4.826 2
Note: 1 Positive value indicates surplus. 2 Standard deviation (x102) of the log difference in bilateral nominal exchange rate. 3 Number of variables with highest degree of conformity to Maastricht Treaty. Source: Fuzzy cluster analysis. See Appendix A for data description.

Optimal Currency Areas in East Asia
366
Canada and a pre-crisis subcluster of five countries constitute group one for the
crisis period, the most prospective cluster which is most compliant in all the conditions.
Meantime, the best classified group is the fourth group in which most of its constituents
maintain their previous linkages.
The silhouettes signify that the most tightly formed group in the post-crisis
arrangement is the fourth group consisting of 8 countries with silhouette 0.75.
Nevertheless, the Singapore-Macau-Brunei trio is the group which maintains more
compliant attributes, the highest budget surplus and the most convergent inflation
toward the German level. Singapore, Brunei, and Macau share the same grouping since
the pre-crisis period.
Looking at the structure of the partitions, the configurations are largely stable over periods.
Yuan Anchor Results
The China-based solutions are put in Table 7.20. The partitions are generally clear-cut.
5, 6, and 5 clusters are respectively indicated for the three periods. Based on the all-case
silhouettes, the crisis period partitioning with average silhouette 0.54 is the most data-
fitting.
The pre-crisis results show that the largest group of 7 economies obtains the highest
silhouette 0.83 and 2 best features: the least variable yuan rate and the most similar
interest rate to the Chinese rate. The third and the fifth group obtain one best attribute
each.
Singapore and Brunei not only hold on to their previous linkage but also share 3
most conforming features for the crisis period. The fourth cluster of which most of its
members have been linked previously records the highest silhouette and the stablest
yuan rate.

A Clustering Approach
367
Table 7.20 Maastricht-FCM-yuan clusters
Membership coefficients (%) Pre-crisis Crisis Post-crisis
I II III IV V I II III IV V VI I II III IV V
1 HKG 79.99 .70 6.76 3.31 9.23 1.90 1.97 1.82 92.50 .23 1.58 15.81 3.64 15.25 4.91 60.39 2 KOR 86.71 .36 5.82 1.82 5.29 1.98 81.34 6.69 5.00 1.26 3.72 4.90 0.75 87.24 2.54 4.57 3 TWN 76.51 .60 10.24 3.09 9.55 4.56 25.54 26.55 34.95 1.29 7.11 2.76 1.04 7.46 1.84 86.90 4 KHM .24 .17 0.44 98.65 .50 4.49 18.86 26.68 14.21 2.96 32.80 10.93 17.38 14.74 10.39 46.56 5 IDN 16.96 4.16 24.70 29.20 24.98 1.55 3.07 2.24 1.84 88.33 2.97 0.74 1.04 2.12 94.90 1.20 6 LAO 1.19 91.57 1.89 3.60 1.75 6.91 11.39 11.19 8.64 44.51 17.36 0.37 97.69 0.49 0.76 0.69 7 MYS 14.69 1.32 70.13 5.76 8.09 .75 89.79 4.63 3.01 .33 1.48 7.04 3.24 11.32 4.38 74.02 8 MMR 5.94 .92 5.40 6.99 80.75 .27 .62 .71 .66 .17 97.56 14.96 24.73 17.21 23.35 19.75 9 PHL 27.25 1.32 41.70 9.90 19.83 2.22 50.81 28.07 8.37 1.40 9.13 3.51 2.08 13.69 4.58 76.14
10 SGP 32.93 3.29 11.45 12.34 40.00 94.83 .99 .70 2.30 .31 0.88 91.90 0.56 4.10 1.04 2.40 11 THA 96.62 .10 1.28 .49 1.52 .58 92.93 3.19 1.70 .36 1.23 10.53 2.18 43.57 5.06 38.67 12 VNM 11.49 39.30 13.12 21.49 14.60 1.18 8.74 79.74 5.96 .55 3.84 6.32 3.86 8.34 3.96 77.53 13 IND 4.55 .73 87.34 3.83 3.55 1.07 6.38 83.70 3.60 .76 4.48 3.68 3.48 10.01 5.30 77.53 14 MAC 90.74 .33 2.77 1.45 4.71 1.78 2.16 2.08 92.16 .24 1.58 85.71 1.62 5.49 2.23 4.95 15 BRN 6.51 .42 2.52 2.51 88.03 56.32 6.44 4.13 27.40 1.15 4.57 95.28 0.40 2.26 0.73 1.34 16 JPN 9.80 2.49 13.50 30.51 43.69 2.24 20.56 62.72 6.56 1.80 6.12 7.82 8.26 27.69 23.74 32.50 17 AUS 91.43 .31 2.85 1.38 4.03 3.30 39.96 27.17 22.02 1.11 6.44 5.62 2.96 57.91 22.59 10.91 18 NZL 71.50 .93 7.64 4.20 15.73 10.55 13.97 6.96 60.34 1.29 6.90 13.03 5.15 40.55 30.58 10.69 19 CAN 4.30 1.01 85.13 5.08 4.48 1.97 2.31 1.61 92.66 .22 1.23 1.05 0.23 96.49 0.90 1.33
Maastricht Features Averages
Cluster SW DEF (%)1 INF (%) NER2 INT (%) N3
Pre-crisis
All Cases .47 -1.600 10.600 6.784 4.565
1 HKG, KOR, TWN, THA, MAC, AUS, NZL .83 .465 8.850 4.243 1.775 2
2 LAO, VNM .20 -8.163 19.939 23.956 10.546 0
3 MYS, PHL, IND, CAN .54 -4.473 8.796 4.275 3.594 1
4 KHM, IDN .18 -2.515 9.121 8.561 8.169 0
5 MMR, SGP, BRN, JPN -.01 1.399 11.539 4.267 5.982 1
Crisis
All Cases .54 -.949 8.971 4.070 5.635
1 SGP, BRN .54 5.867 1.172 2.438 .509 3
2 KOR, MYS, PHL, THA, AUS .60 -2.091 3.835 5.367 3.792 0
3 VNM, IND, JPN .55 -4.840 4.279 2.163 4.957 0
4 HKG, TWN, MAC, NZL, CAN .61 .649 2.127 1.386 2.062 1
5 IDN, LAO, .28 -2.922 46.240 14.060 20.700 0
6 KHM, MMR .45 -1.097 16.485 2.042 10.250 0
Post-crisis
All Cases .43 -.508 4.061 1.609 4.800
1 SGP, MAC, BRN .91 6.272 1.889 .946 .725 3
2 LAO, MMR, -.15 -2.243 15.563 1.315 16.488 0
3 KOR, THA, JPN, AUS, NZL, CAN .12 -.516 2.198 2.486 2.521 0
4 IDN .00 -1.330 7.336 3.680 9.854 0
5 HKG, TWN, KHM, MYS, PHL, VNM, IND .65 -2.795 2.836 .929 4.440 1
Note: 1 Positive value indicates surplus. 2 Standard deviation (x102) of the log difference in bilateral nominal exchange rate. 3 Number of variables with highest degree of conformity to Maastricht Treaty. Source: Fuzzy cluster analysis. See Appendix A for data description.
Singapore and Brunei which have been linked since the pre-crisis period plus
Macau constitute the most tightly linked cluster that attains group silhouette 0.91 and 3
best features in the post-crisis setting. They also share highly stable nominal renminbi
rate. Meanwhile, the fifth group of 7 economies enjoys the stablest nominal yuan rate.
Other cross-period subclusters are Korea-Thailand-Australia, HongKong-Taiwan,
and Malaysia-Philippines. Based on the size of the clusters, the post-crisis configuration
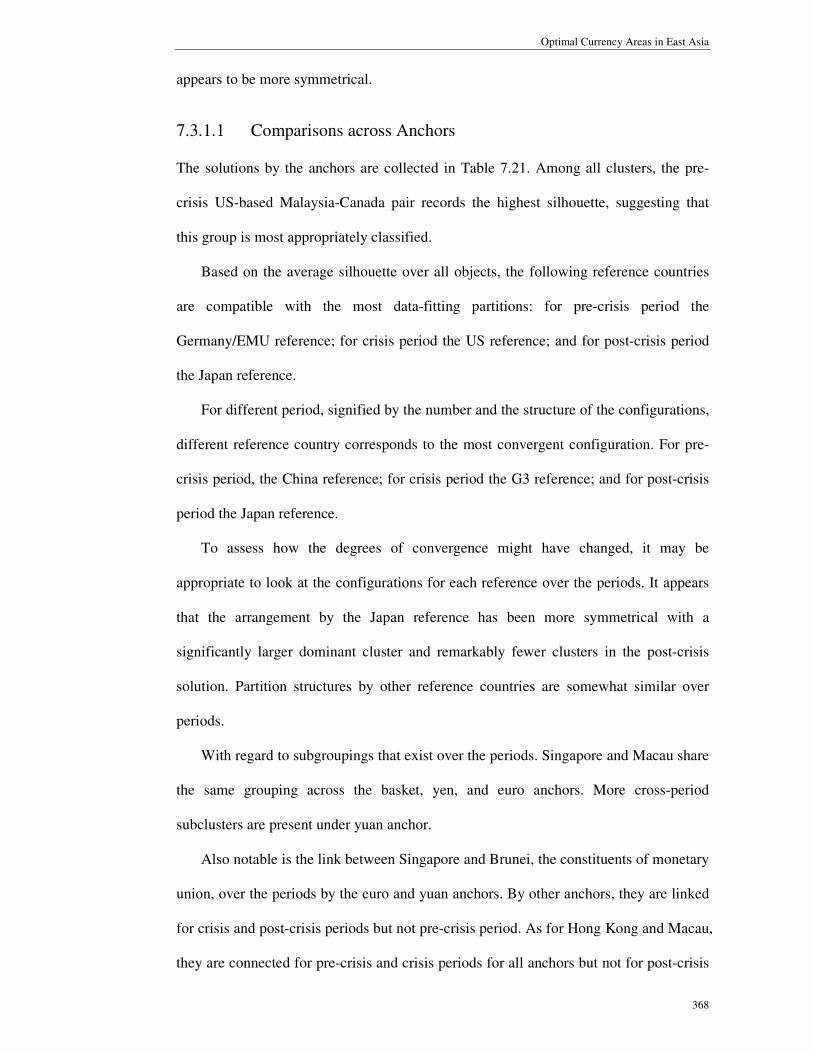
Optimal Currency Areas in East Asia
368
appears to be more symmetrical.
7.3.1.1 Comparisons across Anchors
The solutions by the anchors are collected in Table 7.21. Among all clusters, the pre-
crisis US-based Malaysia-Canada pair records the highest silhouette, suggesting that
this group is most appropriately classified.
Based on the average silhouette over all objects, the following reference countries
are compatible with the most data-fitting partitions: for pre-crisis period the
Germany/EMU reference; for crisis period the US reference; and for post-crisis period
the Japan reference.
For different period, signified by the number and the structure of the configurations,
different reference country corresponds to the most convergent configuration. For pre-
crisis period, the China reference; for crisis period the G3 reference; and for post-crisis
period the Japan reference.
To assess how the degrees of convergence might have changed, it may be
appropriate to look at the configurations for each reference over the periods. It appears
that the arrangement by the Japan reference has been more symmetrical with a
significantly larger dominant cluster and remarkably fewer clusters in the post-crisis
solution. Partition structures by other reference countries are somewhat similar over
periods.
With regard to subgroupings that exist over the periods. Singapore and Macau share
the same grouping across the basket, yen, and euro anchors. More cross-period
subclusters are present under yuan anchor.
Also notable is the link between Singapore and Brunei, the constituents of monetary
union, over the periods by the euro and yuan anchors. By other anchors, they are linked
for crisis and post-crisis periods but not pre-crisis period. As for Hong Kong and Macau,
they are connected for pre-crisis and crisis periods for all anchors but not for post-crisis
A Clustering Approach
369
period. Hence, Hong Kong and Macau do not consistently share the same grouping by
any anchor.
The bottom part of Table 7.21 shows some post-crisis features. The post-crisis
findings show that Singapore, Macau, and Brunei contribute to the highest group
silhouettes for all anchors except for euro. They also possess high belongingness to their
grouping for all anchors in the post-crisis setting. With respect to countries which have
highly fuzzy belongingness to more than one group, none of them are present under
basket and yen anchors.
Cross-anchor subgroups are listed in Table 7.22. As mentioned above, Singapore-
Macau is consistently robust across basket, yen, and euro anchors over the periods.
Singapore and Macau could have jointly shared similar Maastricht features with
reference to weighted-G3, Japan, and Germany/EMU through the periods.
For the post-crisis period, the most recent period, Singapore-Macau-Brunei and
NewZealand-Canada are stable across all anchors.

Optimal Currency Areas in East Asia
370
Table 7.21 Maastricht-FCM summary
Dollar SW Currency Basket SW Yen SW Euro SW Yuan SW
1 HKG, KOR, TWN, SGP, MAC, AUS
.11 HKG, KOR, TWN, SGP, MAC, AUS
-.10 HKG, KOR, TWN, SGP, MAC, AUS
-.25 HKG, KOR, TWN, SGP, THA, MAC, BRN, AUS, NZL
.68 HKG, KOR, TWN, THA, MAC, AUS, NZL
.83
2 THA, BRN, JPN, NZL
.54 THA, BRN, NZL .70 THA, BRN, NZL .81 CHN, MYS, IND, CAN
.49 MMR, SGP, BRN, JPN
-.01
3 IDN, MMR, PHL .26 CHN, PHL, IND .24 KHM, IDN, LAO -.33 KHM, IDN, JPN .58 MYS, PHL, IND, CAN
.54
4 CHN, KHM, IND -.14 KHM, LAO -.36 MYS, CAN .80 MMR, PHL .61 KHM, IDN .18
5 MYS, CAN .95 MYS, CAN .94 MMR, PHL .39 LAO .00 LAO, VNM .20
6 VNM .00 MMR .00 CHN, IND .40 VNM .00
7 LAO .00 VNM .00 VNM .00
Pre-crisis
8 IDN .00
Average .25 .18 .17 .55 .47
1 HKG, MAC, NZL, CAN
.77 KOR, KHM, MYS, MMR, PHL, THA
-.04 HKG, SGP, MAC, BRN, NZL, CAN
.26 CHN, KOR, TWN, MYS, PHL, THA, VNM, AUS
.76 HKG, TWN, MAC, NZL, CAN
.61
2 CHN, TWN, VNM, AUS
.70 HKG, SGP, MAC, BRN, NZL, CAN
.55 KHM, PHL, VNM, IND
.00 HKG, SGP, MAC, BRN, NZL, CAN
.42 KOR, MYS, PHL, THA, AUS
.69
3 KOR, MYS, PHL, THA
.67 CHN, TWN, VNM, IND, AUS
.65 KOR, MYS, THA .79 KHM, MMR .23 VNM, IND, JPN .55
4 SGP, BRN .34 IDN, LAO .30 CHN, TWN, AUS .89 IND, JPN .48 SGP, BRN .54
5 KHM, MMR .43 IDN, LAO .24 IDN .00 IDN, LAO, .28
6 IND, JPN .61 MMR .00 LAO .00 KHM, MMR .45
Crisis
7 IDN, LAO .29
Average .60 .36 .37 .50 .54
1 TWN, KHM, PHL, THA, IND, JPN
.04 CHN, HKG, TWN, MYS, THA
.65 CHN, HKG, TWN, KHM, IDN, MYS, PHL, THA, VNM, IND, AUS, NZL, CAN
.43 CHN, HKG, MYS, PHL, THA, VNM, IND, AUS
.75 HKG, TWN, KHM, MYS, PHL, VNM, IND
.65
2 KOR, IDN, AUS, NZL, CAN
.40 KOR, IDN, AUS, NZL, CAN
.25 KOR, SGP, MAC, BRN
.69 TWN, KHM, MMR, JPN
-.54 KOR, THA, JPN, AUS, NZL, CAN
.12
3 CHN, HKG, MYS, VNM
.65 KHM, PHL, VNM, IND
.19 LAO, MMR .11 KOR, IDN, NZL, CAN
-.08 SGP, MAC, BRN .91
4 SGP, MAC, BRN .85 SGP, MAC, BRN .94 SGP, MAC, BRN .33 LAO, MMR, -.15
Post-crisis
5 LAO, MMR -.10 LAO, MMR -.24 LAO .00 IDN .00
Average .36 .40 .45 .30 .41
1 - SGP, MAC TWN, AUS SGP, MAC, BRN KOR, THA, AUS
2 SGP, MAC CHN, MYS HKG, TWN
3 MYS, PHL
All Periods
SGP, BRN
Post-crisis Findings
1 Highest silhouette SGP-MAC-BRN SGP-MAC-BRN KOR-SGP-MAC-BRN
CHN-HKG-MYS-PHL-THA-VNM-IND-AUS
SGP-MAC-BRN
2 Closely linked subclusters shown by membership coefficients > 50%
SGP-MAC-BRN, KOR-AUS-NZL-CAN, TWN-PHL-IND, CHN-HKG-MYS-VNM,
SGP-MAC-BRN, AUS-NZL-CAN, PHL-IND, CHN-HKG-TWN-MYS-THA
KOR-SGP-MAC-BRN, CHN-HKG-TWN-KHM-MYS-PHL-THA-VNM-IND-AUS-CAN
KOR-NZL-CAN, TWN-KHM, MYS-PHL-VNM-IND-AUS, SGP-MAC-BRN
SGP-MAC-BRN, KOR-AUS-CAN; HKG-TWN-MYS-PHL-VNM-IND
3 High belongingness to more than one group (< 2 % difference in membership)
KHM - - MMR, THA MMR

A Clustering Approach
371
Table 7.22 Maastricht-FCM cross-anchor subclusters
PRE CRS PST All PRE CRS PST All
1 HKG, KOR, TWN, SGP, MAC, AUS
HKG, MAC, NZL, CAN
KOR, IDN, AUS, NZL, CAN
KOR, AUS
HKG, KOR, TWN, SGP, MAC
HKG, MAC, NZL, CAN
TWN, KHM, PHL, THA, IND
-
2 THA, BRN, NZL KOR, MYS, PHL, THA
CHN, HKG, MYS THA, BRN, NZL CHN, TWN, AUS CHN, HKG, MYS, VNM
3 MYS, CAN CHN, TWN, VNM, AUS
SGP, MAC, BRN MYS, CAN KOR, MYS, THA IDN, AUS, NZL, CAN
4 CHN, IND SGP, BRN KHM, PHL, IND CHN, IND SGP, BRN SGP, MAC, BRN
5 KHM, MMR LAO, MMR MMR, PHL IDN, LAO LAO, MMR
DB
6 IDN, LAO
DY
1 HKG, KOR, TWN, SGP, MAC, AUS
HKG, MAC, NZL, CAN
CHN, HKG, MYS, VNM
- HKG, KOR, TWN, MAC, AUS
HKG, MAC, NZL, CAN
TWN, KHM, PHL, IND
-
2 THA, BRN, NZL CHN, TWN, VNM, AUS
SGP, MAC, BRN MYS, CAN KOR, MYS, PHL, THA
KOR, AUS, NZL, CAN
3 MYS, CAN KOR, MYS, PHL, THA
TWN, KHM, JPN THA, NZL IDN, LAO HKG, MYS, VNM
4 MMR, PHL SGP, BRN PHL, THA, IND BRN, JPN IND, JPN SGP, MAC, BRN
5 IND, JPN KOR, IDN SGP, BRN THA, JPN
DE
6 KHM, MMR NZL, CAN
DR
LAO, MMR
1 HKG, KOR, TWN, SGP, MAC, AUS
HKG, SGP, MAC, BRN, NZL, CAN
CHN, HKG, TWN, MYS, THA
SGP, MAC
HKG, KOR, TWN, SGP, MAC, AUS
HKG, SGP, MAC, BRN, NZL, CAN
CHN, HKG, MYS, THA
SGP, MAC
2 THA, BRN, NZL KOR, MYS, THA KHM, PHL, VNM, IND
THA, BRN, NZL KOR, MYS, PHL, THA
KOR, IDN, NZL, CAN
3 MYS, CAN CHN, TWN, AUS IDN, AUS, NZL, CAN
MYS, CAN CHN, TWN, VNM, AUS
SGP, MAC, BRN
4 CHN, IND KHM, PHL SGP, MAC, BRN CHN, IND PHL, VNM, IND
5 KHM, LAO VNM, IND LAO, MMR
BY
6 IDN, LAO
BE
1 HKG, KOR, TWN, MAC, AUS
KOR, MYS, PHL, THA
HKG, TWN, MYS
- HKG, KOR, TWN, SGP, MAC, AUS
HKG, SGP, MAC, BRN, NZL, CAN
CHN, HKG, MYS, PHL, THA, VNM, IND, AUS
SGP, MAC
2 THA, NZL HKG, MAC, NZL, CAN
KOR, AUS, NZL, CAN
THA, BRN, NZL CHN, TWN, AUS SGP, MAC, BRN
3 MYS, CAN SGP, BRN KHM, PJL, VNM, IND
MYS, CAN KOR, MYS, THA TWN, KHM
4 PHL, IND KHM, MMR SGP, MAC, BRN KHM, IDN PHL, VNM
5 VNM, IND LAO, MMR MMR, PHL
BR
6 IDN, LAO
YE
CHN, IND
1 HKG, KOR, TWN, MAC, AUS
HKG, MAC, NZL, CAN
HKG, TWN, KHM, MYS, PHL, VNM, IND
- HKG, KOR, TWN, THA, MAC, AUS, NZL
KOR, MYS, PHL, THA, AUS
HKG, MYS, PHL, VNM, IND
THA, AUS
2 THA, NZL KOR, MYS, THA SGP, MAC, BRN MYS, IND, CAN HKG, MAC, NZL, CAN
KOR, NZL, CAN
3 KHM, IDN IDN, LAO LAO, MMR KHM, IDN KHM, MMR SGP, MAC, BRN
4 MYS, CAN VNM, IND IND, JPN THA, AUS
YR
5
ER
SGP, BRN TWN, KHM
1 HKG, KOR, TWN, SGP, MAC, AUS
HKG, MAC, NZL, CAN
IDN, AUS, NZL, CAN
- HKG, KOR, TWN, SGP, MAC, AUS
HKG, MAC, NZL, CAN
KOR, IDN, NZL, CAN
-
2 THA, BRN, NZL KOR, MYS, THA SGP, MAC, BRN THA, BRN, NZL KOR, MYS, PHL, THA
SGP, MAC, BRN
3 MYS, CAN CHN, TWN, AUS KHM, PHL, IND MYS, CAN CHN, TWN, VNM, AUS
CHN, HKG, MYS
4 CHN, IND SGP, BRN CHN, HKG, MYS CHN, IND KHM, MMR PHL, IND
DBY
5 IDN, LAO LAO, MMR
DBE
SGP, BRN

Optimal Currency Areas in East Asia
372
Table 7.22 Maastricht-FCM cross-anchor subclusters (continued)
PRE CRS PST All PRE CRS PST All
1 HKG, KOR, TWN, MAC, AUS
HKG, MAC, NZL, CAN
KOR, AUS, NZL, CAN
- HKG, KOR, TWN, SGP, MAC
HKG, MAC, NZL, CAN
CHN, HKG, MYS, VNM
-
2 MYS, CAN KOR, MYS, PHL, THA
SGP, MAC, BRN THA, BRN, NZL CHN, TWN, AUS IDN, NZL, CAN
3 THA, NZL SGP, BRN KHM, PHL, IND MYS, CAN KOR, MYS, THA SGP, MAC, BRN
4 KHM, MMR LAO, MMR CHN, IND SGP, BRN PHL, THA, IND
DBR
5 IDN, LAO HKG, MYS
DYE
MMR, PHL TWN, KHM
1 HKG, KOR, TWN, MAC
HKG, MAC, NZL, CAN
TWN, KHM, PHL, IND
- HKG, KOR, TWN, MAC, AUS
HKG, MAC, NZL, CAN
HKG, MYS, VNM
-
2 THA, NZL KOR, MYS, THA HKG, MYS, VNM
THA, NZL KOR, MYS, PHL, THA
SGP, MAC, BRN
3 MYS, CAN SGP, BRN AUS, NZL, CAN MYS, CAN SGP, BRN TWN, KHM
4 IDN, LAO SGP, MAC, BRN IND, JPN PHL, IND
DYR
5 LAO, MMR
DER
KHM, MMR NZL, CAN
1 HKG, KOR, TWN, SGP, MAC, AUS
HKG, SGP, MAC, BRN, NZL, CAN
CHN, HKG, MYS, THA
SGP, MAC
HKG, KOR, TWN, MAC, AUS
HKG, MAC, NZL, CAN
KHM, PHL, VNM, IND
-
2 THA, BRN, NZL KOR, MYS, THA PHL, VNM, IND THA, NZL SGP, BRN HKG, TWN, MYS
3 MYS, CAN CHN, TWN, AUS IDN, NZL, CAN MYS, CAN KOR, MYS, THA AUS, NZL, CAN
4 CHN, IND SGP, MAC, BRN VNM, IND SGP, MAC, BRN
BYE
5
BYR
IDN, LAO LAO, MMR
1 HKG, KOR, TWN, MAC, AUS
HKG, MAC, NZL, CAN
KOR, NZL, CAN - HKG, KOR, TWN, MAC, AUS
HKG, MAC, NZL, CAN
HKG, MYS, PHL, VNM, IND
-
2 THA, NZL KOR, MYS, PHL, THA
SGP, MAC, BRN THA, NZL KOR, MYS, THA
SGP, MAC, BRN
3 MYS, CAN SGP, BRN PHL, VNM, IND MYS, CAN SGP, BRN TWN, KHM
4 HKG, MYS
YER
KHM, IDN THA, AUS
BER
5
1 HKG, KOR, TWN, SGP, MAC, AUS
HKG, MAC, NZL, CAN
SGP, MAC, BRN - HKG, KOR, TWN, MAC, AUS
HKG, MAC, NZL, CAN
SGP, MAC, BRN -
2 THA, BRN, NZL KOR, MYS, THA IDN, NZL, CAN MYS, CAN KOR, MYS, THA AUS, NZL, CAN
3 CHN, IND CHN, TWN, AUS CHN, HKG, MYS THA, NZL SGP, BRN KHM, PHL, IND
4 MYS, CAN SGP, BRN PHL, IND IDN, LAO HKG, MYS
DBYE
5
DBYR
LAO, MMR
1 HKG, KOR, TWN, MAC, AUS
HKG, MAC, NZL, CAN
SGP, MAC, BRN - HKG, KOR, TWN, MAC
HKG, MAC, NZL, CAN
HKG, MYS, VNM
-
2 MYS, CAN KOR, MYS, PHL, THA
KOR, NZL, CAN THA, NZL KOR, MYS, THA SGP, MAC, BRN
3 THA, NZL SGP, BRN PHL, IND MYS, CAN SGP, BRN PHL, IND
4 KHM, MMR HKG, MYS TWN, KHM
DBER
5
DYER
NZL, CAN
1 HKG, KOR, TWN, MAC, AUS
HKG, MAC, NZL, CAN
PHL, VNM, IND - HKG, KOR, TWN, MAC, AUS
HKG, MAC, NZL, CAN
SGP, MAC, BRN -
2 THA, NZL KOR, MYS, THA SGP, MAC, BRN MYS, CAN KOR, MYS, THA NZL, CAN
3 MYS, CAN SGP, BRN NZL, CAN THA, NZL SGP, BRN
BYER
4 HKG, MYS
DBYER
Note: D=Dollar; B=Currency Basket; Y=Yen; E=Euro/Mark; R=Yuan (Renminbi)
7.3.2 Assessment of Preparedness
Table 7.23 compares the Asian-only clusters with the Asian-plus-EMU-benchmark
clusters. Columns ‘1’ display the original Asian-only groupings and columns ‘2’ contain
the Asian-plus-EMU clusters. Cells containing EMU cases are highlighted. Common
sets of countries between the clusters might be symmetrical in Maastricht conditions
and degree of preparedness. The common sets of countries are provided in the second
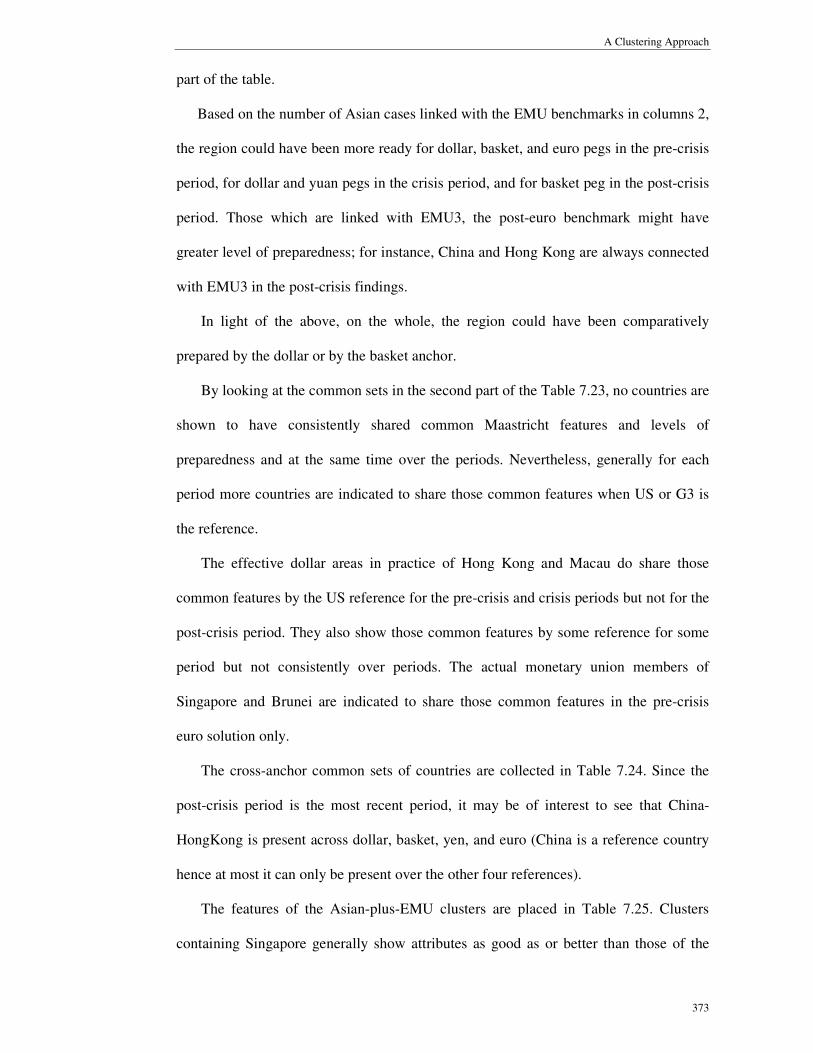
A Clustering Approach
373
part of the table.
Based on the number of Asian cases linked with the EMU benchmarks in columns 2,
the region could have been more ready for dollar, basket, and euro pegs in the pre-crisis
period, for dollar and yuan pegs in the crisis period, and for basket peg in the post-crisis
period. Those which are linked with EMU3, the post-euro benchmark might have
greater level of preparedness; for instance, China and Hong Kong are always connected
with EMU3 in the post-crisis findings.
In light of the above, on the whole, the region could have been comparatively
prepared by the dollar or by the basket anchor.
By looking at the common sets in the second part of the Table 7.23, no countries are
shown to have consistently shared common Maastricht features and levels of
preparedness and at the same time over the periods. Nevertheless, generally for each
period more countries are indicated to share those common features when US or G3 is
the reference.
The effective dollar areas in practice of Hong Kong and Macau do share those
common features by the US reference for the pre-crisis and crisis periods but not for the
post-crisis period. They also show those common features by some reference for some
period but not consistently over periods. The actual monetary union members of
Singapore and Brunei are indicated to share those common features in the pre-crisis
euro solution only.
The cross-anchor common sets of countries are collected in Table 7.24. Since the
post-crisis period is the most recent period, it may be of interest to see that China-
HongKong is present across dollar, basket, yen, and euro (China is a reference country
hence at most it can only be present over the other four references).
The features of the Asian-plus-EMU clusters are placed in Table 7.25. Clusters
containing Singapore generally show attributes as good as or better than those of the

Optimal Currency Areas in East Asia
374
Asian-plus-EMU clusters.
Table 7.23 Maastricht-FCM preparedness assessment
Dollar Currency Basket Yen Euro Yuan
1 2 1 2 1 2 1 2 1 2
1 HKG, KOR, TWN, SGP, MAC, AUS
HKG, KOR,
TWN, SGP,
THA, MAC,
BRN, AUS, NZL, EMU3
HKG, KOR, TWN, SGP, MAC, AUS
HKG, KOR,
TWN, SGP,
THA, MAC,
BRN, AUS, NZL, EMU3
HKG, KOR, TWN, SGP, MAC, AUS
MYS, CAN, EMU1, EMU2, EMU3
HKG, KOR, TWN, SGP, THA, MAC, BRN, AUS, NZL
HKG, KOR,
TWN, SGP,
THA, MAC,
BRN, AUS, NZL, EMU3
HKG, KOR, TWN, THA, MAC, AUS, NZL
HKG, KOR, TWN, SGP, THA, MAC, BRN, AUS, NZL
2 THA, BRN, JPN, NZL
MYS, CAN, EMU1, EMU2
CHN, PHL, IND
CHN, MYS,
CAN, EMU1, EMU2
THA, BRN, NZL
CHN, MMR, PHL
CHN, MYS, IND, CAN
MYS, IND,
CAN, EMU1, EMU2
MMR, SGP, BRN, JPN
KHM, IDN, MMR, JPN
3 IDN, MMR, PHL
CHN, KHM, IND, JPN
THA, BRN, NZL
KHM, IDN, LAO, MMR, PHL, IND
KHM, IDN, LAO
KHM, IDN, IND
KHM, IDN, JPN
KHM, IDN, JPN
MYS, PHL, IND, CAN
EMU1, EMU2, EMU3
4 CHN, KHM, IND
IDN, MMR, PHL
KHM, LAO VNM CHN, IND HKG, KOR, TWN, SGP, THA, MAC, BRN, AUS, NZL
MMR, PHL CHN, MMR, PHL
KHM, IDN MYS, PHL, IND, CAN
5 MYS, CAN LAO MYS, CAN MMR, PHL LAO LAO VNM LAO, VNM LAO
6 VNM VNM MMR MYS, CAN VNM VNM LAO VNM
7 LAO IDN VNM
Pre-crisis
8 VNM
1 HKG, MAC, NZL, CAN
CHN, TWN,
VNM, AUS, EMU1, EMU2
KOR, KHM, MYS, MMR, PHL, THA
CHN, TWN,
VNM, IND,
AUS, EMU1, EMU2, EMU3
HKG, SGP, MAC, BRN, NZL, CAN
CHN, TWN,
AUS, EMU1, EMU2, EMU3
CHN, KOR, TWN, MYS, PHL, THA, VNM, AUS
CHN, KOR, TWN, MYS, PHL, THA, VNM, AUS
HKG, TWN, MAC, NZL, CAN
TWN, KHM,
MMR, VNM,
IND, JPN, AUS, EMU1, EMU2
2 CHN, TWN, VNM, AUS
HKG, MAC, NZL, CAN, EMU3
HKG, SGP, MAC, BRN, NZL, CAN
HKG, SGP, MAC, BRN, NZL, CAN
KHM, PHL, VNM, IND
HKG, SGP, MAC, BRN, NZL, CAN
HKG, SGP, MAC, BRN, NZL, CAN
HKG, MAC, NZL, CAN
KOR, MYS, PHL, THA, AUS
HKG, MAC, NZL, CAN, EMU3
3 KOR, MYS, PHL, THA
IDN, LAO CHN, TWN, VNM, IND, AUS
IDN, LAO KOR, MYS, THA
KHM, PHL, VNM, IND
IND, JPN EMU, EMU2, EMU3
VNM, IND, JPN
KOR, MYS, PHL, THA
4 IND, JPN IND, JPN IDN, LAO KOR, MYS, PHL, THA
CHN, TWN, AUS
KOR, MYS, THA
KHM, MMR IND, JPN SGP, BRN SGP, BRN
5 SGP, BRN KOR, MYS, PHL, THA
KHM, MMR IDN, LAO IDN, LAO IDN KHM, IDN, MMR
IDN, LAO, IDN, LAO
6 KHM, MMR SGP, BRN MMR MMR LAO SGP, BRN KHM, MMR
Crisis
7 IDN, LAO KHM, MMR LAO
1 TWN, KHM, PHL, THA, IND, JPN
CHN, HKG, MYS, VNM, EMU3
CHN, HKG, TWN, MYS, THA
KOR, AUS, NZL, CAN, EMU1, EMU2
CHN, HKG, TWN, KHM, IDN, MYS, PHL, THA, VNM, IND, AUS, NZL, CAN
CHN, HKG,
TWN, MYS,
THA, EMU2, EMU3
CHN, HKG, MYS, PHL, THA, VNM, IND, AUS
CHN, HKG, THA, EMU2, EMU3
HKG, TWN, KHM, MYS, PHL, VNM, IND
HKG, TWN,
MYS, PHL,
VNM, IND, EMU3
2 KOR, IDN, AUS, NZL, CAN
KOR, AUS,
NZL, CAN, EMU1, EMU2
KOR, IDN, AUS, NZL, CAN
CHN, HKG,
TWN, MYS,
PHL, THA,
VNM, IND, EMU3
KOR, SGP, MAC, BRN
KOR, AUS,
NZL, CAN, EMU1
TWN, KHM, MMR, JPN
IDN, MYS,
PHL, VNM,
IND, AUS, EMU1
KOR, THA, JPN, AUS, NZL, CAN
JPN, AUS, EMU1, EMU2
3 CHN, HKG, MYS, VNM
TWN, KHM, PHL, THA, IND, JPN
KHM, PHL, VNM, IND
SGP, MAC, BRN
LAO, MMR SGP, MAC, BRN
KOR, IDN, NZL, CAN
KOR, NZL, CAN
SGP, MAC, BRN
KOR, THA, NZL, CAN
4 SGP, MAC, BRN
SGP, MAC, BRN
SGP, MAC, BRN
KHM, LAO LAO, MMR SGP, MAC, BRN
TWN, KHM, JPN
LAO, MMR, SGP, MAC, BRN
5 LAO, MMR IDN, MMR LAO, MMR MMR KHM, PHL, VNM, IND
LAO SGP, MAC, BRN
IDN IDN, MMR
6 LAO IDN IDN LAO KHM, LAO
Post-crisis
7 MMR
1 - HKG SGP, MAC TWN, AUS TWN, AUS - CHN, MYS - SGP, BRN -
2 AUS CHN SGP, MAC SGP, MAC, BRN
KOR, THA, AUS
3 NZL HKG, TWN
All Periods
4 CAN MYS, PHL
Common sets of countries Dollar Currency Basket Yen Euro Yuan
1 HKG, KOR, TWN, SGP, MAC, AUS
HKG, KOR, TWN, SGP, MAC, AUS
MYS, CAN HKG, KOR, TWN, SGP, THA, MAC, BRN, AUS, NZL
-
2 THA, BRN, NZL THA, BRN, NZL MYS, IND, CAN
Pre-crisis
3 MYS, CAN MYS, CAN
1 HKG, MAC, NZL, CAN CHN, TWN, VNM, IND, AUS
CHN, TWN, AUS - HKG, MAC, NZL, CAN
2 CHN, TWN, VNM, AUS VNM, IND, JPN Crisis
3 KHM, MMR
1 KOR, AUS, NZL, CAN CHN, HKG, TWN, MYS, THA
CHN, HKG, TWN, MYS, THA
MYS, PHL, VNM, IND, AUS
HKG, TWN, MYS, PHL, VNM, IND
2 CHN, HKG, MYS, VNM KOR, AUS, NZL, CAN AUS, NZL, CAN CHN, HKG, THA JPN, AUS
Post-crisis
3 PHL, VNM, IND
All Periods
1 - - - - -
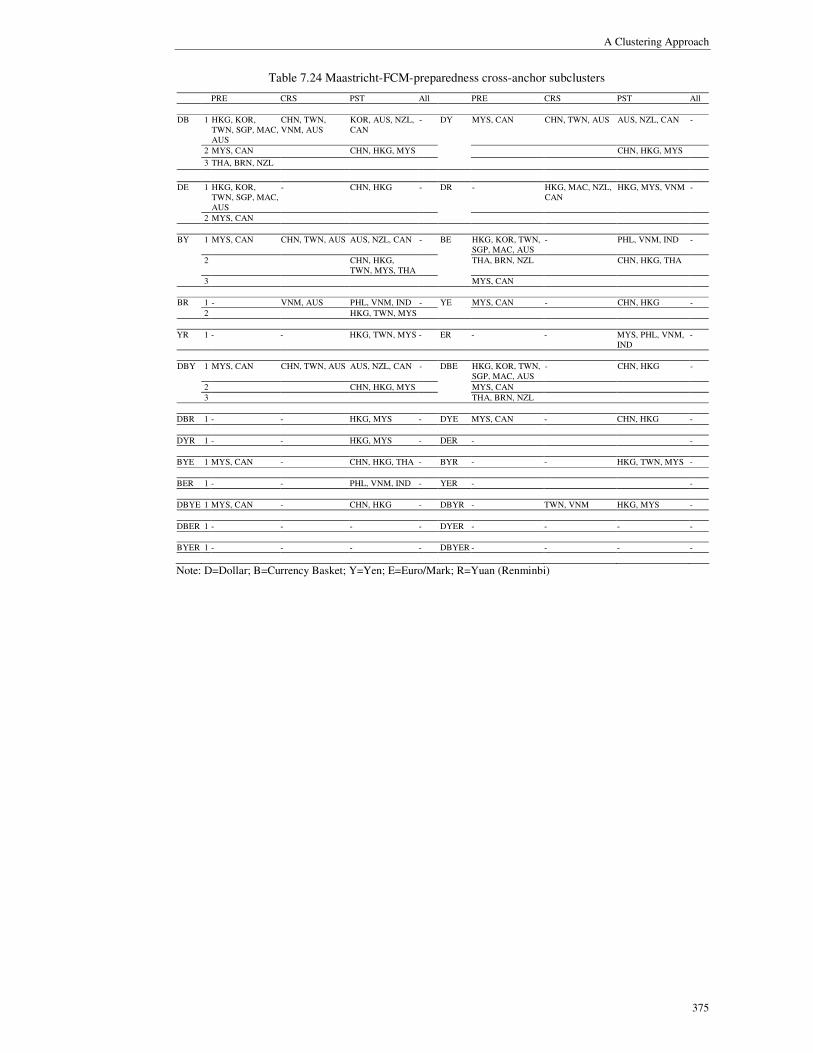
A Clustering Approach
375
Table 7.24 Maastricht-FCM-preparedness cross-anchor subclusters
PRE CRS PST All PRE CRS PST All
1 HKG, KOR, TWN, SGP, MAC, AUS
CHN, TWN, VNM, AUS
KOR, AUS, NZL, CAN
- MYS, CAN CHN, TWN, AUS AUS, NZL, CAN -
2 MYS, CAN CHN, HKG, MYS CHN, HKG, MYS
DB
3 THA, BRN, NZL
DY
1 HKG, KOR, TWN, SGP, MAC, AUS
- CHN, HKG - - HKG, MAC, NZL, CAN
HKG, MYS, VNM - DE
2 MYS, CAN
DR
1 MYS, CAN CHN, TWN, AUS AUS, NZL, CAN - HKG, KOR, TWN, SGP, MAC, AUS
- PHL, VNM, IND -
2 CHN, HKG, TWN, MYS, THA
THA, BRN, NZL CHN, HKG, THA
BY
3
BE
MYS, CAN
1 - VNM, AUS PHL, VNM, IND - MYS, CAN - CHN, HKG - BR
2 HKG, TWN, MYS
YE
YR 1 - - HKG, TWN, MYS - ER - - MYS, PHL, VNM, IND
-
1 MYS, CAN CHN, TWN, AUS AUS, NZL, CAN - HKG, KOR, TWN, SGP, MAC, AUS
- CHN, HKG -
2 CHN, HKG, MYS MYS, CAN
DBY
3
DBE
THA, BRN, NZL
DBR 1 - - HKG, MYS - DYE MYS, CAN - CHN, HKG -
DYR 1 - - HKG, MYS - DER - -
BYE 1 MYS, CAN - CHN, HKG, THA - BYR - - HKG, TWN, MYS -
BER 1 - - PHL, VNM, IND - YER - -
DBYE 1 MYS, CAN - CHN, HKG - DBYR - TWN, VNM HKG, MYS -
DBER 1 - - - - DYER - - - -
BYER 1 - - - - DBYER - - - -
Note: D=Dollar; B=Currency Basket; Y=Yen; E=Euro/Mark; R=Yuan (Renminbi)
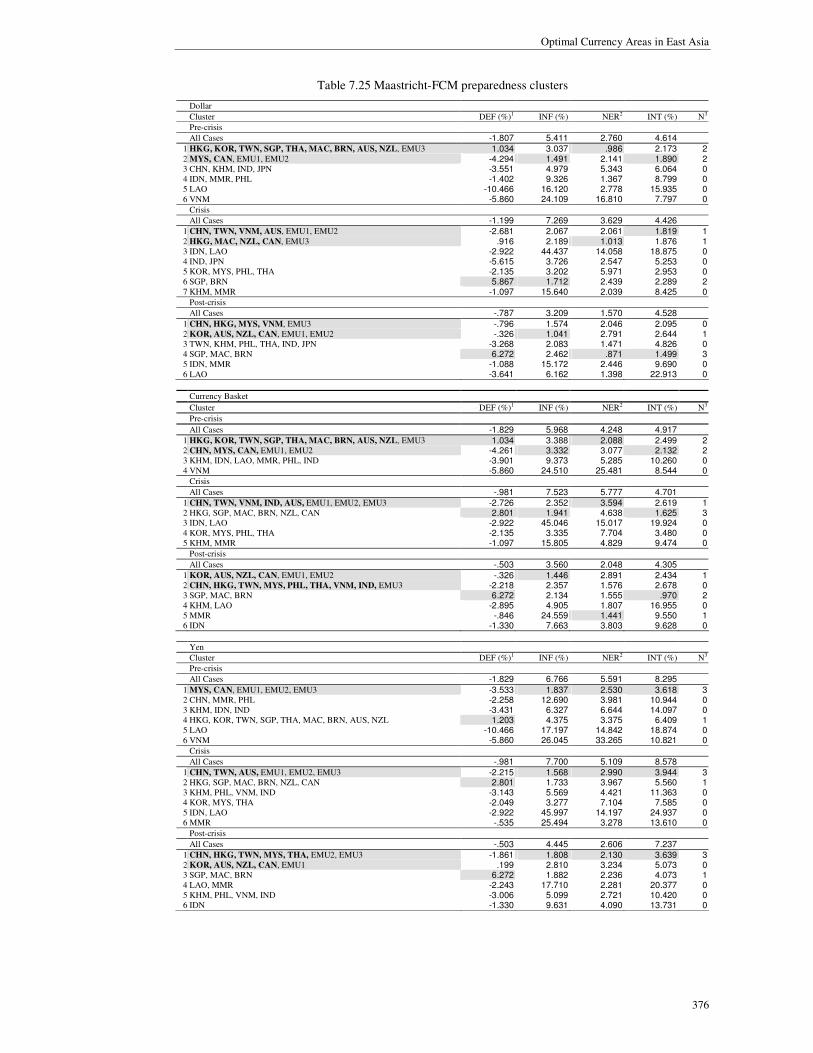
Optimal Currency Areas in East Asia
376
Table 7.25 Maastricht-FCM preparedness clusters
Dollar
Cluster DEF (%)1 INF (%) NER2 INT (%) N3
Pre-crisis
All Cases -1.807 5.411 2.760 4.614
1 HKG, KOR, TWN, SGP, THA, MAC, BRN, AUS, NZL, EMU3 1.034 3.037 .986 2.173 2 2 MYS, CAN, EMU1, EMU2 -4.294 1.491 2.141 1.890 2 3 CHN, KHM, IND, JPN -3.551 4.979 5.343 6.064 0 4 IDN, MMR, PHL -1.402 9.326 1.367 8.799 0 5 LAO -10.466 16.120 2.778 15.935 0 6 VNM -5.860 24.109 16.810 7.797 0
Crisis
All Cases -1.199 7.269 3.629 4.426
1 CHN, TWN, VNM, AUS, EMU1, EMU2 -2.681 2.067 2.061 1.819 1 2 HKG, MAC, NZL, CAN, EMU3 .916 2.189 1.013 1.876 1 3 IDN, LAO -2.922 44.437 14.058 18.875 0 4 IND, JPN -5.615 3.726 2.547 5.253 0 5 KOR, MYS, PHL, THA -2.135 3.202 5.971 2.953 0 6 SGP, BRN 5.867 1.712 2.439 2.289 2 7 KHM, MMR -1.097 15.640 2.039 8.425 0
Post-crisis
All Cases -.787 3.209 1.570 4.528
1 CHN, HKG, MYS, VNM, EMU3 -.796 1.574 2.046 2.095 0 2 KOR, AUS, NZL, CAN, EMU1, EMU2 -.326 1.041 2.791 2.644 1 3 TWN, KHM, PHL, THA, IND, JPN -3.268 2.083 1.471 4.826 0 4 SGP, MAC, BRN 6.272 2.462 .871 1.499 3 5 IDN, MMR -1.088 15.172 2.446 9.690 0 6 LAO -3.641 6.162 1.398 22.913 0
Currency Basket
Cluster DEF (%)1 INF (%) NER2 INT (%) N3
Pre-crisis
All Cases -1.829 5.968 4.248 4.917
1 HKG, KOR, TWN, SGP, THA, MAC, BRN, AUS, NZL, EMU3 1.034 3.388 2.088 2.499 2 2 CHN, MYS, CAN, EMU1, EMU2 -4.261 3.332 3.077 2.132 2 3 KHM, IDN, LAO, MMR, PHL, IND -3.901 9.373 5.285 10.260 0 4 VNM -5.860 24.510 25.481 8.544 0
Crisis
All Cases -.981 7.523 5.777 4.701
1 CHN, TWN, VNM, IND, AUS, EMU1, EMU2, EMU3 -2.726 2.352 3.594 2.619 1 2 HKG, SGP, MAC, BRN, NZL, CAN 2.801 1.941 4.638 1.625 3 3 IDN, LAO -2.922 45.046 15.017 19.924 0 4 KOR, MYS, PHL, THA -2.135 3.335 7.704 3.480 0 5 KHM, MMR -1.097 15.805 4.829 9.474 0
Post-crisis
All Cases -.503 3.560 2.048 4.305
1 KOR, AUS, NZL, CAN, EMU1, EMU2 -.326 1.446 2.891 2.434 1 2 CHN, HKG, TWN, MYS, PHL, THA, VNM, IND, EMU3 -2.218 2.357 1.576 2.678 0 3 SGP, MAC, BRN 6.272 2.134 1.555 .970 2 4 KHM, LAO -2.895 4.905 1.807 16.955 0 5 MMR -.846 24.559 1.441 9.550 1 6 IDN -1.330 7.663 3.803 9.628 0
Yen
Cluster DEF (%)1 INF (%) NER2 INT (%) N3
Pre-crisis
All Cases -1.829 6.766 5.591 8.295
1 MYS, CAN, EMU1, EMU2, EMU3 -3.533 1.837 2.530 3.618 3 2 CHN, MMR, PHL -2.258 12.690 3.981 10.944 0 3 KHM, IDN, IND -3.431 6.327 6.644 14.097 0 4 HKG, KOR, TWN, SGP, THA, MAC, BRN, AUS, NZL 1.203 4.375 3.375 6.409 1 5 LAO -10.466 17.197 14.842 18.874 0 6 VNM -5.860 26.045 33.265 10.821 0
Crisis
All Cases -.981 7.700 5.109 8.578
1 CHN, TWN, AUS, EMU1, EMU2, EMU3 -2.215 1.568 2.990 3.944 3 2 HKG, SGP, MAC, BRN, NZL, CAN 2.801 1.733 3.967 5.560 1 3 KHM, PHL, VNM, IND -3.143 5.569 4.421 11.363 0 4 KOR, MYS, THA -2.049 3.277 7.104 7.585 0 5 IDN, LAO -2.922 45.997 14.197 24.937 0 6 MMR -.535 25.494 3.278 13.610 0
Post-crisis
All Cases -.503 4.445 2.606 7.237
1 CHN, HKG, TWN, MYS, THA, EMU2, EMU3 -1.861 1.808 2.130 3.639 3 2 KOR, AUS, NZL, CAN, EMU1 .199 2.810 3.234 5.073 0 3 SGP, MAC, BRN 6.272 1.882 2.236 4.073 1 4 LAO, MMR -2.243 17.710 2.281 20.377 0 5 KHM, PHL, VNM, IND -3.006 5.099 2.721 10.420 0 6 IDN -1.330 9.631 4.090 13.731 0

A Clustering Approach
377
Table 7.25 Maastricht-FCM preparedness clusters (continued)
Euro
Cluster DEF (%)1 INF (%) NER2 INT (%) N3
Pre-crisis
All Cases -1.807 5.813 5.457 4.233
1 HKG, KOR, TWN, SGP, THA, MAC, BRN, AUS, NZL, EMU3 1.034 3.439 3.086 2.296 3 2 MYS, IND, CAN, EMU1, EMU2 -4.488 2.741 3.230 2.902 1 3 KHM, IDN, JPN -2.123 3.417 6.312 8.182 0 4 CHN, MMR, PHL -2.258 11.586 3.860 3.840 0 5 VNM -5.860 23.962 33.098 7.968 0 6 LAO -10.466 16.624 14.877 13.926 0
Crisis
All Cases -1.199 7.144 9.697 4.436
1 CHN, KOR, TWN, MYS, PHL, THA, VNM, AUS -2.260 2.583 10.472 2.475 0 2 HKG, MAC, NZL, CAN 1.268 2.005 9.682 1.624 1 3 SGP, BRN 5.867 .968 10.102 3.427 2 4 IND, JPN -5.615 3.632 10.028 5.253 0 5 KHM, IDN, MMR -1.131 17.962 13.183 9.843 0 6 LAO -4.645 68.446 14.578 20.466 0 7 EMU, EMU2, EMU3 -2.347 1.369 2.050 2.792 1
Post-crisis
All Cases -.787 3.348 2.445 4.444
1 CHN, HKG, THA, EMU2, EMU3 -1.316 1.442 1.891 3.446 0 2 IDN, MYS, PHL, VNM, IND, AUS, EMU1 -2.897 3.374 2.960 2.428 1 3 KOR, NZL, CAN 1.941 1.059 2.816 3.288 1 4 TWN, KHM, JPN -3.800 1.925 2.462 7.297 0 5 SGP, MAC, BRN 6.272 1.812 2.105 3.589 1 6 LAO -3.641 7.239 2.563 19.295 0 7 MMR -.846 24.554 1.340 6.166 1
Yuan
Cluster DEF (%)1 INF (%) NER2 INT (%) N3
Pre-crisis
All Cases -1.702 9.341 6.139 4.312
1 HKG, KOR, TWN, SGP, THA, MAC, BRN, AUS, NZL 1.203 9.353 4.186 2.134 2 2 KHM, IDN, MMR, JPN -1.753 10.542 6.554 7.408 0 3 EMU1, EMU2, EMU3 -2.347 1.369 2.050 2.792 2 4 MYS, PHL, IND, CAN -4.473 8.796 4.275 3.594 0 5 LAO -10.466 16.614 14.963 13.823 0 6 VNM -5.860 23.264 32.948 7.269 0
Crisis
All Cases -1.140 7.934 3.795 5.247
1 TWN, KHM, MMR, VNM, IND, JPN, AUS, EMU1, EMU2 -3.001 5.946 2.393 4.749 0 2 HKG, MAC, NZL, CAN, EMU3 .916 1.978 1.013 2.698 1 3 KOR, MYS, PHL, THA -2.135 4.081 5.973 4.197 0 4 SGP, BRN 5.867 1.172 2.438 .509 3 5 IDN, LAO -2.922 46.240 14.060 20.700 0
Post-crisis
All Cases -.759 3.694 1.669 4.527
1 HKG, TWN, MYS, PHL, VNM, IND, EMU3 -2.558 2.604 .826 3.397 1 2 JPN, AUS, EMU1, EMU2 -3.706 1.964 2.927 2.930 0 3 KOR, THA, NZL, CAN 1.295 2.101 2.339 1.957 0 4 SGP, MAC, BRN 6.272 1.889 .946 .725 3 5 IDN, MMR -1.088 15.618 2.482 9.869 0 6 KHM, LAO -2.895 4.938 1.033 17.173 0
Note: 1 Positive value indicates surplus. 2 Standard deviation (x102) of the log difference in bilateral nominal exchange rate. 3 Number of variables with highest degree of conformity to Maastricht Treaty. Source: Fuzzy cluster analysis. See Appendix A for data description.

Optimal Currency Areas in East Asia
378
7.3.3 Recapitulation
The section has discussed the results using fuzzy cluster analysis and Maastricht criteria.
The following are the key findings.
Classifications
Based on the average silhouette over all objects, the reference country corresponding to
the most appropriate partition is different for each period. Similarly, for different period
different reference is compatible with the most convergent configuration. Despite the
above, in the findings the configuration by the Japan reference has become more
convergent over the periods.
Amongst subgroups which are stable over periods, Singapore and Macau share the
same grouping across the G3, Japan, and Germany/EMU references. Generally more
cross-period subgroupings are present under the China reference.
For the post-crisis period, the most recent period, Singapore-Macau-Brunei and
NewZealand-Canada are stable across all anchors.
For Singapore and Brunei, the constituents of monetary union, they are placed
together over the periods by the euro and yuan anchors. As for Hong Kong and Macau,
they are connected for pre-crisis and crisis periods by any reference country but not for
post-crisis period. Hence, Hong Kong and Macau do not consistently share the same
grouping by any anchor.
Assessment of Preparedness
Based on the number of Asian countries linked with the EMU benchmarks, basically the
region could have been comparatively prepared by the US or by the weighted-G3
reference.
Nonetheless, no countries are shown to have consistently shared common
Maastricht features and levels of preparedness and at the same time over the periods.

A Clustering Approach
379
Nevertheless, generally for each period more countries are indicated to share those
common features when US or G3 is the reference.
The effective dollar areas in practice of Hong Kong and Macau do share those
common features by the US reference for the pre-crisis and crisis periods but not for the
post-crisis period. The prevailing monetary union members of Singapore and Brunei are
indicated to share those common features in the pre-crisis Germany/EMU-based
solution only.
For post-crisis period, China and Hong Kong are shown to share common
Maastricht features and levels of preparedness across dollar, basket, yen, and euro
anchors
In general, Singapore alone or groups containing Singapore show more conforming
Maastricht attributes.
7.4 Model-based Clustering Results
The results by model-based cluster analysis are categorized into three main sections:
classifications, assessment of preparedness, and a recapitulation.
7.4.1 Classifications
To recap, for MBC a cluster solution is selected based on the maximum BIC which
indicates the best fit between the generated partitions (depending on the
parameterizations of covariance matrix model discussed in Chapter 5) and the data.
In the following findings, the largest difference between the highest BIC and the
second highest BIC is detected in the crisis period euro result. Its difference of about 15
is well above 10, the conventional threshold for strong statistical evidence for a chosen
solution.
The remainder of the section is divided into findings by each monetary anchor and
comparisons of solutions across the anchors.

Optimal Currency Areas in East Asia
380
Dollar Anchor Results
Figure 7.12 below displays the BIC plots based on the US reference. 2 clusters and
model 5 are indicated to be ‘optimal’ for pre-crisis period, 10 clusters and model 1 for
crisis period, and 5 clusters and model 4 for post-crisis period. The significantly more
clusters for the crisis period could imply greater intra-regional divergence against the
US at that time. Based on the average silhouette over all objects at 0.46, the pre-crisis
solution should be most appropriately classified.
Table 7.26 exhibits the groupings and the group features. The highest cluster
silhouettes and the most compliant attributes to the Maastricht requirements are
highlighted.
For pre-crisis period, the largest group comprising of 12 economies reports the
highest group silhouette 0.83, highly significant in absolute terms, signifying tight
classification. The group is more compliant than the second group in all the Maastricht
dimensions. Indeed, the group’s composition is in line with the prevalent Asian dollar
standard which existed in the period before the Asian turmoil.
Hong Kong, Macau, New Zealand, and Canada carry on their previous link and
share the highest degree of exchange rate stability and interest rate convergence with
US for the crisis period. Singapore maintains the highest budget surplus and inflation
convergence.
In the post-crisis solution, Korea-Malaysia-Thailand and Macau-Canada retain their
linkages since the pre-crisis solution. Combined with other countries, they form the
largest group which displays 2 best attributes. Nonetheless, the group only displays a
marginally positive silhouette. The largest silhouette 0.55 is displayed by the second
group which also boasts the stablest post-crisis dollar rate.
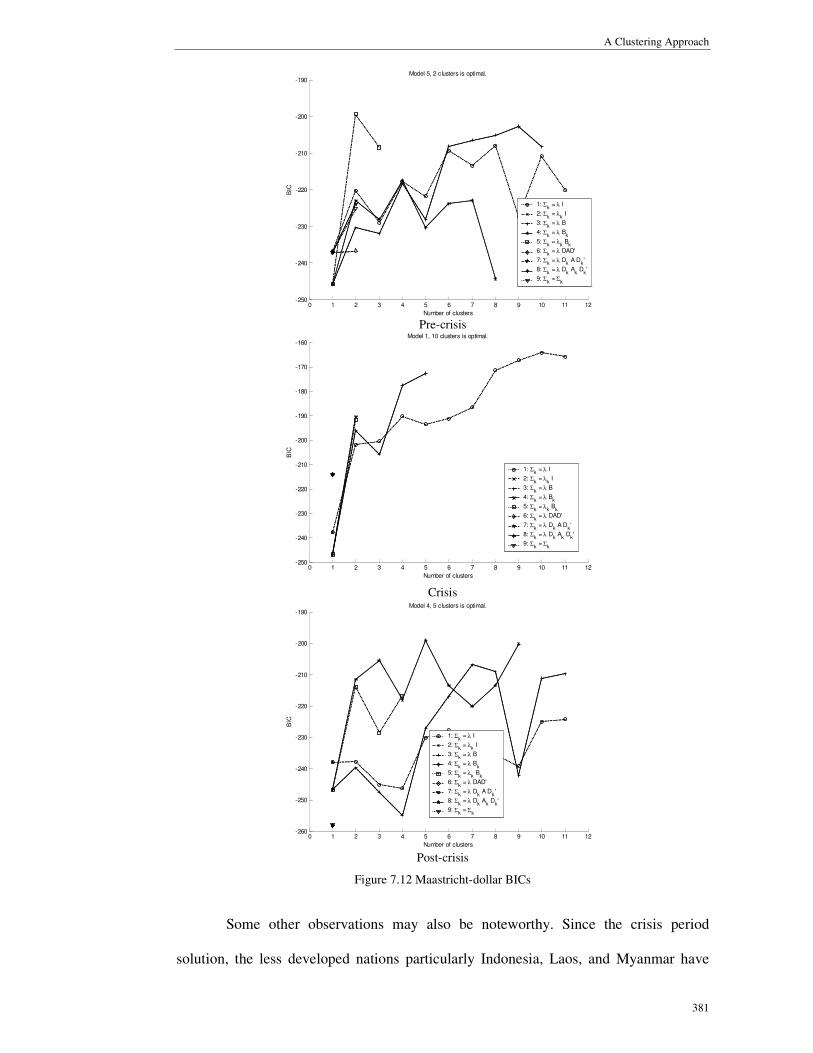
A Clustering Approach
381
0 1 2 3 4 5 6 7 8 9 10 11 12-250
-240
-230
-220
-210
-200
-190
Number of clusters
BIC
Model 5, 2 clusters is optimal.
1: Σk = λ I
2: Σk = λ
k I
3: Σk = λ B
4: Σk = λ B
k
5: Σk = λ
k B
k
6: Σk = λ DAD'
7: Σk = λ D
k A D
k'
8: Σk = λ D
k A
k D
k'
9: Σk = Σ
k
Pre-crisis
0 1 2 3 4 5 6 7 8 9 10 11 12-250
-240
-230
-220
-210
-200
-190
-180
-170
-160
Number of clusters
BIC
Model 1, 10 clusters is optimal.
1: Σk = λ I
2: Σk = λ
k I
3: Σk = λ B
4: Σk = λ B
k
5: Σk = λ
k B
k
6: Σk = λ DAD'
7: Σk = λ D
k A D
k'
8: Σk = λ D
k A
k D
k'
9: Σk = Σ
k
Crisis
0 1 2 3 4 5 6 7 8 9 10 11 12-260
-250
-240
-230
-220
-210
-200
-190
Number of clusters
BIC
Model 4, 5 clusters is optimal.
1: Σk = λ I
2: Σk = λ
k I
3: Σk = λ B
4: Σk = λ B
k
5: Σk = λ
k B
k
6: Σk = λ DAD'
7: Σk = λ D
k A D
k'
8: Σk = λ D
k A
k D
k'
9: Σk = Σ
k
Post-crisis
Figure 7.12 Maastricht-dollar BICs
Some other observations may also be noteworthy. Since the crisis period
solution, the less developed nations particularly Indonesia, Laos, and Myanmar have

Optimal Currency Areas in East Asia
382
been distanced from the pack. They are predominantly distinguished by high inflation
and interest rate divergence from the US.
Aside from more fragmented arrangements since the crisis period setting, the most
conforming features have also been more distributed. In another respect, those which
are clustered with Hong Kong, an effective dollar area have always shown stable dollar
rate, a condition essential for rigid dollar peg.
Table 7.26 Maastricht-MBC-dollar clusters
Averages
Cluster SW DEF (%)1 INF (%) NER2 INT (%) N3
Pre-crisis Period
All Cases .46 -1.726 6.017 2.867 4.901 1 HKG, KOR, TWN, MYS, SGP, THA, MAC, BRN, JPN,
AUS, NZL, CAN .83 -.094 2.886 1.286 2.155 4 2 CHN, KHM, IDN, LAO, MMR, PHL,VNM, IND -.10 -4.174 10.715 5.237 8.678 -
Crisis Period All Cases .45 -1.027 8.154 3.866 4.671
1 CHN, TWN, VNM, AUS .70 -2.384 2.331 1.553 1.622 0 2 HKG, MAC, NZL, CAN .58 1.268 2.479 1.266 1.357 2 3 KOR, MYS, PHL, THA .67 -2.135 3.202 5.971 2.953 0 4 IND, JPN .61 -5.615 3.726 2.547 5.253 0 5 SGP .00 7.572 1.652 2.439 1.995 2 6 IDN .00 -1.199 21.576 16.679 16.132 0 7 KHM .00 -1.658 6.694 2.349 9.303 0 8 LAO .00 -4.645 67.298 11.438 21.618 0 9 MMR .00 -.535 24.586 1.730 7.548 0
10 BRN .00 4.162 1.771 2.439 2.583 0 Post-crisis Period All Cases .17 -.553 3.485 1.498 4.788
1 CHN, KOR, MYS, SGP, THA, MAC, BRN, CAN .03 1.855 1.646 1.193 1.407 2 2 HKG, TWN, KHM, PHL, VNM, IND, .55 -2.553 2.625 .880 4.934 1 3 JPN, AUS, NZL .19 -1.591 1.427 2.948 4.203 1 4 IDN, MMR -.37 -1.088 15.172 2.446 9.690 0 5 LAO .00 -3.641 6.162 1.398 22.913 0
Note: 1 Positive value indicates surplus. 2 Standard deviation (x102) of the log difference in bilateral nominal exchange rate. 3 Number of variables with highest degree of conformity to Maastricht Treaty. Source: Model-based cluster analysis. See Appendix A for data description.
Currency Basket Anchor Results
The G3-based BIC plots are gathered in Figure 7.13. 8 clusters and model 3 are selected
for the pre-crisis period, 10 clusters and model 1 for the crisis period, and 5 clusters and
model 4 for the post-crisis period. The significantly fewer clusters in the post-crisis
solution might infer higher regional homogeneity against the weighted G3 countries in
that period. Based on the average silhouette over all objects at 0.48, the pre-crisis
solution should be most appropriately classified.
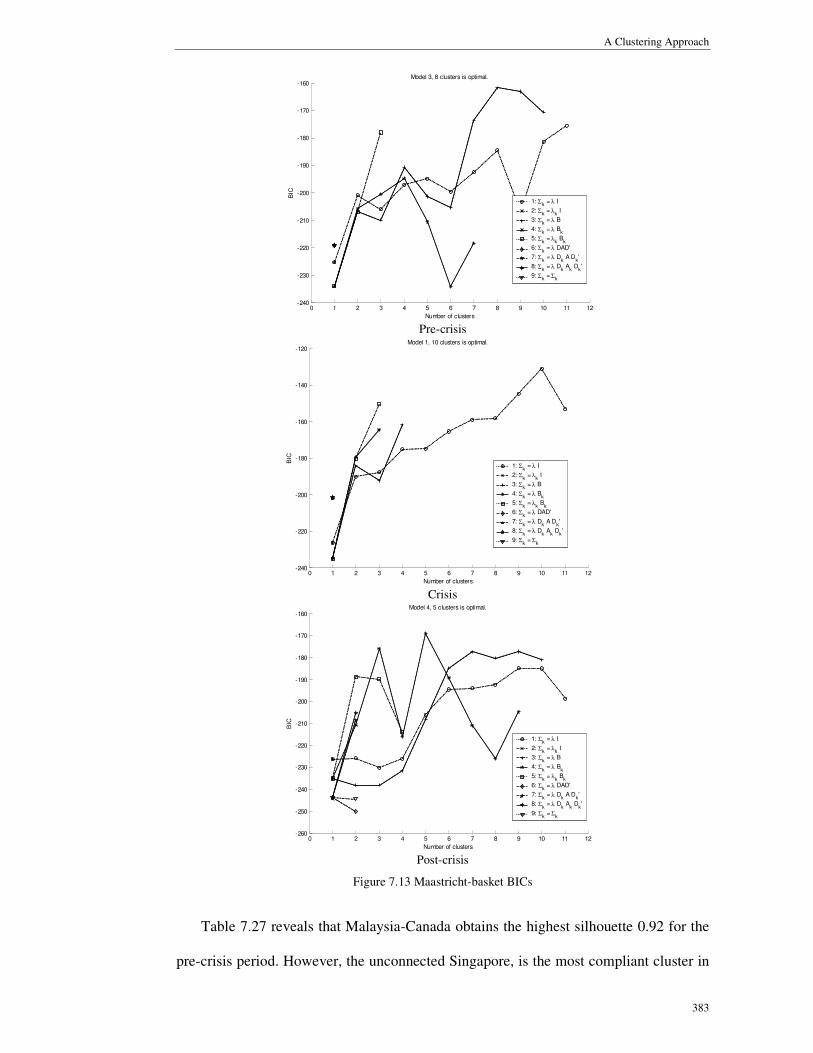
A Clustering Approach
383
0 1 2 3 4 5 6 7 8 9 10 11 12
-240
-230
-220
-210
-200
-190
-180
-170
-160
Number of clusters
BIC
Model 3, 8 clusters is optimal.
1: Σk = λ I
2: Σk = λ
k I
3: Σk = λ B
4: Σk = λ B
k
5: Σk = λ
k B
k
6: Σk = λ DAD'
7: Σk = λ D
k A D
k'
8: Σk = λ D
k A
k D
k'
9: Σk = Σ
k
Pre-crisis
0 1 2 3 4 5 6 7 8 9 10 11 12-240
-220
-200
-180
-160
-140
-120
Number of clusters
BIC
Model 1, 10 clusters is optimal.
1: Σk = λ I
2: Σk = λ
k I
3: Σk = λ B
4: Σk = λ B
k
5: Σk = λ
k B
k
6: Σk = λ DAD'
7: Σk = λ D
k A D
k'
8: Σk = λ D
k A
k D
k'
9: Σk = Σ
k
Crisis
0 1 2 3 4 5 6 7 8 9 10 11 12-260
-250
-240
-230
-220
-210
-200
-190
-180
-170
-160
Number of clusters
BIC
Model 4, 5 clusters is optimal.
1: Σk = λ I
2: Σk = λ
k I
3: Σk = λ B
4: Σk = λ B
k
5: Σk = λ
k B
k
6: Σk = λ DAD'
7: Σk = λ D
k A D
k'
8: Σk = λ D
k A
k D
k'
9: Σk = Σ
k
Post-crisis
Figure 7.13 Maastricht-basket BICs
Table 7.27 reveals that Malaysia-Canada obtains the highest silhouette 0.92 for the
pre-crisis period. However, the unconnected Singapore, is the most compliant cluster in

Optimal Currency Areas in East Asia
384
all aspects. In the crisis period configuration, Singapore, possessing 3 best features is
once again the most prospective country. The pre-crisis subclusters of HongKong-
Macau-NewZealand and Korea-Thailand make up parts of the best classified clusters,
clusters two and three.
For post-crisis period, Hong Kong and Macau retain their link since the pre-crisis
period and form part of the largest cluster which possesses 2 most compatible features
but a slightly negative silhouette. Meanwhile, Korea, Australia, New Zealand, and
Canada share high silhouette 0.62 and most compliant budget balance and inflation
convergence. Whilst the configuration is more convergent for the post-crisis period, the
best features are more distributed compared to those for the pre-crisis period.
Table 7.27 Maastricht-MBC-basket clusters
Averages
Cluster SW DEF (%)1 INF (%) NER2 INT (%) N3
Pre-crisis Period
All Cases .48 -1.747 6.694 4.595 5.271 1 HKG, KOR, TWN, THA, MAC, BRN, AUS, NZL .74 .570 3.907 2.365 2.433 0 2 IDN, MMR, PHL .20 -1.402 10.066 2.690 9.263 0 3 MYS, CAN .92 -5.312 1.871 2.275 1.548 0 4 CHN, IND .36 -4.697 8.042 3.975 5.237 0 5 KHM .00 -3.467 3.276 11.193 10.430 0 6 SGP .00 6.269 1.599 1.955 1.508 4 7 LAO .00 -10.466 16.519 9.182 16.008 0 8 VNM .00 -5.860 24.510 25.481 8.544 0
Crisis Period All Cases .46 -.765 8.494 6.365 5.002
1 CHN, TWN, VNM, AUS .68 -2.384 2.189 4.566 1.770 0 2 HKG, MAC, NZL, CAN .78 1.268 2.246 4.436 1.774 0 3 KOR, MYS, THA, .78 -2.049 2.752 8.126 2.651 0 4 KHM, PHL .25 -2.025 5.857 5.799 8.159 0 5 SGP .00 7.572 1.186 5.041 1.137 3 6 BRN .00 4.162 1.479 5.041 1.518 0 7 IND .00 -5.231 5.950 4.335 5.493 1 8 MMR .00 -.535 24.978 4.496 8.597 0 9 IDN .00 -1.199 21.985 17.533 17.181 0
10 LAO .00 -4.645 68.106 12.501 22.666 0 Post-crisis Period All Cases .26 -.211 3.906 2.048 4.544
1 CHN, HKG, MYS, SGP, THA, MAC, BRN -.03 1.632 1.948 1.586 .748 2 2 TWN, KHM, PHL, VNM, IND .67 -2.845 3.122 1.868 5.762 0 3 KOR, AUS, NZL, CAN .62 1.149 1.399 2.799 2.545 2 4 IDN, MMR -.40 -1.088 16.111 2.622 9.589 0 5 LAO .00 -3.641 7.151 2.026 22.923 0
Note: 1 Positive value indicates surplus. 2 Standard deviation (x102) of the log difference in bilateral nominal exchange rate. 3 Number of variables with highest degree of conformity to Maastricht Treaty. Source: Model-based cluster analysis. See Appendix A for data description.
Yen Anchor Results
Figure 7.14 displays the Japan-based BIC plots. 8 clusters and model 1 are suggested to
be appropriate for the pre-crisis period; 10 clusters and model 1 for the crisis period;
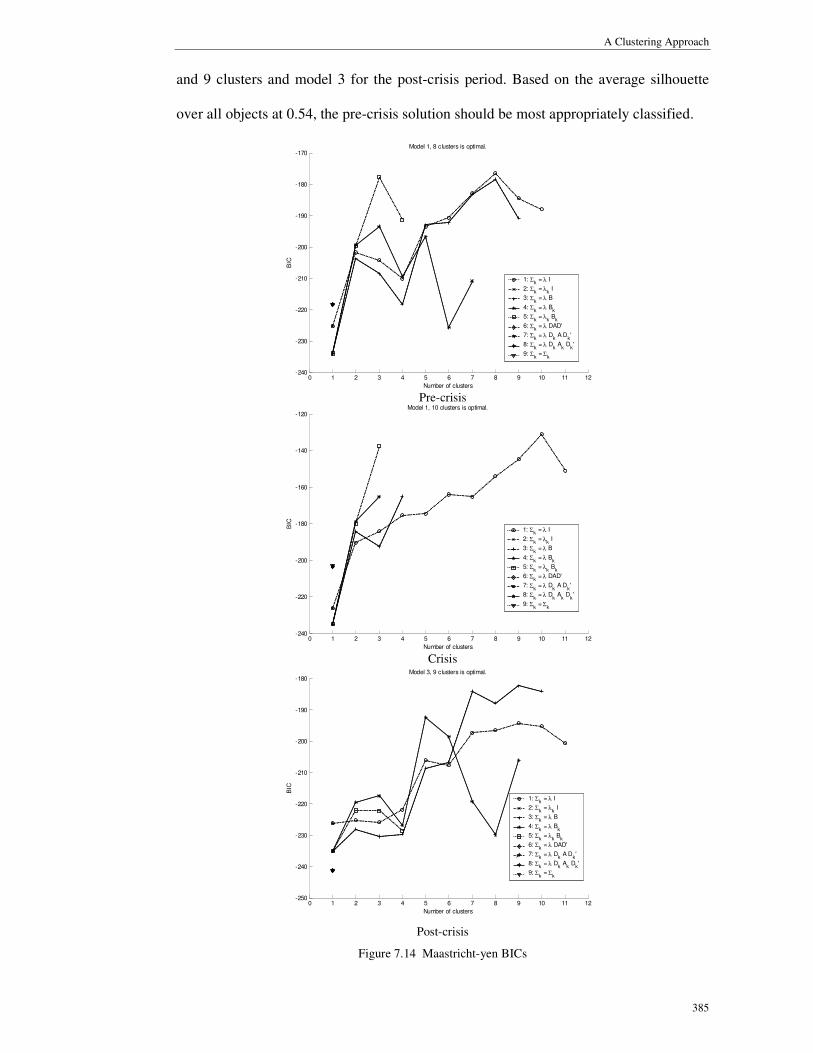
A Clustering Approach
385
and 9 clusters and model 3 for the post-crisis period. Based on the average silhouette
over all objects at 0.54, the pre-crisis solution should be most appropriately classified.
0 1 2 3 4 5 6 7 8 9 10 11 12-240
-230
-220
-210
-200
-190
-180
-170
Number of clusters
BIC
Model 1, 8 clusters is optimal.
1: Σk = λ I
2: Σk = λ
k I
3: Σk = λ B
4: Σk = λ B
k
5: Σk = λ
k B
k
6: Σk = λ DAD'
7: Σk = λ D
k A D
k'
8: Σk = λ D
k A
k D
k'
9: Σk = Σ
k
Pre-crisis
0 1 2 3 4 5 6 7 8 9 10 11 12-240
-220
-200
-180
-160
-140
-120
Number of clusters
BIC
Model 1, 10 clusters is optimal.
1: Σk = λ I
2: Σk = λ
k I
3: Σk = λ B
4: Σk = λ B
k
5: Σk = λ
k B
k
6: Σk = λ DAD'
7: Σk = λ D
k A D
k'
8: Σk = λ D
k A
k D
k'
9: Σk = Σ
k
Crisis
0 1 2 3 4 5 6 7 8 9 10 11 12-250
-240
-230
-220
-210
-200
-190
-180
Number of clusters
BIC
Model 3, 9 clusters is optimal.
1: Σk = λ I
2: Σk = λ
k I
3: Σk = λ B
4: Σk = λ B
k
5: Σk = λ
k B
k
6: Σk = λ DAD'
7: Σk = λ D
k A D
k'
8: Σk = λ D
k A
k D
k'
9: Σk = Σ
k
Post-crisis
Figure 7.14 Maastricht-yen BICs
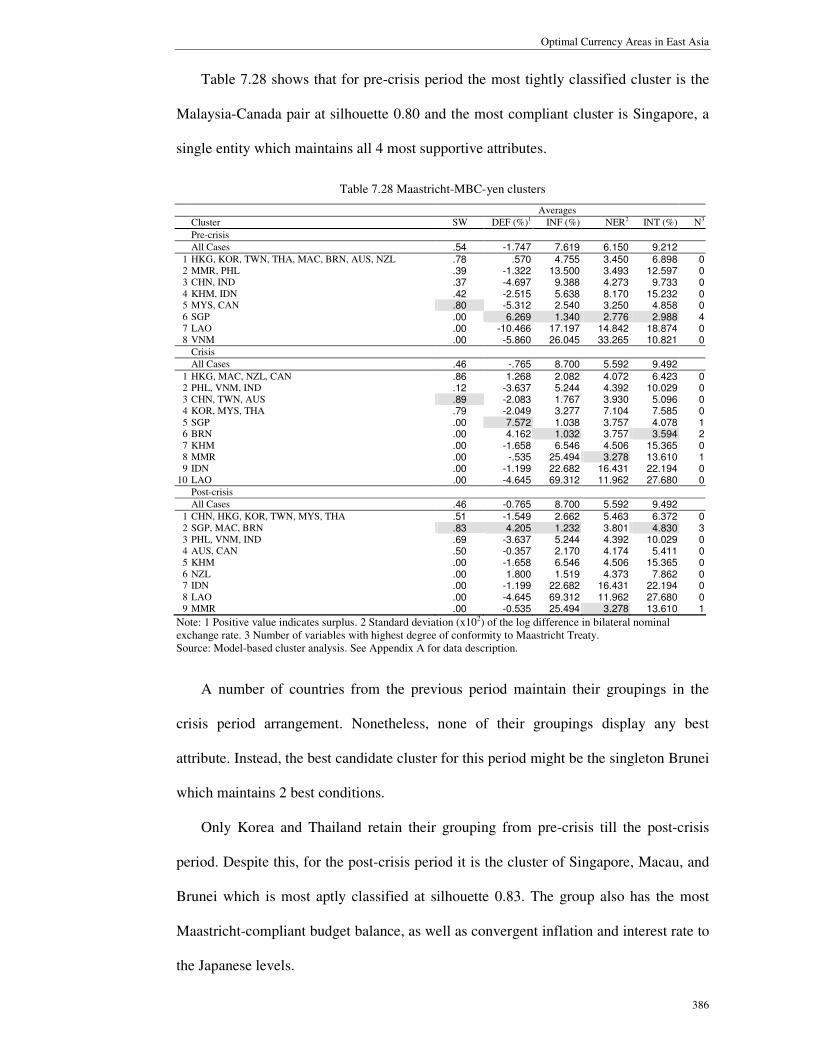
Optimal Currency Areas in East Asia
386
Table 7.28 shows that for pre-crisis period the most tightly classified cluster is the
Malaysia-Canada pair at silhouette 0.80 and the most compliant cluster is Singapore, a
single entity which maintains all 4 most supportive attributes.
Table 7.28 Maastricht-MBC-yen clusters
Averages
Cluster SW DEF (%)1 INF (%) NER2 INT (%) N3
Pre-crisis All Cases .54 -1.747 7.619 6.150 9.212
1 HKG, KOR, TWN, THA, MAC, BRN, AUS, NZL .78 .570 4.755 3.450 6.898 0 2 MMR, PHL .39 -1.322 13.500 3.493 12.597 0 3 CHN, IND .37 -4.697 9.388 4.273 9.733 0 4 KHM, IDN .42 -2.515 5.638 8.170 15.232 0 5 MYS, CAN .80 -5.312 2.540 3.250 4.858 0 6 SGP .00 6.269 1.340 2.776 2.988 4 7 LAO .00 -10.466 17.197 14.842 18.874 0 8 VNM .00 -5.860 26.045 33.265 10.821 0
Crisis All Cases .46 -.765 8.700 5.592 9.492
1 HKG, MAC, NZL, CAN .86 1.268 2.082 4.072 6.423 0 2 PHL, VNM, IND .12 -3.637 5.244 4.392 10.029 0 3 CHN, TWN, AUS .89 -2.083 1.767 3.930 5.096 0 4 KOR, MYS, THA .79 -2.049 3.277 7.104 7.585 0 5 SGP .00 7.572 1.038 3.757 4.078 1 6 BRN .00 4.162 1.032 3.757 3.594 2 7 KHM .00 -1.658 6.546 4.506 15.365 0 8 MMR .00 -.535 25.494 3.278 13.610 1 9 IDN .00 -1.199 22.682 16.431 22.194 0
10 LAO .00 -4.645 69.312 11.962 27.680 0 Post-crisis All Cases .46 -0.765 8.700 5.592 9.492
1 CHN, HKG, KOR, TWN, MYS, THA .51 -1.549 2.662 5.463 6.372 0 2 SGP, MAC, BRN .83 4.205 1.232 3.801 4.830 3 3 PHL, VNM, IND .69 -3.637 5.244 4.392 10.029 0 4 AUS, CAN .50 -0.357 2.170 4.174 5.411 0 5 KHM .00 -1.658 6.546 4.506 15.365 0 6 NZL .00 1.800 1.519 4.373 7.862 0 7 IDN .00 -1.199 22.682 16.431 22.194 0 8 LAO .00 -4.645 69.312 11.962 27.680 0 9 MMR .00 -0.535 25.494 3.278 13.610 1
Note: 1 Positive value indicates surplus. 2 Standard deviation (x102) of the log difference in bilateral nominal exchange rate. 3 Number of variables with highest degree of conformity to Maastricht Treaty. Source: Model-based cluster analysis. See Appendix A for data description.
A number of countries from the previous period maintain their groupings in the
crisis period arrangement. Nonetheless, none of their groupings display any best
attribute. Instead, the best candidate cluster for this period might be the singleton Brunei
which maintains 2 best conditions.
Only Korea and Thailand retain their grouping from pre-crisis till the post-crisis
period. Despite this, for the post-crisis period it is the cluster of Singapore, Macau, and
Brunei which is most aptly classified at silhouette 0.83. The group also has the most
Maastricht-compliant budget balance, as well as convergent inflation and interest rate to
the Japanese levels.
A Clustering Approach
387
With slightly more clusters and reduction in the size of the dominant group, the
region could have been more fragmented in the post-crisis period than that in the pre-
crisis period.
Euro Anchor Results
The BIC plots using Germany/EMU as the reference are arranged in Figure 7.15. 10
clusters and model 3 are indicated as optimal for the pre-crisis period; 10 clusters and
model 1 for the crisis period; and 8 clusters and model 3 for the post-crisis period.
Based on the average silhouette over all objects at 0.45, the crisis period solution should
be most appropriately classified.
Based on the cluster silhouette 0.74, Table 7.29 reveals that the best classified
cluster for the pre-crisis period is the second group consisting of Korea, Taiwan, and
Thailand. Nonetheless, Singapore is the most compliant country in the first 3
dimensions whilst China maintains the most convergent interest rate toward the German
rate.
The most closely clustered group for the crisis period is made up of Hong Kong,
Macau, and New Zealand which carry on their grouping from the previous period, and
Canada. The group and Singapore each exhibit 2 best features.
A few cases retain their previous linkages in the post-crisis setting. For this period,
it is the cluster consisting of Macau, Brunei, and Singapore which shares the highest
silhouette at 0.72 and the most healthy budget balance. Groups three, five, and eight
respectively record one most conforming feature.
The best Maastricht conditions are more distributed across the findings and the
arrangement appears to be somewhat more symmetrical in the post-crisis finding with
slightly fewer clusters and fewer ungrouped cases.

Optimal Currency Areas in East Asia
388
0 1 2 3 4 5 6 7 8 9 10 11 12-250
-240
-230
-220
-210
-200
-190
-180
-170
Number of clusters
BIC
Model 3, 10 clusters is optimal.
1: Σk = λ I
2: Σk = λ
k I
3: Σk = λ B
4: Σk = λ B
k
5: Σk = λ
k B
k
6: Σk = λ DAD'
7: Σk = λ D
k A D
k'
8: Σk = λ D
k A
k D
k'
9: Σk = Σ
k
Pre-crisis
0 1 2 3 4 5 6 7 8 9 10 11 12-260
-240
-220
-200
-180
-160
-140
-120
Number of clusters
BIC
Model 1, 10 clusters is optimal.
1: Σk = λ I
2: Σk = λ
k I
3: Σk = λ B
4: Σk = λ B
k
5: Σk = λ
k B
k
6: Σk = λ DAD'
7: Σk = λ D
k A D
k'
8: Σk = λ D
k A
k D
k'
9: Σk = Σ
k
Crisis
0 1 2 3 4 5 6 7 8 9 10 11 12-270
-260
-250
-240
-230
-220
-210
-200
-190
Number of clusters
BIC
Model 3, 8 clusters is optimal.
1: Σk = λ I
2: Σk = λ
k I
3: Σk = λ B
4: Σk = λ B
k
5: Σk = λ
k B
k
6: Σk = λ DAD'
7: Σk = λ D
k A D
k'
8: Σk = λ D
k A
k D
k'
9: Σk = Σ
k
Post-crisis
Figure 7.15 Maastricht-euro BICs

A Clustering Approach
389
Table 7.29 Maastricht-MBC-euro clusters
Averages
Cluster SW DEF (%)1 INF (%) NER2 INT (%) N3
Pre-crisis
All Cases .35 -1.726 6.479 5.968 4.461 1 HKG, MAC, BRN, AUS, NZL .32 1.208 4.887 3.650 1.510 0 2 KOR, TWN, THA .74 -.493 2.553 3.281 2.147 0 3 MYS, IND, CAN .46 -5.296 3.543 3.334 3.362 0 4 IDN, JPN .48 -1.452 3.614 3.774 8.040 0 5 MMR, PHL .47 -1.322 12.480 3.324 5.381 0 6 KHM .00 -3.467 3.023 11.387 8.466 0 7 CHN .00 -4.130 9.797 4.933 .759 1 8 SGP .00 6.269 1.264 2.772 4.229 3 9 LAO .00 -10.466 16.624 14.877 13.926 0
10 VNM .00 -5.860 23.962 33.098 7.968 0 Crisis All Cases .45 -1.027 8.011 10.845 4.682
1 CHN, TWN, PHL, VNM, AUS .61 -2.386 2.599 9.871 2.459 0 2 HKG, MAC, NZL, CAN .89 1.268 2.005 9.682 1.624 2 3 KOR, MYS, THA .58 -2.049 2.555 11.473 2.501 0 4 IND, JPN .31 -5.615 3.632 10.028 5.253 0 5 SGP .00 7.572 .570 10.102 3.136 2 6 BRN .00 4.162 1.365 10.102 3.718 0 7 IDN .00 -1.199 22.092 19.715 14.981 0 8 KHM .00 -1.658 6.598 10.070 8.151 0 9 LAO .00 -4.645 68.446 14.578 20.466 0
10 MMR .00 -.535 25.197 9.765 6.396 0 Post-crisis All Cases .41 -.553 3.645 2.504 4.692
1 CHN, HKG, MYS, THA .41 -1.847 1.530 2.373 3.297 0 2 SGP, MAC, BRN .72 6.272 1.812 2.105 3.589 1 3 PHL, VNM, IND, AUS .39 -2.775 3.220 2.673 1.645 1 4 TWN, KHM, JPN .29 -3.800 1.925 2.462 7.297 0 5 KOR, NZL, CAN .62 1.941 1.059 2.816 3.288 1 6 IDN .00 -1.330 7.720 3.840 6.085 0 7 LAO .00 -3.641 7.239 2.563 19.295 0 8 MMR .00 -.846 24.554 1.340 6.166 1
Note: 1 Positive value indicates surplus. 2 Standard deviation (x102) of the log difference in bilateral nominal exchange rate. 3 Number of variables with highest degree of conformity to Maastricht Treaty. Source: Model-based cluster analysis. See Appendix A for data description.
Yuan Anchor Results
BIC plots using China as the reference are collected in Figure 7.16. 12 clusters and
model 3 are optimal for the pre-crisis period; 9 clusters and model 3 for the crisis period;
and 5 clusters and model 4 for the post-crisis period. Based on the average silhouette
over all objects at 0.38, the crisis period solution should be most appropriately classified.
The group silhouette of 0.50 in Table 7.30 suggests that Myanmar and Brunei are
most tightly classified in the pre-crisis period. The group, however, does not exhibit any
best feature. In fact, the Macau-Australia-NewZealand cluster, Malaysia, Indonesia, and
Singapore exhibit one most compliant attribute each.

Optimal Currency Areas in East Asia
390
0 1 2 3 4 5 6 7 8 9 10 11 12 13 14 15-240
-220
-200
-180
-160
-140
-120
-100
-80
Number of clusters
BIC
Model 3, 12 clusters is optimal.
1: Σk = λ I
2: Σk = λ
k I
3: Σk = λ B
4: Σk = λ B
k
5: Σk = λ
k B
k
6: Σk = λ DAD'
7: Σk = λ D
k A D
k'
8: Σk = λ D
k A
k D
k'
9: Σk = Σ
k
Pre-crisis
0 1 2 3 4 5 6 7 8 9 10 11 12-240
-230
-220
-210
-200
-190
-180
-170
-160
-150
Number of clusters
BIC
Model 3, 9 clusters is optimal.
1: Σk = λ I
2: Σk = λ
k I
3: Σk = λ B
4: Σk = λ B
k
5: Σk = λ
k B
k
6: Σk = λ DAD'
7: Σk = λ D
k A D
k'
8: Σk = λ D
k A
k D
k'
9: Σk = Σ
k
Crisis
0 1 2 3 4 5 6 7 8 9 10 11 12 13 14-250
-240
-230
-220
-210
-200
-190
-180
Number of clusters
BIC
Model 4, 5 clusters is optimal.
1: Σk = λ I
2: Σk = λ
k I
3: Σk = λ B
4: Σk = λ B
k
5: Σk = λ
k B
k
6: Σk = λ DAD'
7: Σk = λ D
k A D
k'
8: Σk = λ D
k A
k D
k'
9: Σk = Σ
k
Post-crisis
Figure 7.16 Maastricht-yuan BICs

A Clustering Approach
391
The best classified cluster for crisis period is Taiwan-Australia which also reports
the most parallel interest rate to the Chinese rate. Korea-Malaysia-Thailand, Singapore,
and Indonesia display one best feature each.
Macau, Brunei, and Singapore share the highest silhouette 0.91, the most favorable
budget balance, and the most stable yuan rate in the post-crisis solution. Korea and
Thailand which have been linked since pre-crisis period and few others share the
highest degree of inflation and interest rate convergence with China in this post-crisis
setting.
The substantial reduction in the number of clusters through the findings could
indicate increased degree of symmetry vis-à-vis China. Accordingly, the most
conducive features have been less distributed.
Table 7.30 Maastricht-MBC-yuan clusters
Averages
Cluster SW DEF (%)1 INF (%) NER2 INT (%) N3
Pre-crisis
All Cases .26 -1.600 10.600 6.784 4.565 0 1 HKG, KOR, TWN, THA .44 -.058 8.403 3.934 2.189 0 2 MAC, AUS, NZL .47 1.162 9.445 4.655 1.223 1 3 MMR, BRN .50 .334 12.426 4.063 5.658 0 4 IND, CAN .42 -5.644 8.680 4.170 4.191 0 5 MYS .00 -4.600 9.263 3.791 1.732 1 6 JPN .00 -1.341 11.070 4.955 7.638 0 7 PHL .00 -2.003 8.561 4.971 4.260 0 8 KHM .00 -3.467 11.432 11.918 7.895 0 9 IDN .00 -1.563 6.811 5.204 8.442 1
10 SGP .00 6.269 10.232 3.987 4.651 1 11 LAO .00 -10.466 16.614 14.963 13.823 0 12 VNM .00 -5.860 23.264 32.948 7.269 0
Crisis All Cases .38 -1.600 10.600 6.784 4.565
1 HKG, MAC, BRN, NZL, CAN .43 -.214 9.720 4.218 2.342 0 2 KOR, MYS, THA .72 -1.706 8.752 3.866 1.987 1 3 VNM, IND, JPN .28 -4.155 13.942 14.110 6.366 0 4 KHM, PHL .14 -2.735 9.996 8.445 6.078 0 5 TWN, AUS .88 .062 9.108 4.351 1.509 1 6 MMR .00 -.640 12.857 4.141 5.658 0 7 SGP .00 6.269 10.232 3.987 4.651 1 8 IDN .00 -1.563 6.811 5.204 8.442 1 9 LAO .00 -10.466 16.614 14.963 13.823 0
Post-crisis All Cases .25 -1.600 10.600 6.784 4.565
1 HKG, KOR, MYS, THA, JPN, AUS, NZL, CAN -.09 -1.169 9.246 4.262 2.818 2 2 TWN, KHM, PHL, VNM, IND .64 -3.511 12.040 11.649 5.124 0 3 SGP, MAC, BRN .91 3.061 10.319 4.084 3.044 2 4 IDN, MMR -.26 -1.101 9.834 4.672 7.050 0 5 LAO .00 -10.466 16.614 14.963 13.823 0
Note: 1 Positive value indicates surplus. 2 Standard deviation (x102) of the log difference in bilateral nominal exchange rate. 3 Number of variables with highest degree of conformity to Maastricht Treaty. Source: Model-based cluster analysis. See Appendix A for data description.

Optimal Currency Areas in East Asia
392
7.4.1.1 Comparisons across Anchors
The MBC solutions including the cluster silhouettes are collected in Table 7.31.
Amongst all, the pre-crisis currency basket Malaysia-Canada pair exhibits the highest
silhouette, suggesting that this group is most tightly classified. The China-based post-
crisis Singapore-Macau-Brunei trio also attains comparably high silhouette.
Based on the average silhouettes for all objects, the Japan-based solution
consistently provides the best classification over the periods.
The reference country consistent with the most convergent arrangement, that is, the
fewest clusters is different for each period. For pre-crisis period, the US-, G3-, and
Japan-based solutions generate fewer clusters; for crisis period all solutions have similar
numbers of clusters; and for post-crisis period the US-, G3-, and China-based solutions.
For G3 and China references, the post-crisis arrangements are more convergent in
relation to those of the pre-crisis period.
Along these lines, on the whole the US and G3 references seem to be compatible
with more convergent configurations.
The ‘All Periods’ rows list the stable subgroups that have stayed through the
periods. Remarkably Korea and Thailand share the same cluster by the US, Japan, or
China reference.
Remarkably, Hong Kong and Macau the effective dollar areas are grouped together
by the basket anchor over the periods. For other references, they always share the same
grouping for pre-crisis and crisis periods but not for post-crisis period. For Singapore
and Brunei, they are placed together for pre-crisis dollar anchor and over all anchors for
the post-crisis period. They however do not share the same grouping for the crisis
period by any reference.
The bottom part of the table shows the clusters possessing the highest silhouettes
for the post-crisis period. Notice that Singapore-Macau-Brunei obtains the highest

A Clustering Approach
393
silhouette when the reference is Japan, Germany/EMU, or China.
The linkages which appear under more than one reference are put together in Table
7.32. As mentioned above, Korea and Thailand are consistently placed together across
dollar, yen, and yuan anchors.
For the most recent period, the post-crisis period, Singapore-Macau-Brunei,
Philippines-Vietnam-India, and Malaysia-Thailand share the same groupings regardless
of anchor.
Table 7.31 Maastricht-MBC summary
Dollar SW Currency Basket SW Yen SW Euro SW Yuan SW
1 HKG, KOR, TWN, MYS, SGP, THA, MAC, BRN, JPN, AUS, NZL, CAN
.83 HKG, KOR, TWN, THA, MAC, BRN, AUS, NZL
.74 HKG, KOR, TWN, THA, MAC, BRN, AUS, NZL
.78 HKG, MAC, BRN, AUS, NZL
.32 HKG, KOR, TWN, THA
.44
2 CHN, KHM, IDN, LAO, MMR, PHL,VNM, IND
-.10 IDN, MMR, PHL .20 MMR, PHL .39 KOR, TWN, THA .74 MAC, AUS, NZL .47
3 MYS, CAN .92 CHN, IND .37 MYS, IND, CAN .46 MMR, BRN .50
4 CHN, IND .36 KHM, IDN .42 IDN, JPN .48 IND, CAN .42 5 KHM .00 MYS, CAN .80 MMR, PHL .47 MYS .00
6 SGP .00 SGP .00 KHM .00 JPN .00
7 LAO .00 LAO .00 CHN .00 PHL .00
8 VNM .00 VNM .00 SGP .00 KHM .00
9 LAO .00 IDN .00
10 VNM .00 SGP .00
11 LAO .00
Pre-crisis
12 VNM .00
Average .46 .48 .54 .35 .26
1 CHN, TWN, VNM, AUS
.70 CHN, TWN, VNM, AUS
.68 HKG, MAC, NZL, CAN
.86 CHN, TWN, PHL, VNM, AUS
.61 HKG, MAC, BRN, NZL, CAN
.43
2 HKG, MAC, NZL, CAN
.58 HKG, MAC, NZL, CAN
.78 PHL, VNM, IND .12 HKG, MAC, NZL, CAN
.89 KOR, MYS, THA .72
3 KOR, MYS, PHL, THA
.67 KOR, MYS, THA .78 CHN, TWN, AUS .89 KOR, MYS, THA .58 VNM, IND, JPN .28
4 IND, JPN .61 KHM, PHL .25 KOR, MYS, THA .79 IND, JPN .31 KHM, PHL .14
5 SGP .00 SGP .00 SGP .00 SGP .00 TWN, AUS .88
6 IDN .00 BRN .00 BRN .00 BRN .00 MMR .00
7 KHM .00 IND .00 KHM .00 IDN .00 SGP .00
8 LAO .00 MMR .00 MMR .00 KHM .00 IDN .00
9 MMR .00 IDN .00 IDN .00 LAO .00 LAO .00
Crisis
10 BRN .00 LAO .00 LAO .00 MMR .00
Average .45 .46 .46 .45 .38
1 CHN, KOR, MYS, SGP, THA, MAC, BRN, CAN
.03 CHN, HKG, MYS, SGP, THA, MAC, BRN
-.03 CHN, HKG, KOR, TWN, MYS, THA
.51 CHN, HKG, MYS, THA
.41 HKG, KOR, MYS, THA, JPN, AUS, NZL, CAN
-.09
2 HKG, TWN, KHM, PHL, VNM, IND,
.55 TWN, KHM, PHL, VNM, IND
.67 SGP, MAC, BRN .83 SGP, MAC, BRN .72 TWN, KHM, PHL, VNM, IND
.64
3 JPN, AUS, NZL .19 KOR, AUS, NZL, CAN
.62 PHL, VNM, IND .69 PHL, VNM, IND, AUS
.39 SGP, MAC, BRN .91
4 IDN, MMR -.37 IDN, MMR -.40 AUS, CAN .50 TWN, KHM, JPN .29 IDN, MMR -.26
5 LAO .00 LAO .00 KHM .00 KOR, NZL, CAN .62 LAO .00
6 NZL .00 IDN .00
7 IDN .00 LAO .00
8 LAO .00 MMR .00
Post-crisis
9 MMR .00
Average .17 .26 .46 .41 .25
1 KOR, MYS, THA HKG, MAC KOR, THA - KOR, THA All
Periods 2 MAC, CAN
Post-crisis Findings
1 Highest silhouette HKG-TWN-KHM-PHL-VNM-IND
TWN-KHM-PHL-VNM-IND
SGP-MAC-BRN SGP-MAC-BRN SGP-MAC-BRN
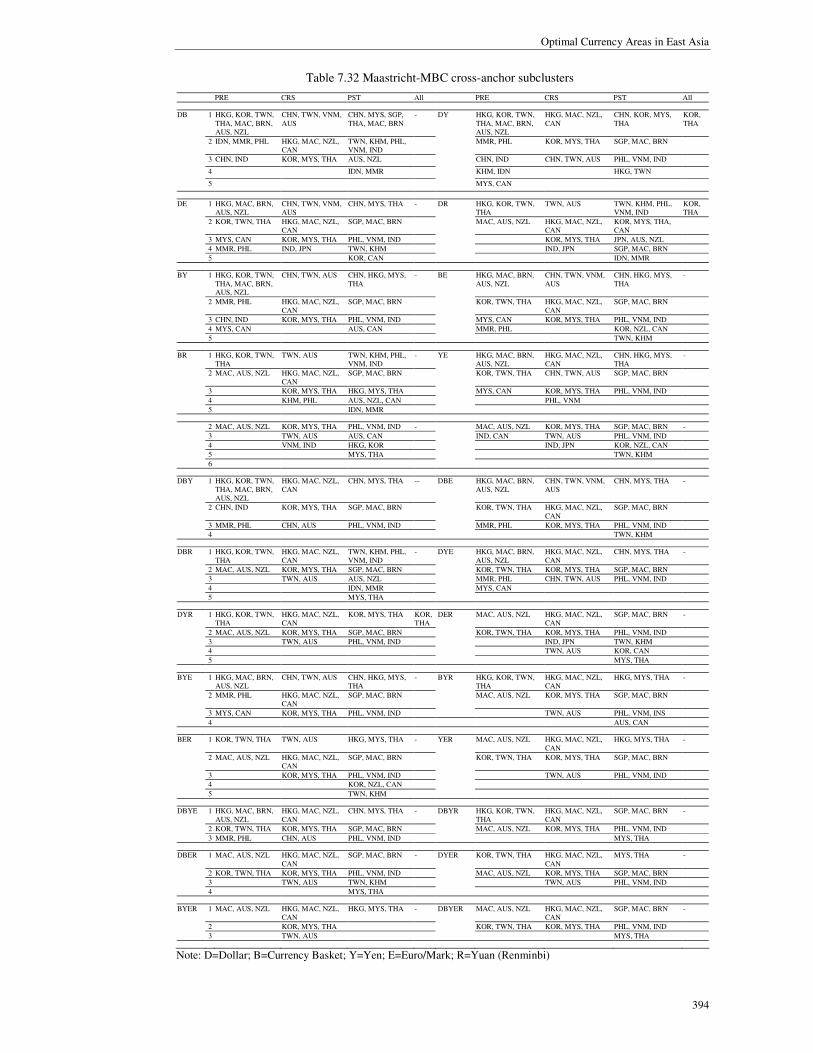
Optimal Currency Areas in East Asia
394
Table 7.32 Maastricht-MBC cross-anchor subclusters
PRE CRS PST All PRE CRS PST All
1 HKG, KOR, TWN, THA, MAC, BRN, AUS, NZL
CHN, TWN, VNM, AUS
CHN, MYS, SGP, THA, MAC, BRN
- HKG, KOR, TWN, THA, MAC, BRN, AUS, NZL
HKG, MAC, NZL, CAN
CHN, KOR, MYS, THA
KOR, THA
2 IDN, MMR, PHL HKG, MAC, NZL, CAN
TWN, KHM, PHL, VNM, IND
MMR, PHL KOR, MYS, THA SGP, MAC, BRN
3 CHN, IND KOR, MYS, THA AUS, NZL CHN, IND CHN, TWN, AUS PHL, VNM, IND
4 IDN, MMR KHM, IDN HKG, TWN
DB
5
DY
MYS, CAN
1 HKG, MAC, BRN, AUS, NZL
CHN, TWN, VNM, AUS
CHN, MYS, THA - HKG, KOR, TWN, THA
TWN, AUS TWN, KHM, PHL, VNM, IND
KOR, THA
2 KOR, TWN, THA HKG, MAC, NZL, CAN
SGP, MAC, BRN MAC, AUS, NZL HKG, MAC, NZL, CAN
KOR, MYS, THA, CAN
3 MYS, CAN KOR, MYS, THA PHL, VNM, IND KOR, MYS, THA JPN, AUS, NZL
4 MMR, PHL IND, JPN TWN, KHM IND, JPN SGP, MAC, BRN
DE
5 KOR, CAN
DR
IDN, MMR
1 HKG, KOR, TWN, THA, MAC, BRN, AUS, NZL
CHN, TWN, AUS CHN, HKG, MYS, THA
- HKG, MAC, BRN, AUS, NZL
CHN, TWN, VNM, AUS
CHN, HKG, MYS, THA
-
2 MMR, PHL HKG, MAC, NZL, CAN
SGP, MAC, BRN KOR, TWN, THA HKG, MAC, NZL, CAN
SGP, MAC, BRN
3 CHN, IND KOR, MYS, THA PHL, VNM, IND MYS, CAN KOR, MYS, THA PHL, VNM, IND
4 MYS, CAN AUS, CAN MMR, PHL KOR, NZL, CAN
BY
5
BE
TWN, KHM
1 HKG, KOR, TWN, THA
TWN, AUS TWN, KHM, PHL, VNM, IND
- HKG, MAC, BRN, AUS, NZL
HKG, MAC, NZL, CAN
CHN, HKG, MYS, THA
-
2 MAC, AUS, NZL HKG, MAC, NZL, CAN
SGP, MAC, BRN KOR, TWN, THA CHN, TWN, AUS SGP, MAC, BRN
3 KOR, MYS, THA HKG, MYS, THA MYS, CAN KOR, MYS, THA PHL, VNM, IND
4 KHM, PHL AUS, NZL, CAN PHL, VNM
BR
5 IDN, MMR
YE
2 MAC, AUS, NZL KOR, MYS, THA PHL, VNM, IND - MAC, AUS, NZL KOR, MYS, THA SGP, MAC, BRN -
3 TWN, AUS AUS, CAN IND, CAN TWN, AUS PHL, VNM, IND
4 VNM, IND HKG, KOR IND, JPN KOR, NZL, CAN
5 MYS, THA TWN, KHM
6
1 HKG, KOR, TWN, THA, MAC, BRN, AUS, NZL
HKG, MAC, NZL, CAN
CHN, MYS, THA -- HKG, MAC, BRN, AUS, NZL
CHN, TWN, VNM, AUS
CHN, MYS, THA -
2 CHN, IND KOR, MYS, THA SGP, MAC, BRN KOR, TWN, THA HKG, MAC, NZL, CAN
SGP, MAC, BRN
3 MMR, PHL CHN, AUS PHL, VNM, IND MMR, PHL KOR, MYS, THA PHL, VNM, IND
DBY
4
DBE
TWN, KHM
1 HKG, KOR, TWN, THA
HKG, MAC, NZL, CAN
TWN, KHM, PHL, VNM, IND
- HKG, MAC, BRN, AUS, NZL
HKG, MAC, NZL, CAN
CHN, MYS, THA -
2 MAC, AUS, NZL KOR, MYS, THA SGP, MAC, BRN KOR, TWN, THA KOR, MYS, THA SGP, MAC, BRN
3 TWN, AUS AUS, NZL MMR, PHL CHN, TWN, AUS PHL, VNM, IND
4 IDN, MMR MYS, CAN
DBR
5 MYS, THA
DYE
1 HKG, KOR, TWN, THA
HKG, MAC, NZL, CAN
KOR, MYS, THA KOR, THA
MAC, AUS, NZL HKG, MAC, NZL, CAN
SGP, MAC, BRN -
2 MAC, AUS, NZL KOR, MYS, THA SGP, MAC, BRN KOR, TWN, THA KOR, MYS, THA PHL, VNM, IND
3 TWN, AUS PHL, VNM, IND IND, JPN TWN, KHM
4 TWN, AUS KOR, CAN
DYR
5
DER
MYS, THA
1 HKG, MAC, BRN, AUS, NZL
CHN, TWN, AUS CHN, HKG, MYS, THA
- HKG, KOR, TWN, THA
HKG, MAC, NZL, CAN
HKG, MYS, THA -
2 MMR, PHL HKG, MAC, NZL, CAN
SGP, MAC, BRN MAC, AUS, NZL KOR, MYS, THA SGP, MAC, BRN
3 MYS, CAN KOR, MYS, THA PHL, VNM, IND
BYR
TWN, AUS PHL, VNM, INS
BYE
4 AUS, CAN
1 KOR, TWN, THA TWN, AUS HKG, MYS, THA - MAC, AUS, NZL HKG, MAC, NZL, CAN
HKG, MYS, THA -
2 MAC, AUS, NZL HKG, MAC, NZL, CAN
SGP, MAC, BRN KOR, TWN, THA KOR, MYS, THA SGP, MAC, BRN
3 KOR, MYS, THA PHL, VNM, IND TWN, AUS PHL, VNM, IND
4 KOR, NZL, CAN
BER
5 TWN, KHM
YER
1 HKG, MAC, BRN, AUS, NZL
HKG, MAC, NZL, CAN
CHN, MYS, THA - HKG, KOR, TWN, THA
HKG, MAC, NZL, CAN
SGP, MAC, BRN -
2 KOR, TWN, THA KOR, MYS, THA SGP, MAC, BRN MAC, AUS, NZL KOR, MYS, THA PHL, VNM, IND
DBYE
3 MMR, PHL CHN, AUS PHL, VNM, IND
DBYR
MYS, THA
1 MAC, AUS, NZL HKG, MAC, NZL, CAN
SGP, MAC, BRN - KOR, TWN, THA HKG, MAC, NZL, CAN
MYS, THA -
2 KOR, TWN, THA KOR, MYS, THA PHL, VNM, IND MAC, AUS, NZL KOR, MYS, THA SGP, MAC, BRN
3 TWN, AUS TWN, KHM TWN, AUS PHL, VNM, IND
DBER
4 MYS, THA
DYER
1 MAC, AUS, NZL HKG, MAC, NZL, CAN
HKG, MYS, THA - MAC, AUS, NZL HKG, MAC, NZL, CAN
SGP, MAC, BRN -
2 KOR, MYS, THA KOR, TWN, THA KOR, MYS, THA PHL, VNM, IND
BYER
3 TWN, AUS
DBYER
MYS, THA
Note: D=Dollar; B=Currency Basket; Y=Yen; E=Euro/Mark; R=Yuan (Renminbi)

A Clustering Approach
395
7.4.2 Assessment of Preparedness
Table 7.33 compares the solutions comprising of Asian cases only with those
comprising of Asian and EMU cases. Associations with the EMU benchmarks are
expected to infer the level of preparedness for EMU-like currency union. Common sets
between the two solutions should indicate sharing of Maastricht features and degree of
preparedness. Columns ‘1’ display the original Asian-only groupings and columns ‘2’
contain the Asian-plus-EMU clusters. The later part of the table displays the common
sets by anchor.
Based on the number of Asian cases linked with the EMU benchmarks in columns 2,
the region could have been more ready for dollar and euro pegs in the pre-crisis period,
for dollar peg in the crisis and the post-crisis period. Those which are linked with
EMU3, the post-euro benchmark might have greater level of preparedness.
In light of this, on the whole the region could have been comparatively prepared by
the US reference.
By looking at the common sets of countries placed in the second part of the table,
against the US reference, Korea and Thailand are shown to have been symmetrical in
the Maastricht dimensions and the degree of preparedness over the periods. For each
period more countries are indicated to share those common features when US is the
reference.
Amongst the common sets, the effective dollar areas of Hong Kong and Macau are
placed together by the US reference for pre-crisis and crisis periods but not for the post-
crisis period. They also share the same grouping by other references but not over
successive periods. The actual monetary union members of Singapore and Brunei are
only indicated to share common Maastricht features and level of preparedness for the
pre-crisis period by the US reference.
Table 7.34 lists the cross-anchor common sets. No linkages are constantly present

Optimal Currency Areas in East Asia
396
over more than one anchor and at the same time over the periods. Notably, for the most
recent period, the post-crisis period China-Malaysia-Thailand and HongKong-Malaysia
subgroups are present across three alternative references.
Table 7.35 exhibits the features of the Asian-plus-EMU clusters. Once again,
Singapore or clusters containing Singapore are associated with more Maastricht-
compliant characteristics.
Table 7.33 Maastricht-MBC preparedness assessment
Dollar Currency Basket Yen Euro Yuan
1 2 1 2 1 2 1 2 1 2
1 HKG, KOR, TWN, MYS, SGP, THA, MAC, BRN, JPN, AUS, NZL, CAN
HKG, KOR,
TWN, SGP,
THA, MAC,
BRN, AUS, NZL, EMU3
HKG, KOR, TWN, THA, MAC, BRN, AUS, NZL
HKG, KOR,
TWN, THA,
MAC, BRN,
AUS, NZL, EMU3
HKG, KOR, TWN, THA, MAC, BRN, AUS, NZL
MYS, CAN, EMU1, EMU2
HKG, MAC, BRN, AUS, NZL
HKG, KOR,
TWN, MYS,
SGP, THA,
IND, MAC,
BRN, AUS,
NZL, CAN, EMU1, EMU2
HKG, KOR, TWN, THA
HKG, KOR, TWN, MYS, MMR, PHL, SGP,THA, IND, MAC, BRN, AUS, NZL, CAN
2 CHN, KHM, IDN, LAO, MMR, PHL,VNM, IND
CHN, MYS,
IND, JPN,
CAN, EMU1, EMU2
IDN, MMR, PHL
MYS, CAN, EMU1, EMU2
MMR, PHL TWN, EMU3 KOR, TWN, THA
CHN, KHM,
IDN, MMR,
PHL, JPN, EMU3
MAC, AUS, NZL
EMU1, EMU2, EMU3
3 IDN, MMR, PHL
MYS, CAN IDN, MMR, PHL
CHN, IND HKG, KOR, THA, MAC, BRN, AUS, NZL
MYS, IND, CAN
LAO, VNM MMR, BRN KHM, IDN, JPN
4 LAO, CHN, IND CHN, IND KHM, IDN MMR, PHL IDN, JPN IND, CAN LAO
5 KHM KHM KHM MYS, CAN CHN, IND MMR, PHL MYS VNM
6 VNM SGP SGP SGP SGP KHM JPN
7 LAO LAO LAO LAO CHN PHL
8 VNM VNM VNM VNM SGP KHM
9 IDN LAO IDN
10 KHM VNM SGP
11 LAO
Pre-crisis
12 VNM
1 CHN, TWN, VNM, AUS
CHN, HKG,
KOR, TWN,
KHM, MYS,
PHL, THA,
VNM, IND,
MAC, JPN,
AUS, NZL,
CAN, EMU1, EMU2, EMU3
CHN, TWN, VNM, AUS
CHN, TWN, VNM, AUS, EMU1, EMU2
HKG, MAC, NZL, CAN
HKG, MAC, NZL, CAN
CHN, TWN, PHL, VNM, AUS
CHN, KOR, TWN, MYS, PHL, THA, VNM, AUS
HKG, MAC, BRN, NZL, CAN
HKG, MAC, CAN, EMU3
2 HKG, MAC, NZL, CAN
SGP, BRN HKG, MAC, NZL, CAN
HKG, MAC, NZL, CAN
PHL, VNM, IND
PHL, VNM, IND
HKG, MAC, NZL, CAN
HKG, MAC, NZL, CAN
KOR, MYS, THA
TWN, AUS, EMU1, EMU2
3 KOR, MYS, PHL, THA
IDN, MMR KOR, MYS, THA,
KOR, MYS, THA
CHN, TWN, AUS
CHN, TWN, AUS
KOR, MYS, THA
EMU1, EMU2 VNM, IND, JPN
VNM, IND, JPN
4 IND, JPN LAO KHM, PHL KHM, PHL KOR, MYS, THA
KOR, MYS, THA
IND, JPN SGP, BRN KHM, PHL KOR, MYS, THA
5 SGP SGP SGP, BRN SGP EMU1, EMU2, EMU3
SGP IND, JPN TWN, AUS KHM, PHL
6 IDN BRN IND BRN SGP BRN LAO MMR SGP, BRN
7 KHM IND MMR KHM BRN IDN MMR SGP MMR
8 LAO MMR IDN MMR KHM KHM IDN IDN NZL
9 MMR IDN LAO IDN MMR LAO EMU3 LAO IDN
10 BRN LAO EMU3 LAO IDN MMR KHM LAO
Crisis
11 LAO

A Clustering Approach
397
Table 7.33 Maastricht-MBC preparedness assessment (continued)
Dollar Currency Basket Yen Euro Yuan
1 2 1 2 1 2 1 2 1 2
1 CHN, KOR, MYS, SGP, THA, MAC, BRN, CAN
CHN, HKG,
KOR, TWN,
KHM, IDN,
MYS, PHL,
THA, VNM,
IND, JPN,
AUS, NZL,
CAN, EMU1, EMU2, EMU3
CHN, HKG, MYS, SGP, THA, MAC, BRN
TWN, AUS,
NZL, CAN, EMU1, EMU2, EMU3
CHN, HKG, KOR, TWN, MYS, THA
CHN, HKG,
KOR, TWN,
MYS, THA, EMU2
CHN, HKG, MYS, THA
CHN, HKG,
MYS, PHL,
THA, VNM,
IND, AUS, EMU2
HKG, KOR, MYS, THA, JPN, AUS, NZL, CAN
HKG, TWN,
MYS, EMU3
2 HKG, TWN, KHM, PHL, VNM, IND
SGP, MAC, BRN
TWN, KHM, PHL, VNM, IND
CHN, HKG, KOR, MYS, SGP, THA, MAC, BRN
SGP, MAC, BRN
SGP, MAC, BRN
SGP, MAC, BRN
KOR, NZL, CAN
TWN, KHM, PHL, VNM, IND
JPN, AUS, EMU1, EMU2
3 JPN, AUS, NZL
LAO, MMR KOR, AUS, NZL, CAN
KHM, PHL, VNM, IND
PHL, VNM, IND
KHM, PHL, VNM, IND
PHL, VNM, IND, AUS
TWN, KHM, JPN
SGP, MAC, BRN
KOR, THA, CAN
4 IDN, MMR IDN, MMR IDN, MMR AUS, CAN AUS, NZL, CAN
TWN, KHM, JPN
SGP, MAC, BRN
IDN, MMR PHL, VNM, IND
5 LAO LAO LAO KHM IDN KOR, NZL, CAN
LAO LAO SGP, MAC, BRN
6 NZL LAO IDN MMR NZL
7 IDN MMR LAO IDN KHM
8 LAO EMU1 MMR EMU1 IDN
9 MMR EMU3 EMU3 LAO
Post-crisis
10 MMR
1 KOR, MYS, THA
HKG, KOR, TWN, THA, AUS, NZL
HKG, MAC TWN, AUS KOR, THA - - - KOR, THA -
All Periods 2 MAC, CAN CHN, MYS,
IND, JPN, CAN
Common sets of countries Dollar Currency Basket Yen Euro Yuan
1 HKG, KOR, TWN, SGP, THA, MAC, BRN, AUS, NZL
HKG, KOR, TWN, THA, MAC, BRN, AUS, NZL
MYS, CAN HKG, MAC, BRN, AUS, NZL
-
2 MYS, JPN, CAN MYS, CAN KOR, TWN, THA
3 CHN, IND MYS, IND, CAN
4 IDN, JPN
Pre-crisis
5 MMR, PHL
1 CHN, TWN, VNM, AUS CHN, TWN, VNM, AUS - - HKG, MAC, CAN
2 HKG, MAC, NZL, CAN TWN, AUS
3 KOR, MYS, PHL, THA Crisis
4 IND, JPN
1 CHN, KOR, MYS, THA, CAN
AUS, NZL, CAN CHN, HKG, KOR, TWN, MYS, THA
CHN, HKG, MYS, THA HKG, MYS
2 HKG, TWN, KHM, PHL, VNM, IND
PHL, VNM, IND, AUS JPN, AUS Post-crisis
3 JPN, AUS, NZL
All Periods
1 KOR, THA - - - -

Optimal Currency Areas in East Asia
398
Table 7.34 Maastricht-MBC-preparedness cross-anchor subclusters
PRE CRS PST All PRE CRS PST All
1 HKG, KOR, TWN, THA, MAC, BRN, AUS, NZL
CHN, TWN, VNM, AUS
AUS, NZL - MYS, CAN - CHN, KOR, MYS, THA
- DB
2 MYS, CAN
DY
HKG, TWN
1 HKG, MAC, BRN, AUS, NZL
- CHN, MYS, THA - - TWN, AUS JPN, AUS -
2 KOR, TWN, THA PHL, VNM, IND HKG, MAC, CAN
DE
3 MYS, IND, CAN
DR
1 MYS, CAN - - - HKG, MAC, BRN, AUS, NZL
- - -
2 KOR, TWN, THA
BY
3
BE
MYS, CAN
BR 1 - TWN, AUS - - YE MYS, CAN - CHN, HKG, MYS, THA
-
YR 1 - - HKG, MYS - ER - - HKG, MYS -
1 MYS, CAN - - - HKG, MAC, BRN, AUS, NZL
- - -
2 KOR, TWN, THA
DBY
3
DBE
MYS, CAN
DBR 1 - TWN, AUS - - DYE MYS, CAN - CHN, MYS, THA -
DYR 1 - - - - DER - - - -
BYE 1 MYS, CAN - - - BYR - - - -
BER 1 - - - - YER - - HKG, MYS -
DBYE 1 MYS, CAN - - - DBYR - - - -
DBER 1 - - - - DYER - - - -
BYER 1 - - - - DBYER - - - -
Note: D=Dollar; B=Currency Basket; Y=Yen; E=Euro/Mark; R=Yuan (Renminbi)
Table 7.35 Maastricht-MBC preparedness clusters
Dollar
Cluster DEF (%)1 INF (%) NER2 INT (%) N3
Pre-crisis
All Cases -1.807 5.411 2.760 4.614
1 HKG, KOR, TWN, SGP, THA, MAC, BRN, AUS, NZL, EMU3 1.034 3.037 .986 2.173 3 2 CHN, MYS, IND, JPN, CAN, EMU1, EMU2 -3.987 3.279 2.717 3.152 0 3 IDN, MMR, PHL -1.402 9.326 1.367 8.799 0 4 LAO, -10.466 16.120 2.778 15.935 0 5 KHM -3.467 2.928 10.921 9.748 1 6 VNM -5.860 24.109 16.810 7.797 0
Crisis
All Cases -1.199 7.269 3.629 4.426
1 CHN, HKG, KOR, TWN, KHM, MYS, PHL, THA, VNM, IND, MAC, JPN, AUS,
NZL, CAN, EMU1, EMU2, EMU3 -1.830 2.795 2.708 2.884 0 2 SGP, BRN 5.867 1.712 2.439 2.289 4 3 IDN, MMR -.867 23.081 9.204 11.840 0 4 LAO -4.645 67.298 11.438 21.618 0
Post-crisis
All Cases -0.787 3.209 1.570 4.528
1 CHN, HKG, KOR, TWN, KHM, IDN, MYS, PHL, THA, VNM, IND, JPN, AUS,
NZL, CAN, EMU1, EMU2, EMU3 -1.802 2.032 1.714 3.724 1 2 SGP, MAC, BRN 6.272 2.462 .871 1.499 3 3 LAO, MMR -2.243 14.922 1.326 16.309 0
Currency Basket
Cluster DEF (%)1 INF (%) NER2 INT (%) N3
Pre-crisis
All Cases -1.829 5.968 4.248 4.917 1 HKG, KOR, TWN, THA, MAC, BRN, AUS, NZL, EMU3 .452 3.587 2.103 2.623 0 2 MYS, CAN, EMU1, EMU2 -4.294 1.705 2.675 1.880 0 3 IDN, MMR, PHL -1.402 10.066 2.690 9.263 0 4 CHN, IND -4.697 8.042 3.975 5.237 0 5 KHM -3.467 3.276 11.193 10.430 0 6 SGP 6.269 1.599 1.955 1.508 4 7 LAO -10.466 16.519 9.182 16.008 0 8 VNM -5.860 24.510 25.481 8.544 0
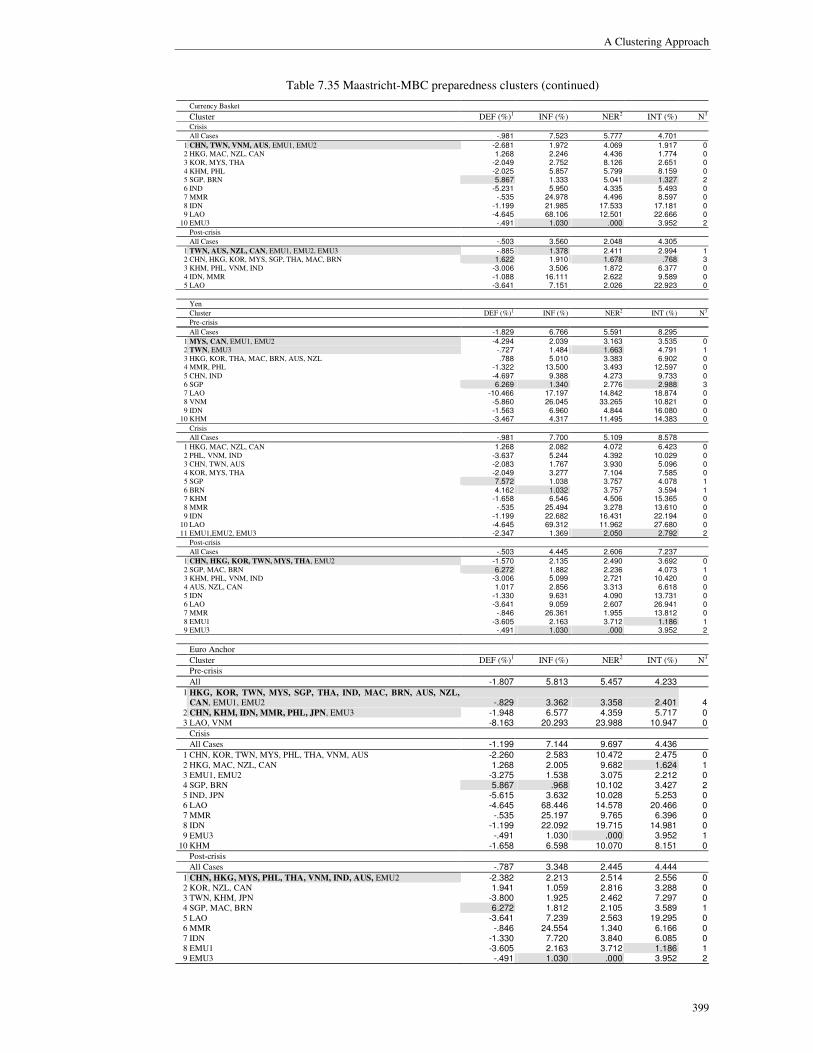
A Clustering Approach
399
Table 7.35 Maastricht-MBC preparedness clusters (continued)
Currency Basket
Cluster DEF (%)1 INF (%) NER2 INT (%) N3
Crisis All Cases -.981 7.523 5.777 4.701
1 CHN, TWN, VNM, AUS, EMU1, EMU2 -2.681 1.972 4.069 1.917 0 2 HKG, MAC, NZL, CAN 1.268 2.246 4.436 1.774 0 3 KOR, MYS, THA -2.049 2.752 8.126 2.651 0 4 KHM, PHL -2.025 5.857 5.799 8.159 0 5 SGP, BRN 5.867 1.333 5.041 1.327 2 6 IND -5.231 5.950 4.335 5.493 0 7 MMR -.535 24.978 4.496 8.597 0 8 IDN -1.199 21.985 17.533 17.181 0 9 LAO -4.645 68.106 12.501 22.666 0
10 EMU3 -.491 1.030 .000 3.952 2
Post-crisis
All Cases -.503 3.560 2.048 4.305
1 TWN, AUS, NZL, CAN, EMU1, EMU2, EMU3 -.885 1.378 2.411 2.994 1 2 CHN, HKG, KOR, MYS, SGP, THA, MAC, BRN 1.622 1.910 1.678 .768 3 3 KHM, PHL, VNM, IND -3.006 3.506 1.872 6.377 0 4 IDN, MMR -1.088 16.111 2.622 9.589 0 5 LAO -3.641 7.151 2.026 22.923 0
Yen
Cluster DEF (%)1 INF (%) NER2 INT (%) N3
Pre-crisis
All Cases -1.829 6.766 5.591 8.295
1 MYS, CAN, EMU1, EMU2 -4.294 2.039 3.163 3.535 0 2 TWN, EMU3 -.727 1.484 1.663 4.791 1 3 HKG, KOR, THA, MAC, BRN, AUS, NZL .788 5.010 3.383 6.902 0 4 MMR, PHL -1.322 13.500 3.493 12.597 0 5 CHN, IND -4.697 9.388 4.273 9.733 0 6 SGP 6.269 1.340 2.776 2.988 3 7 LAO -10.466 17.197 14.842 18.874 0 8 VNM -5.860 26.045 33.265 10.821 0 9 IDN -1.563 6.960 4.844 16.080 0
10 KHM -3.467 4.317 11.495 14.383 0
Crisis All Cases -.981 7.700 5.109 8.578
1 HKG, MAC, NZL, CAN 1.268 2.082 4.072 6.423 0 2 PHL, VNM, IND -3.637 5.244 4.392 10.029 0 3 CHN, TWN, AUS -2.083 1.767 3.930 5.096 0 4 KOR, MYS, THA -2.049 3.277 7.104 7.585 0 5 SGP 7.572 1.038 3.757 4.078 1 6 BRN 4.162 1.032 3.757 3.594 1 7 KHM -1.658 6.546 4.506 15.365 0 8 MMR -.535 25.494 3.278 13.610 0 9 IDN -1.199 22.682 16.431 22.194 0
10 LAO -4.645 69.312 11.962 27.680 0 11 EMU1,EMU2, EMU3 -2.347 1.369 2.050 2.792 2
Post-crisis
All Cases -.503 4.445 2.606 7.237
1 CHN, HKG, KOR, TWN, MYS, THA, EMU2 -1.570 2.135 2.490 3.692 0 2 SGP, MAC, BRN 6.272 1.882 2.236 4.073 1 3 KHM, PHL, VNM, IND -3.006 5.099 2.721 10.420 0 4 AUS, NZL, CAN 1.017 2.856 3.313 6.618 0 5 IDN -1.330 9.631 4.090 13.731 0 6 LAO -3.641 9.059 2.607 26.941 0 7 MMR -.846 26.361 1.955 13.812 0 8 EMU1 -3.605 2.163 3.712 1.186 1 9 EMU3 -.491 1.030 .000 3.952 2
Euro Anchor
Cluster DEF (%)1 INF (%) NER2 INT (%) N3
Pre-crisis
All -1.807 5.813 5.457 4.233
1 HKG, KOR, TWN, MYS, SGP, THA, IND, MAC, BRN, AUS, NZL,
CAN, EMU1, EMU2 -.829 3.362 3.358 2.401 4 2 CHN, KHM, IDN, MMR, PHL, JPN, EMU3 -1.948 6.577 4.359 5.717 0 3 LAO, VNM -8.163 20.293 23.988 10.947 0
Crisis
All Cases -1.199 7.144 9.697 4.436
1 CHN, KOR, TWN, MYS, PHL, THA, VNM, AUS -2.260 2.583 10.472 2.475 0 2 HKG, MAC, NZL, CAN 1.268 2.005 9.682 1.624 1 3 EMU1, EMU2 -3.275 1.538 3.075 2.212 0 4 SGP, BRN 5.867 .968 10.102 3.427 2 5 IND, JPN -5.615 3.632 10.028 5.253 0 6 LAO -4.645 68.446 14.578 20.466 0 7 MMR -.535 25.197 9.765 6.396 0 8 IDN -1.199 22.092 19.715 14.981 0 9 EMU3 -.491 1.030 .000 3.952 1
10 KHM -1.658 6.598 10.070 8.151 0 Post-crisis
All Cases -.787 3.348 2.445 4.444
1 CHN, HKG, MYS, PHL, THA, VNM, IND, AUS, EMU2 -2.382 2.213 2.514 2.556 0 2 KOR, NZL, CAN 1.941 1.059 2.816 3.288 0 3 TWN, KHM, JPN -3.800 1.925 2.462 7.297 0 4 SGP, MAC, BRN 6.272 1.812 2.105 3.589 1 5 LAO -3.641 7.239 2.563 19.295 0 6 MMR -.846 24.554 1.340 6.166 0 7 IDN -1.330 7.720 3.840 6.085 0 8 EMU1 -3.605 2.163 3.712 1.186 1 9 EMU3 -.491 1.030 .000 3.952 2

Optimal Currency Areas in East Asia
400
Table 7.35 Maastricht-MBC preparedness clusters (continued)
Yuan Anchor
Cluster DEF (%)1 INF (%) NER2 INT (%) N3
Pre-crisis
All Cases -1.702 9.341 6.139 4.312
1 HKG, KOR, TWN, MYS, MMR, PHL, SGP,THA, IND, MAC, BRN, AUS, NZL, CAN -.550 9.444 4.208 2.854 1
2 EMU1, EMU2, EMU3 -2.347 1.369 2.050 2.792 3 3 KHM, IDN, JPN -2.123 9.771 7.359 7.992 0 4 LAO -10.466 16.614 14.963 13.823 0 5 VNM -5.860 23.264 32.948 7.269 0
Crisis
All Cases -1.140 7.934 3.795 5.247
1 HKG, MAC, CAN, EMU3 .695 2.009 .420 2.467 1 2 TWN, AUS, EMU1, EMU2 -2.573 1.927 2.740 1.842 0 3 VNM, IND, JPN -4.840 4.279 2.163 4.957 0 4 KOR, MYS, THA -2.049 3.545 6.491 3.348 0 5 KHM, PHL -2.025 6.368 3.384 8.935 0 6 SGP, BRN 5.867 1.172 2.438 .509 3 7 MMR -.535 25.923 1.732 9.373 0 8 NZL 1.800 1.852 3.386 3.625 0 9 IDN -1.199 23.022 16.679 17.957 0
10 LAO -4.645 69.459 11.440 23.443 0
Post-crisis
All Cases -.759 3.694 1.669 4.527
1 HKG, TWN, MYS, EMU3 -2.009 1.808 .569 2.106 2 2 JPN, AUS, EMU1, EMU2 -3.706 1.964 2.927 2.930 0 3 KOR, THA, CAN .560 2.108 2.006 .779 0 4 PHL, VNM, IND -3.292 3.665 1.167 5.118 0 5 SGP, MAC, BRN 6.272 1.889 .946 .725 2 6 NZL 3.501 2.083 3.338 5.494 0 7 KHM -2.149 2.651 .722 11.254 0 8 IDN -1.330 7.336 3.680 9.854 0 9 LAO -3.641 7.225 1.345 23.092 0
10 MMR -.846 23.901 1.285 9.884 0
Note: 1 Positive value indicates surplus. 2 Standard deviation (x102) of the log difference in bilateral nominal exchange rate. 3 Number of variables with highest degree of conformity to Maastricht Treaty. Source: Fuzzy cluster analysis. See Appendix A for data description.
7.4.3 Recapitulation
The section has discussed the results using model-based cluster analysis and Maastricht
criteria. The following observations may be noteworthy.
Classifications
Based on the average silhouettes over all objects, the Japan-based solution consistently
provides the best classification for all the periods and based on the structure of the
partitioning, on the whole the US and G3 references are compatible with more
convergent configurations.
Amongst subgroups which are stable over periods, notably Korea and Thailand
share the same cluster by the US, Japan, or China reference. There are also linkages
which are stable over all anchors for the post-crisis period: Singapore, Macau, and
Brunei; Philippines, Vietnam, and India; and Malaysia and Thailand.
Remarkably, by the basket anchor Hong Kong and Macau the effective dollar areas

A Clustering Approach
401
are grouped together over the periods. For Singapore and Brunei, they are placed
together for pre-crisis dollar anchor and over all anchors for the post-crisis period.
Assessment of Preparedness
Based on the number of Asian cases linked with the EMU benchmarks, on the whole the
region could have been comparatively prepared by the US reference.
Korea and Thailand are shown to have been symmetrical in the Maastricht
dimensions and the degree of preparedness over the periods by the US reference.
The effective dollar areas of Hong Kong and Macau are placed together by the US
reference for pre-crisis and crisis periods but not for the post-crisis period. The actual
monetary union members of Singapore and Brunei are only indicated to share common
Maastricht features and level of preparedness for the pre-crisis period by the US
reference.
For the post-crisis period, China, Malaysia, and Thailand, and Hong Kong and
Malaysia are present across three alternative reference countries.
By and large, Singapore alone or groups containing Singapore show more
conforming Maastricht attributes.

Optimal Currency Areas in East Asia
402
7.5 Comparisons across Methods
The previous sections have presented the results from three cluster analysis methods,
namely hierarchical cluster analysis (HCM), fuzzy cluster analysis (FCM), and model-
based cluster analysis (MBC) using Maastricht dimensions and the findings are
somewhat different over the methods, most probably due to differences in the
methodologies and algorithms used by the methods. The following general observations
may be noteworthy.
• Based on the average silhouettes over all objects, the reference country consistent
with best partitioning differs depending on period for HCM and FCM but for MBC
the Japan-based solution consistently provides the best classification over the
periods.
• By HCM, the Japan reference is associated with more convergent arrangements; by
FCM, that kind of reference differs for different period; and by MBC, the US and
G3 references are compatible with more convergent configurations.
• Based on the number of countries associated with EMU benchmarks, the region
could have been more prepared for dollar, basket, or yen peg by HCM; for dollar or
basket peg by FCM; and for dollar peg by MBC. Dollar peg seems to be commonly
indicated as more feasible.
• By HCM, Korea and Thailand, and Taiwan and Australia are suggested to have
constantly shared common Maastricht features and degrees of preparedness by the
US and the Japan reference respectively. By FCM, no countries are shown to have
consistently shared those common features and simultaneously over the periods. By
MBC, Korea and Thailand are shown to have always possessed those common
features by the US reference, similar to that found by HCM.
The succeeding discussions compare the findings across the methods in greater detail
and identify the subgroupings which are robust over the methods.

A Clustering Approach
403
7.5.1 Classifications and PCA
The first part of Table 7.36 collects the individual silhouettes of the countries by HCM,
FCM, and MBC. Similar to the OCA analysis, silhouette width is used here to assess the
results over clustering methods. A high positive silhouette for an object indicates that it
is more appropriately classified, that is, more tightly associated with its assigned cluster.
The second part of Table 7.36 shows the average number of clusters and some
measures based on the silhouettes by reference country, period, and method.
Looking at the first item, the average number of clusters over methods, increasingly
convergent configuration approximated by consistently fewer clusters over the periods
can be observed when the reference of Germany/EMU is used. Meantime, the greatest
reduction in the number of clusters from the pre-crisis to the post-crisis period is shown
by China reference. Based on the averages over periods, the smallest number of clusters
is seen by the US and the G3 reference.
From the second item, the average number of clusters over periods by method, over
the reference countries FCM is associated with the fewest clusters. Akin to the OCA
findings, this could be due to the ‘fuzziness’ partitioning approach employed by FCM.
Based on the rest of the items which are measured over periods, the percentage of
positive individual silhouettes, mean silhouette, and median silhouette, the euro anchor
and the HCM are consistent with the most fitting partitions as signified by generally
higher silhouettes associated with them though more positive silhouettes are produced
by FCM.
In brief, on average the US and G3 references are relatively consistent with most
symmetrical solutions whilst the Germany/EMU reference and HCM are relatively
compatible with partitions that best fit the inherent structure of the data.
Despite the above, it is still compelling to compare the cluster solutions across the
methods and identify subsets of countries which consistently appear across the three
Optimal Currency Areas in East Asia
404
methods. These subgroupings can be regarded as ‘robust’ over the clustering methods.
Table 7.37 compares the US-based solutions over the methods. Figure 7.17 exhibits
the principal component analysis (PCA) plots, one way to view the spatial distances
between the objects. Tables E.17-E.20 and Figures E.5-E.8 in Appendix E present the
findings by the rest of the anchors.
Similar to the OCA findings, when PCA plot is used as a reference, the clustering
methods appear to have partitioned the data quite differently, justifying the importance
to recognize linkages of countries which are robust over the methods. For instance, in
Table 7.37, for the pre-crisis period, MBC generates only two clusters; HCM produces
one large cluster and a few small clusters; while FCM produces a more ‘descending’
distributed configuration. The ways the objects are partitioned can hence be observed by
comparing the configuration structures produced by cluster analysis against the PCA
plots.
Subclusters of countries which stay intact regardless of clustering method are
collected by monetary anchor in Table 7.38. No links are consistently present over the
periods. Hence, it may be useful instead to recognize the links which are robust over the
anchors. Table 7.39 displays the cross-method-and-anchor subclusters.
Amongst the subclusters which are robust across all the anchors, it may be
worthwhile to note those for the post-crisis period; Singapore-Brunei and Philippines-
India. Recall that Singapore and Brunei share common monetary standards in practice.
Notably, notice also that Hong Kong and Macau with prevailing effective dollar
pegs share the same clusters over all anchors except for yuan anchor in the pre-crisis
setting and over all anchors in the crisis period setting. For post-crisis period, Macau is
almost always linked with Singapore and Brunei.

A Clustering Approach
405
Table 7.36 Maastricht silhouettes
Dollar Currency Basket Yen Euro Yuan
HCM
PRE CRS PST PRE CRS PST PRE CRS PST PRE CRS PST PRE CRS PST
Clusters 6 10 10 4 9 9 5 11 5 8 4 10 8 11 10
1 CHN .10 .78 .65 .12 .86 .73 -.04 .89 .77 .00 .88 .52 n.a.1 n.a. n.a. 2 HKG .03 .74 .67 .71 .74 .72 .53 .93 .75 .87 .55 .70 .81 .75 .50 3 KOR .66 .81 .68 .75 .76 .60 .81 .81 .12 .82 .80 .40 .81 .74 .64 4 TWN .65 .80 .53 .76 .83 .05 .76 .91 .69 .69 .87 .90 .73 .89 .46 5 KHM .00 .00 .00 .35 .00 .00 .41 .00 .28 .57 .78 .92 .00 .00 .00 6 IDN .49 .00 .00 .54 .00 .00 .56 .00 .55 .57 .00 .00 .00 .00 .00 7 LAO .00 .00 .00 .00 .00 .00 .00 .00 .00 .00 .00 .00 .00 .00 .00 8 MYS .65 .64 -.10 .58 .45 .09 .55 .60 .83 .53 .86 .04 .57 .28 .31 9 MMR .63 .00 .00 .40 .00 .00 .50 .00 .00 .71 .63 .00 .78 .00 .00
10 PHL .48 .38 .81 .37 .02 .76 .58 .32 .74 .23 .88 .60 .06 .09 .68 11 SGP .00 .00 .74 .51 .00 .90 .00 .00 .88 .00 .00 .87 .00 .00 .84 12 THA .50 .84 -.02 .57 .77 .54 .61 .84 .52 .85 .85 .55 .89 .76 .25 13 VNM .00 .66 .07 .00 .29 -.01 .00 .08 .79 .00 .87 .00 .00 .07 .05 14 IND -.25 .50 .75 -.40 .00 .81 .49 .00 .72 .38 .83 .60 .74 .32 .44 15 MAC -.07 .75 .81 .70 .66 .95 .56 .90 .84 .84 .63 .00 .88 .70 .88 16 BRN .24 .00 .85 .45 .10 .96 .59 .00 .92 .62 -.72 .84 .40 .00 .91 17 JPN .50 .72 .00 n.a.2 n.a. n.a. n.a. n.a. n.a. .49 .78 .00 .22 .00 .00 18 AUS .25 .56 .10 .72 .75 .46 .66 .74 .46 .85 .84 .20 .90 .85 .32 19 NZL .45 .05 .00 .62 .81 .00 .66 .81 .23 .84 .31 .57 .77 .20 .00 20 CAN .56 .77 .73 .49 .76 .75 .48 .79 .45 .78 .55 .60 .74 .69 .77
Average .29 .45 .36 .43 .41 .44 .46 .45 .55 .52 .56 .42 .49 .33 .37
FCM Dollar Currency Basket Yen Euro Yuan
PRE CRS PST PRE CRS PST PRE CRS PST PRE CRS PST PRE CRS PST
Clusters 7 7 5 8 4 5 7 6 3 6 6 5 5 6 5
1 CHN -.38 .78 .80 .38 .77 .81 .41 .90 .37 .27 .76 .80 n.a. n.a. n.a. 2 HKG .42 .77 .78 .08 .44 .75 .01 .04 .32 .77 .25 .81 .83 .80 .57 3 KOR -.10 .81 .20 -.34 .20 -.36 -.54 .87 .23 .60 .70 -.50 .81 .77 .36 4 TWN .01 .80 -.37 -.04 .66 .40 -.21 .94 .29 .49 .84 -.81 .73 .07 .66 5 KHM .27 .29 -.08 -.72 .03 .42 -.39 .10 .50 .64 -.02 -.75 .28 .30 .63 6 IDN .08 .11 .33 .00 .07 .36 -.67 .07 .47 .57 .00 .22 .09 .09 .00 7 LAO .00 .47 -.30 .00 .54 -.44 .08 .41 -.04 .00 .00 .00 -.05 .47 -.30 8 MYS .94 .64 .48 .94 -.38 .54 .75 .60 .61 .55 .87 .82 .57 .79 .73 9 MMR .50 .57 .09 .00 .01 -.03 .70 .00 .26 .77 .49 .01 .37 .60 -.01
10 PHL .21 .41 .31 .00 -.05 -.04 .08 -.07 .72 .45 .76 .74 .06 .43 .50 11 SGP .09 .72 .83 .00 .66 .91 .23 .62 .86 .56 .63 .85 -.06 .78 .89 12 THA .60 .84 -.25 .70 -.05 .72 .81 .89 -.03 .74 .77 .59 .89 .78 -.36 13 VNM .00 .66 .53 .00 .74 -.03 .00 -.38 .62 .00 .63 .80 .45 .40 .81 14 IND -.32 .50 .31 .35 .44 .39 .40 .35 .71 .50 .30 .76 .78 .75 .66 15 MAC .25 .75 .81 -.08 .30 .95 -.47 -.21 .81 .84 .05 .76 .90 .82 .90 16 BRN .56 -.05 .90 .79 .80 .97 .87 .72 .86 .60 .75 .91 .09 .29 .93 17 JPN .60 .72 .30 n.a. n.a. n.a. n.a. n.a. n.a. .53 .66 -.63 -.44 .51 -.08 18 AUS .01 .56 .48 -.23 .62 .43 -.53 .84 .67 .79 .77 .67 .90 .21 .31 19 NZL .39 .70 .64 .63 .60 .62 .77 .39 .05 .74 .53 .02 .79 .54 -.06 20 CAN .96 .85 .33 .95 .48 .22 .84 .00 .33 .65 .28 -.07 .76 .81 .58
Average .25 .60 .36 .18 .36 .40 .17 .37 .45 .55 .50 .30 .47 .54 .41
MBC Dollar Currency Basket Yen Euro Yuan
PRE CRS PST PRE CRS PST PRE CRS PST PRE CRS PST PRE CRS PST
Clusters 2 10 5 8 10 5 8 10 9 10 10 8 12 9 5
1 CHN -.48 .78 -.52 .35 .86 -.29 .41 .90 .70 .00 .78 .55 n.a. n.a. n.a. 2 HKG .88 .74 .24 .73 .86 -.06 .77 .93 .71 .60 .91 .54 .24 .57 -.59 3 KOR .91 .81 .20 .75 .86 .41 .79 .87 .37 .74 .78 .50 .63 .85 .18 4 TWN .90 .80 .59 .46 .83 .67 .46 .93 .70 .79 .68 .04 .33 .92 .55 5 KHM .00 .00 .59 .00 .53 .66 .55 .00 .00 .00 .00 .35 .00 .48 .66 6 IDN -.39 .00 -.76 .20 .00 -.71 .28 .00 .00 .38 .00 .00 .00 .00 -.54 7 LAO .46 .00 .00 .00 .00 .00 .00 .00 .00 .00 .00 .00 .00 .00 .00 8 MYS .75 .64 -.71 .92 .59 -.68 .75 .60 -.08 .23 .20 -.06 .00 .43 -.66 9 MMR -.09 .00 .01 .45 .00 -.09 .70 .00 .00 .71 .00 .00 .30 .00 .02
10 PHL -.46 .38 .51 -.05 -.02 .56 .08 -.23 .77 .23 .27 .71 .00 -.19 .53 11 SGP .76 .00 .52 .00 .00 .39 .00 .00 .83 .00 .00 .79 .00 .00 .89 12 THA .87 .84 -.07 .75 .89 -.25 .77 .89 .66 .67 .76 .60 .55 .88 -.21 13 VNM .37 .66 .69 .00 .29 .71 .00 .04 .62 .00 .68 -.01 .00 -.34 .76 14 IND -.35 .50 .67 .37 .00 .77 .34 .55 .70 .38 .04 .54 .45 .64 .72 15 MAC .89 .75 .37 .78 .88 .40 .85 .90 .77 .31 .93 .50 .43 .45 .90 16 BRN .81 .00 .50 .72 .00 .30 .82 .00 .90 .09 .00 .86 .70 .01 .93 17 JPN .78 .72 -.05 n.a. n.a. n.a. n.a. n.a. n.a. .58 .59 .49 .00 .54 -.24 18 AUS .90 .56 .55 .83 .75 .59 .89 .84 .38 .10 .64 .34 .49 .85 .29 19 NZL .88 .05 .08 .86 .54 .72 .87 .81 .00 .49 .86 .73 .49 .54 .15 20 CAN .64 .77 -.07 .93 .84 .76 .84 .79 .63 .78 .85 .64 .38 .56 .36 Average .46 .45 .17 .48 .46 .26 .54 .46 .46 .35 .45 .41 .26 .38 .25
Note: 1 ‘n.a.’ for not applicable.

Optimal Currency Areas in East Asia
406
Table 7.36 Maastricht silhouettes (continued)
Aggregate measures
Dollar Basket Yen Euro Yuan Average
Pre-crisis 5.0 6.7 6.7 8.0 8.3 6.9 Crisis 9.0 7.7 9.0 6.7 8.7 8.2
1 Average number of clusters over methods
Post-crisis 6.7 6.3 5.7 7.7 6.7 6.6 Average 6.9 6.9 7.1 7.5 7.9
HCM 8.7 7.3 7.0 7.3 9.7 8.0 FCM 6.3 5.7 5.3 5.7 5.3 5.7
2 Average number of clusters over periods
MBC 5.7 7.7 9.0 9.3 8.7 8.1 Average 6.9 6.9 7.1 7.5 7.9
HCM 66.7 73.7 77.2 76.7 68.4 72.5 FCM 83.3 66.7 75.4 81.7 84.2 78.3
3 Positive individual silhouettes (%) over periods
MBC 68.3 66.7 71.9 73.3 64.9 69.0 Average 72.8 69.0 74.8 77.2 72.5
HCM .37 .43 .49 .50 .40 .44 FCM .44 .31 .33 .45 .47 .40
4 Mean silhouette over periods
MBC .40 .40 .49 .40 .30 .40 Average .40 .38 .43 .45 .39
HCM .49 .51 .56 .60 .32 .50 FCM .48 .38 .37 .60 .57 .48
5 Median silhouette over periods
MBC .51 .46 .63 .49 .36 .49 Average .49 .45 .52 .56 .42
Table 7.37 Maastricht-dollar cross-method subclusters
HCM SW FCM SW MBC SW Cross-method
1 CHN, HKG, KOR, TWN, MYS, THA, IND, MAC, BRN, JPN, AUS, NZL, CAN
.33 HKG, KOR, TWN, SGP, MAC, AUS
.11 HKG, KOR, TWN, MYS, SGP, THA, MAC, BRN, JPN, AUS, NZL, CAN
.83 HKG, KOR, TWN, MAC, AUS
2 IDN, MMR, PHL .53 THA, BRN, JPN, NZL .54 CHN, KHM, IDN, LAO, MMR, PHL,VNM, IND
-.10 THA, BRN, JPN, NZL
3 SGP .00 CHN, KHM, IND -.14 IDN, MMR, PHL
4 KHM .00 IDN, MMR, PHL .26 CHN, IND
5 LAO .00 MYS, CAN .95 MYS, CAN
6 VNM .00 LAO .00
Pre-crisis
7 VNM .00
Average .29 .25 .46
1 HKG, MAC, NZL, CAN .58 HKG, MAC, NZL, CAN .77 HKG, MAC, NZL, CAN .58 HKG, MAC, NZL, CAN
2 CHN, TWN, VNM, AUS .70 CHN, TWN, VNM, AUS .70 CHN, TWN, VNM, AUS .70 CHN, TWN, VNM, AUS
3 KOR, THA, MYS, PHL .67 KOR, THA, MYS, PHL .67 KOR, MYS, PHL, THA .67 KOR, THA, MYS, PHL
4 IND, JPN .61 IND, JPN .61 IND, JPN .61 IND, JPN
5 SGP .00 SGP, BRN .34 SGP .00
6 BRN .00 KHM, MMR .43 BRN .00
7 KHM .00 IDN, LAO .29 KHM .00
8 MMR .00 MMR .00
9 IDN .00 IDN .00
Crisis
10 LAO .00 LAO .00
Average .45 .60 .45
1 KOR, CAN, THA, AUS .37 TWN, KHM, PHL, THA, IND, JPN
.04 CHN, KOR, MYS, SGP, THA, MAC, BRN, CAN
.03 SGP, BRN, MAC
2 CHN, HKG, MYS, VNM .00 KOR, IDN, AUS, NZL, CAN
.40 HKG, TWN, KHM, PHL, VNM, IND,
.55 TWN, PHL, IND
3 TWN, PHL, IND .70 CHN, HKG, MYS, VNM .65 JPN, AUS, NZL .19 KOR, CAN
4 SGP, BRN, MAC .33 SGP, BRN, MAC .85 IDN, MMR -.37 CHN, MYS
5 KHM .00 LAO, MMR -.10 LAO .00 HKG, VNM
6 MMR .00
7 IDN .80
8 LAO .00
9 JPN .00
Post-crisis
10 NZL .00
Average .36 .36 .17
1 KOR, THA - KOR, MYS, THA - All Periods 2 MAC, CAN

A Clustering Approach
407
2.01.00.0-1.0-2.0-3.0
PC2
5.0
4.0
3.0
2.0
1.0
0.0
-1.0
-2.0
PC
1
CAN
NZL
AUS
JPN
BRN
MAC
IND
VNM
THA
SGP
PHL
MMR
MYS
LAO
IDN
KHM
TWN KOR
HKG
CHN
Pre-crisis
2.01.00.0-1.0-2.0
PC2
6.0
4.0
2.0
0.0
-2.0
PC
1
CAN
NZL
AUS
JPN
BRN MAC
IND
VNM
THA
SGP
PHLMMR
MYS
LAO
IDN
KHM
TWN
KOR
HKG
CHN
4.03.02.01.00.0-1.0-2.0
PC2
2.0
1.0
0.0
-1.0
-2.0
-3.0
PC
1
CANNZL
AUS
JPN
BRN MAC
IND
VNM
THA
SGP
PHL
MMR
MYS
LAO
IDN
KHM
TWN
KOR HKG
CHN
Crisis Post-crisis Figure 7.17 Maastricht-dollar PCA plots
Table 7.38 Maastricht cross-method subclusters
Dollar Currency Basket Yen Euro Yuan
1 HKG, KOR, TWN, MAC, AUS
HKG, KOR, TWN, MAC, AUS
HKG, KOR, TWN, MAC, AUS
HKG, MAC, BRN, AUS, NZL
HKG, KOR, TWN, THA
2 THA, BRN, JPN, NZL THA, BRN, NZL THA, BRN, NZL KOR, TWN, THA MAC, AUS, NZL
3 IDN, MMR, PHL MYS, CAN KHM, IDN MYS, IND, CAN MMR, BRN
4 CHN, IND CHN, IND MMR, PHL IDN, JPN IND, CAN
5 MYS, CAN MYS, CAN MMR, PHL
Pre-crisis
6 CHN, IND
1 HKG, MAC, NZL, CAN HKG, MAC, NZL, CAN HKG, MAC, NZL, CAN CHN, TWN, PHL, VNM, AUS
HKG, MAC, NZL, CAN
2 CHN, TWN, VNM, AUS CHN, TWN, VNM, AUS CHN, TWN, AUS HKG, MAC, NZL, CAN KOR, MYS, THA
3 KOR, THA, MYS, PHL KOR, THA, MYS KOR, THA, MYS KOR, THA, MYS VNM, IND
Crisis
4 IND, JPN PHL, VNM IND, JPN
1 SGP, BRN, MAC CHN, HKG, THA, MYS CHN, HKG, TWN, MYS, THA
CHN, HKG, THA KOR, CAN, AUS
2 TWN, PHL, IND KOR, AUS, CAN SGP, BRN, MAC PHL, IND, AUS TWN, PHL, IND
3 KOR, CAN SGP, BRN, MAC PHL, VNM, IND KOR, NZL, CAN SGP, MAC, BRN
4 CHN, MYS PHL, IND AUS, CAN SGP, BRN HKG, MYS
Post-crisis
5 HKG, VNM TWN, KHM
All Periods
1 - - - - -

Optimal Currency Areas in East Asia
408
Table 7.39 Maastricht cross-method-anchor subclusters
PRE CRS PST All PRE CRS PST All
1 HKG, KOR, TWN, MAC, AUS
HKG, MAC, NZL, CAN
SGP, BRN, MAC - HKG, KOR, TWN, MAC, AUS
HKG, MAC, NZL, CAN
SGP, BRN, MAC -
2 THA, BRN, NZL CHN, TWN, VNM, AUS
PHL, IND THA, BRN, NZL CHN, TWN, AUS PHL, IND
3 CHN, IND KOR, THA, MYS KOR, CAN MMR, PHL KOR, THA, MYS CHN, MYS
4 MYS, CAN CHN, IND
DB
5
DY
MYS, CAN
1 HKG, MAC, AUS HKG, MAC, NZL, CAN
SGP, BRN - HKG, KOR, TWN HKG, MAC, NZL, CAN
SGP, MAC, BRN -
2 KOR, TWN CHN, TWN, VNM, AUS
PHL, IND MAC, AUS KOR, MYS, THA TWN, PHL, IND
3 MMR, PHL KOR, THA, MYS KOR, CAN KOR, CAN
4 IND, JPN
DE
5 MYS, CAN
DR
1 HKG, KOR, TWN, MAC, AUS
HKG, MAC, NZL, CAN
CHN, HKG, THA, MYS
- HKG, MAC, AUS HKG, MAC, NZL, CAN
CHN, HKG, THA -
2 THA, BRN, NZL CHN, TWN, AUS AUS, CAN KOR, TWN CHN, TWN, VNM, AUS
KOR, CAN
3 MYS, CAN KOR, THA, MYS SGP, BRN, MAC MYS, CAN KOR THA, MYS SGP, BRN
BY
4 CHN, IND PHL, IND
BE
PHL, IND
1 HKG, KOR, TWN HKG, MAC, NZL, CAN
HKG, MYS - HKG, MAC, AUS HKG, MAC, NZL, CAN
CHN, HKG, THA -
2 MAC, AUS KOR, THA, MYS KOR, AUS, CAN KOR, TWN CHN, TWN, AUS SGP, BRN
3 SGP, MAC, BRN MMR, PHL KOR, THA, MYS PHL, IND
BR
4
YE
MYS, CAN PHL, VNM
1 HKG, KOR, TWN HKG, MAC, NZL, CAN
SGP, MAC, BRN - KOR, TWN, THA HKG, MAC, NZL, CAN
PHL, IND -
2 MAC, AUS KOR, THA, MYS HKG, MYS MAC, AUS, NZL KOR, THA, MYS KOR, CAN
YR
3 AUS, CAN
ER
IND, CAN SGP, BRN
1 HKG, KOR, TWN, MAC, AUS
HKG, MAC, NZL, CAN
SGP, BRN, MAC - HKG, MAC, AUS HKG, MAC, NZL, CAN
SGP, BRN -
2 THA, BRN, NZL CHN, TWN, AUS PHL, IND KOR, TWN CHN, TWN, VNM, AUS
PHL, IND
3 MYS, CAN KOR, THA, MYS BRN, NZL KOR, THA, MYS KOR, CAN
4 CHN, IND MYS, CAN
DBY
5 MYS, CAN
DBE
1 HKG, KOR, TWN HKG, MAC, NZL, CAN
SGP, MAC, BRN - HKG, MAC, AUS HKG, MAC, NZL, CAN
SGP, BRN -
2 MAC, AUS KOR, THA, MYS PHL, IND KOR, TWN CHN, TWN, AUS PHL, IND
3 KOR, CAN BRN, NZL KOR, THA, MYS
4 MMR, PHL
DBR
5
DYE
MYS, CAN
1 HKG, KOR, TWN HKG, MAC, NZL, CAN
SGP, MAC, BRN MAC, AUS HKG, MAC, NZL, CAN
SGP, BRN -
2 MAC, AUS KOR, THA, MYS PHL, IND KOR, TWN KOR, THA, MYS PHL, IND
DYR
3
DER
KOR, CAN
1 HKG, MAC, AUS HKG, MAC, NZL, CAN
CHN, HKG, THA - HKG, KOR, TWN HKG, MAC, NZL, CAN
SGP, MAC, BRN -
2 KOR, TWN CHN, TWN, AUS SGP, BRN MAC, AUS KOR, THA, MYS AUS, CAN
3 BRN, NZL KOR, THA, MYS PHL, IND HKG, MYS
BYE
4 MYS, CAN
BYR
PHL, IND
1 MAC, AUS HKG, MAC, NZL, CAN
KOR, CAN - MAC, AUS HKG, MAC, NZL, CAN
SGP, BRN -
2 KOR, TWN KOR, THA, MYS SGP, BRN KOR, TWN KOR, THA, MYS PHL, IND
BER
3 PHL, IND
YER
1 HKG, MAC, AUS HKG, MAC, NZL, CAN
SGP, BRN - HKG, KOR, TWN HKG, MAC, NZL, CAN
SGP, MAC, BRN -
2 KOR, TWN CHN, TWN, AUS PHL, IND MAC, AUS KOR, THA, MYS PHL, IND
3 BRN, NZL KOR, THA, AUS
DBYE
4 MYS, CAN
DBYR
1 MAC, AUS HKG, MAC, NZL, CAN
SGP, BRN - MAC, AUS HKG, MAC, NZL, CAN
SGP, BRN -
2 KOR, TWN KOR, THA, MYS PHL, IND KOR, TWN KOR, THA, MYS PHL, IND
DBER
3 KOR, CAN
DYER
1 MAC, AUS HKG, MAC, NZL, CAN
SGP, BRN - MAC, AUS HKG, MAC, NZL, CAN
SGP, BRN - BYER
2 KOR, TWN KOR, THA, MYS PHL, IND
DBYER
KOR, TWN KOR, THA, MYS PHL, IND
Note: D=Dollar; B=Currency Basket; Y=Yen; E=Euro/Mark; R=Yuan (Renminbi)
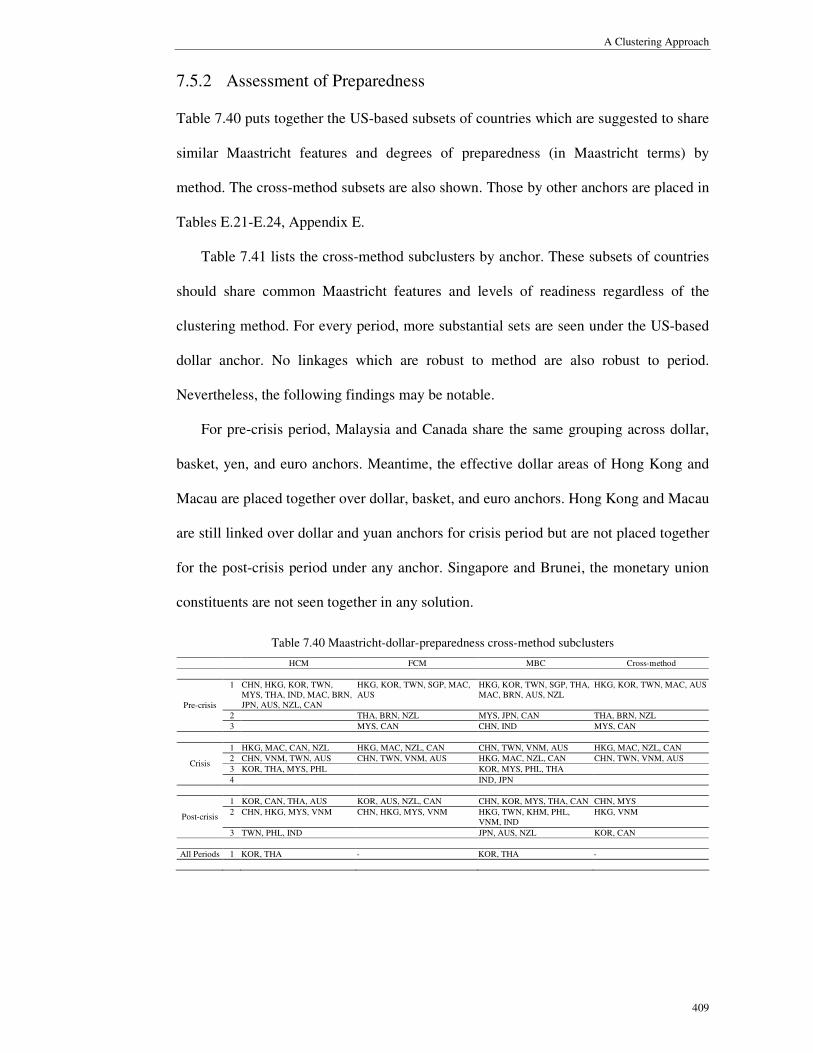
A Clustering Approach
409
7.5.2 Assessment of Preparedness
Table 7.40 puts together the US-based subsets of countries which are suggested to share
similar Maastricht features and degrees of preparedness (in Maastricht terms) by
method. The cross-method subsets are also shown. Those by other anchors are placed in
Tables E.21-E.24, Appendix E.
Table 7.41 lists the cross-method subclusters by anchor. These subsets of countries
should share common Maastricht features and levels of readiness regardless of the
clustering method. For every period, more substantial sets are seen under the US-based
dollar anchor. No linkages which are robust to method are also robust to period.
Nevertheless, the following findings may be notable.
For pre-crisis period, Malaysia and Canada share the same grouping across dollar,
basket, yen, and euro anchors. Meantime, the effective dollar areas of Hong Kong and
Macau are placed together over dollar, basket, and euro anchors. Hong Kong and Macau
are still linked over dollar and yuan anchors for crisis period but are not placed together
for the post-crisis period under any anchor. Singapore and Brunei, the monetary union
constituents are not seen together in any solution.
Table 7.40 Maastricht-dollar-preparedness cross-method subclusters
HCM FCM MBC Cross-method
1 CHN, HKG, KOR, TWN, MYS, THA, IND, MAC, BRN, JPN, AUS, NZL, CAN
HKG, KOR, TWN, SGP, MAC, AUS
HKG, KOR, TWN, SGP, THA, MAC, BRN, AUS, NZL
HKG, KOR, TWN, MAC, AUS
2 THA, BRN, NZL MYS, JPN, CAN THA, BRN, NZL
Pre-crisis
3 MYS, CAN CHN, IND MYS, CAN
1 HKG, MAC, CAN, NZL HKG, MAC, NZL, CAN CHN, TWN, VNM, AUS HKG, MAC, NZL, CAN
2 CHN, VNM, TWN, AUS CHN, TWN, VNM, AUS HKG, MAC, NZL, CAN CHN, TWN, VNM, AUS
3 KOR, THA, MYS, PHL KOR, MYS, PHL, THA Crisis
4 IND, JPN
1 KOR, CAN, THA, AUS KOR, AUS, NZL, CAN CHN, KOR, MYS, THA, CAN CHN, MYS
2 CHN, HKG, MYS, VNM CHN, HKG, MYS, VNM HKG, TWN, KHM, PHL, VNM, IND
HKG, VNM Post-crisis
3 TWN, PHL, IND JPN, AUS, NZL KOR, CAN
All Periods 1 KOR, THA - KOR, THA -
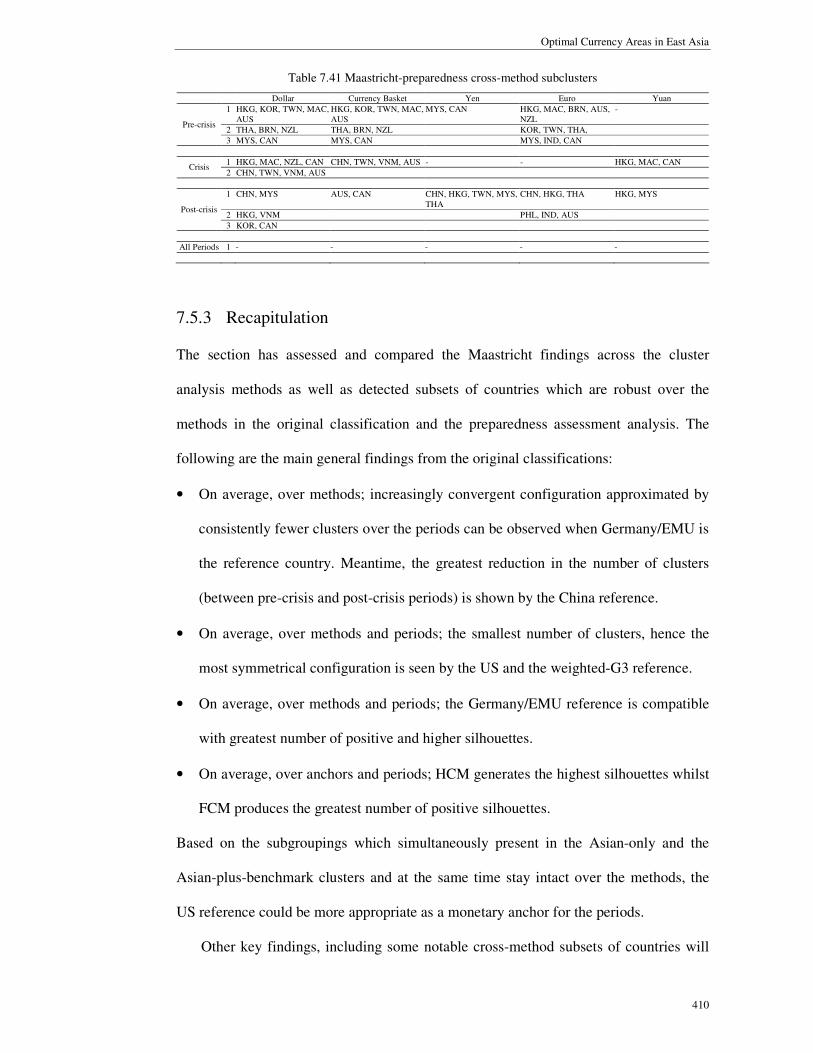
Optimal Currency Areas in East Asia
410
Table 7.41 Maastricht-preparedness cross-method subclusters
Dollar Currency Basket Yen Euro Yuan
1 HKG, KOR, TWN, MAC, AUS
HKG, KOR, TWN, MAC, AUS
MYS, CAN HKG, MAC, BRN, AUS, NZL
-
2 THA, BRN, NZL THA, BRN, NZL KOR, TWN, THA, Pre-crisis
3 MYS, CAN MYS, CAN MYS, IND, CAN
1 HKG, MAC, NZL, CAN CHN, TWN, VNM, AUS - - HKG, MAC, CAN Crisis
2 CHN, TWN, VNM, AUS
1 CHN, MYS AUS, CAN CHN, HKG, TWN, MYS, THA
CHN, HKG, THA HKG, MYS
2 HKG, VNM PHL, IND, AUS Post-crisis
3 KOR, CAN
All Periods 1 - - - - -
7.5.3 Recapitulation
The section has assessed and compared the Maastricht findings across the cluster
analysis methods as well as detected subsets of countries which are robust over the
methods in the original classification and the preparedness assessment analysis. The
following are the main general findings from the original classifications:
• On average, over methods; increasingly convergent configuration approximated by
consistently fewer clusters over the periods can be observed when Germany/EMU is
the reference country. Meantime, the greatest reduction in the number of clusters
(between pre-crisis and post-crisis periods) is shown by the China reference.
• On average, over methods and periods; the smallest number of clusters, hence the
most symmetrical configuration is seen by the US and the weighted-G3 reference.
• On average, over methods and periods; the Germany/EMU reference is compatible
with greatest number of positive and higher silhouettes.
• On average, over anchors and periods; HCM generates the highest silhouettes whilst
FCM produces the greatest number of positive silhouettes.
Based on the subgroupings which simultaneously present in the Asian-only and the
Asian-plus-benchmark clusters and at the same time stay intact over the methods, the
US reference could be more appropriate as a monetary anchor for the periods.
Other key findings, including some notable cross-method subsets of countries will

A Clustering Approach
411
be revisited in Chapter 8 Discussion and Conclusion. The following section compares
the OCA and the Maastricht results.
7.6 OCA and Maastricht Criteria Results Compared
Remember that OCA criteria predominantly represent the real dimensions of
convergence whereas the Maastricht criteria concern more about the nominal facets of
convergence, therefore the differences in the findings are not unexpected. Table 7.42
compares the general findings from the previous discussions. Recall that weighted
criteria and subsidiary analysis on the variables are not implemented for the Maastricht
criteria; hence, comparisons are done on the original classifications and the
preparedness assessment only.
Table 7.42 General findings by OCA and by Maastricht criteria
OCA Maastricht
Original Classification
• Based on the average silhouette over all objects, the reference country consistent with best partitioning differs depending on period for HCM and FCM but for MBC the weighted-G3 reference virtually corresponds to the most appropriate partitions over the periods.
• Based on the average silhouette over all objects, the reference country consistent with best partitioning differs depending on period for HCM and FCM but for MBC the Japan reference consistently corresponds to the most appropriate partitions over the periods.
• By HCM, the G3 reference is associated with relatively convergent arrangements; by FCM, the Germany/EMU reference; and by MBC the G3 reference once again.
• By HCM, the Japan reference is associated with relatively convergent arrangements; by FCM, it differs for different period; and by MBC, the US and G3 references appear to be compatible with more convergent configurations.
Preparedness Assessment
• From preparedness assessment, the region could have been more prepared for basket peg by HCM, for dollar peg by FCM, and for dollar, basket, or euro peg by MBC.
• From preparedness assessment, the region could have been more prepared for dollar, basket, or yen peg by HCM; for dollar or basket peg by FCM; and for dollar peg by MBC. Hence, dollar peg appears to be commonly indicated as more feasible.
• By HCM, Singapore and Malaysia, and Singapore, Korea, Malaysia, and Taiwan are suggested to have constantly shared common OCA features and degrees of preparedness by the dollar and the basket anchor respectively. By FCM no countries are shown to have consistently shared those common features over the periods. By MBC, Hong Kong and Macau, and Singapore and Malaysia are shown to have always possessed those common features by the dollar anchor; the same Singapore-Malaysia link found by HCM.
• By HCM, Korea and Thailand, and Taiwan and Australia are suggested to have constantly shared common Maastricht features and degrees of preparedness by the US and the Japan reference respectively. By FCM, no countries are shown to have consistently shared those common features simultaneously over the periods. By MBC, Korea and Thailand are shown to have always possessed those common features by the US reference, similar to that found by HCM.

Optimal Currency Areas in East Asia
412
Other than the above, it is also informative to compare the solutions between the
sets of criteria in greater detail and identify groupings of countries which are robust to
set of criteria, that is, groupings characterized by similar real OCA and nominal
Maastricht dimensions. The following discussion compares the findings in more detail
over anchors, periods, and methods.
7.6.1 Classifications
Table 7.43 puts together some measures of the original Asian-only results using the
original unweighted variables by OCA and by Maastricht criteria. These measures have
been discussed separately before.
The first item shows the average number of clusters over the clustering methods.
Based on this measure, over the anchors on average, by OCA criteria the number of
clusters falls consistently through the periods (without the post-crisis labor criterion)
whilst by Maastricht criteria the number of clusters is smallest for the post-crisis period
but more clusters are present for the crisis period. On this evidence, the OCA criteria
appear to be relatively compatible with increasingly symmetrical configurations.
The second item displays the average number of clusters over the periods. By any
method, most of the time OCA dimensions are associated with fewer clusters for all
anchors. Over periods and methods, the averages show that OCA criteria are linked with
smaller number of clusters for all anchors except for the dollar anchor. On the average
over the anchors, for both sets of criteria, FCM generates the fewest clusters.
The third, fourth, and fifth items respectively show the percentage of positive
individual silhouettes, mean silhouette, and median silhouette, all of them measured
over periods. Based on these measures, over the anchors, by OCA criteria MBC are
compatible with better classifications whilst by Maastricht criteria HCM generally
provides better partitions. Based on the same measures, over the methods, Maastricht
criteria virtually produce better partitioning for all anchors.
A Clustering Approach
413
Along these lines, in general OCA dimensions are in line with fewer clusters; hence
more convergent configurations whereas Maastricht criteria are associated with better
silhouette measures, hence more appropriate partitioning.
In spite of the above, it is still informative to look at the groupings which are
commonly present in both OCA and Maastricht solutions, these subsets of countries
should be robust to the sets of criteria. For this reason, Tables 7.44, 7.45, and 7.46
respectively bring together the cross-criteria subclusters by HCM, FCM, and MBC. For
post-crisis period, OCA solutions by 7 and by 8 variables are compared to the
Maastricht solutions.
Here are some remarkable findings. By HCM, using 7 variables throughout the
periods Macau and Brunei are found to constantly share the same grouping by the G3
reference. By MBC, Hong Kong and Macau, the effective dollar areas are placed
together over the periods by the G3 reference regardless of the labor criterion. By FCM,
no such stable links can be found. Indeed, the cross-criteria subgroups are substantially
different across methods.
In light of the differences across the methods, it may be compelling to recognize the
cross-criteria subclusters which are also stable across the methods. Table 7.47 displays
the cross-criteria-method subclusters. Countries belonging to the same subclusters
should closely share common OCA and Maastricht features even when different criteria
and/or different cluster analysis approach is used.
No cross-criteria-method subclusters are also robust over periods. The following
groupings which are found over few anchors however may be worth mentioning.
For pre-crisis period, Korea and Taiwan are always connected when measured
against G3, Germany/EMU, and China. Korea and Taiwan, two of the Asian Tigers
could have been highly symmetrical in OCA and Maastricht dimensions against each of
those references before the Asian crisis.

Optimal Currency Areas in East Asia
414
In the crisis period solution, Korea is consistently linked with Malaysia against US,
G3, and Japan. In the pre-crisis setting, Korea is associated with Taiwan against G3,
Germany/EMU, and China. Combining the pre-crisis and crisis period findings, it
demonstrates that Korea might have closely shared those dimensions with Taiwan
against G3, Germany/EMU, and China in the pre-crisis period but with Malaysia against
US, G3, and Japan in the crisis period. Hence, it is possible that an Asian economy
closely shares OCA and Maastricht features with a different Asian economy against
each of a different set of reference economies in a different period.
In the post-crisis 7V solutions, the Chinese economies of China and Hong Kong are
linked by the basket, the yen, and the euro anchor. Hence, they might have been highly
symmetrical in the OCA and Maastricht facets vis-à-vis each of those major economies
in the post-crisis period. In post-crisis 8V setting, China is associated with Taiwan,
another close neighbor, against the G3 and the Japan reference.
How about economies associated with fixed exchange rates in practice? As shown
by the findings, the effective dollar areas of Hong Kong and Macau are indicated to
closely share common OCA and Maastricht dimensions against US in the pre-crisis and
crisis periods regardless of method. The two neighboring economies are also linked
against Japan in the pre-crisis setting and against China in the crisis period setting. This
exhibits that two Asian economies with similar exchange rate policies (in this case
Hong Kong and Macau with effective dollar pegs) could jointly experience similar OCA
and Maastricht features vis-à-vis each of a different set of reference economies in a
different period (US and Japan for pre-crisis period and US and China for crisis period).
Singapore and Brunei, the prevailing monetary union members are not shown to
share any robust groupings here.

A Clustering Approach
415
Table 7.43 OCA and Maastricht solutions compared
OCA Maastricht
Dollar Basket Yen Euro Yuan Avg. Dollar Basket Yen Euro Yuan Avg.
1 PRE 7.3 4.7 8.0 5.7 8.7 6.9 5.0 6.7 6.7 8.0 8.3 6.9 CRS 7.0 6.0 5.3 7.3 6.3 6.4 9.0 7.7 9.0 6.7 8.7 8.2
Average number of clusters over methods PST1 7.0 5.3 5.0 5.7 6.0 5.8 6.7 6.3 5.7 7.7 6.7 6.6
Average 7.1 5.3 6.1 6.2 7.0 6.3 6.9 6.9 7.1 7.5 7.9 7.3 2 HCM 8.3 6.7 7.7 10.3 10.0 8.6 8.7 7.3 7.0 7.3 9.7 8.0 FCM 5.7 5.0 4.3 3.7 5.0 4.7 6.3 5.7 5.3 5.7 5.3 5.7
Average number of clusters over periods MBC 7.3 4.3 6.3 4.7 6.0 5.7 5.7 7.7 9.0 9.3 8.7 8.1
Average 7.1 5.3 6.1 6.2 7.0 6.3 6.9 6.9 7.1 7.5 7.9 7.3 3 HCM 70.0 77.2 70.2 68.3 66.7 70.5 66.7 73.7 77.2 76.7 68.4 72.5 FCM 68.3 77.2 75.4 70.0 71.9 72.6 83.3 66.7 75.4 81.7 84.2 78.3
Positive individual silhouettes (%) over periods MBC 75.0 87.7 64.9 81.7 71.9 76.2 68.3 66.7 71.9 73.3 64.9 69.0
Average 71.1 80.7 70.2 73.3 70.2 73.1 72.8 69.0 74.8 77.2 72.5 73.3 4 HCM .32 .37 .34 .29 .30 .32 .37 .43 .49 .50 .40 .44 FCM .22 .24 .26 .26 .21 .24 .44 .31 .33 .45 .47 .40
Mean silhouette over periods
MBC .41 .44 .28 .34 .39 .37 .40 .40 .49 .40 .30 .40 Average .32 .35 .29 .30 .30 .31 .40 .38 .43 .45 .39 .41 5 HCM .38 .43 .43 .26 .36 .37 .49 .51 .56 .60 .32 .50 FCM .31 .32 .36 .32 .23 .31 .48 .38 .37 .60 .57 .48
Median silhouette over periods
MBC .48 .51 .41 .39 .49 .46 .51 .46 .63 .49 .36 .49 Average .39 .42 .40 .32 .36 .38 .49 .45 .52 .56 .42 .49
Note: 1 To ensure consistency over periods, 7-variable post-crisis OCA results are used.
Table 7.44 HCM cross-criteria subclusters
Dollar Currency Basket Yen Euro Yuan
1 HKG, TWN, KOR, MYS, MAC
KOR, MYS, SGP, IND, TWN, CHN, NZL, AUS
TWN, KOR, MYS, AUS KOR, TWN, THA KOR, TWN
2 CHN, IND, AUS, NZL HKG, MAC, BRN, THA PHL, IND MYS, CAN PHL, IND Pre-crisis
3 JPN, THA IDN, KHM HKG, MAC HKG, MAC
1 KOR, MYS, THA, PHL KOR, MYS HKG, MAC, NZL, CAN HKG, JPN, KHM, TWN MYS, THA
2 HKG, MAC CHN, VNM KOR, THA, MYS CHN, PHL, MAC HKG, MAC
3 TWN, VNM MAC, BRN PHL, VNM KOR, MYS, THA KOR, PHL Crisis
4 VNM, NZL
1 CHN, HKG, MYS, VNM CHN, HKG, THA, TWN, MYS, VNM
CHN, TWN, MYS, HKG, THA, VNM, PHL
CHN, HKG TWN, IND
2 TWN, IND SGP, MAC, BRN IND, CAN TWN, KHM Post-crisis 7V
3 PHL, IND
All Periods 7V 1 - MAC, BRN - - -
1 MYS, CHN, VNM MYS, THA, CHN, TWN, VNM
CHN, MYS, TWN, THA, PHL, VNM, IND
KHM, TWN MYS, VNM
2 TWN, IND HKG, KHM HKG, THA THA, IND Post-crisis 8V
3 SGP, MAC
All Periods 8V 1 - - - - -
Table 7.45 FCM cross-criteria subclusters
Dollar Currency Basket Yen Euro Yuan
1 HKG, TWN, SGP, MAC KOR, TWN, SGP CHN, IND HKG, KOR, TWN, SGP, THA, MAC
KOR, TWN
2 THA, BRN, JPN PHL, IND HKG, MAC KHM, JPN SGP, BRN
3 MYS, CAN THA, BRN KOR, TWN CHN, IND LAO, VNM
4 SGP, AUS AUS, NZL MMR, JPN
5 KHM, LAO HKG, MAC
6 THA, BRN PHL, IND
7 MYS, CAN
Pre-crisis
8 AUS, NZL
1 KOR, MYS MMR, PHL, THA KOR, MYS, THA KOR, TWN HKG, MAC
2 SGP, BRN CHN, VNM SGP, BRN THA, VNM, AUS KOR, PHL
3 HKG, MAC MAC, BRN NZL, CAN SGP, BRN, CAN TWN, CAN
4 IDN, LAO KOR, KHM, MYS HKG, MAC CHN, PHL MYS, THA
5 SGP, CAN
Crisis
6 IND, AUS

Optimal Currency Areas in East Asia
416
Table 7.45 FCM cross-criteria subclusters (continued)
1 CHN, HKG, MYS TWN, MYS, THA CHN, HKG, TWN, MYS, PHL, THA, VNM
CHN, HKG, MYS, PHL, THA, VNM, IND
AUS, NZL, CAN
2 IDN, AUS, NZL IDN, AUS, NZL KHM, IND, CAN SGP, BRN HKG, KHM, PHL
3 THA, IND CHN, HKG IDN, AUS, NZL IDN, NZL MAC, BRN
4 TWN, JPN LAO, MMR LAO, MMR TWN, JPN TWN, MYS
5 KHM, PHL SGP, MAC VNM, IND
Post-crisis 7V
6 KOR, BRN
All Periods 7V 1 - - - - -
1 TWN, KHM, PHL CHN, TWN CHN, TWN, IDN, THA, VNM, IND
CHN, MYS, PHL, THA, VNM, IND
TWN, VNM, IND
2 MAC, BRN KHM, VNM HKG, KHM, MYS, CAN KHM, JPN HKG, KHM, MYS
3 CHN, VNM IDN, CAN SGP, MAC SGP, BRN AUS, NZL, CAN
4 THA, IND MYS, THA KOR, BRN SGP, BRN
5 IDN, CAN AUS, NZL LAO, MMR LAO, MMR
Post-crisis 8V
6 HKG, MYS AUS, NZL
All Periods 8V 1 - - - - -
Table 7.46 MBC cross-criteria subclusters
Dollar Currency Basket Yen Euro Yuan
1 HKG, KOR, TWN, MYS, SGP, MAC
KOR, TWN, AUS, NZL HKG, TWN, MAC HKG, MAC, BRN KOR, TWN
2 CHN, IND HKG, THA, MAC, BRN KOR, AUS KOR, TWN, THA AUS, NZL
3 AUS, NZL CHN, IND MYS, CAN
4 KHM, IDN AUS, NZL
Pre-crisis
5 THA, JPN
1 KOR, MYS, PHL, THA CHN, TWN, VNM, AUS KOR, MYS, THA CHN, TWN, PHL TWN, AUS
2 TWN, AUS HKG, MAC, NZL NZL, CAN HKG, MAC NZL, CAN
3 HKG, MAC KOR, MYS, THA MYS, THA HKG, MAC Crisis
4 KHM, PHL IND, JPN
1 CHN, MYS, SGP, THA, MAC
CHN, HKG, MYS, SGP, THA, MAC, BRN
CHN, HKG, TWN, MYS, THA
CHN, HKG, MYS, THA TWN, KHM, PHL, VNM, IND
2 HKG, TWN, KHM, PHL, VNM, IND
TWN, KHM, PHL, VNM, IND
PHL, VNM, IND TWN, KHM, JPN HKG, MYS, THA, JPN
3 KOR, BRN AUS, NZL SGP, MAC NZL, CAN KOR, AUS, NZL, CAN
4 AUS, NZL AUS, CAN SGP, MAC SGP, MAC
5 PHL, VNM IDN, MMR
Post-crisis 7V
6 IND, AUS
All Periods 7V 1 - HKG, MAC - - -
1 CHN, MYS, THA CHN, HKG, MYS, SGP, THA, MAC, BRN
CHN, HKG, TWN, MYS, THA
HKG, MYS, THA HKG, JPN
2 TWN, VNM, IND AUS, NZL PHL, VNM, IND KHM, JPN TWN, KHM
3 KHM, PHL AUS, CAN VNM, IND MYS, THA
4 AUS, NZL SGP, MAC VNM, IND
Post-crisis 8V
5 AUS, NZL
All Periods 8V 1 - HKG, MAC - - -
Table 7.47 Cross-criteria-method subclusters
Dollar Currency Basket Yen Euro Yuan
1 HKG, TWN, MAC KOR, TWN HKG, MAC KOR, TWN, THA KOR, TWN Pre-crisis
2 THA, JPN THA, BRN
1 KOR, MYS KOR, MYS KOR, MYS, THA CHN, PHL HKG, MAC Crisis
2 HKG, MAC CHN, VNM NZL, CAN
1 CHN, MYS CHN, HKG CHN, TWN, MYS, HKG, THA
CHN, HKG - Post-crisis 7V
2 MYS, THA VNM, PHL
All Periods 7V 1 - - - - -
1 - CHN, TWN CHN, TWN, THA - -
2 MYS, THA VNM, IND Post-crisis 8V
3 SGP, MAC
All Periods 8V 1 - - - - -

A Clustering Approach
417
7.6.2 Preparedness Assessment
Table 7.48 collects the subclusters of countries which share common Asian-only and
Asian-plus-benchmark groupings across all clustering methods by OCA and by
Maastricht criteria. Singletons are omitted. Regardless of the post-crisis labor criterion,
no subsets of countries are consistently robust over the periods though relatively more
subsets are seen by the dollar anchor. On the whole, more of these subclusters can be
found by the Maastricht criteria, hence Maastricht criteria are associated with more
subclusters which not only indicated to be symmetrical in respect of convergence
features and levels of preparedness but also which are robust to method.
To view the subgroupings across criteria by method, the cross-criteria sets of
countries are arranged in Table 7.49. Notice that no common sets of countries are
present over all methods or over all periods. Thus, no subsets of countries which are
indicated to be symmetrical in the features and levels of preparedness in both OCA and
Maastricht terms are also at the same time signified to be robust to method or period.
Table 7.48 Preparedness cross-method subclusters
Dollar Currency Basket Yen Euro Yuan
OCA Maastricht OCA Maastricht OCA Maastricht OCA Maastricht OCA Maastricht
1 CHN, AUS, NZL
HKG, KOR, TWN, MAC, AUS,
TWN, MYS, PHL, IND
HKG, KOR, TWN, MAC, AUS
- MYS, CAN PHL, IND, AUS
HKG, MAC, BRN, AUS, NZL
- -
2 KOR, MYS THA, BRN, NZL
CHN, AUS THA, BRN, NZL
MYS, CAN MYS, IND, CAN
Pre-crisis
3 HKG, SGP MYS, CAN MYS, CAN KOR, TWN, THA
1 KOR, MYS, SGP, BRN
HKG, MAC, NZL, CAN
- CHN, TWN, VNM, AUS
- - - - - HKG, MAC, CAN
2 THA, NZL CHN, TWN, VNM, AUS
Crisis
3 PHL, VNM
1 KHM, PHL, MAC
CHN, MYS, THA, VNM AUS, CAN - CHN, HKG, TWN, MYS, THA
- PHL, IND, AUS
VNM, IND HKG, MYS
2 KOR, CAN PHL, BRN CHN, HKG, THA
AUS, NZL
Post-crisis 7V
3 HKG, VNM
All Periods
7V
1 - - - - - - - - - -
1 CHN, THA, VNM, IND
CHN, MYS - AUS, CAN VNM, IND CHN, HKG, TWN, MYS, THA
VNM, IND PHL, IND, AUS
VNM, IND HKG, MYS
2 HKG, SGP, JPN
KOR, CAN CHN, HKG, THA
Post-crisis 8V
3 KHM, MAC HKG, VNM
All Periods
8V
1 - - - - - - - - - -
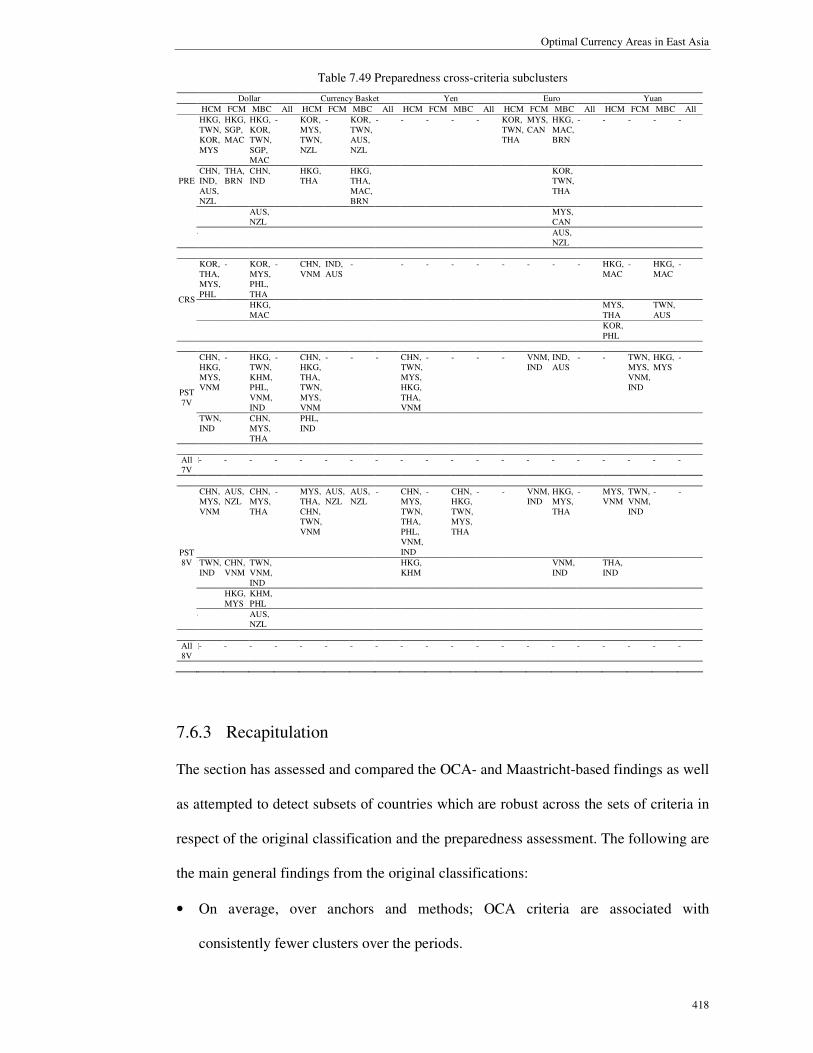
Optimal Currency Areas in East Asia
418
Table 7.49 Preparedness cross-criteria subclusters
Dollar Currency Basket Yen Euro Yuan
HCM FCM MBC All HCM FCM MBC All HCM FCM MBC All HCM FCM MBC All HCM FCM MBC All
1HKG, TWN, KOR, MYS
HKG, SGP, MAC
HKG, KOR, TWN, SGP, MAC
- KOR, MYS, TWN, NZL
- KOR, TWN, AUS, NZL
- - - - - KOR, TWN, THA
MYS, CAN
HKG, MAC, BRN
- - - - -
2CHN, IND, AUS, NZL
THA, BRN
CHN, IND
HKG, THA
HKG, THA, MAC, BRN
KOR, TWN, THA
3 AUS, NZL
MYS, CAN
PRE
4 AUS, NZL
1KOR, THA, MYS, PHL
- KOR, MYS, PHL, THA
- CHN, VNM
IND, AUS
- - - - - - - - - HKG, MAC
- HKG, MAC
-
2 HKG, MAC
MYS, THA
TWN, AUS
CRS
3 KOR, PHL
1CHN, HKG, MYS, VNM
- HKG, TWN, KHM, PHL, VNM, IND
- CHN, HKG, THA, TWN, MYS, VNM
- - - CHN, TWN, MYS, HKG, THA, VNM
- - - - VNM, IND
IND, AUS
- - TWN, MYS, VNM, IND
HKG, MYS
-
PST 7V
2TWN, IND
CHN, MYS, THA
PHL, IND
All 7V
1- - - - - - - - - - - - - - - - - - - -
1CHN, MYS, VNM
AUS, NZL
CHN, MYS, THA
- MYS, THA, CHN, TWN, VNM
AUS, NZL
AUS, NZL
- CHN, MYS, TWN, THA, PHL, VNM, IND
- CHN, HKG, TWN, MYS, THA
- - VNM, IND
HKG, MYS, THA
- MYS, VNM
TWN, VNM, IND
- -
2TWN, IND
CHN, VNM
TWN, VNM, IND
HKG, KHM
VNM, IND
THA, IND
3 HKG, MYS
KHM, PHL
PST 8V
4 AUS, NZL
All 8V
1- - - - - - - - - - - - - - - - - - - -
7.6.3 Recapitulation
The section has assessed and compared the OCA- and Maastricht-based findings as well
as attempted to detect subsets of countries which are robust across the sets of criteria in
respect of the original classification and the preparedness assessment. The following are
the main general findings from the original classifications:
• On average, over anchors and methods; OCA criteria are associated with
consistently fewer clusters over the periods.

A Clustering Approach
419
• On average, over anchors, methods, and periods; OCA dimensions are associated
with smaller number of clusters.
• On average, over anchors, methods and periods; Maastricht criteria are compatible
with greater number of positive and higher silhouettes.
Along these lines, OCA criteria are generally associated with more convergent
configurations whilst Maastricht criteria are generally related with better classifications.
From assessment of preparedness, Maastricht criteria appear to be associated with
more subclusters which not only indicated to be symmetrical in respect of convergence
features and levels of preparedness but also which commonly present over the methods.
Other findings, including some notable cross-criteria subsets of countries will be
revisited in Chapter 8 Discussion and Conclusion.
7.7 Chapter Conclusion
Chapter 7 has presented and discussed the findings using Maastricht Treaty criteria
including classifications and assessment of preparedness analyses. Akin to the OCA-
based analysis, the results are compared and contrasted across anchors and periods as
well as over methods. Another important content of this chapter is the final section
comparing the findings between the OCA and Maastricht criteria.
Next chapter, Chapter 8 Discussion and Conclusion will, among others, revisit the
key findings from the analysis chapters and deliver some insights gained.


![The Maastricht Treaty: The birth of the Economic Monetary ... · PDF fileDelors] been described as the midwife of the euro, ... (Delors Report, 1987) ... Title: EMU_Maastricht Treaty](https://static.fdocuments.in/doc/165x107/5abd19e07f8b9a8f058e6bf1/the-maastricht-treaty-the-birth-of-the-economic-monetary-been-described-as.jpg)