CHAPTER 7 RESULTS AND DISCUSSION
42
89 CHAPTER 7 RESULTS AND DISCUSSION Diffusion of silver into single crystalline 6H-SiC was investigated using the two methods discussed in Chapter 5. With first method surface layer diffusion was examined. For this a silver layer was deposited onto clean single crystal 6H-SiC samples. These were then annealed under vacuum to temperatures below the melting point of silver. The results of the post annealing Rutherford backscattering spectroscopy (RBS) and SEM analyses indicated no in-diffusion of silver and an absence of silver on and in the SiC at these temperatures. This was hypothesized to be the result of a wetting problem between silver and SiC. Further, the layer in- diffusion of silver was investigated by encapsulation. SiC samples were encapsulated in a quartz ampoule together with a silver source to maintain a silver vapour layer on the samples’ surface during annealing. The encapsulated samples were annealed at temperatures below the quartz softening temperature (1200 o C). The post annealing RBS and SEM analyses results indicated no in-diffusion of silver into 6H-SiC and an absence of silver on 6H-SiC surfaces. Due to the negative results of the layer in-diffusion of silver into 6H-SiC, further research was undertaken into silver diffusion in 6H-SiC by ion implantation. Silver was implanted in 6H-SiC at different temperatures (i.e. room temperature (23 o C), 350 o C and 600 o C) at a fluence of 2×10 16 cm -2 . The samples were then annealed from 700 o C up to 1600 o C for different annealing times. Using RBS the silver depth profiles after implantation and after annealing were compared to calculate diffusion coefficients. RBS-C was employed to investigate the production of radiation damage and also the annealing out of radiation damage during annealing. SEM was utilised to investigate the changes occurring on the sample surfaces during annealing. This chapter presents and discusses the results of this study and is organised as follows: section 7.1 discusses the layer in-diffusion results and 7.2 the implantation results.
Transcript of CHAPTER 7 RESULTS AND DISCUSSION

89
CHAPTER 7 RESULTS AND DISCUSSION Diffusion of silver into single crystalline 6H-SiC was investigated using the two
methods discussed in Chapter 5. With first method surface layer diffusion was
examined. For this a silver layer was deposited onto clean single crystal 6H-SiC
samples. These were then annealed under vacuum to temperatures below the melting
point of silver. The results of the post annealing Rutherford backscattering
spectroscopy (RBS) and SEM analyses indicated no in-diffusion of silver and an
absence of silver on and in the SiC at these temperatures. This was hypothesized to
be the result of a wetting problem between silver and SiC. Further, the layer in-
diffusion of silver was investigated by encapsulation. SiC samples were encapsulated
in a quartz ampoule together with a silver source to maintain a silver vapour layer on
the samples’ surface during annealing. The encapsulated samples were annealed at
temperatures below the quartz softening temperature (1200 oC). The post annealing
RBS and SEM analyses results indicated no in-diffusion of silver into 6H-SiC and an
absence of silver on 6H-SiC surfaces.
Due to the negative results of the layer in-diffusion of silver into 6H-SiC, further
research was undertaken into silver diffusion in 6H-SiC by ion implantation. Silver
was implanted in 6H-SiC at different temperatures (i.e. room temperature (23 oC),
350 oC and 600 oC) at a fluence of 2×1016 cm-2. The samples were then annealed from
700 oC up to 1600 oC for different annealing times. Using RBS the silver depth
profiles after implantation and after annealing were compared to calculate diffusion
coefficients. RBS-C was employed to investigate the production of radiation damage
and also the annealing out of radiation damage during annealing. SEM was utilised to
investigate the changes occurring on the sample surfaces during annealing.
This chapter presents and discusses the results of this study and is organised as
follows: section 7.1 discusses the layer in-diffusion results and 7.2 the implantation
results.
90
7.1 LAYER IN-DIFFUSION
The in-diffusion of a vacuum deposited layer of naturally-occurring silver into
6H-SiC was investigated using RBS and SEM at temperatures below the melting
point of silver (Tm= 960 oC). Due to the extremely low diffusion in this temperature
range [Jia04], samples with silver deposited on their surfaces had to be kept in the
vacuum furnace for very long periods (100 hours or more). Even then a direct
determination of the silver diffusion profile near the surface was not guaranteed.
Therefore, silver was to be chemically removed after annealing so as to analyse the
exposed SiC surface for any penetration of silver, exploiting the higher depth
resolution resulting from the much reduced energy straggling from the top surface
silver layer.
The samples were then annealed at 800 oC for 10 hours, which is a temperature well
below the melting point of silver (960 oC). The RBS and SEM analyses indicated that
the deposited silver disappeared without diffusing into SiC. At first we believed this
was due to the sublimation of silver at that temperature. However, the vapour pressure
calculation at 1000 oC in Appendix A does not confirm our initial belief.
Owing to this problem, the samples with 100 nm of silver on their surface were
vacuum encapsulated together with a silver source in a quartz ampoule, as explained
in chapter 5. The purpose of the said source was to maintain a silver layer or silver
vapour on the samples’ surface. The encapsulated samples were thereafter annealed
in a vacuum at 800 oC, 900 oC and 1000 oC for 10 h. The RBS analyses of the
annealed samples indicated that no silver was left on the surfaces and also discovered
no trace of diffused silver beyond the silicon carbide surfaces. These results were
confirmed by SEM in conjunction with EDS. However, silver was found on the walls
of the quartz glass ampoule. At first we thought this to be supporting the suggestion
of the sublimation of silver. No further annealing was performed at temperatures
above 1000 oC to avoid the softening of quartz glass, which at occurs around 1200 oC.
The disappearance of the silver layer from the SiC surface was investigated further at
temperatures from 200 oC to 700 oC. This was undertaken by isochronal annealing
91
(for 30 minutes) at temperatures from 200 oC to 700 oC. The SEM results depicted in
Figure 7-1 show that the as-deposited silver layer is fairly smooth and possesses a
homogenous structure. Silver islands start to form at 200 oC and become larger and
more visible as the annealing temperature increases up to 400 oC. At the lower
temperatures (200 to 400 oC), facet formation indicates the polycrystalline nature of
these islands which is clearly visible in the SEM images. At the higher temperatures
these long facets islands break into bigger and smaller facets islands. This is due to
the coalescence of the smaller islands into bigger islands along with increasing drop
formation. The black spots in the SEM image of the sample annealed at 200 oC are
cavities (indicated by C) in the Ag layer. Defects in the Ag layer, such as grain
boundaries, internal stresses, and local weak bonding between Ag and SiC, could
trigger cavity formation. In the same SEM image the straight lines inside the large
crystals could be micro twins, indicated by T. Some of the larger silver islands also
exhibit grain grooving or steps on the surface. The islands that are formed at higher
temperatures, e.g. at 700 oC, are composed of small islands clustered together and
bigger islands with openings between them - see the low magnification image in
figure 7-1 (the un-labelled image).
The formation of islands is the result of weaker binding forces between silver atoms
and SiC as compared to the binding forces between silver atoms and such islands
constitute the proof that silver does not wet SiC. Therefore, the disappearance of
silver is caused by the formation of silver islands on the SiC surface and their
coalescence into droplets, which run off the samples’ surface in longer duration
annealing.

92
Figure 7-1: SEM images of a 100 nm silver layer vacuum deposited on 6H-SiC after isochronal annealing at temperatures from 200 oC to 700 oC for 30 minutes compared with the as-deposited sample. A low magnification image of the sample annealed at 700 oC is included and is the un-labelled image in the above set of images.
As-deposited
Ta = 300 oC Ta = 400 oC
Ta = 500 oC Ta = 600 oC
Ta = 700 oC
T
C
C
T
Ta = 200 oC As-deposited

93
7.2 IMPLANTATION RESULTS
Due to the negative results of layer in-diffusion of silver into silicon carbide as
discussed above, further studies were performed to try and elucidate the diffusion
mechanism. In these experiments, silver was implanted into SiC. For this purpose
360 keV 109Ag+ with a fluence of 2×1016 cm-2 was implanted in single crystal 6H SiC
wafers at room temperature (23 oC), at 350 oC and at 600 oC. To reduce channelling
during implantation, a tilt angle of 7o relative to the normal was used. To avoid
excessive beam induced target heating, the flux was kept below 10-13 cm-2s-1.
To investigate the diffusion behaviour of silver and annealing of radiation damage, the
implanted samples were vacuum annealed in a computer controlled Webb 77 Vacuum
Furnace for different annealing time cycles, i.e. 10 h cycles and 30 minute (min)
cycles from temperatures below the melting point of silver (960 oC) up to
1600 oC.
The diffusion behaviour, production, and annealing of radiation damage results are
discussed as follows: 7.2.1 considers the room temperature implantation results while
7.2.2 discusses the high temperature (350 oC and 600 oC) implantation results.
7.2.1 ROOM TEMPERATURE IMPLANTATION In this section the results of silver implanted into 6H-SiC at room temperature are
discussed. They are organised into subsection 7.2.1.1, which considers the radiation
damage and the annealing of radiation damage; and subsection 7.2.1.2 which
discusses the results of the diffusion experiments.
7.2.1.1 RADIATION DAMAGE RESULTS The channelled spectrum of the as-implanted silver at room temperature is illustrated
in figure 7-2. Also depicted are the random spectrum and the spectrum of an
unimplanted sample, with the channelled spectrum and unimplanted spectrum
normalised to the random spectrum for comparison. The backscattered yield/counts in
the as-implanted channelled spectrum of the implanted sample correspond to damage
created during implantation. The region where the channelled spectrum overlaps with
94
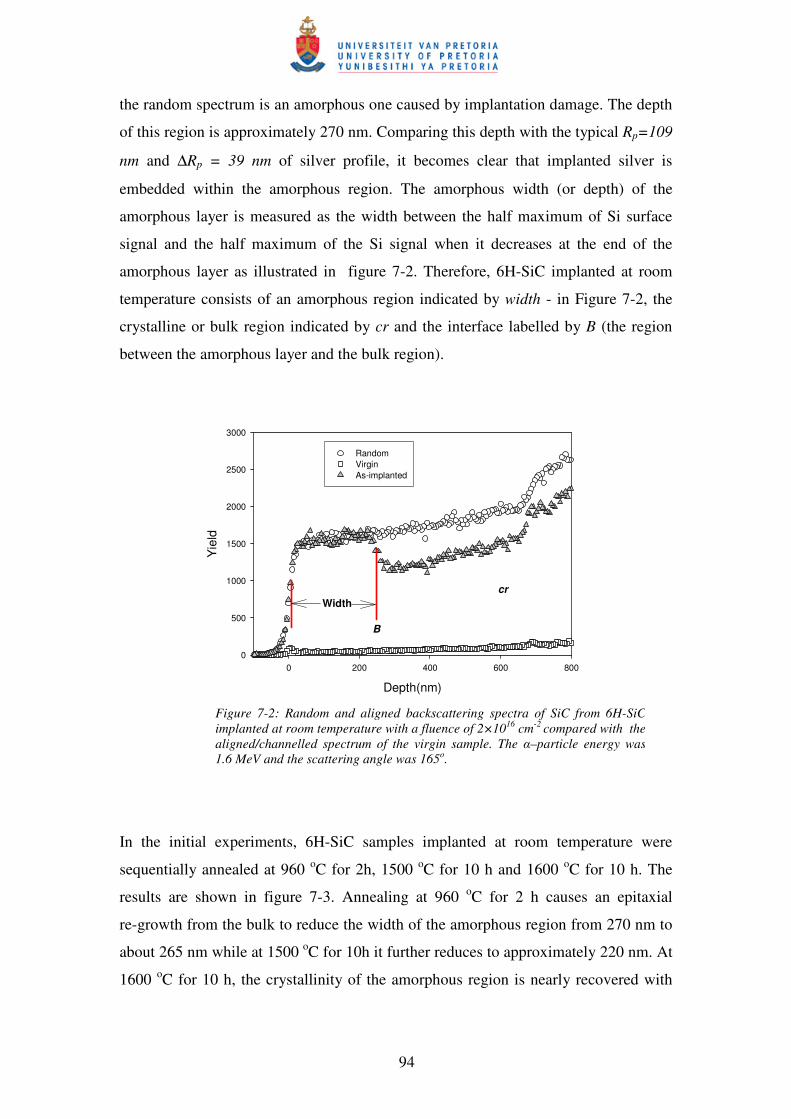
the random spectrum is an amorphous one caused by implantation damage. The depth
of this region is approximately 270 nm. Comparing this depth with the typical Rp=109
nm and ∆Rp = 39 nm of silver profile, it becomes clear that implanted silver is
embedded within the amorphous region. The amorphous width (or depth) of the
amorphous layer is measured as the width between the half maximum of Si surface
signal and the half maximum of the Si signal when it decreases at the end of the
amorphous layer as illustrated in figure 7-2. Therefore, 6H-SiC implanted at room
temperature consists of an amorphous region indicated by width - in Figure 7-2, the
crystalline or bulk region indicated by cr and the interface labelled by B (the region
between the amorphous layer and the bulk region).
Depth(nm)
0 200 400 600 800
Yie
ld
0
500
1000
1500
2000
2500
3000
RandomVirginAs-implanted
Width
B
cr
In the initial experiments, 6H-SiC samples implanted at room temperature were
sequentially annealed at 960 oC for 2h, 1500 oC for 10 h and 1600 oC for 10 h. The
results are shown in figure 7-3. Annealing at 960 oC for 2 h causes an epitaxial
re-growth from the bulk to reduce the width of the amorphous region from 270 nm to
about 265 nm while at 1500 oC for 10h it further reduces to approximately 220 nm. At
1600 oC for 10 h, the crystallinity of the amorphous region is nearly recovered with
Figure 7-2: Random and aligned backscattering spectra of SiC from 6H-SiC implanted at room temperature with a fluence of 2×1016 cm-2 compared with the aligned/channelled spectrum of the virgin sample. The �–particle energy was 1.6 MeV and the scattering angle was 165o.

95
some defects still remaining. The higher de-channelling in the spectrum of the sample
annealed at 960 oC might be due to the variations in the crystal alignment.
Depth(nm)
0 200 400 600
Yie
ld
0
1000
2000
3000
4000RandomAs-implantedTa = 960 oC, ta = 2 h
Ta = 1500 oC, ta = 10 h
Ta = 1600 oC, ta = 10 h
Figure 7-3: Random and aligned backscattering spectra of SiC from 6H-SiC implanted at room temperature (23 oC) and submitted to sequential annealing at 960 oC for 2 h, at 1500 oC for 10 h and at 1600 oC for 10 h.
For the isochronal study, new samples implanted at room temperature were annealed
for 10 h at temperatures of 1100 oC, 1200 oC, 1300 oC and 1400oC. The results are to
be seen in figure 7-4. Annealing of samples at 1100 oC and 1200 oC causes an
epitaxial re-growth from the bulk to reduce the width of the amorphous region from
270 nm to about 240 nm, while annealing at 1300 oC and 1400 oC reduced the
amorphous width to 180 nm and 92 nm respectively. These results imply that at
1100 oC and 1200 oC re-crystallization occurs at the same rate. The rate increases with
temperatures above 1200 oC, displaying a further reduction of amorphous width at
1300 oC and 1400 oC.

96
Depth(nm)
0 200 400 600 800
Yie
ld
0
500
1000
1500
2000
2500
3000
3500RandomAs-implanted10 h20 h80 h
Figure 7-5: Random and aligned backscattering spectra of SiC from 6H-SiC implanted at room temperature (23 oC) and submitted to isothermal annealing at 1300 oC for 10 hours cycles up to 80 h; the 40 h aligned spectrum is not shown.
Depth(nm)
0 200 400 600 800
Yie
ld
0
1000
2000
3000
RandomVirginAs-implanted
Ta = 1100 oC
Ta = 1200 oC
Ta = 1300 oC
Ta = 1400 oC
Figure 7-4: Random and aligned backscattering spectra of SiC for new 6H-SiC implanted at room temperature (23 oC) and submitted to isochronal annealing at 1100 oC, 1200 oC, 1300 oC and 1400 oC for a 10 hours cycle compared with the virgin 6H-SiC aligned spectrum.

97
Isothermal annealing of the sample implanted at room temperature at 1300 oC for 10 h
cycles up to 80 h demonstrates that the amorphous region is reduced from 270 to 180
nm during the first annealing cycle and does not decrease with further annealing at
the same temperature (see figure 7-5). Isothermal annealing of the sample implanted
at room temperature at 1350 oC for 30 minutes reduced the amorphous layer to about
220 nm. This depth remained constant with further annealing at 1350 oC
(see figure 7-6). These results indicate that more re-crystallization occurs during a
longer annealing time (10 h) compared to the shorter annealing period (30 min) since
the difference in temperature between these cases is small.
Further investigation of the sample annealed at 1300 oC for 80 h was performed using
Raman scattering spectroscopy to ascertain whether or not the sample was still
amorphous (after the first annealing cycle) as suggested by the RBS channelling. This
was performed by comparing its results with those of the other samples listed below.
Ag+(360 keV) 6H-SiCTi=23 0C, Ta=1350 oC
Depth(nm)0 200 400 600
Yie
ld
0
500
1000
1500
2000
2500
As-implantedRandomta=30 min
60 min
Figure 7-6: Random and aligned backscattering spectra of SiC from 6H-SiC implanted at room temperature (23 oC) and submitted for isothermal annealing at 1350 oC for a 30 minutes cycle.

98
Raman scattering at a visible wavelength (514.5 nm) was performed on the following
6H-SiC samples:
• unimplanted;
• implanted with silver at room temperature; and
• the sample implanted with silver which was annealed at 1300 oC for 80 h.
The Raman spectra are depicted in figure 7-7. The spectrum for unimplanted 6H-SiC
exhibited the characteristic Raman modes for perfect 6H-SiC [Fen99]. After silver
implantation at room temperature, three broad Raman bands appeared, with the bands
centred around 500, 800 and 1420 cm-1. These broad peaks are caused by Si-Si, Si-C
and C-C vibrations, respectively [Fen99]. These bands indicate a loss of 6H-SiC
crystallinity and the formation of an amorphous phase as a result of ion implantation.
During the amorphization, bonds are formed between Si-Si and C-C, in contrast with
crystalline SiC where only Si-C bonds occur. After annealing at 1300 oC for 80 h the
broad peaks disappeared while the Raman spectrum for 6H-SiC reappears. This
indicates the recovery of the SiC crystalline structure due to annealing at 1300 oC for
80 h. A comparison of the Raman intensity of the virgin sample with the Raman
intensity of the sample annealed at 1300 oC for 80 h in figure 7-7 shows that defects
are still present in the annealed sample (the lower relative Raman intensity means
defects in SiC).
From the Raman results of samples implanted at room temperature and annealed at
1300 oC for 80 h, it is evident that the sample is no longer amorphous but that defects
are still present. However, these results contradict the channelling results of the
sample-see figure 7-5. This contradiction could be due to the fact that during the first
annealing cycle the amorphous layer was annealed into smaller crystals or crystallites
that are randomly orientated or misoriented to the substrate, which resulted in the
seemingly amorphous layer in channelling results. The same channelling results could
be achieved if, during the first cycles, the amorphous layers re-crystallized to other
polytypes of SiC such as 3C-SiC, as suggested by Nakamura et al. [Nak02].
Nakamura et al. found that the annealing of amorphised 6H-SiC leads to the re-growth
of the micro-twinned 3C-SiC crystals.

99
Figure 7-7: Comparative Raman spectra from un-implanted (virgin) 6H-SiC, silver implanted into 6H-SiC at room temperature (23 oC) and after annealing at 1300 oC for 80 h.
Sequential isochronal annealing (for 30 minute cycles) of samples implanted at room
temperature at the temperatures 700 oC, 800 oC, 900 oC, 1000 oC, 1100 oC, 1200 oC,
1300 oC, 1400 oC, 1500 oC and 1600 oC indicates that epitaxial re-growth is already
taking place at 700 oC (see figure 7-8(a) and figure 7-8(b)). The widths of the
amorphous layer (measured as shown in figure 7-2) were plotted as functions of the
annealing temperatures in figure 7-8(b). Annealing of the sample at 700 oC decreases
the width of the amorphous layer from 270 to about 250 nm. This amorphous width
remains at about 250 nm up to 1400 oC where it further decreases to about 204 nm. At
1500 oC it decreases to about 170 nm. The crystal structure appears to be recovered
after annealing at 1600 oC but with more carbon being detected at this temperature.
This might be due to decomposition of SiC at this temperature, which allows Si to
evaporate since this temperature is well above the melting point (1411 oC) of Si. No
signal from the implanted Ag was observed in the RBS spectrum. This could indicate
that the top amorphous layer is thermally etched away or sublimated during annealing,
as was suggested by Wendler et al. and Rao [Wen98][Rao03]. Therefore, the decrease
Virgin
Raman Shift (cm-1)0 500 1000 1500 2000
Inte
nsity
0
50000
100000
150000
200000
250000
300000
As-implanted,Ti = 23 oC
Raman Shift (cm-1)0 200 400 600 800 1000 1200 1400 1600 1800 2000
Inte
nstit
y
0
200
400
600
800
1000
1200
1400
1600
1800
2000
Ta = 1300 oC, ta = 80 h
Raman Shift (cm-1)0 200 400 600 800 1000 1200 1400 1600 1800 2000
Inte
nsity
0
20000
40000
60000
80000

100
in the width of the amorphous layer at low temperatures might be due either to an
epitaxial re-growth from the amorphous/bulk interface as can be seen in figure 7-8(a)
or to the sublimation of the (top) amorphous layer during annealing. At the
temperatures where epitaxial re-growth did not occur as observed by channelling, this
result might imply that the amorphous layer re-crystallised to other polytypes as
explained above, while the thermal etching was negligible at those temperatures.
Depth(nm)
0 200 400 600 800
Yie
ld
0
1000
2000
3000
4000VirginRandomAs-implanted
Ta = 700 oC
Ta = 1300 oC
Ta = 1400 oC
Ta = 1600 oC
Ta = 1500 oC
Figure 7-8(a): Random and aligned backscattering spectra of SiC from 6H-SiC implanted at room temperature (23 oC) and isochronally annealed at temperatures from 700 oC to 1600 oC for 30 minutes cycles.

101
Ag+(360 keV, 2x1016 cm-2) 6H-SiC
Temperature (oC)
200 400 600 800 1000 1200 1400 1600 1800
Wid
th o
f am
orph
ous
laye
r (nm
)
0
50
100
150
200
250
300
350
Figure 7-8(b): The width of the amorphous layer as a function of annealing temperatures during the isochronal sequential annealing from 700 oC to 1600 oC for 30 minute cycles.
In summary, our production of radiation damage during the implantation results of
this study is in agreement with the results of Wendler et al. [Wen98]. Wendler et al.
have shown that for high energy ion damage, amorphization is not achieved for
implantation temperatures above 250 oC. Furthermore, the annealing of radiation
damage produced during implantation results is in agreement with Bohn et al.
[Boh87] and Pacaud et al. [Pac96]. Bohn et al. found that the amorphous layers
re-grew epitaxially from the underlying undamaged material up to 1500 oC, above
which the damage annealed rapidly in a narrow temperature interval while
Pacaud et al. showed that annealing of the amorphous layer cannot be achieved at the
temperature of 1500 oC. Decomposition of SiC, resulting in the excess of carbon on
the SiC, is found to be taking place at 1600 oC. This is caused by silicon evaporating
at 1600 oC, leaving excess carbon and thus causing lager carbon peak on the SiC RBS
spectrum.

102
7.2.1.2 IMPLANTED LAYER DIFFUSION RESULTS
Measurements to determine silver diffusion in 6H-SiC were performed
simultaneously with the annealing of radiation damage discussed above, using random
spectra from the RBS. A typical profile of silver implanted at room temperature as
compared with TRIM 98 prediction is depicted in figure 7-9, where the fluence (φ ),
experimental and TRIM 98 moments are also shown. By comparing the experimental
moments with TRIM 98 ones, it became quite clear that the measured projected range
of silver peak is about 2% deeper, which is within TRIM calculation error of 5 %. The
typical FWHM of silver peak is about 63 % wider as compared to the TRIM 98
results but the concentration is the same in both peaks. This difference in FWHM
causes the silver concentration of the TRIM simulation to be higher than the measured
one around the projected range (see figure 7-9). This discrepancy is caused by the
fact that TRIM does not take into account the crystal structure or dynamic
composition changes in the material that occur when the ion penetrates materials;
however, approximations are used in this program. These include the following:
• binary collision (i.e. the influence of neighbouring atoms is neglected);
• recombination of knocked off atoms (interstitials) with the vacancies is neglected;
• the electronic stopping power is an averaging fit to a large number of experiments;
• the interatomic potential as a universal form which is an averaging fit to quantum
mechanical calculations;
• the target atom which reaches the surface is able to leave the surface (be
sputtered) if it has sufficient momentum and energy to pass the surface barrier.
103
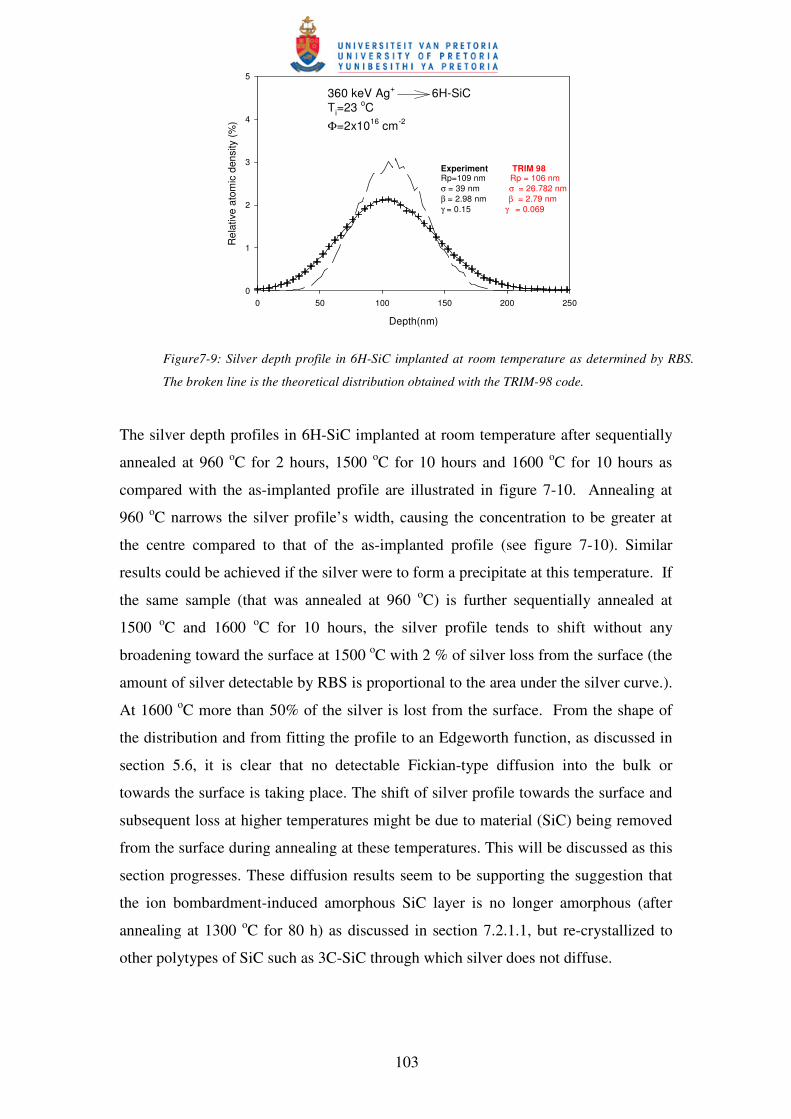
The silver depth profiles in 6H-SiC implanted at room temperature after sequentially
annealed at 960 oC for 2 hours, 1500 oC for 10 hours and 1600 oC for 10 hours as
compared with the as-implanted profile are illustrated in figure 7-10. Annealing at
960 oC narrows the silver profile’ s width, causing the concentration to be greater at
the centre compared to that of the as-implanted profile (see figure 7-10). Similar
results could be achieved if the silver were to form a precipitate at this temperature. If
the same sample (that was annealed at 960 oC) is further sequentially annealed at
1500 oC and 1600 oC for 10 hours, the silver profile tends to shift without any
broadening toward the surface at 1500 oC with 2 % of silver loss from the surface (the
amount of silver detectable by RBS is proportional to the area under the silver curve.).
At 1600 oC more than 50% of the silver is lost from the surface. From the shape of
the distribution and from fitting the profile to an Edgeworth function, as discussed in
section 5.6, it is clear that no detectable Fickian-type diffusion into the bulk or
towards the surface is taking place. The shift of silver profile towards the surface and
subsequent loss at higher temperatures might be due to material (SiC) being removed
from the surface during annealing at these temperatures. This will be discussed as this
section progresses. These diffusion results seem to be supporting the suggestion that
the ion bombardment-induced amorphous SiC layer is no longer amorphous (after
annealing at 1300 oC for 80 h) as discussed in section 7.2.1.1, but re-crystallized to
other polytypes of SiC such as 3C-SiC through which silver does not diffuse.
360 keV Ag+ 6H-SiCTi=23 oCΦ=2x1016 cm-2
Depth(nm)
0 50 100 150 200 250
Rel
ativ
e at
omic
den
sity
(%)
0
1
2
3
4
5
Experiment TRIM 98Rp=109 nm Rp = 106 nmσ = 39 nm σ = 26.782 nmβ = 2.98 nm β = 2.79 nmγ = 0.15 γ = 0.069
Figure7-9: Silver depth profile in 6H-SiC implanted at room temperature as determined by RBS.
The broken line is the theoretical distribution obtained with the TRIM-98 code.

104
Ag+(360 keV) 6H-SiCTi = 23 oC, φ = 2x1016 cm-2
Depth (nm)
-100 0 100 200 300 400
Rel
ativ
e at
omic
den
sity
(%)
0.0
0.5
1.0
1.5
2.0
2.5
3.0
As-implantedTa = 960 oC, ta = 2 h
Ta = 1500 oC, ta = 10 h
Ta = 1600 oC, ta = 10 h
Figure 7-10: Silver depth profiles of 6H-SiC implanted at room temperature after annealing at 960 oC for 2 hours, 1500 oC for 10 hours and 1600 oC for 10 hours.
Owing to the unexpected results of our initial diffusion experiments, silver diffusion
in single crystal 6H-silicon carbide was investigated further by isochronal annealing
of new samples at 1100 oC, 1200 oC, 1300 oC and 1400 oC for 10 hours, so that the
results of annealing at higher annealing temperatures are not influenced by lower
annealing temperatures as in our previous experiments. Therefore, in these
experiments all samples were initially amorphised SiC while in the former
experiments the samples were only amorphous during annealing at a lower
temperature, i.e. 960 oC. The results of the isochronal annealing experiments are
illustrated in figures 7-11 to 7-13. Silver loss starts at 1100 oC (see figure 7-12), while
silver diffusion in amorphous SiC accompanied by silver loss from the surface begins
at 1300 oC (figure 7-11). The silver profile maintains a symmetrical shape with less
than 30% of silver lost from the surface. The silver retained ratio was calculated from
the total counts/yield of silver after annealing, divided by the counts of the as-
implanted silver peaks. At 1400 oC silver diffuses significantly, with the silver profile
shifting towards the surface and becoming asymmetric (see figure 7-11). 50% of
silver is lost from the surface at 1400 oC. At temperatures below 1300 oC the widths
of the silver profiles become narrower and their counts decrease. This is the result of
some of the implanted silver forming precipitates, and some silver being lost at these
temperatures. The silver precipitates can be seen in the cross sectional SEM image for

105
a sample implanted at room temperature and then annealed at 1250 oC for 30 minutes
(figure 7-14). This sample in figure 7-14 was prepared by standard TEM sample
preparation, i.e. glued on a poly crystalline SiC, together with chemical polishing and
ion milling. In figure 7-14, the surface from which implantation was performed is
indicated as S, while Ag represents the silver precipitates and Poly SiC represents
polycrystalline SiC. This is the proof that below 1300 oC silver forms precipitates, as
has been suggested above in this section.
Annealing temperature (oC)
0 200 400 600 800 1000 1200 1400
Ret
aine
d si
lver
0.0
0.2
0.4
0.6
0.8
1.0
1.2
Figure 7-12: Fraction of retained silver in 6H- SiC implanted at room temperature after isochronal
annealing at 1100 oC, 1200 oC, 1300 oC and 1400 oC for 10 hours.
Ag+(360 keV) 6H-SiCTi = 23 oC,
Depth (nm)
-100 0 100 200 300
Yie
ld
0
200
400
600
800
1000
1200
1400
1600
As-implantedTa = 1100 oC
Ta = 1200 oC
Ta = 1300 oC
Ta = 1400 0C
Figure 7-11: Silver depth profiles of 6H-SiC implanted at room temperature after isochronal annealing at 1100 oC, 1200 oC, 1300 oC and 1400 oC for a 10 hours cycle.

106
Figure 7-13: SEM images of 6H- SiC implanted at room temperature after isochronal annealing at 1100 oC, 1200 oC, 1300 oC and 1400 oC for 10 hours as compared with as-implanted; the magnification bar is 100 nm in all the images.
Figure 7-14: The cross sectional image of 6H-SiC implanted with silver at room temperature after annealed at 1250 oC for 30 minutes. This sample is glued to poly-SiC.
1100oC
1300oC 1400oC
As-implanted
1200oC
P H
S
Ag
Poly SiC
107
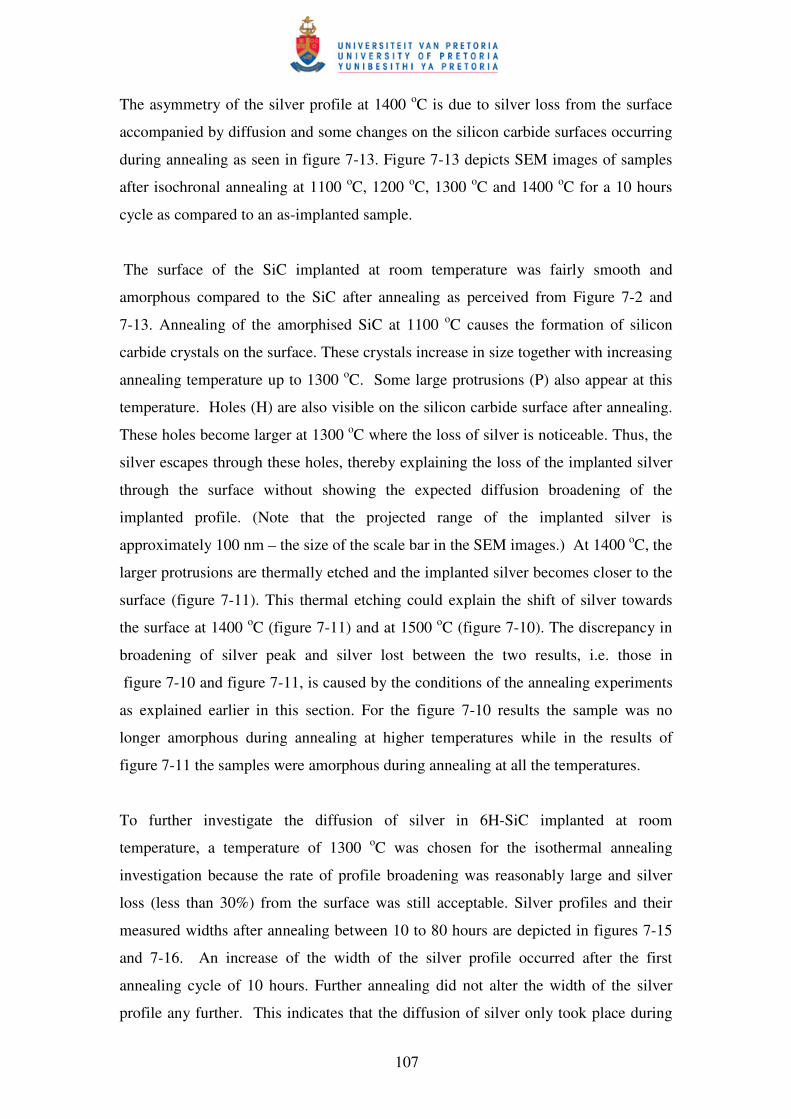
The asymmetry of the silver profile at 1400 oC is due to silver loss from the surface
accompanied by diffusion and some changes on the silicon carbide surfaces occurring
during annealing as seen in figure 7-13. Figure 7-13 depicts SEM images of samples
after isochronal annealing at 1100 oC, 1200 oC, 1300 oC and 1400 oC for a 10 hours
cycle as compared to an as-implanted sample.
The surface of the SiC implanted at room temperature was fairly smooth and
amorphous compared to the SiC after annealing as perceived from Figure 7-2 and
7-13. Annealing of the amorphised SiC at 1100 oC causes the formation of silicon
carbide crystals on the surface. These crystals increase in size together with increasing
annealing temperature up to 1300 oC. Some large protrusions (P) also appear at this
temperature. Holes (H) are also visible on the silicon carbide surface after annealing.
These holes become larger at 1300 oC where the loss of silver is noticeable. Thus, the
silver escapes through these holes, thereby explaining the loss of the implanted silver
through the surface without showing the expected diffusion broadening of the
implanted profile. (Note that the projected range of the implanted silver is
approximately 100 nm – the size of the scale bar in the SEM images.) At 1400 oC, the
larger protrusions are thermally etched and the implanted silver becomes closer to the
surface (figure 7-11). This thermal etching could explain the shift of silver towards
the surface at 1400 oC (figure 7-11) and at 1500 oC (figure 7-10). The discrepancy in
broadening of silver peak and silver lost between the two results, i.e. those in
figure 7-10 and figure 7-11, is caused by the conditions of the annealing experiments
as explained earlier in this section. For the figure 7-10 results the sample was no
longer amorphous during annealing at higher temperatures while in the results of
figure 7-11 the samples were amorphous during annealing at all the temperatures.
To further investigate the diffusion of silver in 6H-SiC implanted at room
temperature, a temperature of 1300 oC was chosen for the isothermal annealing
investigation because the rate of profile broadening was reasonably large and silver
loss (less than 30%) from the surface was still acceptable. Silver profiles and their
measured widths after annealing between 10 to 80 hours are depicted in figures 7-15
and 7-16. An increase of the width of the silver profile occurred after the first
annealing cycle of 10 hours. Further annealing did not alter the width of the silver
profile any further. This indicates that the diffusion of silver only took place during
108
the initial stages of annealing. This could be due to radiation damage-induced
diffusion, since implantation at room temperature resulted in the silver being initially
embedded in amorphous SiC. The fact that the measured widths remain constant for
annealing times longer than 10 hours at 1300 oC suggests that the amorphous state
which allows diffusion of silver is no longer available. This seems to contradict the
channelling results which indicate that the damage density was the same as that in the
initial amorphous layer (see figure 7-5). However, if the amorphous SiC layer is
annealed during this first annealing cycle to form small crystals or crystallites that are
randomly orientated or misorientated to the substrate, the channelling spectrum will
be similar to that of an amorphous layer. The silver diffusion mechanism will
nevertheless alter dramatically between these two substrates, thereby explaining the
above results. This explanation is fully supported by the Raman results
(see figure 7-6) and is in line with the asymmetric shape of the room temperature
implanted silver profile after annealing at 1400 oC, compared to the symmetric
profiles obtained after annealing for 10 h at much higher temperatures, viz. 1500 and
1600 oC: see Figure 7-10. The asymmetric RBS profile of the sample annealed at
1400 oC (see Figure 7-11) is caused by silver loss accompanied by diffusion in
amorphous SiC since the sample was directly annealed at this temperature while the
symmetric profiles at 1500 and 1600 oC are due to the fact that the sample was
sequentially annealed from lower temperatures. This hinders diffusion of silver at
these higher temperatures as explained in the section above. At the higher annealing
temperatures there is a substantial loss of silver from the SiC substrate through the
surface. This will reduce the concentration on the surface side of the silver profile,
resulting in a more symmetric profile at these higher temperatures. However, an
alternative investigating technique such as TEM is necessary to clarify the nature of
the damage after the first annealing step and either prove or disprove this explanation.
Based on the RBS and Raman results and the above discussion it can be assumed that
this initial diffusion of implanted silver is due to the amorphous SiC layer.
The diffusion coefficient obtained from fitting the experimental data for t > 10 hours
to a straight line as a function of time yields an upper limit of: D < 10-21 m2s-1 at
1300 oC, which is in the same range as that obtained by MacLean et al [Mac06], who
found a value of D < 5×10-21 m2s-1 at 1500 oC.

109
From the initial slopes of FWHM squares as a function of annealing time, effective
diffusion coefficients of silver could be calculated but this would require detailed
knowledge of the structural evolution of the SiC during the first annealing cycle
(10 hours cycle). Due to the lack of knowledge regarding this evolution the annealing
cycle was reduced to obtain the diffusion during the first cycle, thereby avoiding
annealing of the radiation damage which would cause silver diffusion to stop.
Ag+(360 keV) 6H-SiCTi = 23 oC, Ta = 1300 oC
Depth (nm)
-100 0 100 200 300
Yie
ld
0
200
400
600
800
1000
1200
1400
1600
1800
As-implanted10 hours20 hours40 hours80 hours
Figure 7-15: Silver depth profiles of 6H-SiC implanted at room temperature after isothermal annealing at 1300 oC for sequential 10 hours cycles up to 80 hours.

110
Figure7-16: Square of the full width at half maximum (FWHM) of the silver profile in 6H-SiC as function of isothermal annealing time at Ta=1300 oC for sequential 10 hours cycles up to 80 hours.
The time at which silver diffusion stops or at which most of the annealing of the
damage occurred was investigated by performing an isothermal annealing at 1300 oC
and 1350 oC for 30 minute cycles up to 120 minutes. The results of the experiments
are portrayed in figures 7-17 to 7-19. A relative increase of the FWHM of silver
profiles during the first annealing cycles together with a lower increase in width in the
second cycles was observed. The sharp increase during the first annealing cycle is
without a doubt due to diffusion of the silver in amorphous SiC, while the lower
second increase is due to a reduction in the damage, causing less diffusion to occur
after the first annealing cycle. For the third cycle the widths at both temperatures
remain unchanged, indicating that all the damage which led to the diffusion has been
annealed during the first and the second cycles.

111
Ag+(360 keV) 6H-SiCTi=23oC, Ta=1350oC
Depth(nm)
-100 0 100 200 300
Yie
ld
0
200
400
600
800
1000
as-implanted30 minutes60 minutes120 minutes
Figure 7-17: Silver depth profiles of 6H-SiC implanted at room temperature after isothermal annealing at 1300 oC for a 30 minutes cycle up to 120 minutes.
Ag+(360 keV) 6H-SiCTi = 23 oC, Ta = 1300 oC
Depth (nm)
-100 0 100 200 300
Yie
ld
0
200
400
600
800
1000As-implanted30 minutes60 minutes120 minutes
Figure 7-18: Silver depth profiles of 6H-SiC implanted at room temperature after isothermal annealing at 1300 oC for a 30 minutes cycle up to 120 minutes.

112
We have investigated silver diffusion in amorphous SiC for the temperatures where
diffusion occurs, viz. between 1300 oC and 1400 oC. This has been carried out by
annealing the as-implanted 6H-SiC samples (implanted at room temperature) at 1300 oC, 1315 oC, 1325 oC, 1350 oC, 1365 oC, 1375 oC and 1385 oC for 30 minutes. The
silver depth profile results are illustrated in figure 7-20. At these temperatures the
profiles are asymmetric due to silver loss accompanied by diffusion. The amount of
silver lost during annealing is very small because of the short annealing cycle of 30
minutes. The squares of FWHMs as a function of temperature in the selected range
i.e. 1300 oC < 1400 oC are portrayed in figure 7-21. Because of the narrow range of
temperature and overshooting of oven temperature during annealing at these
temperatures, there are large errors in the measurements.
Time[103 s]0 2 4 6 8
(FW
HM
)2[1
014
m2 ]
0.0
0.2
0.4
0.6
0.8
1.0
1.2
Ti=23 oC, Ta=1350 oCTi=23 oC, Ta=1300 oC
Figure 7-19: Square of the full width at half maximum (FWHM) of the silver profile in 6H-SiC as function of isothermal annealing time (30 minutes) at Ta=1300 oC and 1350 oC.

113
Ag+(360 keV) 6H-SiCTi = 23 oC
Depth(nm)
-100 0 100 200 300
Yie
ld
0
200
400
600
800
1000
1200
1400
1600 As-implantedTa = 1315 oC
Ta = 1325 oC
Ta = 1365 oC
Ta = 1375 oC
Ta = 1385 oC
Figure 7-20: Silver depth profiles of 6H-SiC implanted at room temperature after isochronal annealing at 1315 oC, 1325 oC 1365 oC 1375 oC and 1385 oC for a 30 minutes cycle as compared to the as-implanted profile.
Ag+(360 keV) 6H-SiCTi = 23oC, ta =30 min
T [oC]
1300 1320 1340 1360 1380 1400
(FW
HM
)2 {10-1
4 m2 }
0.6
0.7
0.8
0.9
1.0
1.1
1.2
Figure 7-21: Square of the full width at half maximum (FWHM)2 of the silver profile in 6H-SiC as a function of isothermal annealing time (30 minutes) at Ta=1300 oC to 1385 oC.
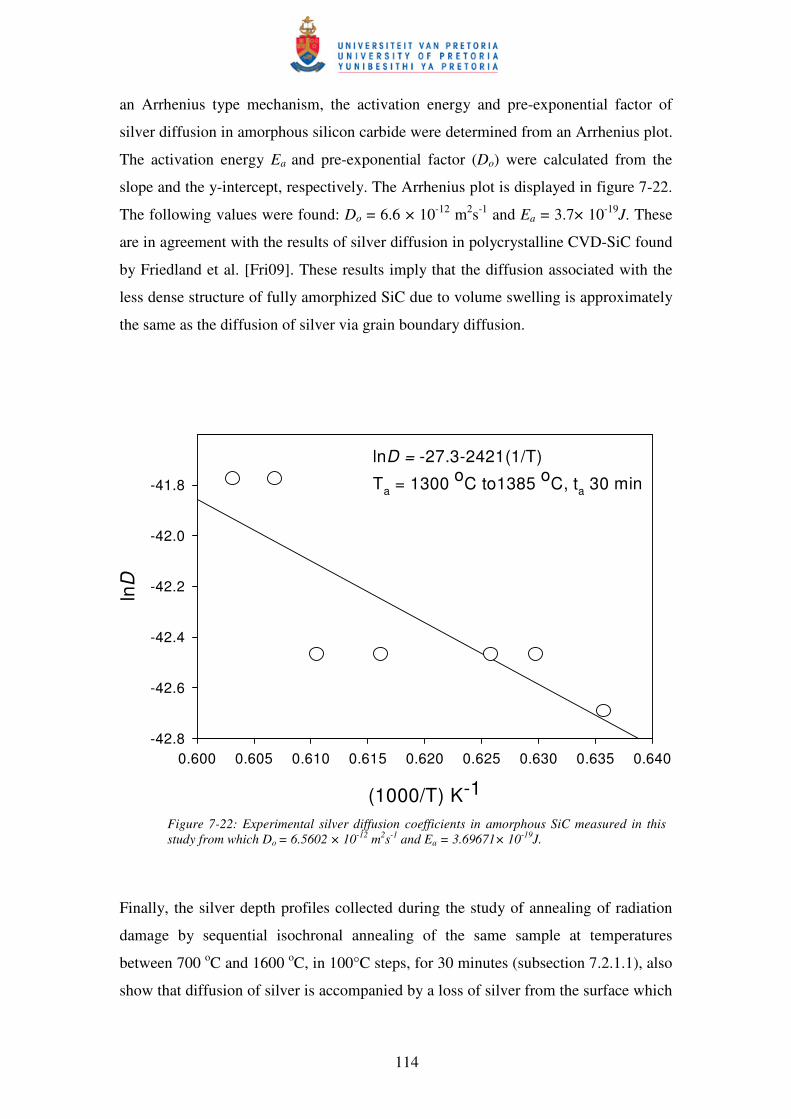
By comparing the squares of the FWHM of the silver depth profiles after annealing
plotted in figure 7-21, with the as-implanted FWHM square, the diffusion coefficients
were calculated: they are depicted in figure 7-22. Assuming that the diffusion follows
114
an Arrhenius type mechanism, the activation energy and pre-exponential factor of
silver diffusion in amorphous silicon carbide were determined from an Arrhenius plot.
The activation energy Ea and pre-exponential factor (Do) were calculated from the
slope and the y-intercept, respectively. The Arrhenius plot is displayed in figure 7-22.
The following values were found: Do = 6.6 × 10⁻¹² m2s-1 and Ea = 3.7× 10⁻¹⁹J. These
are in agreement with the results of silver diffusion in polycrystalline CVD-SiC found
by Friedland et al. [Fri09]. These results imply that the diffusion associated with the
less dense structure of fully amorphized SiC due to volume swelling is approximately
the same as the diffusion of silver via grain boundary diffusion.
Finally, the silver depth profiles collected during the study of annealing of radiation
damage by sequential isochronal annealing of the same sample at temperatures
between 700 oC and 1600 oC, in 100°C steps, for 30 minutes (subsection 7.2.1.1), also
show that diffusion of silver is accompanied by a loss of silver from the surface which
lnD = -27.3-2421(1/T)
Ta = 1300 oC to1385 oC, ta 30 min
(1000/T) K-1
0.600 0.605 0.610 0.615 0.620 0.625 0.630 0.635 0.640
lnD
-42.8
-42.6
-42.4
-42.2
-42.0
-41.8
Figure 7-22: Experimental silver diffusion coefficients in amorphous SiC measured in this study from which Do = 6.5602 × 10⁻¹² m2s-1 and Ea = 3.69671× 10⁻¹⁹J.

115
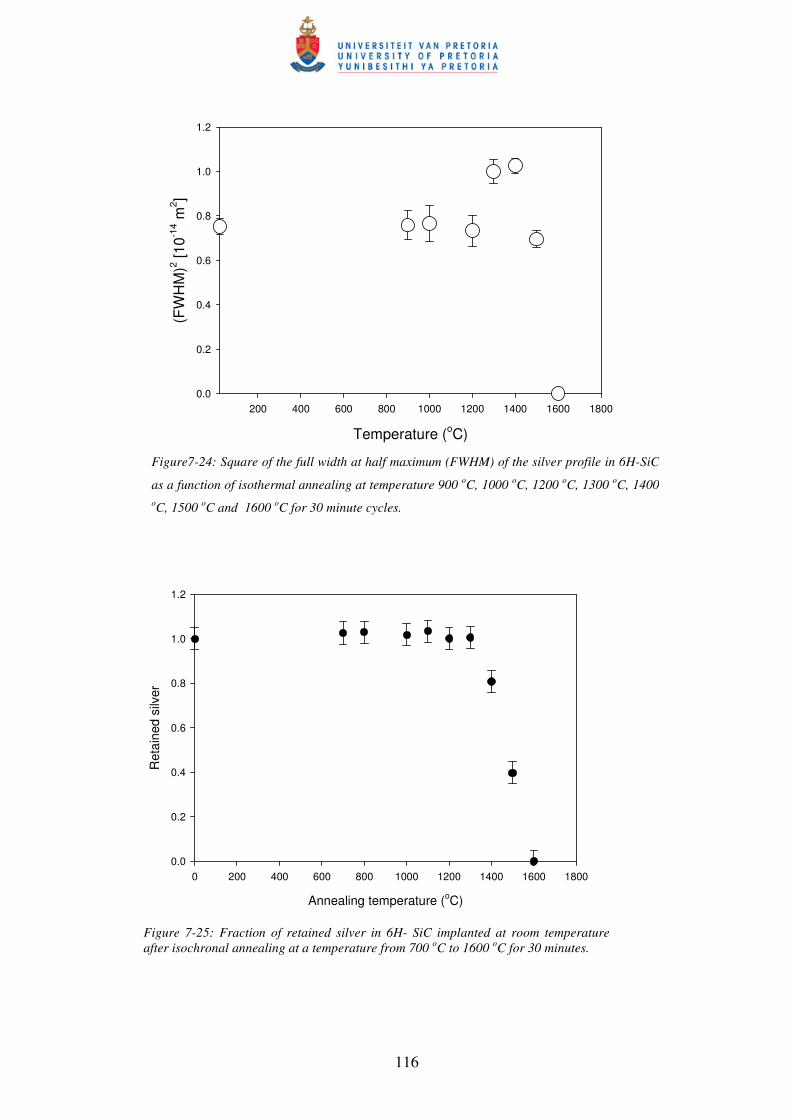
starts at 1300 oC while silver loss begins at lower temperatures (see figures 7-23 to 7-
25). The rest of the results are similar to the isochronal results of the 10 hours cycle
except that the amount of silver lost at 1300 oC for 30 minutes is less than that at 1300 oC for 10 hours. This is due to the shorter annealing time and the sequential annealing
at low temperatures. The silver profiles indicate the decrease in widths at the
temperatures below 1300 oC, due to silver forming some precipitates as explained
earlier in this section. The silver profile seems to maintain its symmetric shape with
the sample annealed at 1400 oC for 30 minutes. This is due to the recrystallization
during annealing at the temperatures below 1300 oC for a 30 minutes cycle and the
shorter annealing time at 1300 oC since the same sample was sequentially annealed
from 700 oC.
Ag+(360 keV) 6H-SiCΦ = 2 x 1016 cm-2
Depth(nm)
-100 0 100 200 300 400
Yie
ld
0
200
400
600
800
1000
1200
1400
1600
As-implantedTa = 1100 oC, ta = 30 min
Ta = 1200 oC, ta = 30 min
Ta = 1300 oC, ta = 30 min
Ta = 1400 oC, ta = 30 min
Ta = 1500 oC, ta = 30 min
Figure 7-23: Silver depth profiles of 6H-SiC implanted at room temperature after
isochronal annealing at 1100 oC, 1200 oC, 1300 oC, 1400 oC and 1500 oC for
a 30 minute cycle.
116
Temperature (oC)
200 400 600 800 1000 1200 1400 1600 1800
(FW
HM
)2 [10-1
4 m2 ]
0.0
0.2
0.4
0.6
0.8
1.0
1.2
Figure7-24: Square of the full width at half maximum (FWHM) of the silver profile in 6H-SiC
as a function of isothermal annealing at temperature 900 oC, 1000 oC, 1200 oC, 1300 oC, 1400 oC, 1500 oC and 1600 oC for 30 minute cycles.
Annealing temperature (oC)
0 200 400 600 800 1000 1200 1400 1600 1800
Ret
aine
d si
lver
0.0
0.2
0.4
0.6
0.8
1.0
1.2
Figure 7-25: Fraction of retained silver in 6H- SiC implanted at room temperature after isochronal annealing at a temperature from 700 oC to 1600 oC for 30 minutes.

117
7.2.2 HIGH TEMPERATURE IMPLANTATIONS In this section the results of silver implanted into 6H-SiC at 350 oC and 600 oC are
discussed. In subsection 7.2.2.1 the radiation damage results are considered while in
subsection 7.2.2.2 the diffusion results are discussed.
7.2.2.1 RADIATION DAMAGE RESULTS Rutherford Backscattering Spectroscopy combined with channelling of alpha particles
was used to examine the annealing of radiation damage of silver implanted in 6H-SiC
at 350 oC and 600 oC. These spectra are compared with the spectrum from an
unimplanted sample as shown in figure 7-26. Implantation of silver at 600 oC retains
crystallinity although distortions occur in the implanted region. This is evident from
the broad peak around 180 nm in figure 7-26. This damage peak is deeper than the
typical projected range Rp= 102 nm of the silver peak measured and that predicted by
TRIM 98 Rp= 106nm. The damage peak predicted by TRIM 98 is at a depth of about
90 nm (see figure 3.10). The discrepancy has already been explained in subsection
7.2.1.2.
Implantation at 350 oC also retains crystallinity but with more distortions created
when compared to silver implanted at 600 oC. This is caused by the fact that at
600 oC, the displaced atoms are more mobile because of their higher thermal energy
than at 350 oC. The greater energy increases the probability of the displaced atoms
returning to their original lattice sites. These implantation results indicate the
irradiation hardness of SiC during implantation at these two temperatures. Similar
radiation hardness of SiC above 300 oC has been reported for other heavy ions
[Wen98].

118
Depth(nm)
0 200 400 600 800
Yie
ld
0
500
1000
1500
2000
2500
3000
RandomVirginTi = 350 oC
Ti = 600 oC
Figure 7-26: Random and aligned backscattering spectra of targets implanted at 350 oC and 600 oC with a fluence of 2×10¹⁶ Ag+cm-2 compared with an unimplanted sample. The �–particles’ energy was 1.6 MeV and the scattering angle was 165o.
Depth (nm)
0 200 400 600 800
Yie
ld
0
500
1000
1500
2000
2500
3000
RandomVirginas-implanted10 hours20 hours40 hours
Figure 7-27: Random and aligned backscattering spectra from targets implanted at 350 oC with a fluence of 2×10¹⁶ Ag+cm-2and subjected to isothermal annealing at 1300 oC for 10 hour cycles up to 40 hours.
119
Depth (nm)
0 200 400 600 800
Yie
ld
0
500
1000
1500
2000
2500
3000
3500
RandomVirginas-implanted10 hours20 hours40 hours
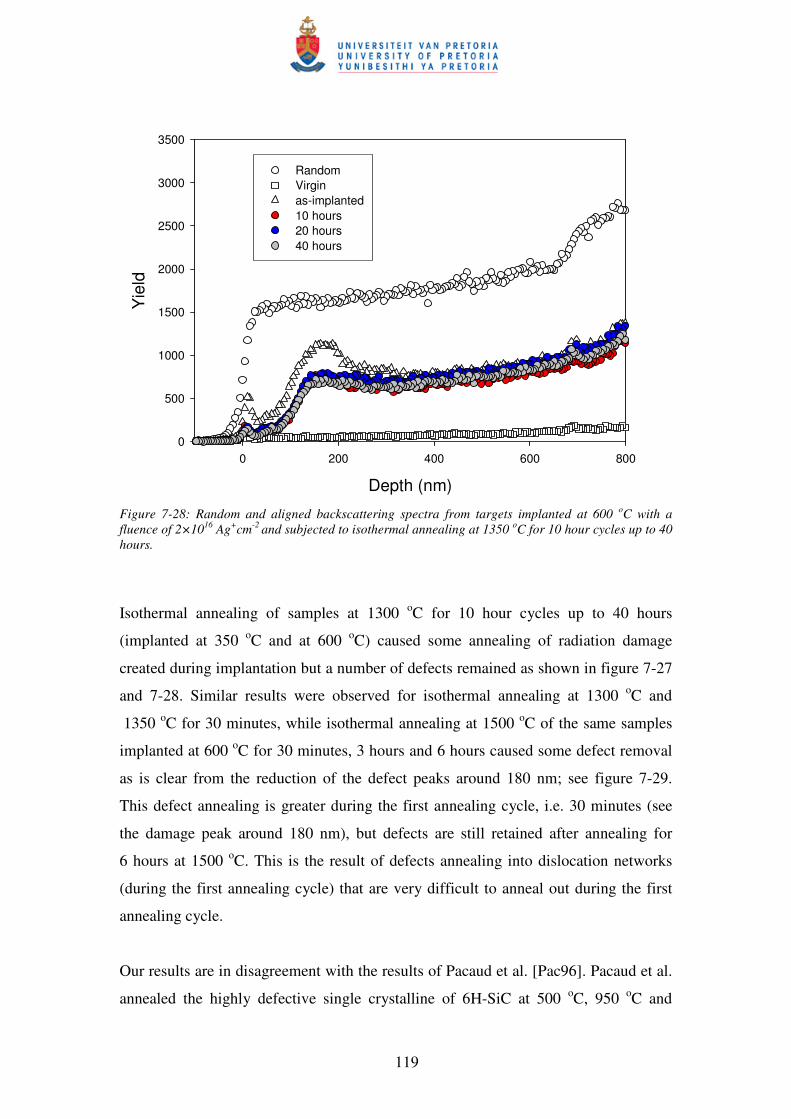
Figure 7-28: Random and aligned backscattering spectra from targets implanted at 600 oC with a fluence of 2×10¹⁶ Ag+cm-2 and subjected to isothermal annealing at 1350 oC for 10 hour cycles up to 40 hours.
Isothermal annealing of samples at 1300 oC for 10 hour cycles up to 40 hours
(implanted at 350 oC and at 600 oC) caused some annealing of radiation damage
created during implantation but a number of defects remained as shown in figure 7-27
and 7-28. Similar results were observed for isothermal annealing at 1300 oC and
1350 oC for 30 minutes, while isothermal annealing at 1500 oC of the same samples
implanted at 600 oC for 30 minutes, 3 hours and 6 hours caused some defect removal
as is clear from the reduction of the defect peaks around 180 nm; see figure 7-29.
This defect annealing is greater during the first annealing cycle, i.e. 30 minutes (see
the damage peak around 180 nm), but defects are still retained after annealing for
6 hours at 1500 oC. This is the result of defects annealing into dislocation networks
(during the first annealing cycle) that are very difficult to anneal out during the first
annealing cycle.
Our results are in disagreement with the results of Pacaud et al. [Pac96]. Pacaud et al.
annealed the highly defective single crystalline of 6H-SiC at 500 oC, 950 oC and

120
1500 oC for 10 minutes. Their results showed that at 1500 oC all the defects were
annealed out. The discrepancy in our results could be explained by the fact that in the
case of Pacaud et al. the annealing of defects also took place from the low temperature
annealing up to 1500 oC for a shorter period, while in our study it was only the
isothermal annealing of the same samples at 1500 oC. Hence in our case the samples
experienced the same thermal stresses during cooling to room temperature as in the
experiments by Pacaud et al.
Depth(nm)
0 200 400 600 800
Yie
ld
0
500
1000
1500
2000
2500
3000
3500Random
VirginAs-implanted30 min3 h6 h
Figure 7-29: Random and aligned backscattering spectra from targets implanted at 600 oC with a fluence of 2×10¹⁶ Ag+cm-2 and submitted to isothermal annealing at 1500 oC for 30 minutes, 3 hours and 6 hours.
7.2.2.2 IMPLANTED LAYER DIFFUSION RESULTS The typical depth profiles of silver implanted in 6H-SiC at room temperature, 350 oC
and 600 oC were compared with TRIM 98 predictions and are shown in figure 7-30.
Their moments are as follows: room temperature implantation (Rp = 109 nm
� = 39 nm, = 2.98, = 0.15), 350 oC implantation (Rp = 102 nm, � = 38.69 nm,
121
= 2.83 and = 0.42), 600 oC implantation (Rp =102nm, � = 40.2 nm, = 3.03 and
= 0.4) and TRIM98 (Rp =106 nm, � = 26.78 nm, = 2.78 nm and
= 0.069).The projected range of silver implanted at room temperature is 2% deeper
compared to those implanted at 350 oC and 600 oC. This is within experimental error
and might also be due to the differences in stopping power between amorphous and
crystalline SiC. The broader silver peaks in the measurements are due to the reasons
discussed in section 7.2.1.2.
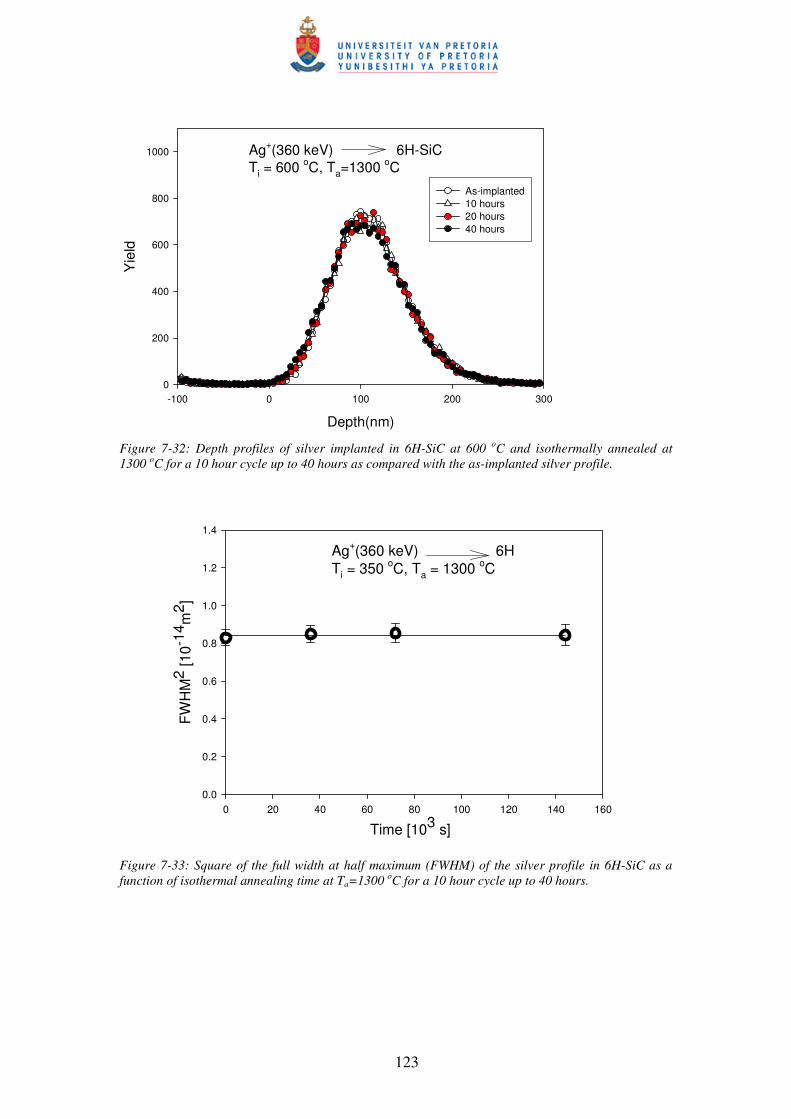
The depth profiles of silver implanted in 6H-SiC at 350 oC and at 600 oC after
isothermal annealing at 1300 oC for 10 hour cycles up to 40 hours compared to the
as-implanted profiles are displayed in figures 7-31 and 7-32. Their corresponding full
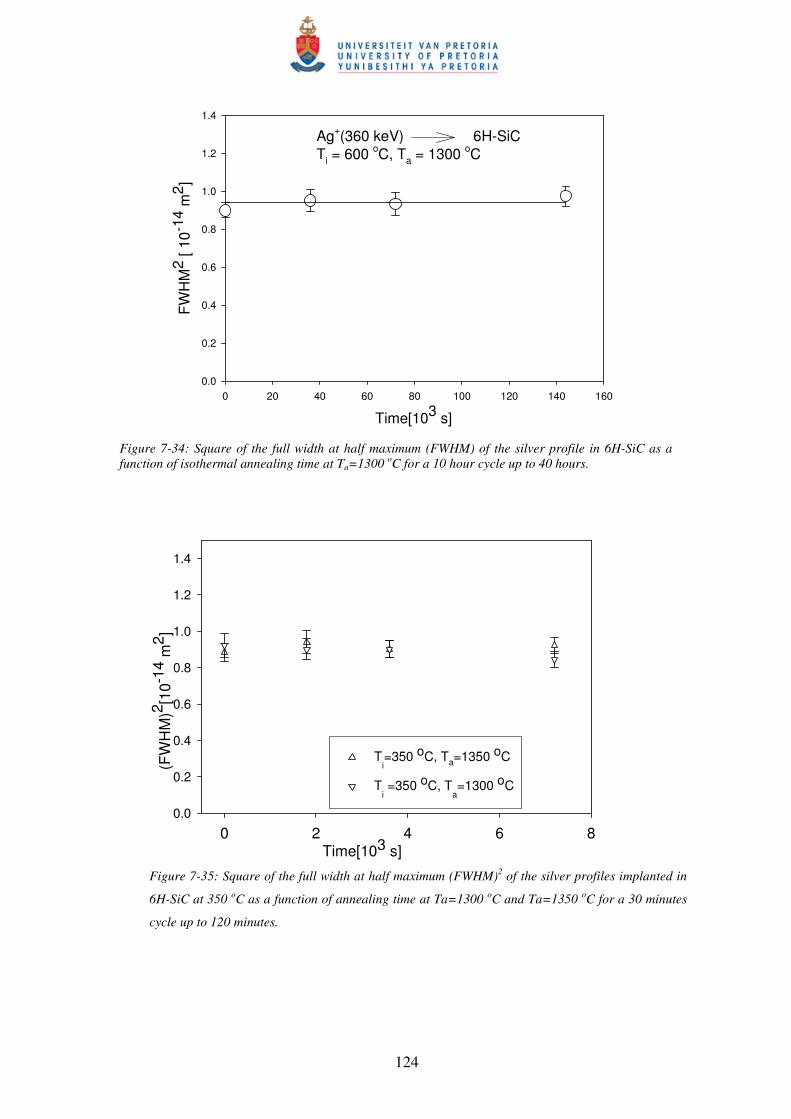
widths at half maximum square (FWHM)2’ s are depicted in figure 7-33 and figure
7-34. From these results it is evident that no detectable diffusion of silver either into
the bulk or towards the surface is taking place and that silver loss is almost zero for
both samples at this annealing temperature. These results are in agreement with the
results of Jiang et al. who found no diffusion of silver in crystalline SiC [Jia04].
The diffusion coefficient obtained from fitting the experimental data (for ta =10 h to
ta= 40 h) to a straight line yields an upper limit of: D6H < 10-21 m2s-1 at 1300 oC for
600 oC implanted samples. This result is of the same order of magnitude as the results
of MacLean et al. [Mac06], who established an upper limit of: D < 5×10-21 m2s- 1 at
1500 oC even though our temperature is 200 oC less. This implies that our technique
(RBS) exhibits a better depth resolution than the XPS used by MacLean et al.
[Mac04]. Hence, if the diffusion coefficient is D ~ 5×10-21 m2s-1 our RBS
measurements should have detected it.

122
Isothermal annealing of samples (implanted at 350 oC and 600 oC) at 1300 oC and
1350 oC for 30 minutes up to 120 minutes caused no diffusion of silver as can be
observed from figure 7-35 and figure 7-36.
Ag+(360 keV) 6H-SiCTi = 350 oC, Ta = 1300 oC
Depth(nm)
-100 0 100 200 300
Yie
ld
0
200
400
600
800
1000
As-implanted10 hours20 hours40 hours
Figure 7-31: Depth profiles of silver implanted in 6H-SiC at 350 oC and isothermally annealed at 1300 oC for a 10 hour cycle up to 40 hours as compared with the as-implanted silver profile.
360 keV Ag+ 6H-SiC
Φ=2x1016 cm-2
Depth(nm)0 50 100 150 200 250 300
Rel
ativ
e at
omic
den
sity
(%)
0
1
2
3
4
5
Ti = 23 oC
Ti = 350 oC
Ti = 600 oC
TRIM 98
Figure 7-30: Depth profiles of silver implanted in 6H-SiC at room temperature, 350 oC and at 600 oC as compared with TRIM98 prediction.
123
Ag+(360 keV) 6H-SiCTi = 600 oC, Ta=1300 oC
Depth(nm)
-100 0 100 200 300
Yie
ld
0
200
400
600
800
1000
As-implanted10 hours20 hours40 hours
Figure 7-32: Depth profiles of silver implanted in 6H-SiC at 600 oC and isothermally annealed at 1300 oC for a 10 hour cycle up to 40 hours as compared with the as-implanted silver profile.
Ag+(360 keV) 6HTi = 350 oC, Ta = 1300 oC
Time [103 s]0 20 40 60 80 100 120 140 160
FWH
M2
[10-1
4 m2 ]
0.0
0.2
0.4
0.6
0.8
1.0
1.2
1.4
Figure 7-33: Square of the full width at half maximum (FWHM) of the silver profile in 6H-SiC as a function of isothermal annealing time at Ta=1300 oC for a 10 hour cycle up to 40 hours.
124
Ag+(360 keV) 6H-SiCTi = 600 oC, Ta = 1300 oC
Time[103 s]
0 20 40 60 80 100 120 140 160
FWH
M2
[ 10-1
4 m2 ]
0.0
0.2
0.4
0.6
0.8
1.0
1.2
1.4
Figure 7-34: Square of the full width at half maximum (FWHM) of the silver profile in 6H-SiC as a function of isothermal annealing time at Ta=1300 oC for a 10 hour cycle up to 40 hours.
Time[103 s]0 2 4 6 8
(FW
HM
)2 [10-1
4 m2 ]
0.0
0.2
0.4
0.6
0.8
1.0
1.2
1.4
Ti=350 oC, Ta=1350 oC
Ti =350 oC, T
a=1300 oC
Figure 7-35: Square of the full width at half maximum (FWHM)2 of the silver profiles implanted in
6H-SiC at 350 oC as a function of annealing time at Ta=1300 oC and Ta=1350 oC for a 30 minutes
cycle up to 120 minutes.

125
Time(103s)
0 2 4 6 8
(FW
HM
)2 [10-1
4 m2 ]
0.0
0.2
0.4
0.6
0.8
1.0
1.2
1.4
T i= 600 oC, Ta = 1350 oC
T i = 600 oC, Ta= 1300 oC
Figure 7-36: Square of the full width at half maximum (FWHM)2 of the silver profiles implanted in 6H-SiC at 600 oC as a function of annealing time at Ta=1300 oC and Ta=1350 oC for a 30 minute cycle up to 120 minutes.
The immobility and negligible loss of silver at 1300 oC and 1350 oC in the samples
implanted at 600 oC allowed further investigation of silver diffusion at temperatures
higher than 1300 oC. Isothermal annealing of the sample (implanted at 600 oC) at
1500 oC was performed for different cycles. The results are illustrated in figures 7-37
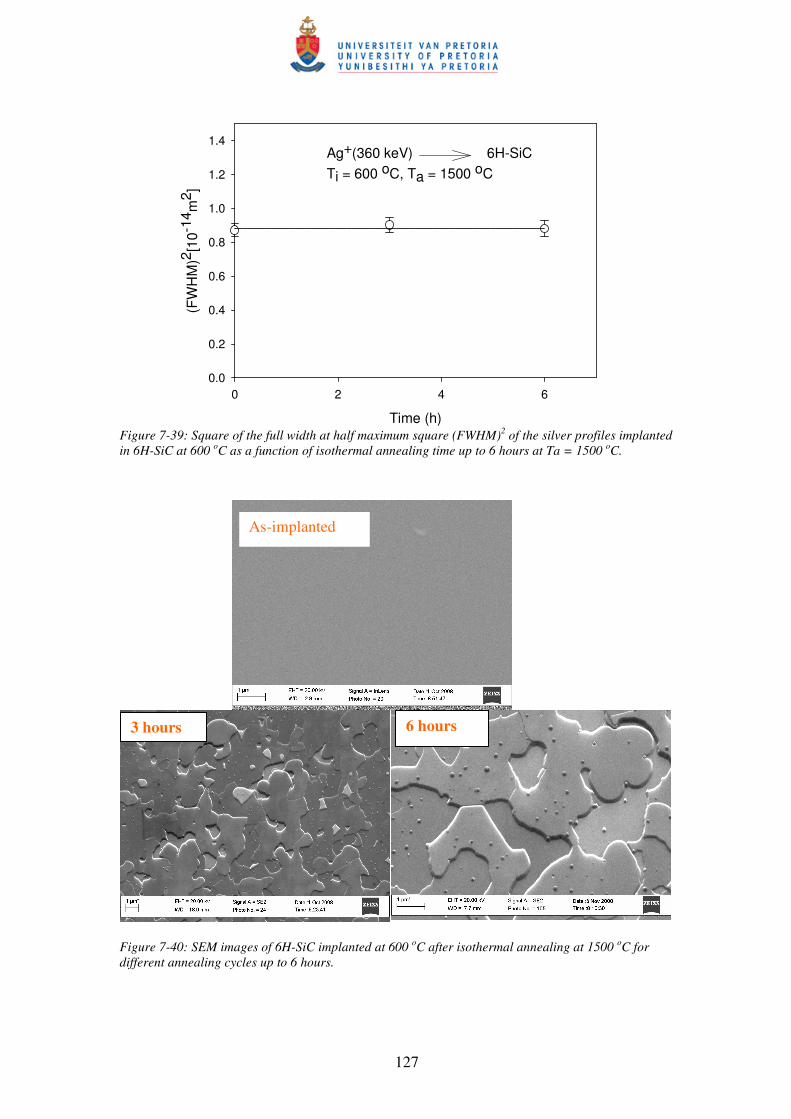
to 7-40. RBS results showed that annealing at 1500 oC caused no broadening in the
silver profiles, but the shift towards the surface was observed for annealing times as
short as 30 minutes and was more pronounced at longer annealing times. SEM
analyses of the SiC surface indicated the deterioration of the surface, which was
probably due to the thermal etching of material during annealing [Cap98][Cap99].
This is evident from the formation of the steps in
figure 7-40. These steps indicate that the etching rate is not uniform over the whole
surface due to the damage created during implantation. Therefore, the shift of the
silver peak towards the surface at 1500 oC is due to thermal etching (see figure 7-37
and figure 7-38). These results also explain the shift of the silver peak towards the
surface observed at 1500 oC for 10 hours.
The slope of the silver peak position versus the annealing time (see figure 7-38) is
steep during the first annealing cycle, indicating more thermal etching, but reduces as
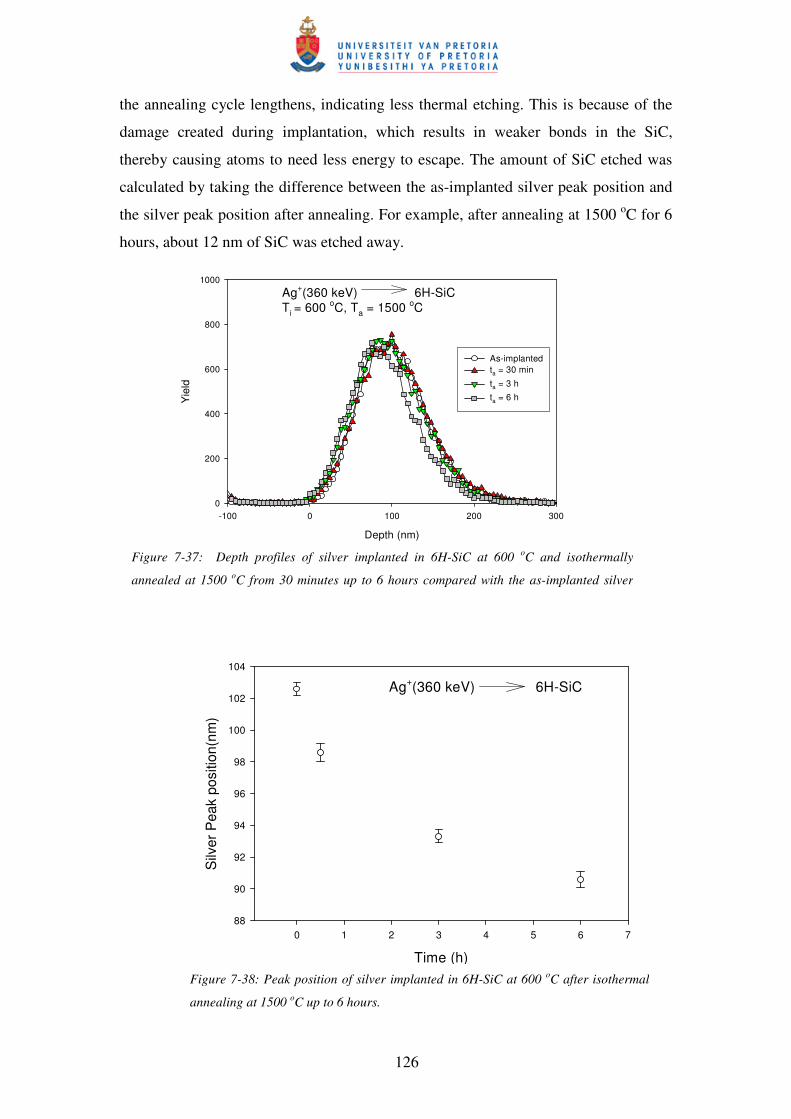
126
the annealing cycle lengthens, indicating less thermal etching. This is because of the
damage created during implantation, which results in weaker bonds in the SiC,
thereby causing atoms to need less energy to escape. The amount of SiC etched was
calculated by taking the difference between the as-implanted silver peak position and
the silver peak position after annealing. For example, after annealing at 1500 oC for 6
hours, about 12 nm of SiC was etched away.
Ag+(360 keV) 6H-SiCTi = 600 oC, Ta = 1500 oC
Depth (nm)
-100 0 100 200 300
Yie
ld
0
200
400
600
800
1000
As-implantedta = 30 min
ta = 3 hta = 6 h
Ag+(360 keV) 6H-SiC
Time (h)
0 1 2 3 4 5 6 7
Silv
er P
eak
posi
tion(
nm)
88
90
92
94
96
98
100
102
104
Figure 7-38: Peak position of silver implanted in 6H-SiC at 600 oC after isothermal
annealing at 1500 oC up to 6 hours.
Figure 7-37: Depth profiles of silver implanted in 6H-SiC at 600 oC and isothermally
annealed at 1500 oC from 30 minutes up to 6 hours compared with the as-implanted silver
127
Time (h)
0 2 4 6
(FW
HM
)2 [10-1
4 m2 ]
0.0
0.2
0.4
0.6
0.8
1.0
1.2
1.4Ag+(360 keV) 6H-SiCTi = 600 oC, Ta = 1500 oC
Figure 7-39: Square of the full width at half maximum square (FWHM)2 of the silver profiles implanted in 6H-SiC at 600 oC as a function of isothermal annealing time up to 6 hours at Ta = 1500 oC.
Figure 7-40: SEM images of 6H-SiC implanted at 600 oC after isothermal annealing at 1500 oC for different annealing cycles up to 6 hours.
As-implanted
3 hours 6 hours
128
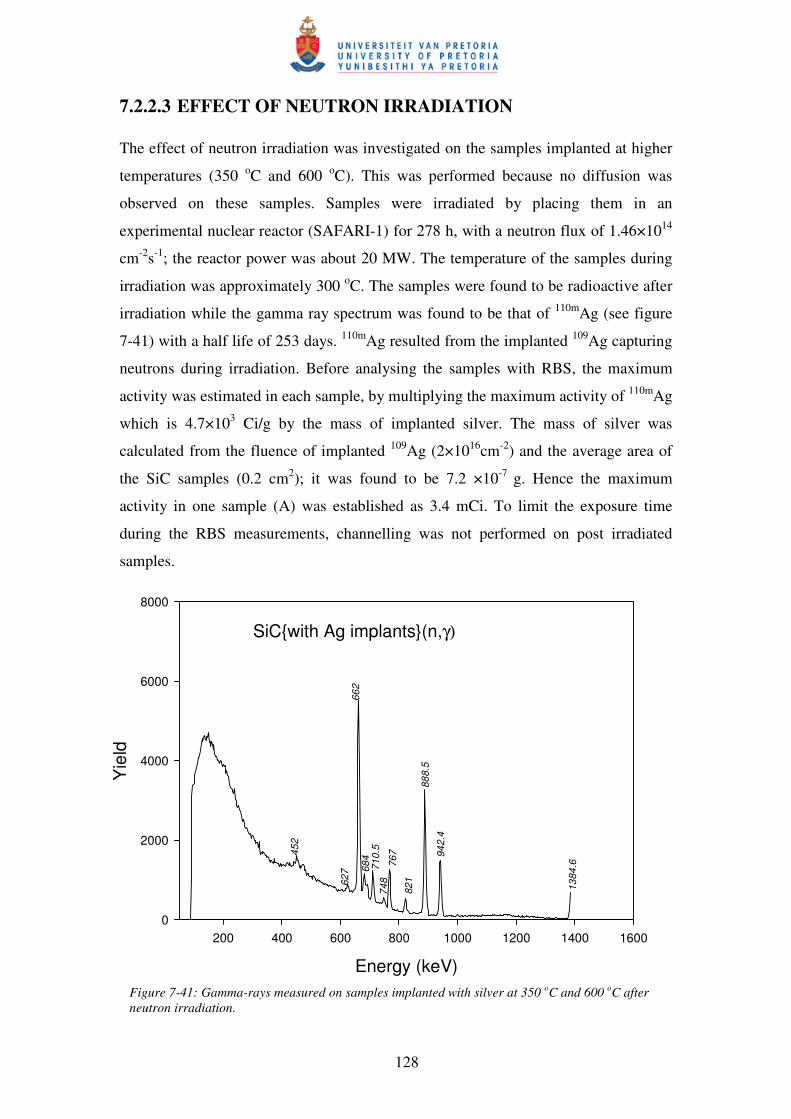
7.2.2.3 EFFECT OF NEUTRON IRRADIATION The effect of neutron irradiation was investigated on the samples implanted at higher
temperatures (350 oC and 600 oC). This was performed because no diffusion was
observed on these samples. Samples were irradiated by placing them in an
experimental nuclear reactor (SAFARI-1) for 278 h, with a neutron flux of 1.46×10¹⁴
cm-2s-1; the reactor power was about 20 MW. The temperature of the samples during
irradiation was approximately 300 oC. The samples were found to be radioactive after
irradiation while the gamma ray spectrum was found to be that of 110mAg (see figure
7-41) with a half life of 253 days. 110mAg resulted from the implanted 109Ag capturing
neutrons during irradiation. Before analysing the samples with RBS, the maximum
activity was estimated in each sample, by multiplying the maximum activity of 110mAg
which is 4.7×10³ Ci/g by the mass of implanted silver. The mass of silver was
calculated from the fluence of implanted 109Ag (2×1016cm-2) and the average area of
the SiC samples (0.2 cm2); it was found to be 7.2 ×10⁻⁷ g. Hence the maximum
activity in one sample (A) was established as 3.4 mCi. To limit the exposure time
during the RBS measurements, channelling was not performed on post irradiated
samples.
Energy (keV)
200 400 600 800 1000 1200 1400 1600
Yie
ld
0
2000
4000
6000
8000
1384
.6
942.
488
8.5
821
767
748
710.
568
466
262
7
452
SiC{with Ag implants}(n,γ)
Figure 7-41: Gamma-rays measured on samples implanted with silver at 350 oC and 600 oC after neutron irradiation.

129
The silver profiles of the neutron irradiated sample which was implanted with Ag at
350 oC compared with the as-implanted silver profile are illustrated in figure 7-42.
The as-implanted silver profile and the silver profile of the neutron irradiated profile
are identical because RBS is unable to resolve the difference between 109Ag and 110mAg. This is caused by the insufficient mass resolution of the RBS at high masses.
The identical profiles indicate that neutron irradiation caused no diffusion of silver
through SiC at room temperature. Similar results were observed in the samples
implanted at 600 oC. No annealing was performed on these samples because any 110mAg release would contaminate the furnace which would endanger the personnel
involved.
Depth(nm)
0 50 100 150 200 250 300
Yie
ld
0
200
400
600
As-implantedpost irradiation
Figure 7-42: Silver depth profiles of the post irradiated SiC implanted (at 350 oC) compared with the as-implanted profiles.

130
7.3 REFERENCES [Boh87] H. G. Bohn, J.M. Williams, C.J. McHargue, G.M. Begun, J. Mat. Res.
2 (1987) 106. [Cap98] M. A. Capano, S. Ryu, M.R. Melloch, J. A. Jr. Cooper, M. R. Buss, J. Elec. Mat. 27 (1998) 370. [Cap99] M. A. Capano, S. Ryu, J.A. Jr., Cooper, M. R. Melloch, K. Rottner, S. Karlsson, et al. J. Elec. Mat. 28 (1999) 214. [Fel68] D.W. Feldmann, J. H. Parker, W. J. Choyke, L. Patrick, Phys. Rev. 170 (1968) 698. [Fen99] Z. C. Feng, S. T. Chua, K. Tone, J. H. Zhao, Appl. Phys. Lett. 75 (199) 472 [Fri09] E. Friedland, J.B. Malherbe, N.G. van der Berg , T. Hlatshwayo, A.J. Botha, E. Wendler , W. Wesch, J.Nucl.Mat. 389 (2009) 326. [Jia04] W. Jiang, W.J. Weber, V. Shutthanandan, L. Li, S. Thevuthasan, Nucl. Instr. and Meth. 219/220 (2004) 642. [Mac06] H.J. MacLean, R.G. Ballinger, L.E. Kolaya, S.A. Simonson, N. Lewis,
M.E. Hanson, J. Nucl. Mater. 357 (2006) 31. [Nab77] H. Nabielek, P.E. Brown, P. Offermann, Nucl. Tech. 35 (1977) 483.
[Nak02] T. Nakamura, S. Matsumoto and M. Satoh, J. Cryst. Grow. 237-239 (2002) 1264. [Pac96] Y. Pacaud, J. Stoemenos, G. Brauer, R.A. Yonkov, V. Heera,
M. Voelskow, R. Kögler, W. Skorupa, Nucl. Instr. and Meth. B120 (1996) 177.
[Rao03] M. V. Rao, Solid-State Electronics, 47 (2003) 213. [Shu69] F.A. Shunk, Constitution of Binary Alloys, McGraw-Hill Company, New
York (1969).
[Tes95] J. R. Tesmer, M. Nastasi, Handbook of Modern Ion Beam Materials
Analysis, Mat. Res. Soc. Pittsburgh, Pennsylvania (1995)
[Wen98] E. Wendler, A. Heft, W. Wesch, Nucl. Instr. and Meth. B141 (1998) 105.