Chapter 7 Overview: Standard Costs and Variances · PDF file · 2018-02-25material...
44
Chapter 7 Overview: Standard Costs and Variances
Transcript of Chapter 7 Overview: Standard Costs and Variances · PDF file · 2018-02-25material...
Chapter 7 Overview: Standard Costs and
Variances

7.1 What Are Standards?

Controlling Via Standards
• Standards are the predetermined expectations of the inputs necessary to achieve a unit of output – Standard costs provide an assessment of what
those inputs should cost
• Standards are important in planning and control – Ex) In a restaurant, managers set standards for
how many tables must be “turned,” and the bus staff is allowed only so much “breakage”
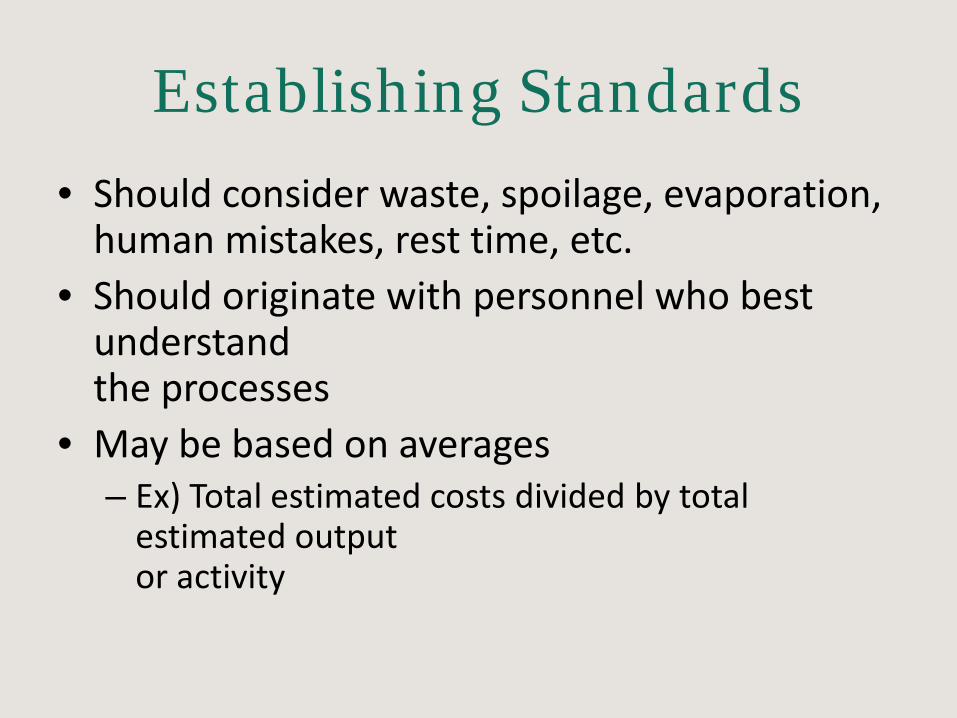
Establishing Standards
• Should consider waste, spoilage, evaporation, human mistakes, rest time, etc.
• Should originate with personnel who best understand the processes
• May be based on averages – Ex) Total estimated costs divided by total
estimated output or activity
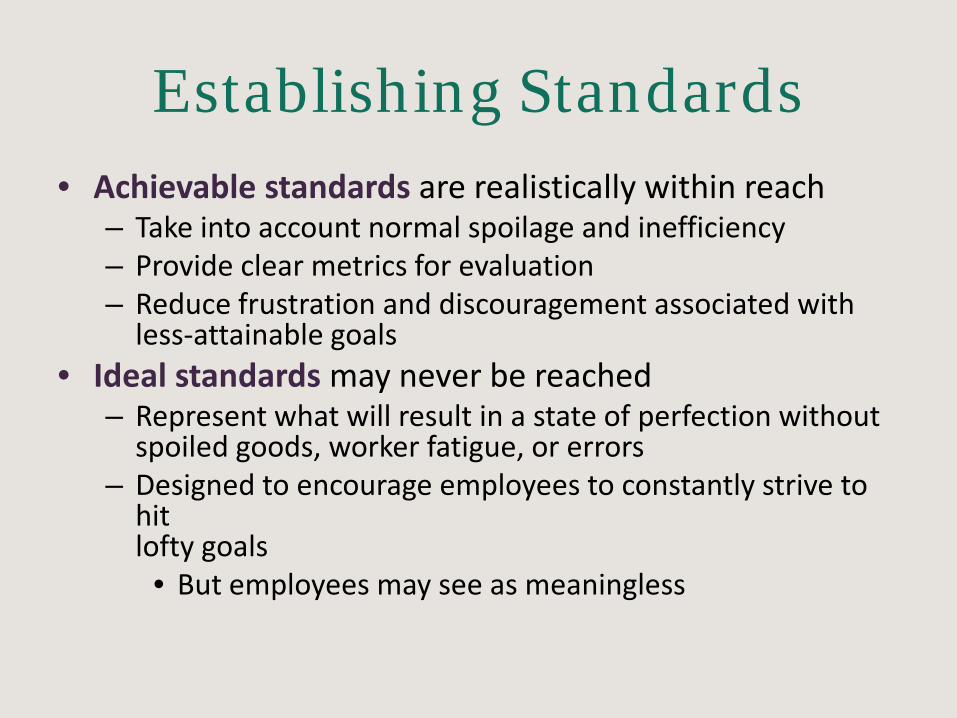
Establishing Standards • Achievable standards are realistically within reach
– Take into account normal spoilage and inefficiency – Provide clear metrics for evaluation – Reduce frustration and discouragement associated with
less-attainable goals • Ideal standards may never be reached
– Represent what will result in a state of perfection without spoiled goods, worker fatigue, or errors
– Designed to encourage employees to constantly strive to hit lofty goals
• But employees may see as meaningless
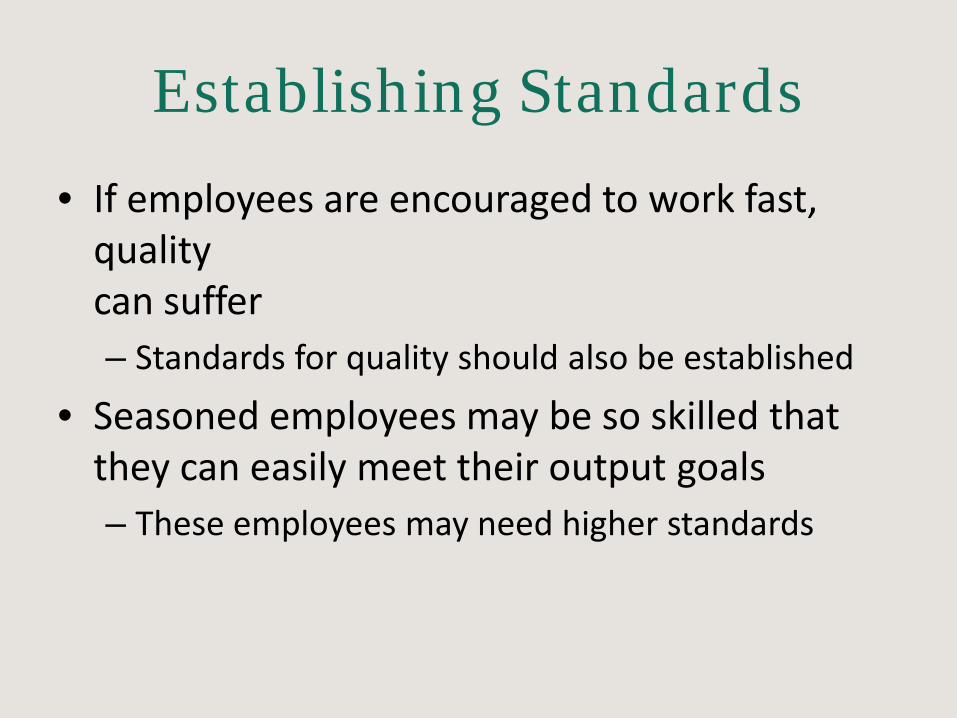
Establishing Standards
• If employees are encouraged to work fast, quality can suffer – Standards for quality should also be established
• Seasoned employees may be so skilled that they can easily meet their output goals – These employees may need higher standards
7.2 General Variance Model

• Standard costs are compared to actual costs, and deviations are termed variances – Favorable variances result when actual costs are less
than standard costs (and vice versa)
• Can be conducted for material, labor, and overhead
• When total actual costs differ from total standard costs, management should perform more analysis to determine the root causes of the variances

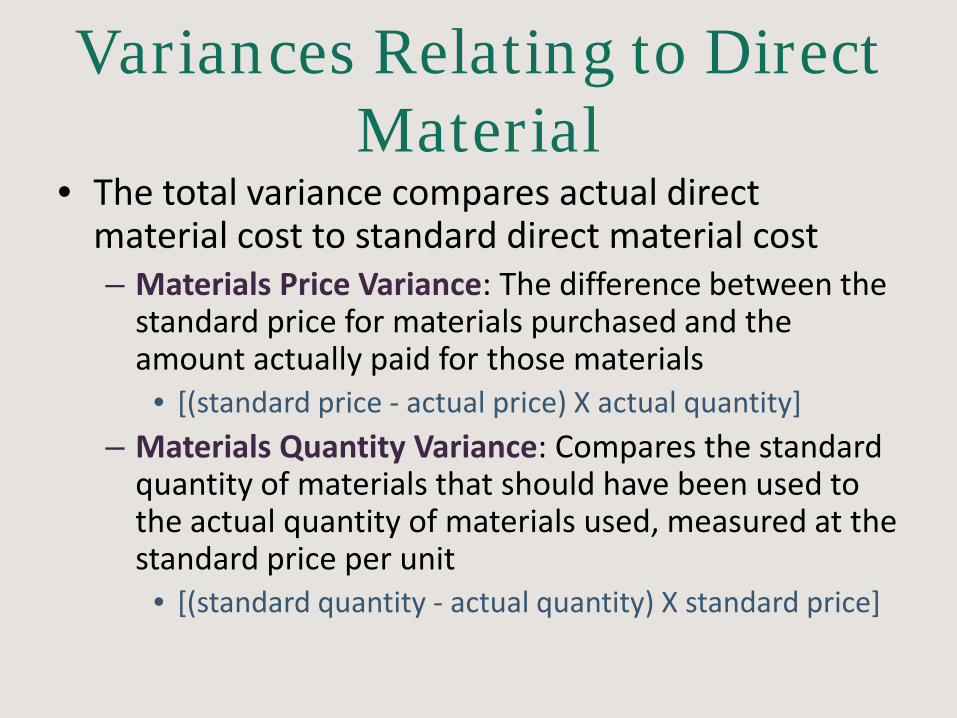
Variances Relating to Direct Material
• The total variance compares actual direct material cost to standard direct material cost – Materials Price Variance: The difference between the
standard price for materials purchased and the amount actually paid for those materials
• [(standard price - actual price) X actual quantity] – Materials Quantity Variance: Compares the standard
quantity of materials that should have been used to the actual quantity of materials used, measured at the standard price per unit
• [(standard quantity - actual quantity) X standard price]
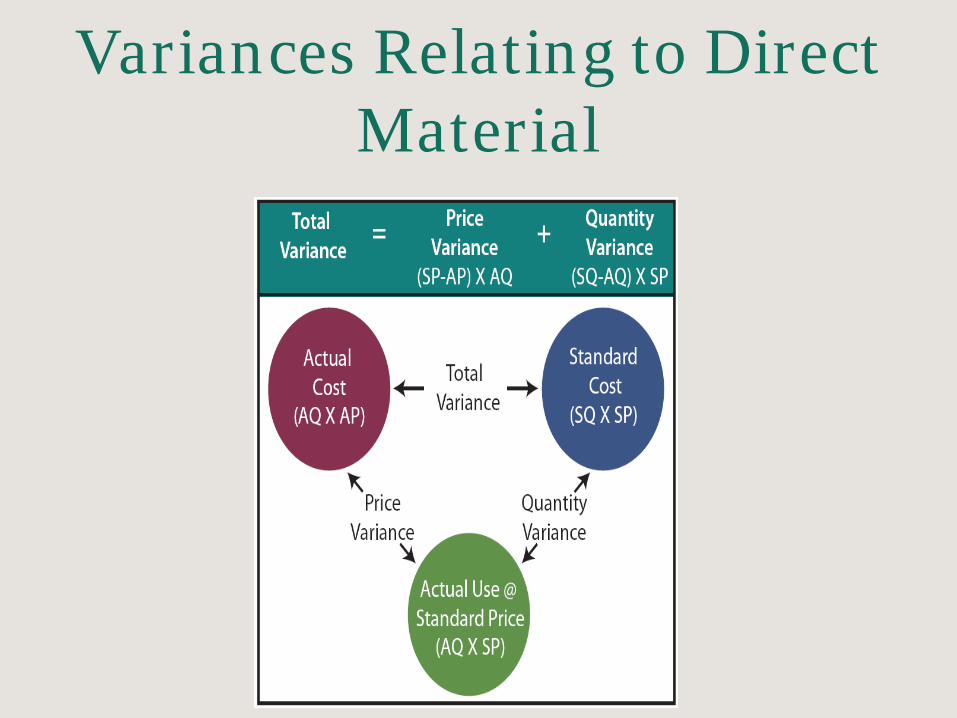
Variances Relating to Direct Material
Variances Relating to Direct Material
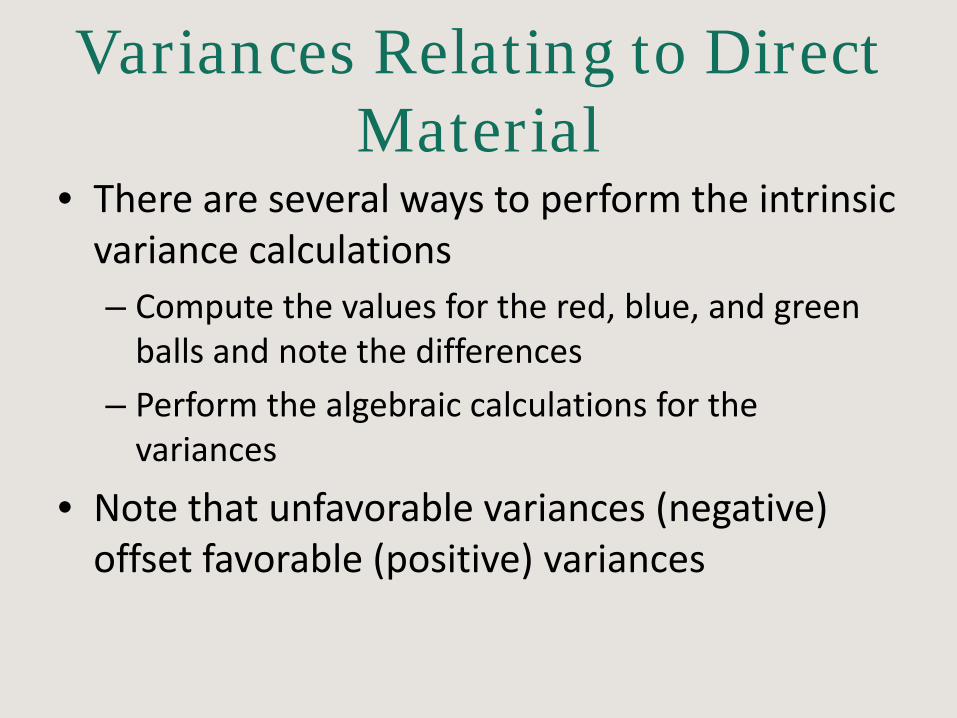
• There are several ways to perform the intrinsic variance calculations – Compute the values for the red, blue, and green
balls and note the differences
– Perform the algebraic calculations for the variances
• Note that unfavorable variances (negative) offset favorable (positive) variances

Variances Relating to Direct Material
• Blue Rail produces handrails, banisters, and similar welded products – The company has adopted a standard of 1.25
pieces (50’) of raw pipe per section of rail
– During August, Blue Rail produced 3,400 rail sections
– Pipe was anticipated to cost $80 per 40’ piece
– Actual material cost was $369,000
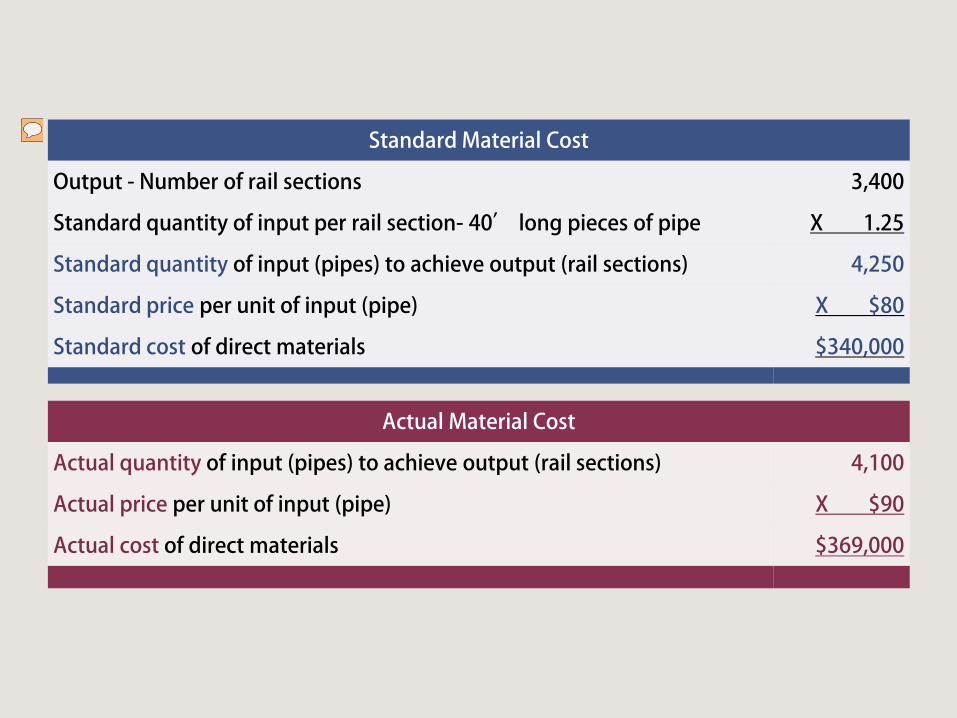
Standard Material Cost
Output - Number of rail sections 3,400
Standard quantity of input per rail section- 40’ long pieces of pipe X 1.25
Standard quantity of input (pipes) to achieve output (rail sections) 4,250
Standard price per unit of input (pipe) X $80
Standard cost of direct materials $340,000
Actual Material Cost
Actual quantity of input (pipes) to achieve output (rail sections) 4,100
Actual price per unit of input (pipe) X $90
Actual cost of direct materials $369,000
Presenter
Presentation Notes
Tables determining standard material cost and actual material cost for Blue Rail Manufacturing.

Variances Relating to Direct Material
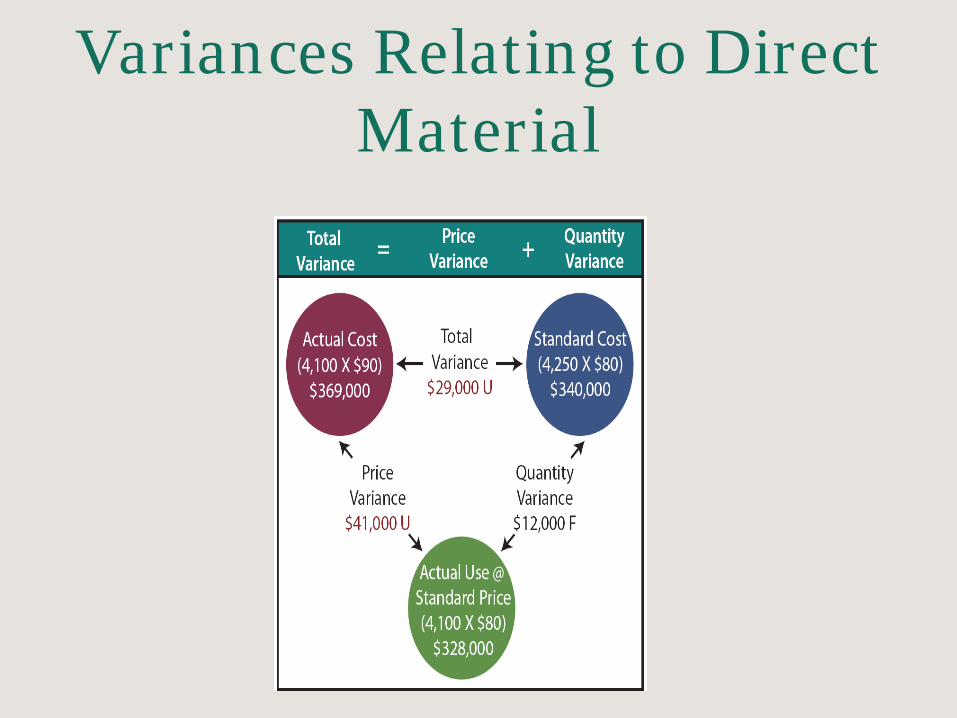
• The total direct material variance was unfavorable $29,000 ($340,000 vs. $369,000)
• This unfavorable outcome was driven by higher prices for raw material, not waste
MATERIALS PRICE VARIANCE (SP - AP) X AQ = ($80 - $90) X 4,100
= <$41,000>
MATERIALS QUANTITY VARIANCE (SQ - AQ) X SP = (4,250 - 4,100) X $80
=$12,000
This illustration presumes that all raw materials purchased are put into production. If this is not the case, the price variances would be based on the amount purchased
while the quantity variances would be based on output.
Variances Relating to Direct Material
Impact on the Ledger
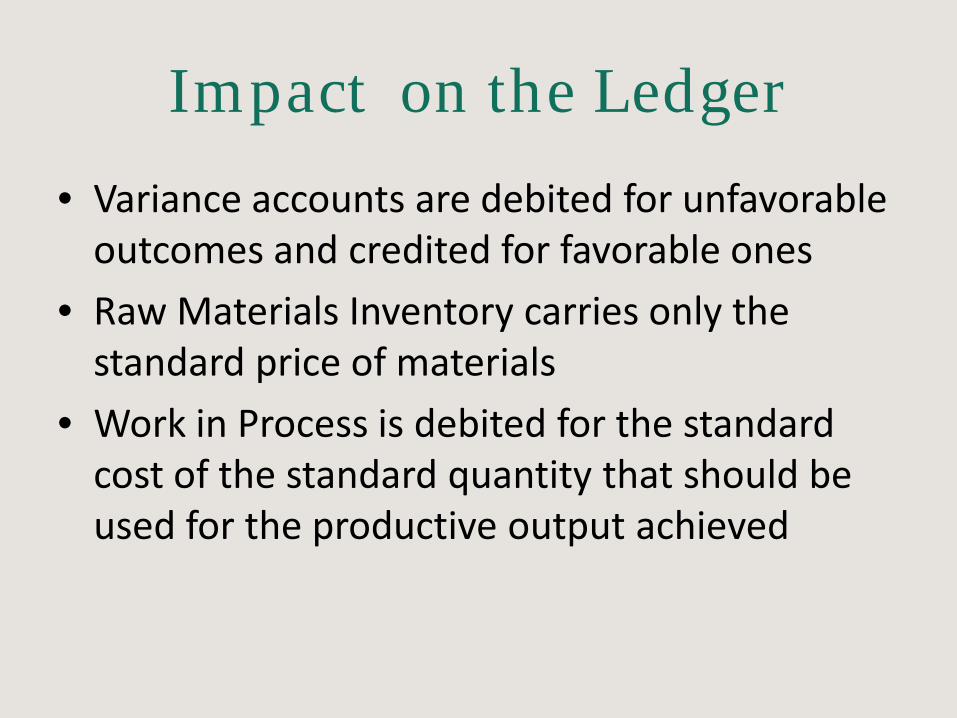
• Variance accounts are debited for unfavorable outcomes and credited for favorable ones
• Raw Materials Inventory carries only the standard price of materials
• Work in Process is debited for the standard cost of the standard quantity that should be used for the productive output achieved
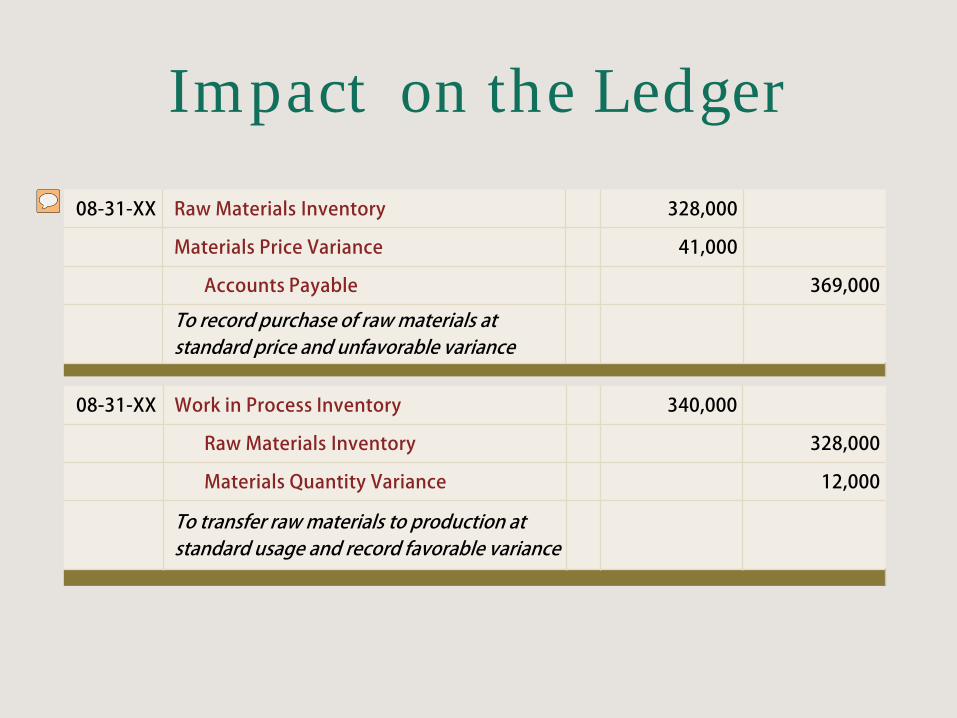
Impact on the Ledger
08-31-XX Raw Materials Inventory 328,000
Materials Price Variance 41,000
Accounts Payable 369,000
To record purchase of raw materials at standard price and unfavorable variance
08-31-XX Work in Process Inventory 340,000
Raw Materials Inventory 328,000
Materials Quantity Variance 12,000
To transfer raw materials to production at standard usage and record favorable variance
Presenter
Presentation Notes
Sample journal entries for recording purchase of raw materials at standard price and unfavorable variance and to transfer raw materials to production at standard usage and record favorable variance.

Impact on the Ledger

Variances Related to Direct Labor
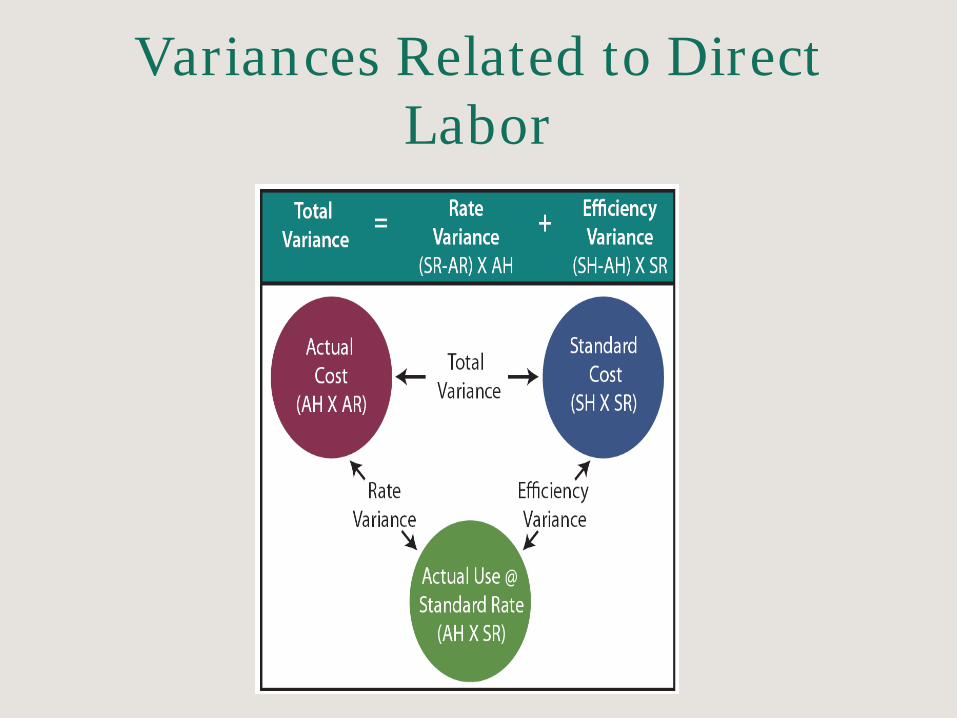
• The total variance is found by comparing actual direct labor cost to standard direct labor cost – Labor Rate Variance: The difference between the standard
rate and actual rate for the actual labor hours worked
• [(standard rate - actual rate) X actual hours]
– Labor Efficiency Variance: Compares the standard hours of direct labor that should have been used to the actual hours worked, measured at the standard rate per hour
• [(standard hours - actual hours) X standard rate]
Variances Related to Direct Labor

Variances Related to Direct Labor
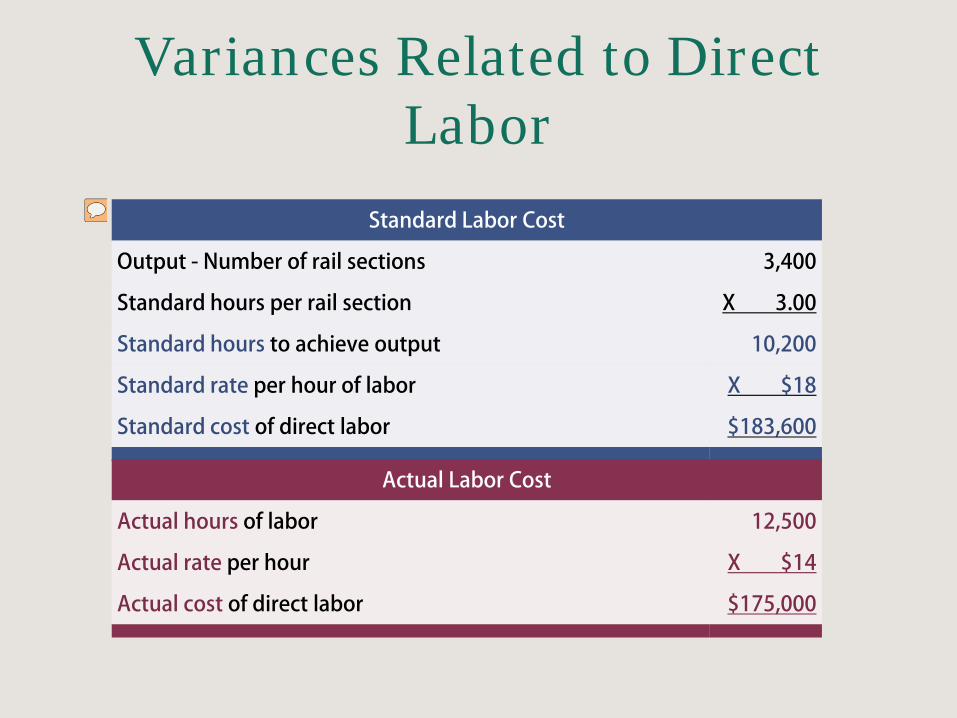
• Recall Blue Rail Manufacturing – During August, Blue Rail produced 3,400 rail
sections
– The company has adopted a standard of 3 labor hours for each section of rail
– Skilled labor is anticipated to cost $18 per hour
– Actual labor cost was $175,000
Variances Related to Direct Labor
Standard Labor Cost
Output - Number of rail sections 3,400
Standard hours per rail section X 3.00
Standard hours to achieve output 10,200
Standard rate per hour of labor X $18
Standard cost of direct labor $183,600
Actual Labor Cost
Actual hours of labor 12,500
Actual rate per hour X $14
Actual cost of direct labor $175,000
Presenter
Presentation Notes
Tables determining standard labor cost and actual labor cost for Blue Rail Manufacturing.

Variances Related to Direct Labor
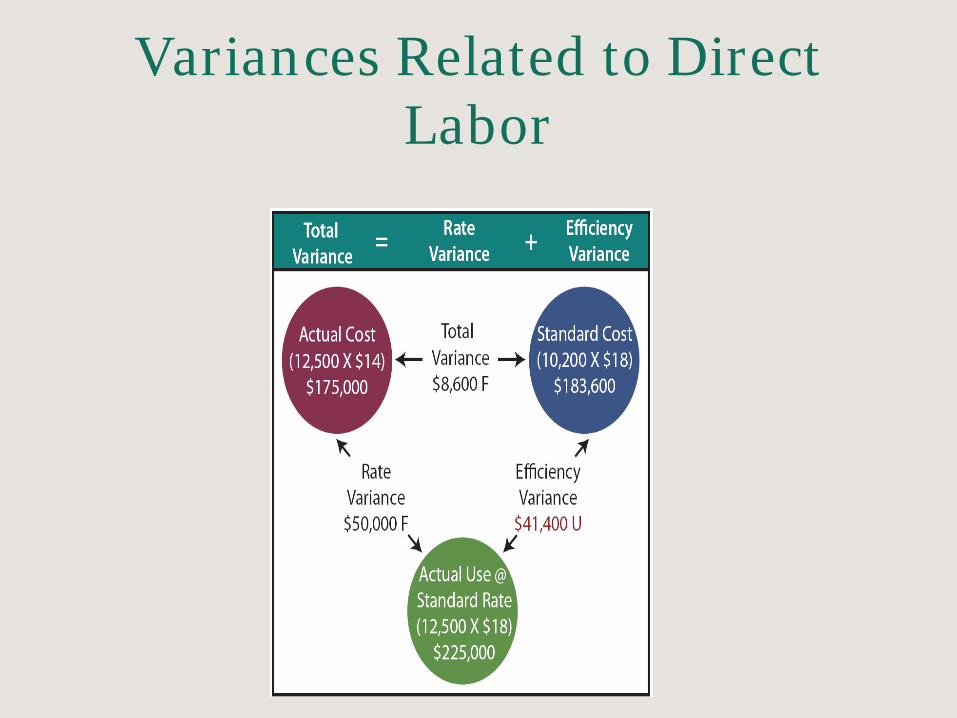
• The total direct labor variance was favorable $8,600 ($183,600 vs. $175,000)
• Blue Rail experienced a very favorable labor rate variance but this was offset by a significant unfavorable labor efficiency
LABOR RATE VARIANCE (SR - AR) X AH = ($18 - $14) X 12,500
= $50,000
LABOR EFFICIENCY VARIANCE (SH - AH) X SR = (10,200 - 12,500) X $18
=<$41,400>
Variances Related to Direct Labor

Impact on the Ledger
08-31-XX Work in Process Inventory 183,600
Labor Efficiency Variance 41,400
Labor Rate Variance 50,000
Wages Payable 175,000
To increase work in process for the standard direct labor costs and record the related efficiency and rate variances
Presenter
Presentation Notes
Sample journal entry for increasing work in process for the standard direct labor costs and to record the related efficiency rate and varainces.

Impact on the Ledger
Variances Related to Factory Overhead
• Recall that overhead has both variable and fixed components – As a result, variance analysis for overhead is split
between variances related to variable overhead and variances related to fixed overhead

Variances Related to Factory Overhead
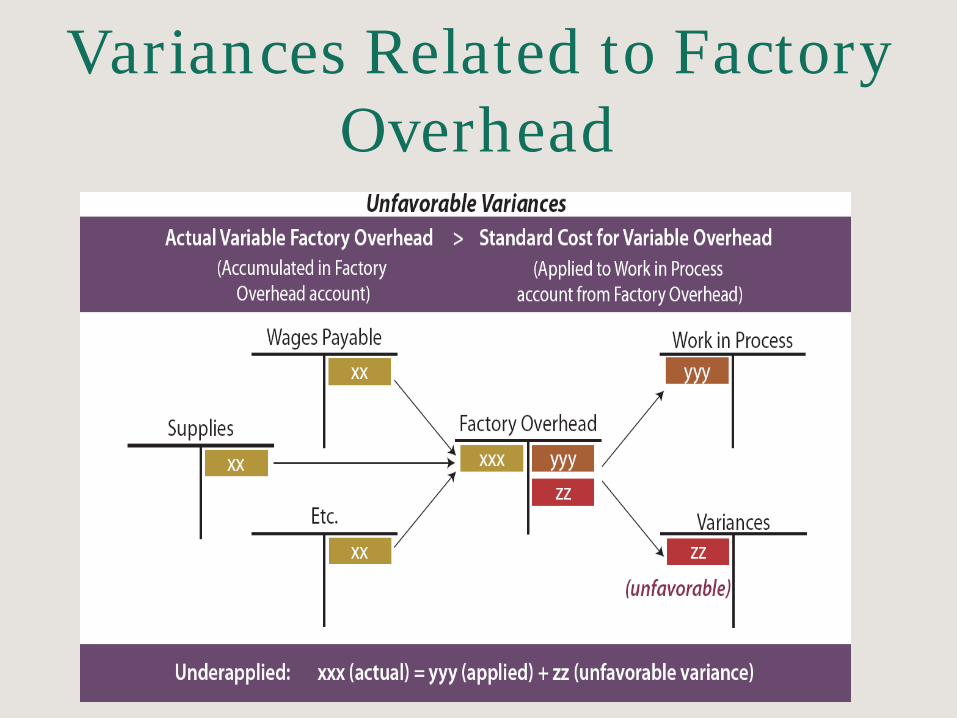
• When more is spent on actual variable factory overhead than is applied based on standard rates, the result is underapplied overhead – Produces unfavorable variances
• When less is spent than applied, the balance represents overapplied overhead – Produces favorable variances
• Differences are transferred to variance accounts
Variances Related to Factory Overhead

Variances Related to Factory Overhead

Variances Related to Factory Overhead
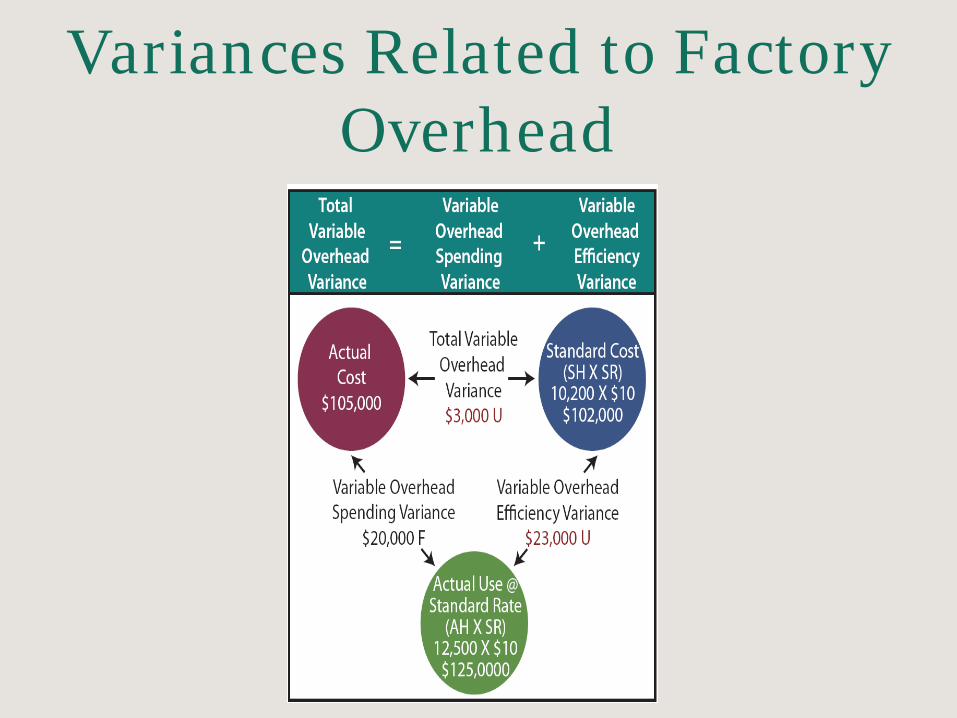
• The total variance can be divided: – Variable Overhead Spending Variance: A variance
that reflects the difference between actual variable overhead and standard variable overhead associated with the actual units of the application base
– Variable Overhead Efficiency Variance: A variance that reflects the level of efficiency associated with the application of variable overhead to production
Variances Related to Factory Overhead
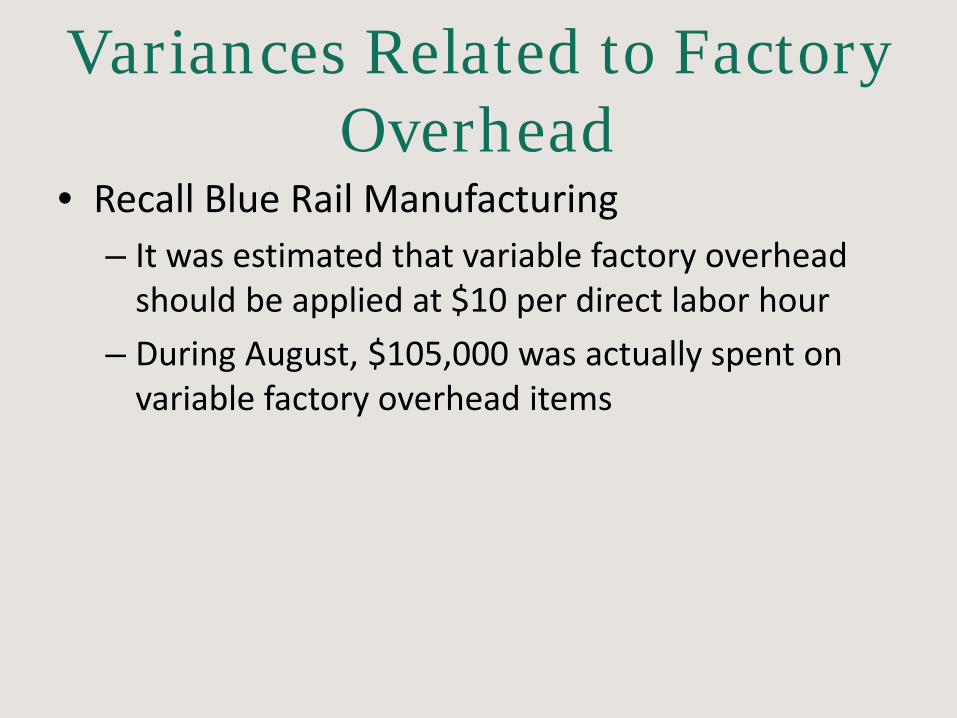
• Recall Blue Rail Manufacturing – It was estimated that variable factory overhead
should be applied at $10 per direct labor hour
– During August, $105,000 was actually spent on variable factory overhead items

Variances Related to Factory Overhead Standard Production Cost
Output - Number of rail sections 3,400
Standard hours per rail section X 3.00
Standard hours to achieve output 10,200
Standard variable overhead rate per hour of labor X $10
Standard cost of variable overhead $102,000
Presenter
Presentation Notes
Table determining the standard production cost for Blue Steel Manufacturing.

Variances Related to Factory Overhead
• The total variable overhead variance is unfavorable $3,000 ($102,000 - $105,000)
• A closer look reveals that overhead spending was quite favorable, while overhead efficiency was not
Variances Related to Factory Overhead
Variances Related to Factory Overhead
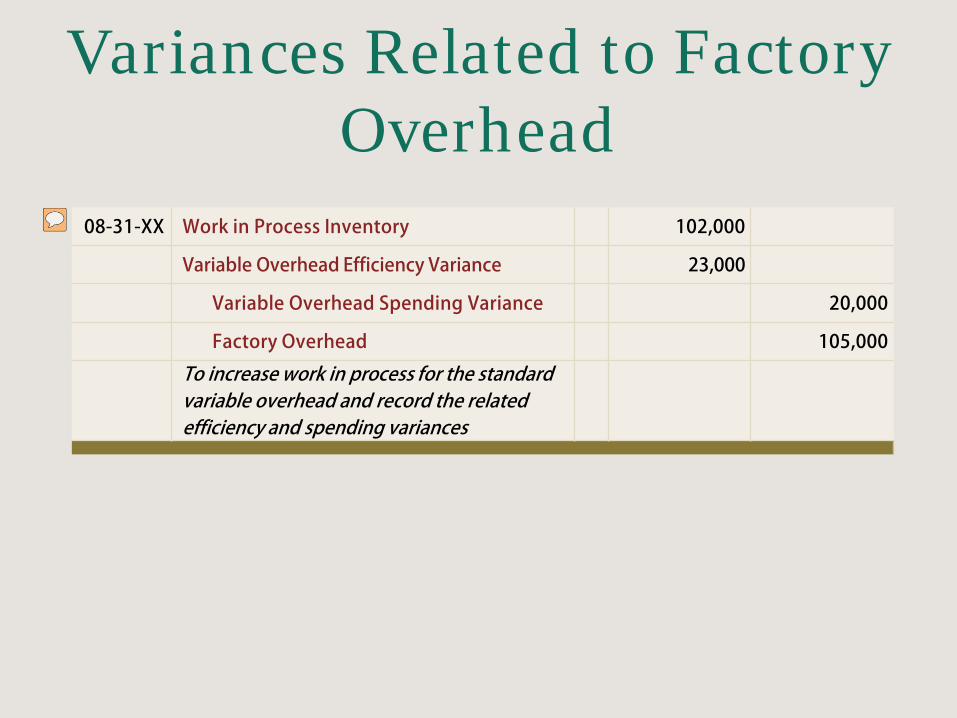
08-31-XX Work in Process Inventory 102,000
Variable Overhead Efficiency Variance 23,000
Variable Overhead Spending Variance 20,000
Factory Overhead 105,000
To increase work in process for the standard variable overhead and record the related efficiency and spending variances
Presenter
Presentation Notes
Sample journal entry to increase work in process for the standard variable overhead and record the related efficiency and spending variances.

Variances Related to Factory Overhead
• The variable overhead efficiency variance may reflect efficiencies or inefficiencies experienced with the base used to apply overhead – Ex) The total number of hours was “run up”
because of inexperienced labor

Variances Related to Factory Overhead
• Actual fixed factory overhead may show little variation from budget – Many fixed costs are tied to contracts or determined
in advance
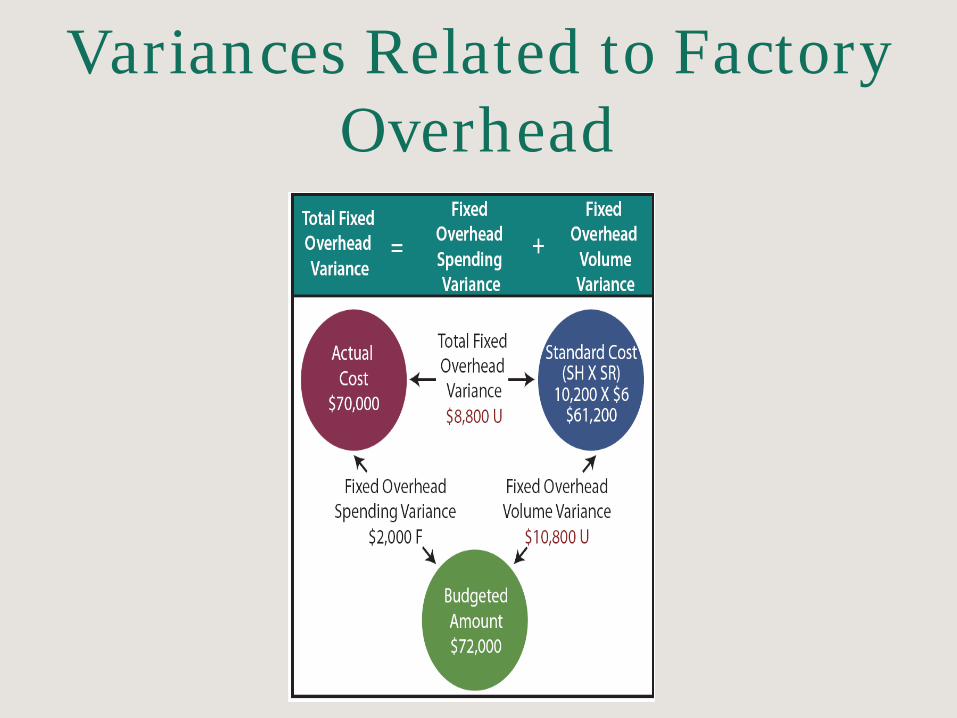
• Can be divided: – Fixed Overhead Volume Variance: Compares the
budgeted fixed overhead to the fixed overhead that is applied to production based on standard fixed overhead per unit of output
– Fixed Overhead Spending Variance: Compares actual fixed overhead to the budgeted fixed overhead
Variances Related to Factory Overhead
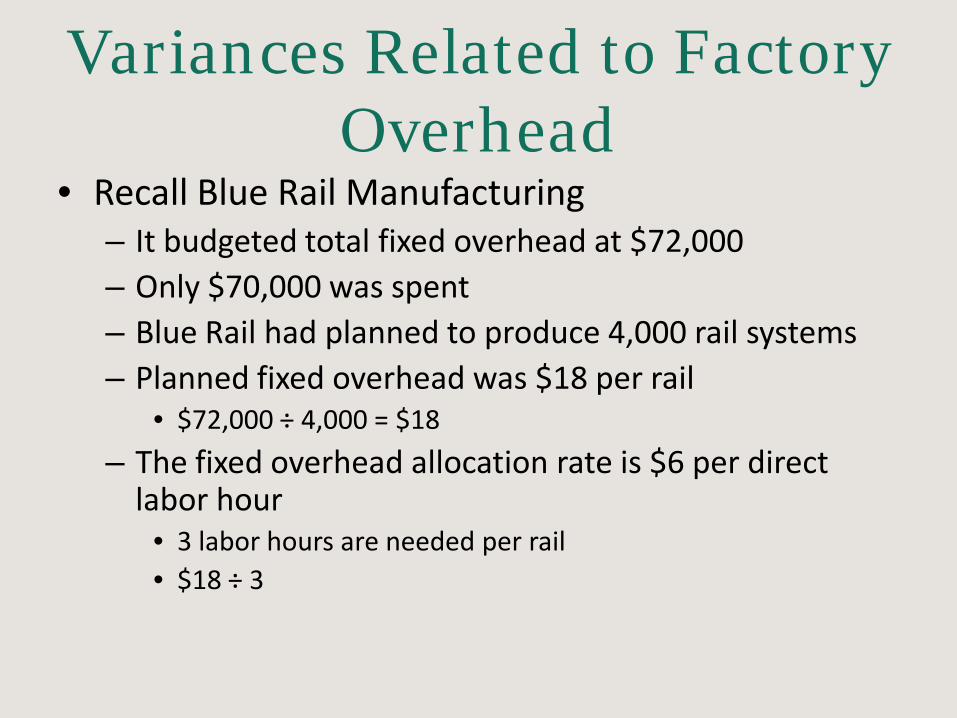
• Recall Blue Rail Manufacturing – It budgeted total fixed overhead at $72,000 – Only $70,000 was spent – Blue Rail had planned to produce 4,000 rail systems – Planned fixed overhead was $18 per rail
• $72,000 ÷ 4,000 = $18
– The fixed overhead allocation rate is $6 per direct labor hour
• 3 labor hours are needed per rail • $18 ÷ 3
Variances Related to Factory Overhead

Variances Related to Factory Overhead
• The standard cost allocation of fixed overhead is allocated to work in process
• The volume variance is unfavorable – Production did not rise to the anticipated level
– Much of the fixed cost was “under-utilized”
• The spending variance was favorable – Less was spent than budgeted
Variances Related to Factory Overhead

Impact on the Ledger
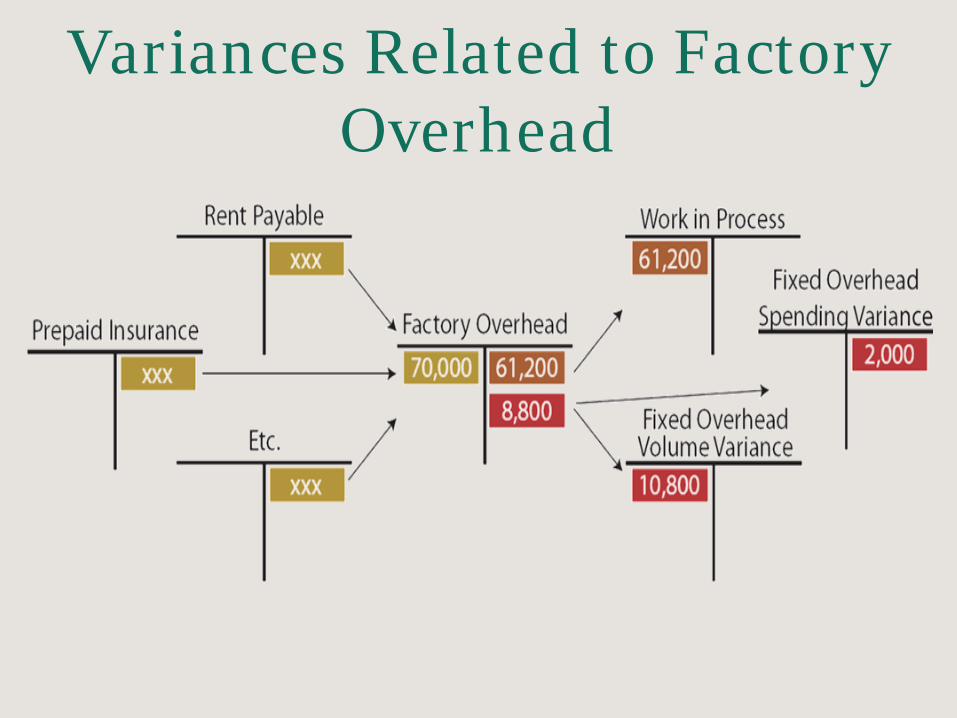
08-31-XX Work in Process Inventory 61,200
Fixed Overhead Volume Variance 10,800
Fixed Overhead Spending Variance 2,000
Factory Overhead 70,000
To increase work in process for the standard fixed overhead and record variances
Presenter
Presentation Notes
Sample journal entry to increase work in process for the standard fixed overhead and record variances.