CHAPTER 7 MONITORING OF TRANSNATIONAL LAKES USING … · MONITORING OF TRANSNATIONAL LAKES USING...
11
CHAPTER 7 MONITORING OF TRANSNATIONAL LAKES USING GEOMATIC TECHNIQUES: A CASE STUDY FOR PRESPA LAKES M. STEFOULI 1 & ELENI CHAROU 2 1 Institute of Geology and Mineral Exploration, Greece. 2 Institute of Informatics and Telecommunications N.C.S.R. “Demokritos”, Greece. ABSTRACT Monitoring of the lake ecosystems is of paramount importance for the overall development of a region. Remote sensing is a time- and cost-saving technique that enables the observation of the hydrological and limnologi- cal development of the lakes. The objective of this paper is to illustrate how multi-sensor and multi-platform remote sensing data and techniques can be used in the nearly operational monitoring of spatiotemporal changes in lake ecosystems. Existing and time-tested techniques are used to generate spatially distributed baseline data on a timely basis. Landsat data are used to generate a time series maps of Macro and Micro Prespa lakes for a period of 27 years. These maps clearly show the extent of the lakes and the subsequent water level drawn down along with the land cover changes. Landsat images and MERIS satellite images have been used to evaluate water quality parameters, such as water clarity, suspended solids, algae, and turbidity indexes of the lakes. The study developed a spatiotemporal monitoring database system for the Prespa lakes surface waters and its sur- rounding area. The importance of continuous monitoring is demonstrated by the usefulness of the time-series data. Moreover, these generated data are combined in an easy and innovative way to evaluate the hydro-eco- logical relationships in the transnational pilot project area. Keywords: Geomatics-based techniques, Landsat, MERIS satellite images, spatiotemporal monitoring, water quality. 1 INTRODUCTION Lakes can be extremely sensitive to short- and long-term changes in the weather and so are intrinsi- cally sensitive to climate change through a direct effect or through an indirect affecting process that take place in the catchment. Understanding the response of lakes to climate change as well as to anthropogenic impact is of great importance since year-to-year changes in the weather patterns can influence water quality and the ecological status of a lake in terms of the Water Framework Directive. It is now necessary to collect data like water levels, discharge, suspended solids, and water quality faster, more frequently and more reliably. In situ measurements and collection of water samples for subsequent laboratory analyses provide accurate measurements for a point in time and space but do not give either the spatial or temporal view of water quality needed for accurate assessment or management of water bodies [1,2]. Furthermore, extending field collection programs to many lakes, on a state-wide or even on a transnational level, is currently still costly and logistically prohibitive in many areas. Satellite remote sensing has been used to monitor the components that affect the assessment of water quality (suspended sediment concentration, phytoplankton biomass (chlorophyll), as they are known to affect the reflectance characteristics of the water body and are extensively studied. Remote sensing has been shown to correlate well with Lake Secchi Disk Transparency (SDT) values [3–5]. Many studies found significant linear or nonlinear relationships between in situ-determined suspended sediment concentration near the surface of inland water bodies and atmospherically corrected spectral reflectance derived from satellite remote sensing data, such as Landsat [6,7]. Because sediment characteristics, like texture and color, influence the water reflection, developed empirical relationships are not easily trans- ferable to other regions where erosion entrains different sediment types. Therefore, since a universal doi:10.2495/978-1-84564- / 6 - 68 4 www.witpress.com, ISSN 1755-8336 (on-line) WIT Transactions on State of the Art in Science and Engineering, Vol 57, © 2012 WIT Press 07
Transcript of CHAPTER 7 MONITORING OF TRANSNATIONAL LAKES USING … · MONITORING OF TRANSNATIONAL LAKES USING...
CHAPTER 7
MONITORING OF TRANSNATIONAL LAKES USING GEOMATIC TECHNIQUES: A CASE STUDY FOR PRESPA
LAKES
M. STEFOULI1 & ELENI CHAROU2
1Institute of Geology and Mineral Exploration, Greece.2Institute of Informatics and Telecommunications N.C.S.R. “Demokritos”, Greece.
ABSTRACTMonitoring of the lake ecosystems is of paramount importance for the overall development of a region. Remote sensing is a time- and cost-saving technique that enables the observation of the hydrological and limnologi-cal development of the lakes. The objective of this paper is to illustrate how multi-sensor and multi-platform remote sensing data and techniques can be used in the nearly operational monitoring of spatiotemporal changes in lake ecosystems. Existing and time-tested techniques are used to generate spatially distributed baseline data on a timely basis. Landsat data are used to generate a time series maps of Macro and Micro Prespa lakes for a period of 27 years. These maps clearly show the extent of the lakes and the subsequent water level drawn down along with the land cover changes. Landsat images and MERIS satellite images have been used to evaluate water quality parameters, such as water clarity, suspended solids, algae, and turbidity indexes of the lakes. The study developed a spatiotemporal monitoring database system for the Prespa lakes surface waters and its sur-rounding area. The importance of continuous monitoring is demonstrated by the usefulness of the time-series data. Moreover, these generated data are combined in an easy and innovative way to evaluate the hydro-eco-logical relationships in the transnational pilot project area.Keywords: Geomatics-based techniques, Landsat, MERIS satellite images, spatiotemporal monitoring, water quality.
1 INTRODUCTIONLakes can be extremely sensitive to short- and long-term changes in the weather and so are intrinsi-cally sensitive to climate change through a direct effect or through an indirect affecting process that take place in the catchment. Understanding the response of lakes to climate change as well as to anthropogenic impact is of great importance since year-to-year changes in the weather patterns can infl uence water quality and the ecological status of a lake in terms of the Water Framework Directive.
It is now necessary to collect data like water levels, discharge, suspended solids, and water quality faster, more frequently and more reliably. In situ measurements and collection of water samples for subsequent laboratory analyses provide accurate measurements for a point in time and space but do not give either the spatial or temporal view of water quality needed for accurate assessment or management of water bodies [1,2]. Furthermore, extending fi eld collection programs to many lakes, on a state-wide or even on a transnational level, is currently still costly and logistically prohibitive in many areas.
Satellite remote sensing has been used to monitor the components that affect the assessment of water quality (suspended sediment concentration, phytoplankton biomass (chlorophyll), as they are known to affect the refl ectance characteristics of the water body and are extensively studied. Remote sensing has been shown to correlate well with Lake Secchi Disk Transparency (SDT) values [3–5]. Many studies found signifi cant linear or nonlinear relationships between in situ-determined suspended sediment concentration near the surface of inland water bodies and atmospherically corrected spectral refl ectance derived from satellite remote sensing data, such as Landsat [6,7]. Because sediment characteristics, like texture and color, infl uence the water refl ection, developed empirical relationships are not easily trans-ferable to other regions where erosion entrains different sediment types. Therefore, since a universal
doi:10.2495/978-1-84564- /6 -68 4
www.witpress.com, ISSN 1755-8336 (on-line) WIT Transactions on State of the Art in Science and Engineering, Vol 57, © 2012 WIT Press
07

88 Lake Sustainability
equation does not exist, most models of suspended sediment are site-specifi c [8]. Thermal infrared (TIR) satellite images can be also used to study transport processes in lakes, such as wind-driven upwelling and surface circulation, providing a measure of spatial variability and horizontal distribution of water temperature that conventional fi eld-based measurements cannot provide, [9–12]. There still remain many unanswered questions about the effective implementation of geomatics-based techniques into a lake/environmental monitoring program, and these are addressed in our study.
2 STUDY AREAPrespa lakes are shared between FYR of Macedonia, Greece and Albania. The Prespa basin covers an area of 1,380 Km2 and is bounded between latitude 40° 38.3 N to 41° 19.3 N and longitude 20° 33.2 E 21° 18.6 E, Fig. 7.1. Prespa lakes accommodate a broad range of resource management
Figure 7.1: Overview map of Prespa lakes.
www.witpress.com, ISSN 1755-8336 (on-line) WIT Transactions on State of the Art in Science and Engineering, Vol 57, © 2012 WIT Press
Lake Sustainability 89
concerns (e.g. transnational management, environmental protection/biodiversity concerns, recreation/ tourism, water supply, and water quality). Macro Prespa lake shows an abrupt drop of water level during the last decades. Also various human-induced actions are taking place in the area.
3 DATA AND METHODSMulti-temporal optical/ thermal satellite images of Landsat TM and ETM+ and MERIS ENVISAT systems, and image processing/GIS techniques are used for the analysis. To compile the data from the various sources of information, the following problems had to be overcome: (1) Different scales of maps, charts, and imagery; (2) Different coordinate systems; (3) Different units of measurement; and (4) Different types of data.
The data collection and processing of satellite data resulted in the creation of a multi-temporal database that covers the 1974 to 2011 time period for the Landsat images (USGS/NASA: http://edcsns17.cr.usgs.gov/NewEarthExplorer/). Also a time series of MERIS full-resolution (300 m spatial resolution at nadir) imagery was obtained from ESA’s rolling archive at ESRIN https://oa-es.eo.esa.int/ra/mer_frs_l1/index.php and processed using BEAM 4.9. S/W. The time series 1984–2011 Landsat data have been used to perform a multi-temporal analysis. Two images dated summer 1984 and 2011 are selected, to evaluate the changes in the 27-year period of both the Macro and Micro Prespa lakes. Sechhi disk measurements for the same day as the satellite images of August 2011 have been provided by the Society for the Protection of Prespa lakes, Table 7.1.
4 ANALYSIS OF THE SURFACE OF THE LAKELakes are sensitive to both climate change and to anthropogenic infl uence. Drop of water level has been observed for Macro Prespa lake. Time series water level data are available for the lakes but they do not show the spatial variability of the water surfaces. As part of an overall geomatics-based management framework, the lake water surfaces and land cover of the surrounding area were mapped using the remotely sensed data.
The purpose of the mapping of the water surfaces was to generate time series of maps showing the changing extent and distribution of open lake water and land cover. Map coastlines have been used as a reference so as to extract the surfaces that used to be ‘lake surfaces’. Classifi cation training areas were collected based on ‘high resolution’ remotely sensed data and existing CORINE map informa-tion. All scenes were classifi ed into open water and a Corine-based land cover classifi cation scheme using a Mahalanobis distance supervised classifi cation. The maps of the processing of the 1984 and 2011 Landsat scenes are shown on Fig. 7.2.
4.1 Open lake water changes
The Transformed Vegetation Index TVI = 100*(sprt [(IR−RED)/(IR+RED) + 0.6] was used to identify the open water surfaces and this has been used as a mark so as to improve the classifi cation
Table 7.1: The acquired satellite images and fi eld measurements used in the analysis.
Month and year Satellite typeSecchi disk Macro
Prespa lakeSecchi disk Micro
Prespa lake
July 1984 Landsat TM – –August 2011 Landsat TM and MERIS 1.98 1.75
www.witpress.com, ISSN 1755-8336 (on-line) WIT Transactions on State of the Art in Science and Engineering, Vol 57, © 2012 WIT Press
90 Lake Sustainability
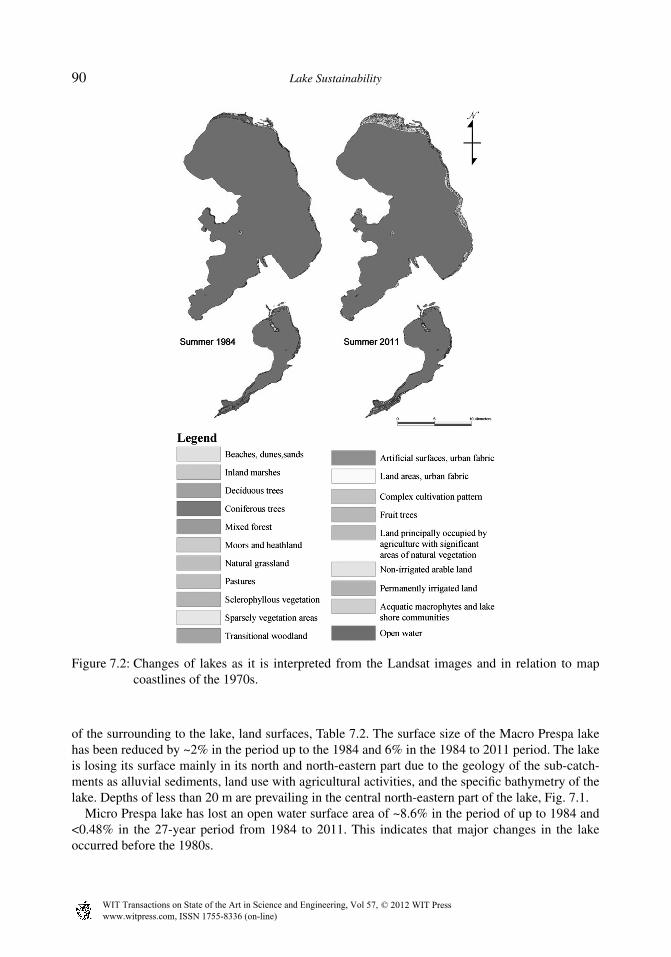
of the surrounding to the lake, land surfaces, Table 7.2. The surface size of the Macro Prespa lake has been reduced by ~2% in the period up to the 1984 and 6% in the 1984 to 2011 period. The lake is losing its surface mainly in its north and north-eastern part due to the geology of the sub-catch-ments as alluvial sediments, land use with agricultural activities, and the specifi c bathymetry of the lake. Depths of less than 20 m are prevailing in the central north-eastern part of the lake, Fig. 7.1.
Micro Prespa lake has lost an open water surface area of ~8.6% in the period of up to 1984 and <0.48% in the 27-year period from 1984 to 2011. This indicates that major changes in the lake occurred before the 1980s.
Figure 7.2: Changes of lakes as it is interpreted from the Landsat images and in relation to map coastlines of the 1970s.
www.witpress.com, ISSN 1755-8336 (on-line) WIT Transactions on State of the Art in Science and Engineering, Vol 57, © 2012 WIT Press
Lake Sustainability 91
4.2 Land cover changes
Changes occur in the surrounding to the lakes ecosystems, as there are different land cover types, according to the Corine classifi cation scheme, Fig. 7.2. Land cover changes for the years 1984 and 2011 are mapped. The total area that changed land cover/land use for Macro Prespa lake is of the order of 10.94 km2. The main different land cover types in the 1984 scene are: (1) Agricultural areas: 1.6 km2; (2) Natural grassland: 0.31 km2; (3) Beaches: 2.49 km2; (4) Inland marshes: 2.933 km2; and (5) Coastal vegetation: 1.66 km2.
The total area that changed land cover (use) up to the year 2011 is of the order of 26 km2 with the areas of the major classes as follows: (1) Agricultural areas: 4.172 km2; (2) Natural grassland: 1.127 km2; (3) Inland marshes: 6.19 km2; and (4) Coastal vegetation: 5.79 km2.
Micro Prespa lake shows changes of land cover types between 1984 and 2011. Natural vegetation of deciduous/coniferous trees is not mapped on the 2011 scene. An area of 0.49 km of the old surface lake is converted to agricultural land. Minor changes and less agricultural activity are indicated between the years 1984 and 2011. Major changes are the ones of the reduction of inland marshes by 1.6 km2 and the increase of aquatic vegetation by 1.6 km2 between the two different dates.
The land cover changes of Macro Prespa and Micro Prespa lakes show differences as an increase of coastal vegetation of macrophytes and lake shore communities for the fi rst one and a decrease for the second one. It is also indicated that there is an increase of agricultural areas of about 2.57 km2 for Macro Prespa lake, while this is not the case for Micro Prespa lake. Finally, Macro Prespa lake shows a fragmentation of land cover types between 1984 and 2011 even though the main land cover types are the same.
Micro Prespa lake shows changes of land cover types between 1984 to 2011. Natural vegetation of deciduous/ coniferous trees are not mapped on the 2011 scene. An area of 0.49 km of the old surface lake is converted to agricultural land. Minor changes and less agricultural activity are indi-cated between the years of 1984 to 2011. Major changes are the ones of the reduction of inland marshes by 1.6 km2 and the increase of aquatic vegetation by 1.6 km2 between the two different dates.
The land cover changes of Macro Prespa and Micro Prespa lakes show differences as an increase of coastal vegetation of macrophytes and lake shore communities for the fi rst one and a decrease for the second one. It is also indicated that there is an increase of agricultural areas of about 2.57 km2 for Macro Prespa lake while this is not the case for Micro Prespa lake. Finally Macro Prespa lake shows a fragmentation of land cover types between 1984 to 2011 even though the main land cover types are the same.
Table 7.2: Open lake water spatiotemporal changes.
Lake Map data: 1970 Water surfaces 1984 Water surfaces 2011
Macro Prespa 279.46 km2 273.92 275.03 km2
Percentage reduction of open water surface
1.98% 8.02%1984–2011: 6.1%
Micro Prespa 43.4 km2 (47.96)
39.64 km2 39.43 km2
Percentage reduction of open water surface
8.66% 9.14%1984–2011: 0.48%
www.witpress.com, ISSN 1755-8336 (on-line) WIT Transactions on State of the Art in Science and Engineering, Vol 57, © 2012 WIT Press

92 Lake Sustainability
5 WATER QUALITYOptical remote sensing of inland waters has become a task of increasing importance, since the avail-ability of clean fresh water is one of the great environmental challenges. In particular, natural lakes and artifi cial reservoirs have to be monitored on a regular basis to ensure the quality of the water.
5.1 Analysis of Landsat data
To investigate biophysical parameters associated with water quality, we used methods developed by [13,14] which have implemented on atmospherically corrected Landsat TM data of Prespa lakes. Images for water clarity assessment were selected from the summer period. There are at least two major advantages to using images from this period: short-term variability in lake water clarity is at a seasonal minimum, and most lakes have their minimum water clarity during this period. In addi-tion, it is preferable to have images from near anniversary dates for change detection.
The following equations were used to predict SDT and chlorophyll-a (Chl-a):
ln(SDT) = a(band1) + b(band2) + c(band3) + d, (1)
ln(Chl-a) = a(band2) + b(band3) + c(band7) + d. (2)
In the equations, the natural log (ln) of SDT was calculated in units of meters, the ln of Chl-a was calculated in units of milligrams per liter, and band values ranged from 0 through 255.
Provisional Model SD & Chl-a = a + bTM3/TM2 + cTM1/TM2 + dTM1 + eTM2/TM1.The letters a to e are parameters that are specifi c to the equations for each satellite scene. All
models have been implemented using the TNTmips Geo formula wizard.If ground-based SDT measurements were available for the calibration of images then the results
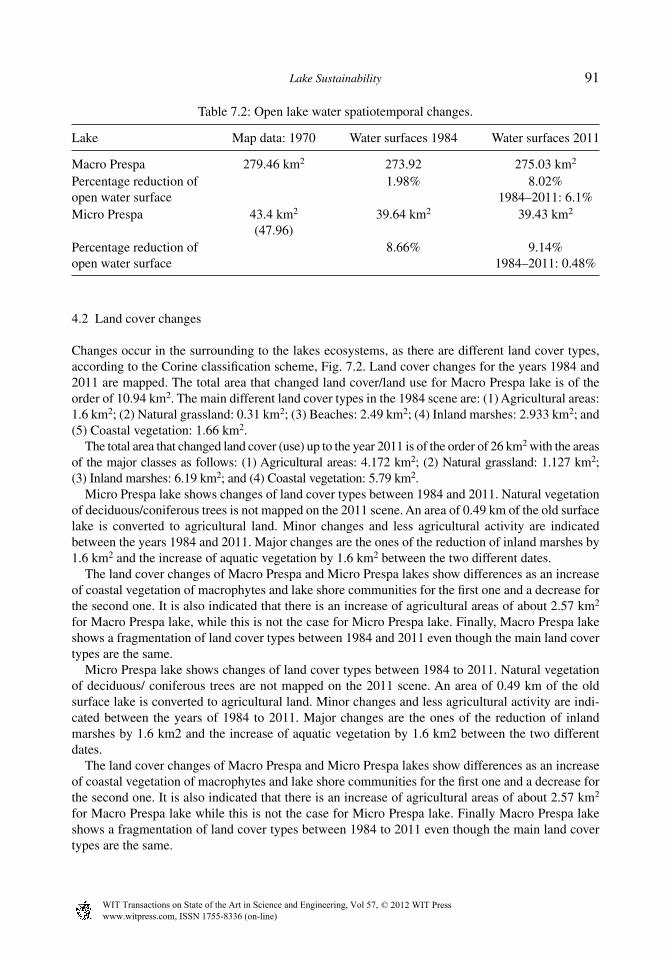
could show directly the distributions of SDT in the lake. Therefore, our current results give an index of the spatial distribution of water clarity and Chl-a concentration in Macro Prespa lake, Fig. 7.3. It is important to recognize that other factors besides algal turbidity (as indicated by chlorophyll levels) may affect SDT in lakes. Most important of these (non-trophic state) factors are humic color and non-algal turbidity (including soil-derived clays and suspended sediment). For this reason, we report our results based on SDT calibrations as satellite-estimated SDT.
It is indicated that satellite remotely sensed data, especially data from Landsat, can be used effectively to assess certain limnological parameters of lake waters. Radiometric data from Land-sat can be used to map the areal distribution of some water biophysical parameters for Prespa lakes.
5.2 Analysis of MERIS data
With its 300 m spatial resolution and 15 spectral bands, the imaging spectrometer MERIS on ENVI-SAT can be used for monitoring of, at least, larger inland waters. However, the standard algorithms used for open ocean are not appropriate for inland waters where high concentrations of refl ective particles can be present in the water surface. To this end, the CASE 2 REGIONAL (C2R) processor of the BEAM 4.9 (Envisat/Brockman Consult) has been developed. The BEAM 4.9 C2R processor was applied to data to extract atmospherically corrected radiance and the algal product C2R Chl_conc, according to the methods of Doerffer and Schiller [15,16]. Default settings were accepted for all processing parameters. The algorithm used for the retrieval of water constituents is based on the Case-2-Water Bio-Optical Model. The algorithm takes as input the water leaving radiance refl ectance
www.witpress.com, ISSN 1755-8336 (on-line) WIT Transactions on State of the Art in Science and Engineering, Vol 57, © 2012 WIT Press
Lake Sustainability 93
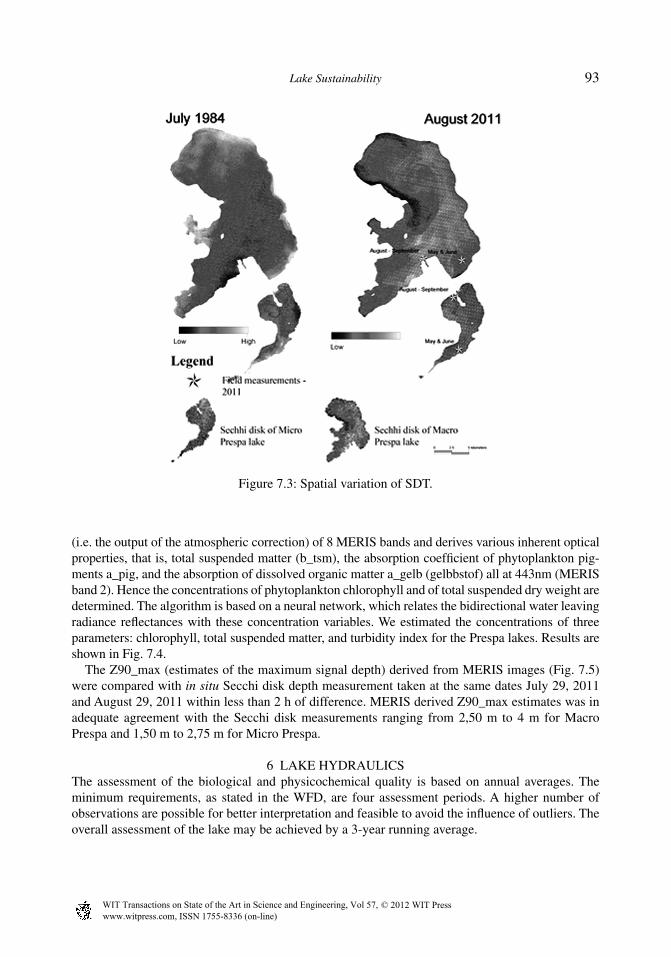
(i.e. the output of the atmospheric correction) of 8 MERIS bands and derives various inherent optical properties, that is, total suspended matter (b_tsm), the absorption coeffi cient of phytoplankton pig-ments a_pig, and the absorption of dissolved organic matter a_gelb (gelbbstof) all at 443nm (MERIS band 2). Hence the concentrations of phytoplankton chlorophyll and of total suspended dry weight are determined. The algorithm is based on a neural network, which relates the bidirectional water leaving radiance refl ectances with these concentration variables. We estimated the concentrations of three parameters: chlorophyll, total suspended matter, and turbidity index for the Prespa lakes. Results are shown in Fig. 7.4.
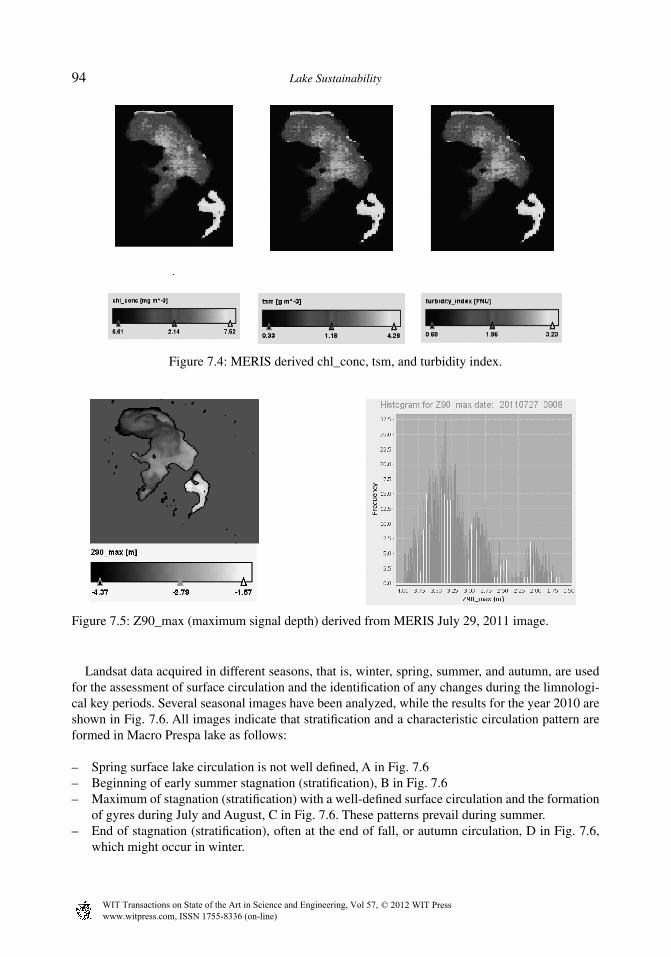
The Z90_max (estimates of the maximum signal depth) derived from MERIS images (Fig. 7.5) were compared with in situ Secchi disk depth measurement taken at the same dates July 29, 2011 and August 29, 2011 within less than 2 h of difference. MERIS derived Z90_max estimates was in adequate agreement with the Secchi disk measurements ranging from 2,50 m to 4 m for Macro Prespa and 1,50 m to 2,75 m for Micro Prespa.
6 LAKE HYDRAULICSThe assessment of the biological and physicochemical quality is based on annual averages. The minimum requirements, as stated in the WFD, are four assessment periods. A higher number of observations are possible for better interpretation and feasible to avoid the infl uence of outliers. The overall assessment of the lake may be achieved by a 3-year running average.
Figure 7.3: Spatial variation of SDT.
www.witpress.com, ISSN 1755-8336 (on-line) WIT Transactions on State of the Art in Science and Engineering, Vol 57, © 2012 WIT Press
94 Lake Sustainability
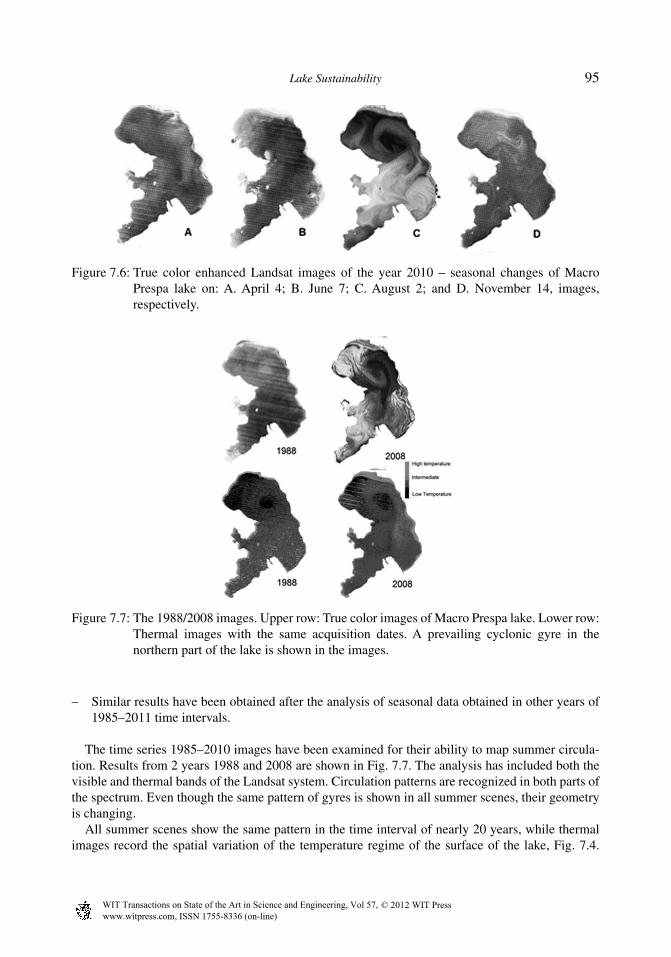
Landsat data acquired in different seasons, that is, winter, spring, summer, and autumn, are used for the assessment of surface circulation and the identifi cation of any changes during the limnologi-cal key periods. Several seasonal images have been analyzed, while the results for the year 2010 are shown in Fig. 7.6. All images indicate that stratifi cation and a characteristic circulation pattern are formed in Macro Prespa lake as follows:
– Spring surface lake circulation is not well defi ned, A in Fig. 7.6– Beginning of early summer stagnation (stratifi cation), B in Fig. 7.6– Maximum of stagnation (stratifi cation) with a well-defi ned surface circulation and the formation
of gyres during July and August, C in Fig. 7.6. These patterns prevail during summer.– End of stagnation (stratifi cation), often at the end of fall, or autumn circulation, D in Fig. 7.6,
which might occur in winter.
Figure 7.4: MERIS derived chl_conc, tsm, and turbidity index.
Figure 7.5: Z90_max (maximum signal depth) derived from MERIS July 29, 2011 image.
www.witpress.com, ISSN 1755-8336 (on-line) WIT Transactions on State of the Art in Science and Engineering, Vol 57, © 2012 WIT Press
Lake Sustainability 95
– Similar results have been obtained after the analysis of seasonal data obtained in other years of 1985–2011 time intervals.
The time series 1985–2010 images have been examined for their ability to map summer circula-tion. Results from 2 years 1988 and 2008 are shown in Fig. 7.7. The analysis has included both the visible and thermal bands of the Landsat system. Circulation patterns are recognized in both parts of the spectrum. Even though the same pattern of gyres is shown in all summer scenes, their geometry is changing.
All summer scenes show the same pattern in the time interval of nearly 20 years, while thermal images record the spatial variation of the temperature regime of the surface of the lake, Fig. 7.4.
Figure 7.6: True color enhanced Landsat images of the year 2010 – seasonal changes of Macro Prespa lake on: A. April 4; B. June 7; C. August 2; and D. November 14, images, respectively.
Figure 7.7: The 1988/2008 images. Upper row: True color images of Macro Prespa lake. Lower row: Thermal images with the same acquisition dates. A prevailing cyclonic gyre in the northern part of the lake is shown in the images.
www.witpress.com, ISSN 1755-8336 (on-line) WIT Transactions on State of the Art in Science and Engineering, Vol 57, © 2012 WIT Press

96 Lake Sustainability
The circulation in Lake Prespa is typically dominated by the northern two-gyre pattern, especially in the summer. The north wind leads to a cyclone (a counterclockwise rotation gyre) in the southwest and an anticyclone (a clockwise rotation gyre) in the northeast. Deterioration of water quantity and quality parameters is interpreted for Macro Prespa lake.
7 CONCLUSIONSLarge-scale circulation patterns can be identifi ed after the analysis of the Landsat images. The high-spatial-resolution TIR images provide a detailed view of fi ne-scale processes, such as surface jets, that cannot be clearly resolved in moderate-resolution images, and they enable the accurate meas-urement of surface transport and circulation patterns. Wind stress, stratifi cation, and topographic effects are primarily responsible for the predominantly cyclonic fl ow in the lake. It is now possible to draw accurate maps which look at the future incremental changes of Prespa lakes. The modeling of this process is effi ciently performed in the GIS.
The results also indicate that water quality parameters can be derived from MERIS images. This suggests that further MERIS data need to be processed for a thorough investigation of the spatial and temporal dynamics of the Prespa lakes. Since promising results were obtained for two different dates, the procedure presented here could be transferable to other images and extent to compare the various MERIS-derived estimates to in situ measurements.
This study shows that a geomatics-based approach to understanding the function of the large Prespa lakes ecosystem can provide invaluable data that is otherwise unavailable. Remote sensing does not and will never replace detailed ground surveys, but rather, complements the in situ analysis with a more generalized view of the transnational lakes wide view. We expect remote sensing to be integrated in the region’s monitoring plans because fi nancial resources at the three states and local level are insuffi cient to assess water quality in a timely fashion using conventional methods. It can be also used as a basis for further investigation of the climate change and impact of human-induced activities in transnational areas of high environmental value.
REFERENCES[1] Schmugge, T., Kustas, W., Ritchie, J., Jackson, T. & Rango, A., Remote sensing in hydrology.
Advances in Water Resources, 25, pp. 1367–1385, 2002.[2] Tyler, A., Svab, E., Preston, T., Présing, M. & Kovács, W., Remote sensing of the water qual-
ity of shallow lakes: a mixture modelling approach to quantifying phytoplankton in water characterized by high-suspended sediment. International Journal of Remote Sensing, 27(8), pp. 1521–1537, 2006.
[3] Lathrop, R.G. Landsat Thematic Mapper monitoring of turbid inland water quality. Photo-grammetric Engineering and Remote Sensing, 58(4), 465–470, 1992
[4] Kloiber, S.M., Anderle, T.H., Brezonik, P.L., Olmanson, L., Bauer, M.E. & Brown, D.A. Trophic state assessment of lakes in the Twin Cities (Minnesota, USA) region by satellite im-agery. Archive Hydrobiologie Special Issues Advances in Limnology, 55, pp. 137–151, 2000.
[5] Dewider, K.H. & Khedr, A. Water quality assessment with simultaneous Landsat-5 TM at Manzala Lagoon, Egypt. Hydrobiologia, 457, pp. 49–58, 2001.
[6] Nellis, M., Harrington, J. & Wu, J., Remote sensing of temporal and spatial variations in pool size, suspended sediment, turbidity, and Secchi depth in Tuttle Creek Reservoir, Kansas. Geomorphology, 21(3–4), pp. 281–29, 1998.
[7] Schiebe, F., Harrington, J. and Ritchie, J. Remote sensing of suspended sediments: the Lake Chicot, Arkansas project. International Journal of Remote Sensing, 13(8), pp. 1487–1509, 1992.
www.witpress.com, ISSN 1755-8336 (on-line) WIT Transactions on State of the Art in Science and Engineering, Vol 57, © 2012 WIT Press

Lake Sustainability 97
[8] Liu, Y., Islam, M. and Gao, J. Quantifi cation of shallow water quality parameters by means of remote sensing. Progress in Physical Geography, 27(1): 24–43, 2003.
[9] Steissberg, T.E., Hook, S.J.& Schladow, G. American Geophysical Union, Fall Meeting ab-stract #H32D-0, 2006.
[10] Zhen-Gang Ji & Kang-Ren Jin. Gyres and Seiches in a Large and Shallow Lake, Journal of Great Lakes Research, 32(4), pp. 764–775, 2006.
[11] Charou, E., Katsimpra, E., Stefouli, M., Chioni, A., Monitoring lake hydraulics in West Mace-donia using remote sensing techniques and hydrodynamic simulation Proc. 6th International symposium on environmental Hydraulics, pp. 887–893, 2010.
[12] Stefouli, M., Charou, E., Kouraev, A. & Stamos, A. Integrated remote sensing and GIS tech-niques for improving trans-boundary water management: the case of Prespa region Groundwa-ter Series of UNESCO’s Technical Documents, pp. 174–179, 2011.
[13] Kloiber, S.M., Brezonik, P.L., Olmanson, L.G. & Bauer, M.E. A procedure for regional lake water clarity assessment using Landsat multispectral data. Remote Sensing of Environment, 82(1), pp. 38–47, 2002.
[14] Mancino, G, Nole, A., Urbano, V., Amato, M. & Ferrara, A., Assessing water quality by remote sensing in small lakes: the case study of Monticchio lakes in southern Italy In iForest Biogeo-sciences and Forestry, vol. 2, pp. 154–161, 2009.
[15] Doerffer, R. & Schiller, H. (2008a). MERIS lake water algorithm for BEAM ATBD, GKSS Research Center, Geesthacht, Germany. Version 1.0, 2008.
[16] Doerffer, R. & Schiller, H. (2008b). MERIS regional, coastal and lake case 2 water project – Atmospheric Correction ATBD. GKSS Research Center, Geesthacht, Germany. Version 1.0, 18 May 2008.
www.witpress.com, ISSN 1755-8336 (on-line) WIT Transactions on State of the Art in Science and Engineering, Vol 57, © 2012 WIT Press


![Amphibien und Reptilien des Prespa-Nationalparks und der ... fileSalamandra 30 3 209-220 ] Rheinbach, 15.8.1994 Amphibien und Reptilien des Prespa-Nationalparks und der Gebirgsregion](https://static.fdocuments.in/doc/165x107/5d63256188c993f97d8b6831/amphibien-und-reptilien-des-prespa-nationalparks-und-der-30-3-209-220-rheinbach.jpg)

![BIODIVERSITY IN OHRID AND PRESPA [Read-Only] · 2016. 5. 26. · Lake Ohrid has specific and unique Salmonidae ichthyofauna OHRID PRESPA Lake Ohridis a unique aquatic ecosystem and](https://static.fdocuments.in/doc/165x107/60c4abb827e9ed4cf25f0960/biodiversity-in-ohrid-and-prespa-read-only-2016-5-26-lake-ohrid-has-specific.jpg)