
CHAPTER 7 MOLECULAR STRUCTURE AND VIBRATIONAL ANALYSIS...
35
CHAPTER 7 MOLECULAR STRUCTURE AND VIBRATIONAL ANALYSIS OF 4-METHYL-N-(2-METHYLPHENYL)BENZENE SULFONAMIDE USING DFT METHOD 7.1 INTRODUCTION Sulfonamides constitute an important class of antimicrobial agents, effective against bacterial infections and enzyme inhibitor properties [1-2]. These compounds are active against gram-positive and gram-negative bacteria and were used in the treatment of diseases like tonsilitis, urinary tract infections etc. Aromatic sulfonamides were also reported to inhibit the growth of tumor cells [3]. It is also reported that different sulfonamide derivatives show substantial in-vitro and in-vivo anticancer and antitumor activities [4-8]. Aromatic amines are important molecules in pharmaceutical and chemical industries. Aniline and its derivatives can serve as precursors in the synthesis of dye and sensitizer molecules. Shaji et al [9] reported the near infrared vibrational overtone absorption spectra of liquid phase toluidines and observed C-H and N-H local mode mechanical frequency values which showed the existence of steric and electronic interaction between the amino and methyl groups in o-toluidine. Lakshmi et al [10] studied electrical and spectroscopic characterization of p-toluene sulfonic acid doped poly(o-toluidine) and poly(o-toluidine) blends. Tzeng et al [11] analysed the structures and vibrations of o-methylaniline in the S0 and S1 states studied by ab initio calculations and resonant two-photon ionization spectroscopy. Ballesteros et al[12] reinvestigated the molecular structures, Please purchase PDF Split-Merge on www.verypdf.com to remove this watermark.
Transcript of CHAPTER 7 MOLECULAR STRUCTURE AND VIBRATIONAL ANALYSIS...

CHAPTER 7
MOLECULAR STRUCTURE AND VIBRATIONAL ANALYSIS
OF 4-METHYL-N-(2-METHYLPHENYL)BENZENE
SULFONAMIDE USING DFT METHOD
7.1 INTRODUCTION
Sulfonamides constitute an important class of antimicrobial agents,
effective against bacterial infections and enzyme inhibitor properties [1-2]. These
compounds are active against gram-positive and gram-negative bacteria and were
used in the treatment of diseases like tonsilitis, urinary tract infections etc.
Aromatic sulfonamides were also reported to inhibit the growth of tumor cells [3].
It is also reported that different sulfonamide derivatives show substantial in-vitro
and in-vivo anticancer and antitumor activities [4-8]. Aromatic amines are
important molecules in pharmaceutical and chemical industries. Aniline and its
derivatives can serve as precursors in the synthesis of dye and sensitizer molecules.
Shaji et al [9] reported the near infrared vibrational overtone absorption
spectra of liquid phase toluidines and observed C-H and N-H local mode
mechanical frequency values which showed the existence of steric and electronic
interaction between the amino and methyl groups in o-toluidine. Lakshmi et al
[10] studied electrical and spectroscopic characterization of
p-toluene sulfonic acid doped poly(o-toluidine) and poly(o-toluidine) blends.
Tzeng et al [11] analysed the structures and vibrations of o-methylaniline in the S0
and S1 states studied by ab initio calculations and resonant two-photon ionization
spectroscopy. Ballesteros et al[12] reinvestigated the molecular structures,
Please purchase PDF Split-Merge on www.verypdf.com to remove this watermark.

176
vibrations and rotation of methyl group in o-methylaniline in S0 and S1 states by
laser induced fluorescence spectroscopy and ab initio calculations. Bilal et al [13]
reported Raman spectro electrochemical studies of copolymers of o-
phenylenediamine and o-toluidine.
Literature survey shows that neither spectroscopic characterizations nor
computational studies have been done so far on the title compound. This
insufficiency observed in the literature urged us to make this theoretical and
experimental vibrational spectroscopic research to give a complete assignment of
the fundamental bands in the experimental FTIR and FT-Raman spectra on the
basis of the calculated potential energy distribution (PED). The X-ray
crystallographic structure of 4M2MPBS has been reported in literature [14]. The
4M2MPBS crystal grown by us to carry out structural and spectral
characterisations and make comparative study between the experimental data and
the optimized geometry performed using DFT method.
7.2 SYNTHESIS
2-methylphenyl, Triethylamine (4ml) were dissolved in acetone (8 ml). To
this solution, Para toluene sulfonylcholoride (9.53gm) in acetone (12.5ml) was
added in drops with continuous stirring of the solution. The resulting solution was
allowed to evaporate. The residue was washed several times with water and then
with Petrolieum ether solution (the pathway synthesis of the 4M2MBS reported
earlier is different [14]. The crude product of the title compound was recrystallized
from ethanol. After one week crystals suitable for x-ray diffraction studies were
obtained.
Please purchase PDF Split-Merge on www.verypdf.com to remove this watermark.

CH3
SO2Cl
+
NH
CH3
SO2NH
ACETONE
︵C 2H5 ︶3N2
CH3H3C
Figure 7.1 The Path way synthesis of 4M2MPBS
Please purchase PDF Split-Merge on www.verypdf.com to remove this watermark.
177
7.3 SINGLE CRYSTAL X-RAY DIFFRACTION ANALYSIS
7.3.1 Crystal Structure Determination.
A crystal with dimensions of 0.25 x 0.15 x 0.10 mm was used for collection of
intensity data on a “Bruker Apex II CCD” area detector diffractometer with
graphite monochromated MOKα radiation (0.71073Å) ω scan technique. The
programs used to solve and refine the structure were SHELXS-97, SHELXL97 and
PLATON [15-16]. The refinement was carried out by using the Full matrix least
square on F2. All non hydrogen atoms were refined anisotropically. All hydrogen
atoms have been geometrically fixed and refined with isotropic thermal
parameters. Crystallographic details are shown in Table 7.1 whereas the selected
bondlengths and bond angles are given in Table 7.2.
7.3.2 Crystal Structure Analysis
The ORTEP [17] diagram of the 4M2MPBS molecule showing 30%
probability displacement ellipsoids with the numbering scheme is shown in Figure
7.1. In the crystal structure of the title compound, C14 H15 N O2 S the dihedral
angle between the mean planes of the tosyl and 2-methylphenyl ring is 49.7(1)⁰.
This shows their non coplanar orientation. This contrasts with the near coplanar
orientation observed in [18]. All the Caro-Caro and C-C bond lengths are comparable
to the reported mean values of Caro-Caro =1.380Å, and C-C =1.530Å [19].
The atoms around the sulfonamide S atom in the title compound are
arranged in a slightly distorted tetrahedral configuration. The largest deviation is in
the angle O (2)-S (1)-O (1) (119.63(7)) ⁰, but it conforms to the non-tetrahedral
arrangement commonly observed in sulfonamides [20-26], While the opposed
N1-S1-C1 (107.23(1)) ⁰ is correspondingly much smaller than the tetrahedral value
Please purchase PDF Split-Merge on www.verypdf.com to remove this watermark.

Empirical formula C14 H15 N O2 S
Formula weight 261.33
Temperature 298(2) K
Wavelength 0.71073 Å
Crystal system, space group orthorhombic, Pbca
Unit cell dimension a = 14.6850(13)Å α =90⁰
b = 12.0356(7)Å ß=90⁰
c = 15.7084(10)Å ᵞ= 90⁰
Volume (Å3) 2771.6(4)
Z, Calculated density 8, 1.253 Mg/m3
Absorption coefficient 0.227 mm-1
F(000) 1104
Crystal size 0.25 x 0.15 x 0.10 (mm3)
Theta range for data collection 2.54 to 28.39⁰
Limiting indices -17<=h<=18, -13<=k<=11, -13<=l<=19
Reflections collected / unique 10530 /2715 [R(int) = 0.0378]
Completeness to theta = 25.00 91.9 %
Max. and min. transmission 0.9776 and 0.9454
Refinement method Full-matrix least-squares on F2
Data / restraints / parameters 2715 / 0 / 169
Goodness-of-fit on F^2 0.990
Final R indices [I>2sigma(I)] R1 = 0.0409, wR2 = 0.0895
R indices (all data) R1 = 0.1100, wR2 = 0.1123
Largest diff. peak and hole 0.142 and -0.222 e.Å-3
Table 7.1 - Crystal data and structure refinement parameters for 4M2MPBS
Please purchase PDF Split-Merge on www.verypdf.com to remove this watermark.

Table 7. 2 Selected Molecular parameters of 4M2MPBS Parameters Experimental B3LYP6-31G(d,p) Bond Lengths C1-C2 1.380(3) 1.405 C1-N1 1.434(3) 1.438 C1-C6 1.392(3) 1.400 C2-C3 1.369(4) 1.390 C2-H2 .9300 1.087 C6-C13 1.494 1.509 C7-S1 1.749 1.791 O1-S1 1.424(17) 1.464 O2-S1 1.4307(16) 1.471 Bond Angles C2-C1-C6 121.4(2) 118.5 C2-C1-N1 118.4(3) 120.7 C6-C1-N1 120.1(2) 118.4 C3-C2-C1 120.3(3) 121.2 C1-N1-S1 120.13(18) 121.1 O1-S1-N1 107.8(13) 107.6 O2-S1-N1 104.85(12) 105.2 O1-S1-C7 107.98(11) 107.7 O2-S1-C7 108.73(11) 110.1 O1-S1-O1 119.63(10) 120.2
Please purchase PDF Split-Merge on www.verypdf.com to remove this watermark.

178
[27]. The S1-C1 distance of 1.749(2)Å is normal single bond values and agrees
well with those observed in other sulfonamides [28-29]. The torsion angle τ(C-S-
N-C) defining the conformation of the sulfonamide group is reported to lie in the
range 60-90⁰ [30]. In the present crystal structure, the torsion angle τ(C8-N1-S1-
C1) is 60(2)⁰. The position of the methyl group C14 is defined by the torsion
angles (C14-C10-C11-C12)-178.5(3) and 178.1 (3) (C8-C9-C10-C14.). The
molecules in the unit cell are related to each other by inversion. In each molecule
the tolyl ring and phenyl rings are orthogonal to each other.
In the ortho position due to steric effect, the CH3 group is not in plane with
–NH- group. Hence the hyperconjugative effect of the methyl group decreases the
C-CH3 bond length to 1.49Å. In meta methyl aniline this value is 1.505 Å. The
other bond parameters are similar to those observed in other aryl sulfonamides
[31,32].
7.3.3 Hydrogen Bonding and Molecular Packing
The molecular structure is stabilized by intramolecular C-H…O interaction
and the crystal packing is stabilized by intermolecular N-H…O interaction.
Inversion dimers linked by pairs of N-H-O hydrogen bonds occur in the crystal
packing is shown in Figure 5.3(a). The amino nitrogen N1 is involved in
intermolecular interaction with sulfonyl oxygen. The amino nitrogen N1 acts as
donor with sulfonyl oxygen of symmetry related x,y,z molecule.
7.3.4 Geometrical Structure
The optimized structure parameters of the title compound was calculated by
DFT B3LYP levels with the 6-31G (d,p) basis set [33-37]. The selected bond
lengths, bond angles and torsion angles are compared with the experimental data of
Please purchase PDF Split-Merge on www.verypdf.com to remove this watermark.

Table 7. 3 Hydrogen bond geometry(Å) D‐H‐A D‐H H‐A D…A (DHA) ° N1‐H1…O2 0.79(3) 2.28 3.049(19) 164
C2‐H2…O1 0.93(3) 2.56 3.016(2) 111 C8‐H8…O2 0.93(3) 2.56 2.925(18) 104 Note: D: Donor, A: Acceptor
Symmetry transformations used to generate equivalent atoms:
Please purchase PDF Split-Merge on www.verypdf.com to remove this watermark.
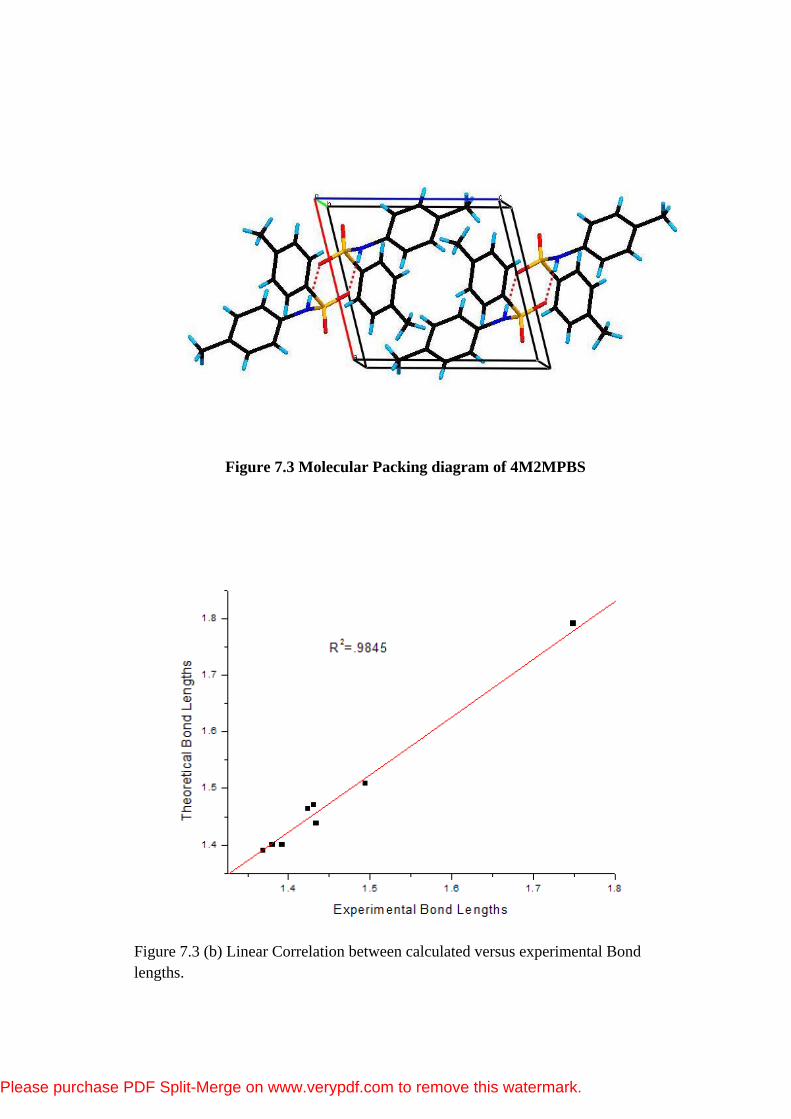
Figure 7.3 Molecular Packing diagram of 4M2MPBS
Figure 7.3 (b) Linear Correlation between calculated versus experimental Bond lengths.
Please purchase PDF Split-Merge on www.verypdf.com to remove this watermark.

179
4M2MPBS (Table 7.2). From the theoretical values, it is found that most of the
optimized bond angles are slightly larger than the experimental values, due to the
theoretical calculations belong to the isolated molecules in gaseous phase and the
experimental results belong to the molecules in solid phase. Theoretical bond
lengths vary ± .045 Å where comparing with the XRD data. Graphic correlation
between experimental versus theoretical bond lengths is shown in Figure 5.3(b).
The values of correlation coefficient provide good linearity between calculated and
experimental bond lengths (correlation coefficient R2 of .9845). The bond angle
(O1-S-O2) varies 0.63° deviates from XRD data. This difference between the
calculated and experimental XRD values is small for 4M2MPBS compare with
para and meta methyl sulfonated compounds.
7.4 VIBRATIONAL ANALYSIS
The present molecules have 32 atoms and 90 normal modes of vibrations.
The fundamental vibrational wavenumbers of 4M2MPBS as calculated by DFT
(B3LYP) are given in Table 7.3. The resulting vibrational wavenumbers for the
optimized geometries as well as FTIR and FTRaman intensities, and observed
experimental FTIR and FTRaman frequencies are also given in the Table 7.4.
Vibrational modes are numbered from largest to smallest wavenumbers.
Vibrational assignments have been done using Vibrational Energy Distribution
Analysis (VEDA) programme with Gauss view software [38-39]. The harmonic
vibrational frequencies were calculated at the same level of theory for the
optimized structures and obtained frequencies were scaled by 0.961 [40]. The
observed and calculated FTIR and FTRaman spectra are shown in Figures 7.4(a)
and 7.4(b), where the calculated intensity is plotted against the harmonic
vibrational wavenumbers.
Please purchase PDF Split-Merge on www.verypdf.com to remove this watermark.
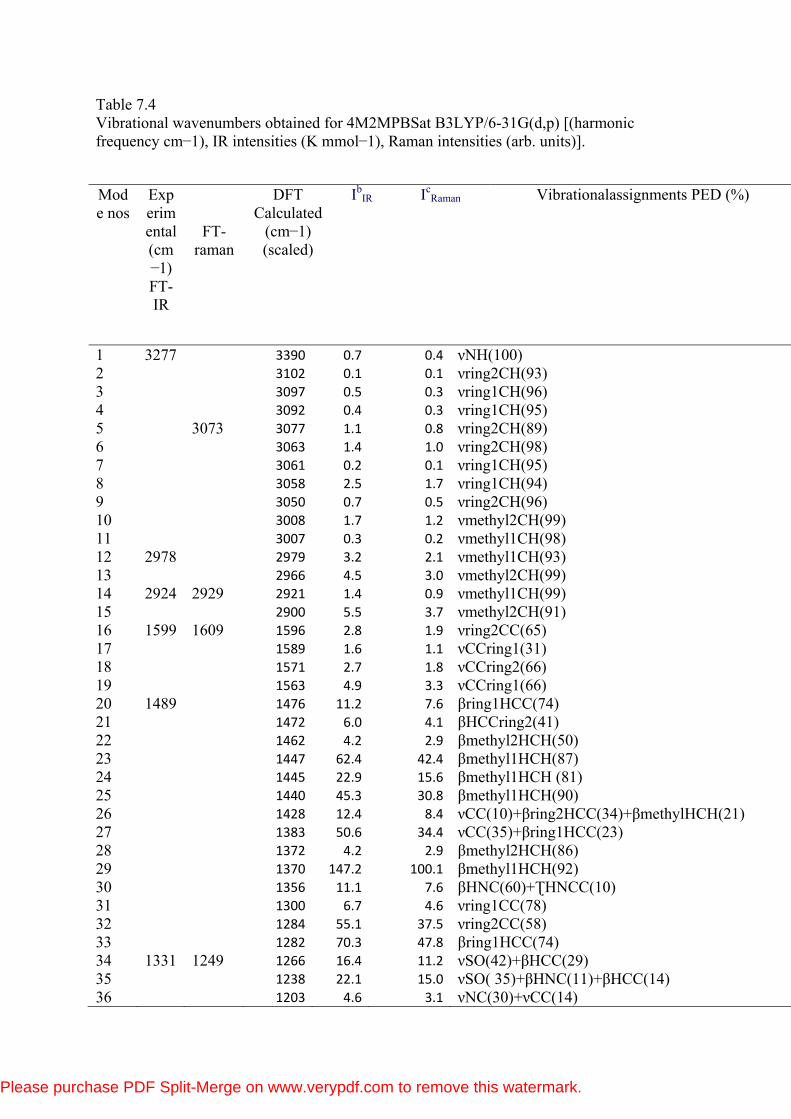
Table 7.4 Vibrational wavenumbers obtained for 4M2MPBSat B3LYP/6-31G(d,p) [(harmonic frequency cm−1), IR intensities (K mmol−1), Raman intensities (arb. units)].
Mode nos
Experimental (cm−1) FT-IR
FT-raman
DFT Calculated
(cm−1) (scaled)
IbIR Ic
Raman Vibrationalassignments PED (%)
1 3277 3390 0.7 0.4 νNH(100) 2 3102 0.1 0.1 νring2CH(93) 3 3097 0.5 0.3 νring1CH(96) 4 3092 0.4 0.3 νring1CH(95) 5 3073 3077 1.1 0.8 νring2CH(89) 6 3063 1.4 1.0 νring2CH(98) 7 3061 0.2 0.1 νring1CH(95) 8 3058 2.5 1.7 νring1CH(94) 9 3050 0.7 0.5 νring2CH(96) 10 3008 1.7 1.2 νmethyl2CH(99) 11 3007 0.3 0.2 νmethyl1CH(98) 12 2978 2979 3.2 2.1 νmethyl1CH(93) 13 2966 4.5 3.0 νmethyl2CH(99) 14 2924 2929 2921 1.4 0.9 νmethyl1CH(99) 15 2900 5.5 3.7 νmethyl2CH(91) 16 1599 1609 1596 2.8 1.9 νring2CC(65) 17 1589 1.6 1.1 νCCring1(31) 18 1571 2.7 1.8 νCCring2(66) 19 1563 4.9 3.3 νCCring1(66) 20 1489 1476 11.2 7.6 βring1HCC(74) 21 1472 6.0 4.1 βHCCring2(41) 22 1462 4.2 2.9 βmethyl2HCH(50) 23 1447 62.4 42.4 βmethyl1HCH(87) 24 1445 22.9 15.6 βmethyl1HCH (81) 25 1440 45.3 30.8 βmethyl1HCH(90) 26 1428 12.4 8.4 νCC(10)+βring2HCC(34)+βmethylHCH(21) 27 1383 50.6 34.4 νCC(35)+βring1HCC(23) 28 1372 4.2 2.9 βmethyl2HCH(86) 29 1370 147.2 100.1 βmethyl1HCH(92) 30 1356 11.1 7.6 βHNC(60)+ƮHNCC(10) 31 1300 6.7 4.6 νring1CC(78) 32 1284 55.1 37.5 νring2CC(58) 33 1282 70.3 47.8 βring1HCC(74) 34 1331 1249 1266 16.4 11.2 νSO(42)+βHCC(29) 35 1238 22.1 15.0 νSO( 35)+βHNC(11)+βHCC(14) 36 1203 4.6 3.1 νNC(30)+νCC(14)
Please purchase PDF Split-Merge on www.verypdf.com to remove this watermark.

37 1186 2.0 1.4 νCC (39)+βring1CCC(13) 38 1164 84.0 57.1 νCC (21)+βring1HCC(72) 39 1159 1165 1156 57.0 38.8 νCC(40)+νNC(10) 40 1141 1.6 1.1 νCC(10)+βring2HCC(73) 41 1100 0.0 0.0 νCC(12)+νSO(23)+βring1HCC(19) 42 1091 1099 1093 0.3 0.2 νCC(14)+νSO(16)+βring1HCC 43 1085 0.1 0.1 νCC(11)+βring2HCC+βring2HCC 44 1045 1055 1046 2.3 1.6 νCC(30)+νSO(23) 45 1031 1.4 1.0 νCC(60)+βring2HCC(12) 46
1024 5.2 3.6
βmethyl2HCH(13)+τmethyl-ring2HCCC(61)+τCCCC(10)
47 1022 13.1 8.9 βmethyl1HCH(15)+τmethyl1-ring1HCCC(49) 48 992 3.8 2.6 βring1CCC(37) 49 973 6.6 4.5 βring1HCH(11)+Ʈmethyl-ring1HCCC(49) 50 972 67.6 46.0 νCC(10)+βring2CCC+Ʈmethyl-ring2HCCC(46) 51 947 16.4 11.2 Ʈring2HCCC(64)+Ʈring2CCCC(15) 52 945 94.5 64.3 ƮHCCS(47)+Ʈring1HCCC(43) 53 929 62.4 42.4 Ʈring1HCCC(36)+ƮHCCS(41) 54 903 919 912 0.1 0.0 Ʈring2HCCC(89) 55 847 20.8 14.1 Ʈring2HCCC(47) 56 837 3.0 2.1 νNC(10)+Ʈring2HCCC(25) 57 822 4.3 2.9 ƮHCCS(43)+Ʈring1HCCC(42) 58 818 816 60.9 41.4 νring2HNCC(12) 59 791 66.9 45.5 Ʈring1HCCC(24)+Ʈring1HCCS(24) 60 763 785 62.9 42.8 νCC(14)+βring1CCC(25) 61 751 1.2 0.8 νCC(18)+βring1CCC(41) 62 742 20.4 13.9 Ʈring2HCCC(89) 63 698 1.3 0.9 Ʈring2HCCC(11)+Ʈring2CCCC(54) 64 676 651 687 48.4 32.9 Ʈring1CCCC(71) 65 653 0.2 0.2 νSC(12)+Βring2CCC(11)+ƮONOS(15) 66 622 1.5 1.0 βring1CCC(65) 67 612 9.4 6.4 νCC(24)+ƮHNCC(11) 68 569 585 584 6.4 4.4 ƮONOS(41) 69 549 7.3 5.0 βring2CCC(65) 70 521 12.3 8.4 βOSO(17) 71 503 5.3 3.6 Ʈring2CCCC(10)+ƮONOS(27) 72 479 10.6 7.2 βOSO(17)+ƮONCS(17)+Ʈring1CCCC(14) 73 466 59.7 40.6 Ʈring2CCCC(12) 74 449 437 5.0 3.4 Ʈring2CCCC(41) 75 411 0.6 0.4 βCCN(20)+βCCC(26)+βOSO(14) 76 408 6.6 4.5 βCCC(13)+βOSO(11)+βSCC(15)+ƮONCS(22) 77 398 20.4 13.9 Ʈring1CCCC(70) 78 346 4.9 3.3 βCCC(25)+βCCC(21)+βOSN(16) 79 324 25.8 17.5 βCCC(17)+ƮONCS(11)+Ʈring1CCCC(13) 80 297 22.8 15.5 νSC(14)+βCCC(16) 81 263 11.3 7.7 ƮCCCN(16)+ Ʈring2CCCC(25)+ƮONOS(13) 82 250 25.4 17.3 νSC(20) 83 237 13.1 8.9 βCCN(21)+βOSN(45)
Please purchase PDF Split-Merge on www.verypdf.com to remove this watermark.

84 179 13.2 9.0 Ʈmethyl-ring2HCCC(63) 85 173 7.4 5.0 βSCC(21)+ƮONCS(12) 86 169 11.9 8.1 βSCC(12)+ƮCCCC(33) 87 132 13.3 9.0 βSCC(12)+βNSC(12)+ƮCCCC(11) 88 94 13.8 9.4 βCNS(22 )+ƮCCCN(26)+SCCC(10) 89 60 28.7 19.5 βNSC(10)+ƮCCNS(46)+ƮCCNS(12) 90 36 1.3 0.9 βCNS(24)+βNSC(16)+ƮCCNS(16) 91 32 2.7 1.8 Ʈmethyl-ring1HCCC(87) 92 24 2.8 1.9 ƮNSCC(89) 93 17 15.8 10.7 ƮCNSC(85)
Please purchase PDF Split-Merge on www.verypdf.com to remove this watermark.
180
7.4.1 N-H Vibration
It is reported that the N–H stretching vibrations occur in the region
3300–3500 cm-1[41]. Experimentally, the strong band at 3277 in FTIR is assigned
to N–H stretching for 4M2NPBS. In this study, this band computed at 3390 cm-1
which shows 113 cm-1 difference with the observed ones. However, it is known
that calculations in high frequency region are not reliable with experimental data
due to the anharmonic effects and difference between experiment and calculations
media. As expected, this mode for 4M2MPBS, are pure stretching modes as it is
evident from PED column, contributing 100%. The pure N–H in-plane-bending
vibrations are calculated at 1355 cm-1 for 4M2MPBS while the observed bands
correspondence at 1400 and 1390 cm-1. The out-of-plane bending vibrations of
N–H are combined with other vibrations at 612cm-1 at mode no 67.
7.4.2 C-H Vibration
The aromatic structure shows the presence of C–H stretching vibrations in
the region 3100–3000 cm-1 which is the characteristic region for the ready
identification of C–H stretching vibrations. In this region, the bands are not
affected appreciably by the nature of substituents [42, 43]. The modes 2-9 are due
to C–H stretching of hydrogen bonded carbon atoms of phenyl rings. In
4M2MPBS, all these C-H modes are pure stretching vibrations contributing nearly
95% P.E.D. The aromatic C–H in-plane bending modes of benzene and its
derivatives are observed in the region 1300–1000 cm-1[42]. The bands observed in
the FT-IR spectrum at 1045 and 1091 cm-1 are assigned to C–H in-plane bending
vibration for 4M2MPBS. The theoretically computed by B3LYP method at 1281,
1266, 1163, and 1141 cm-1 (modes nos. 33, 34,38 and 40) for 4M2MPBS, show
good agreement with recorded data. The C–H out-of-plane bending vibrations
occur in the range 750–1000 cm-1 in the aromatic compounds [42]. The bands
Please purchase PDF Split-Merge on www.verypdf.com to remove this watermark.

181
observed at 676 and 763 cm-1 in FT-IR spectrum are assigned to C–H out-of-plane
bending vibrations for 4M2MPBS compound. The three pure bands (modes nos.
54, 55 and 62) for the molecule assigned to out-of plane ring C–H bending which
show excellent agreement with the region given for this mode. The PED for in-
plane bending vibrations suggests that these are mixed modes. In general, the
calculated aromatic C–H vibrations (stretching, in-plane and out-of-plane bending)
are in good agreement with experimentally accepted values given in
literature [43–44].
Methyl groups are generally referred as electron donating substituents in
the aromatic ring system. The asymmetric stretching vibrations of CH3 are
expected in the region 2925–3000 cm−1 and the symmetric CH3 stretching
vibrations in the range 2905–2940 cm−1 [45, 46]. The observed asymmetric and
symmetric stretching vibrations for CH3 are at 2978, 2924 cm-1 in FTIR band and
at 3073 cm-1 in FT-Raman band. The modes (10-15) are due to C–H stretching of
hydrogen bonded carbon atoms of methyl group. In 4M2MPBS, all these C-H
modes are pure stretching vibrations contributing nearly 99% P.E.D. The C–CH3
vibrations usually combine with C–H inplane bending vibration [47, 48]. The
rocking mode of the CH3 group usually appears in the region 1070–1010 cm−1 [49–
50]. In 4M2MPBS, rocking mode of the CH3 group appears in the region 1031–
972 cm−1.
7.4.3 C-C Vibration
The ring carbon–carbon stretching vibration occurs in the region
1625–1430 cm-1. In the present work, the frequencies observed in the FT-IR
spectrum at 1599, 1489cm-1 in the IR spectrum and 1609 cm-1 in the FT-Raman
Please purchase PDF Split-Merge on www.verypdf.com to remove this watermark.

182
spectrum were assigned to C–C stretching vibrations. In the present study, the
calculated wavenumbers at 1596, 1589, 1571, 1563, 1383, 1300, 1284 1186, 1164,
1031 and 1046, cm-1 are assigned as C-C stretching vibrations with major PED
contributions of 65%, 31%, 66%, 66%, 35%, 78%, 58%, 39%, 21%, 48%, 60%,
and 30%, respectively. The in-plane deformations are at higher frequencies than
the out-of-plane vibrations. The calculated bands at 991, 622, 549, 410 and
345 cm-1 are assigned to in-plane CCC. The torsion C-C modes are calculated at
698, 687, 437, 398 and 263 cm-1 with 54%, 71%, 41%, 70%, and 25%
contributions of PED, respectively.
7.4.4 Heavy Atoms Fundamentals Vibrations
The symmetric and asymmetric SO2 stretching vibrations occur in the
region 1125–1150 and 1295–1330 cm-1 [51]. For 4M2MPBS symmetric S=O
stretching vibrations were calculated at 1100. 1093 and 1046 cm-1 as combined
modes while obtained at 1091 cm-1 in FT-IR spectrum and 1099 cm-1 in Raman
[52]. For the asymmetric S=O vibrations two bonds were computed at 1266,
1238 cm-1 (4M2MPBS) while observed at 1331, 1249cm-1 in IR and Raman
respectively. The SO2 vibrations are not observed as pure vibrations. The other
in-plane deformation of SO2 (scissoring, wagging and torsion) are calculated at
521, 479, and 411cm-l wavenumbers as seen in the Table 7.4.
In the 4M2MPBS compound, wavenumber calculated at 1203, 837 cm-1 are
due to C-N stretching vibration. Panicker et al. [53] reported the CN stretching
modes at 1292, 1234 and 1200 cm-1 theoretically. The S-C stretching vibrations
calculated at 653 and 250 cm-1 theoretically.
Please purchase PDF Split-Merge on www.verypdf.com to remove this watermark.

183
7.5 FTNMR SPECTRAL ANALYSIS
As in Figure 7.4(a), this compound shows fourteen different carbon atoms,
which is consistent with the structure on the basis of molecular symmetry. 1H NMR spectrum (Figure 7.4(b)) of the title compound is investigated, it can be
seen that total number of protons are in agreement with the integration values
presented in this spectrum. Chemical shifts were reported in ppm relative to TMS
for 1H NMR and 13C NMR spectrum provides information about the number of
different types of protons and also the nature of immediate environment of each of
them. 13C NMR spectrum also provides the structural information with regard to
different carbon atoms present in the molecules. The chemical shifts of aromatic
protons and aromatic carbons of substituted sulfonamides are shown by B.T.
Gowda et al. [54].
In the 1H NMR spectrum, a singlet at 2.408 ppm indicates the three protons
of methyl group of para toluene sulfonyl group. 2.036 ppm indicates three protons
of methyl group of 2-methylphenyl ring. The nine aromatic protons of
methylphenyl and tosyl group appear as multiplet in the range of 7-8 ppm.
The N-H group of the phenyl is responsible for the appearance of broad singlet at
6.67 ppm. In the 13C NMR spectrum the methyl carbon of the phenyl and tosyl
group give signals at 17.59 ppm and 20 ppm respectively. The N-H group bonded
carbon give a signal at 143.78 ppm due to downfield. Methyl group bonded carbon
and sulfonyl group bonded carbons give signals at 136.78 ppm and 134.54 ppm
respectively. The C11 carbon of the methylphenyl group gives a signal at 130.78
ppm. The two ortho carbons and two meta carbon atoms of the tolyl ring give
signals at 129.6 ppm and 126.9 ppm respectively. 127.17 ppm, 126.18 ppm and
124.37 ppm chemicalshifts values are due to different positions of methylphenyl
Please purchase PDF Split-Merge on www.verypdf.com to remove this watermark.
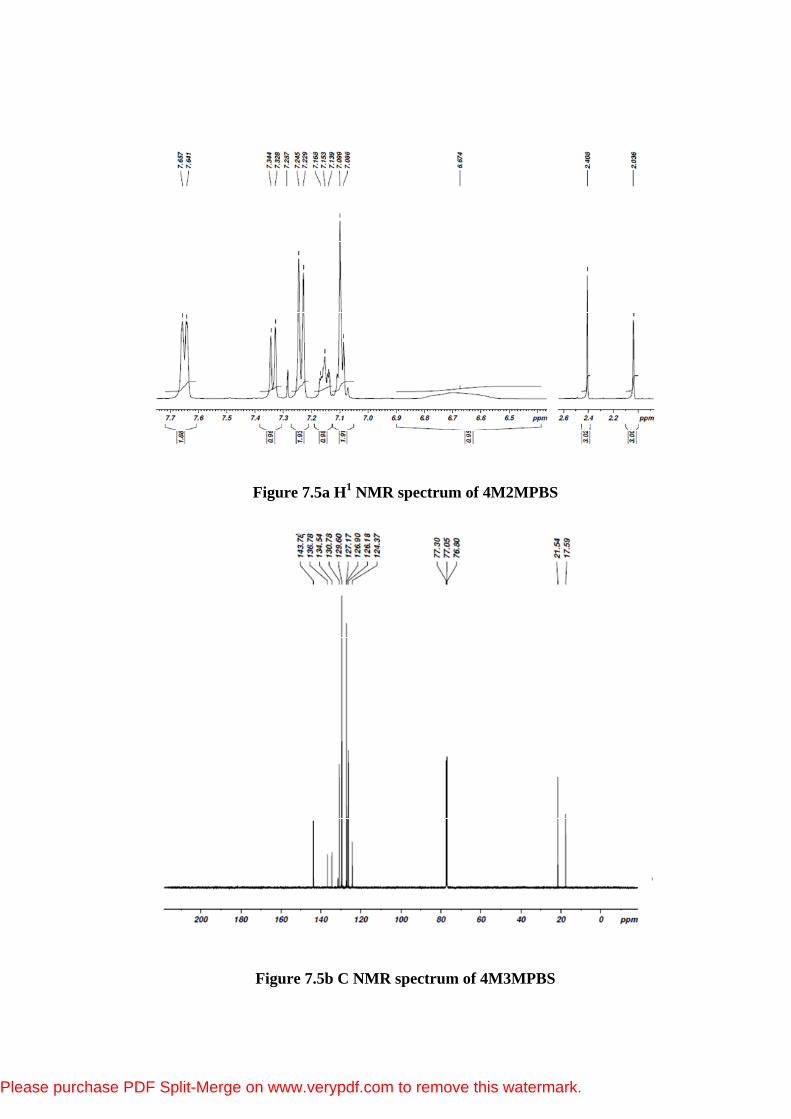
Figure 7.5a H1 NMR spectrum of 4M2MPBS
Figure 7.5b C NMR spectrum of 4M3MPBS
Please purchase PDF Split-Merge on www.verypdf.com to remove this watermark.

184
ring which are given in the Table 7.4. A Signal at 76.8-77.3 ppm indicates the
carbon atom of the CDCl3 (solvent).
7.6 NBO ANALYSIS
The natural bond orbital analysis provides an efficient method for studying
intra- and inter-molecular bonding and interactionamong bonds, and also provides
a convenient basis for investigating charge transfer or conjugative interaction in
molecular systems.
The NBO analysis was performed using NBO 3.1 program as implemented
in the Gaussian 03W package at the 6-31G(d,p) level theory [55]. A short outline
of the NBO segments used and their structural meaning is presented below. NBO
theory allows the assignment of the hybridization of atomic lone pairs and of the
atoms involved in bond orbitals. These are important data in spectral interpretation
since the frequency ordering is related to the bond hybrid composition. The NBO
analysis allows us to estimate the energy of the molecule with the same geometry
but in the absence of electronic delocalization. Moreover, only the steric and
electrostatic interactions through the E-Lewis are taken into account. The most
important interactions between ‘filled’ (donor) Lewis-type NBOs and ‘empty’
(acceptor) non-Lewis NBOs are reported in Table 7.6. The strong intramolecular
hyperconjugative interaction of the sigma and π electrons of the C-C, C-H to anti
C-C and C-H leads to stabilisation of some part of the ring. The intermolecular
hyperconjugative interaction of the σ(C2-C3) distribute to σ* (C1-C6) and (C2-
C3) leads to stabilisation of approximately 3KJ/mol. Further, π(C1-C2) NBO
conjugates with the antibonding orbital of π*(C3-C4) and (C5-C6) which leads to
strong delocalization of 25.81 and 17.5 KJ/mol respectively. The π* (C3-C4) of
NBO conjugated with the π*(C1-C2) and (C5-C6) results in an enormous
stabilization of 171.91 and 213.04 KJ/mol respectively.
Please purchase PDF Split-Merge on www.verypdf.com to remove this watermark.

Table 7.6. Second order perturbation theory analysis of Fock matrix in NBO basis.
Donor(i) Type ED(e) Acceptor Type ED(e) E(2)a (KJ/mol) E(j)‐E(i)b(a.u) F(i,j)c (a.u)
C1‐C2 σ 1.6391 C1‐C6 σ * 0.0213 3.11 1.27 0.056
σ C2‐C3 σ * 0.0171 2.71 1.26 0.052
C1‐C2 π 1.6838 C3‐C4 π * 0.3984 25.81 0.26 0.074
C5‐C6 π * 0.3031 17.5 0.28 0.063
C1‐C2 π 1.6594 C1‐C2 π* 0.3266 22.91 0.29 0.072
C3‐C4 π* 0.3984 17.44 0.27 0.062
C3‐C4 π 1.6747 C1‐C2 π* 0.3266 14.98 0.3 0.006
C5‐C6 π* 0.3031 21.63 0.29 0.071
C20‐C21 π 1.6541 C22‐C24 π* 0.3489 22.10 0.28 0.071
C23‐C26 π* 0.3246 17.26 0.29 0.063
C23‐C26 π 1.9855 C20‐C21 π* 0.3709 22.98 0.28 0.072 C23‐C26 π 1.9721 C22‐C24 π* 0.3489 19.91 0.27 0.066
LP(2)O17 1.8166 C4‐S15 π* 0.1868 16.31 0.44 0.075 LP(2)O17 1.8166 S15‐O16 π* 0.1668 14.09 0.56 0.079 LP(3)O17 1.6867 S15‐N18 π* 0.2622 25.71 0.38 0.089 C3‐C4 1.6711 C1‐C2 π* 0.3266 171.91 0.02 0.083 C3‐C4 .58628 C5‐C6 π* 0.3031 213.04 0.01 0.078 LP(1)N18 1.9076 S15‐O16 σ* 0.1652 8.32 0.65 0.067
a E(2) means energy of hyper conjugative interaction (stabilization energy). b Energy difference between donor and acceptor i and j NBO orbitals. c F(i,j) is the fork matrix element between i and j NBO orbitals.
Please purchase PDF Split-Merge on www.verypdf.com to remove this watermark.

185
7.7 NON-LINEAR OPTICAL EFFECTS
The calculations of the mean linear polarizability (αtot) and the mean first
hyperpolarizability (βtot) from the Gaussian output have been explained in detail
previously in chapter one. DFT has been extensively used as an effective method
to investigate the organic NLO materials [42]. The total molecular dipole moment
(μtot), linear polarizability (αtot) and first-order hyperpolarizability (βtot) of the title
compound were calculated at the B3LYP/6−31G(d,p) level. The calculated values
of μtot, and βtot of urea are 1.46 D and 6.06 × 10⁻³¹ cm5/esu. Urea is one of the
prototypical molecules used in the study of the NLO properties of molecular
systems. Therefore it was used frequently as a threshold value for comparative
purposes. The values of μtot and βtot of 4M2MPBS are 3.53 D and 16.26 × 10⁻³¹
cm5/esu obtained at the same level. Theoretically, the firstorder hyperpolarizability
of the title compound is of 2.87 times magnitude of urea. According to these
results, the title compound is a good candidate of NLO material.
7.8 MULLIKEN CHARGE ANALYSIS
The magnitudes of the carbon atomic charges were found to be either
positive or negative at the computational methods. These magnitudes are changing
between –0.37 and 0.14. The maximum charge magnitude (C12) was found 0.14 at
B3LYP/6–31G (d,p) calculation level. On the other hand, the minimum charge
(C7) was obtained to be -.37 at the B3LYP level of calculation. The magnitudes of
charges calculated on N atom of NH group is noted to be negative value -0.633 and
the charge on N connected with H was calculated to be positive .303 at the
Please purchase PDF Split-Merge on www.verypdf.com to remove this watermark.
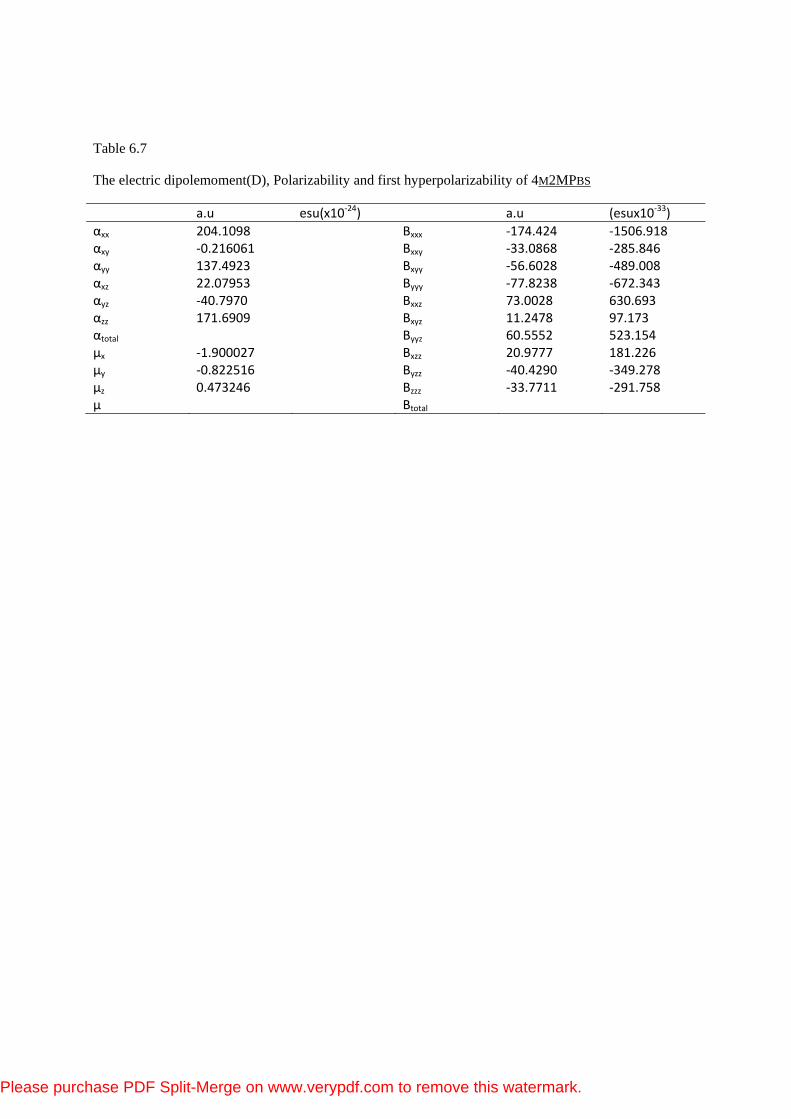
Table 6.7
The electric dipolemoment(D), Polarizability and first hyperpolarizability of 4M2MPBS
a.u esu(x10‐24) a.u (esux10‐33)αxx 204.1098 Βxxx ‐174.424 ‐1506.918 αxy ‐0.216061 Βxxy ‐33.0868 ‐285.846 αyy 137.4923 Βxyy ‐56.6028 ‐489.008 αxz 22.07953 Βyyy ‐77.8238 ‐672.343 αyz ‐40.7970 Βxxz 73.0028 630.693 αzz 171.6909 Βxyz 11.2478 97.173 αtotal Βyyz 60.5552 523.154 µx ‐1.900027 Βxzz 20.9777 181.226 µy ‐0.822516 Βyzz ‐40.4290 ‐349.278 µz 0.473246 Βzzz ‐33.7711 ‐291.758 µ Βtotal
Please purchase PDF Split-Merge on www.verypdf.com to remove this watermark.

Figure 7.6 The Mulliken Charge distribution for 4M2MPBS
Please purchase PDF Split-Merge on www.verypdf.com to remove this watermark.

0.056 -0.089
Figure 7.7 Molecular Electrostatic potential (MEP MAP) of 4M2MPBS
Please purchase PDF Split-Merge on www.verypdf.com to remove this watermark.

186
calculation levels. In addition, the magnitudes of the oxygen atomic charges are
noted to be negative values and arranged in an order from -.53 and -.51. The O1
atom was determined to be the minimum charge value (–0.53) at B3LYP/6–31G
(d,p) level of theory. Moreover, the magnitudes of the hydrogen atomic charges are
arranged in an order from 0.05 to 0.173.
The results show that, all the hydrogen atoms in the molecule lost electrons.
All oxygen atoms and nitrogen atom of the NH group in the molecules accepted
electrons. Charge migration to heavy atoms can be related to molecular
interactions.
7.9 Molecular Electrostatic Potential
At any given point r(x, y, z) in the vicinity of a molecule, the molecular
electrostatic potential, V(r) is defined in terms of the interaction energy between
the electrical charge generated from the molecule electrons and nuclei and a
positive test charge (a proton) located at r. The molecular electrostatic potential
(MEP) is related to the electronic density and a very useful descriptor for
determining sites for electrophilic attack and nucleophilic reactions as well as
hydrogen–bonding interactions. In Figure 7, negative (red) regions of MEP are
related to electrophilic reactivity the positive (blue) regions are related to
nucleophilic reactivity.
As seen from the Figure 7.8, whereas the red region was localized on the
oxygen atoms of sulfonyl group. And vicinity of these atoms the blue region was
delocalized on the NH group of the methyl aniline ring. Hence, it was found that
the compound is useful to interact intermolecularly. This result also supports the
evidences of charge analyses part.
Please purchase PDF Split-Merge on www.verypdf.com to remove this watermark.

187
7.10 ELECTRONIC ABSORPTION SPECTRA
An experimental electronic spectrum measured in ethanol solution is shown
in Figure 7.8. Absorption maxima (λmax) for this compound were observed at 350
nm. Calculations of molecular orbital geometry show that the visible absorption
maxima of 4M2MPBS correspond to the electron transition from HOMO to
LUMO. The λmax is a function of the electron availability. This band was due to
electronic transition of π-π* type
7.9 FRONTIER MOLECULAR ORBITALS
Both the highest occupied molecular orbital (HOMO) and lowest
unoccupied molecular orbital (LUMO) are the main orbital takepart in chemical
stability [38]. The HOMO represents the ability to donate an electron, LUMO as an
electron acceptor represent the ability to obtain an electron. The HOMO and
LUMO energy calculated by B3LYP/6-31G (d,p) method as shown below. This
electronic absorption corresponds to the transition from the ground to the first
excited state and is mainly described by one electron excitation from the highest
occupied molecular orbital (HOMO) to the lowest unoccupied molecular orbital
(LUMO). The HOMO is located over the tolyl ring; the HOMO→LUMO
transition implies an electron density transfer to the tosyl ring from 2-methyl
aniline ring. The atomic orbital compositions of the frontier molecular orbital are
sketched in Figure 7.7.
HOMO energy (B3LYP) = -6.59eV
LUMO energy (B3LYP) = -1.08eV
HOMO–LUMO energy gap (B3LYP) = 5.51eV
Please purchase PDF Split-Merge on www.verypdf.com to remove this watermark.

Figure 7.8 UV-VIS absorption spectrum of 4M2MPBS
Please purchase PDF Split-Merge on www.verypdf.com to remove this watermark.

Figure 7.9 HOMO‐LUMO Surfaces of 4M2MPBS
Please purchase PDF Split-Merge on www.verypdf.com to remove this watermark.

Figure 7.10 TGA and DTA of 4M2MPBS
Please purchase PDF Split-Merge on www.verypdf.com to remove this watermark.

188
The HOMO and LUMO energy gap explains the eventual charge transfer
interactions taking place within the molecule. The quantum chemical reactivity
descriptors of molecules such as hardness, chemical potential, softness,
electronegativity and electrophilicity index as well as local reactivity have been
calculated. The computed quantum chemical descriptors based upon DFT
calculations are presented in Table 7.9.
7.11 THERMAL ANALYSIS
Thermal analysis of 4M2MBS was carried out using a Perkin Elmer model,
simultaneous thermo gravimetric / differential thermal (TG/DT) analyser. The
sample was scanned in the temperature range 0-1000°C at a rate of 25oC for
10 min. The TG/DT curve is shown in Figure7.6. The first endothermic peak
observed at 112.2oC is attributed to the melting point of the 4M2MPBS crystal. At
the melting point, no weight loss was observed in the TG curve. The weight loss
starts around 323.5oC and the major weight loss (59%) takes place over a large
temperature range (323.5- 425oC). Almost all the compounds decomposed as
gaseous products over a temperature range (425-1000oC). The 4M2MPBS is
chemically stable up to 323oC, above which temperature the sample gradually
decomposes.
Please purchase PDF Split-Merge on www.verypdf.com to remove this watermark.

189
7.12 CONCLUSION
4 methyl-N-(2-methylphenyl) Benzene Sulfonamide has been synthesized
and characterized by FTIR, FT-Raman, NMR and X-ray single-crystal diffraction.
The crystal structure is stabilized by N-H---O and C-H--O type hydrogen bonds.
X-ray, FTIR and NMR spectral datas of the title compound indicated that the
compound formed sulfonamide. The theoretical calculations performed by DFT
support the solid state structure. The considerable differences between
experimental and calculated results of FTIR can be attributed to the existence of N-
H--O and C-H---O type intermolecular hydrogen bonds in the crystal structure.
The thermal analysis reveals that the title compound stable up to 112.2°C. HOMO–
LUMO gap with 11.54 eV indicates that the title compound has a good stability.
Moreover, after frontier molecular orbitals and molecular electrostatic potential
were visualized, electronic structure and energy band gap of the title molecule
were investigated and interpreted. Atomic charges and UV–Vis spectra were also
determined for the identification of the molecule.
Please purchase PDF Split-Merge on www.verypdf.com to remove this watermark.

190
REFERENCES
1. A. Achari, D.O Somers, J.N Champness, P.K Bryant, J. Rosemond, D.K
Stammers,Nat.Struct.Biol 4(6) (1997) 490-497.
2. R. Pandya, T.Murashima, L.Tedeschi, A.G.M. Barrett, J.Org.Chem. 68
(2003) 8274-8276.
3. C.T Supuran, A. Scozzafava, J.EnzymeInhib.Med.Chem 15(2000) 597-610.
4. F. Abbate, A. Casini, T. Owa, A. Scozzafava, C.T. Supuran, Bioorg. Med.
Chem. Lett 14(2004) 217-223.
5. M.M Ghorab, F.A. Ragab, H.I. Heiba, R.K. Arafa, E.M. El-Hossary, Med.
Chem. Res 20 (2011) 388-400.
6. M.M.Ghorab, F.A. Ragab, M.M. Hamed, 2009. Eur. J. Med. Chem 44
(2009) 4211–4217.
7. M.M Ghorab, F.A. Ragab, H.I. Heiba, H.A. Youssef, M.G. El-Gazzar,
Arzneim. Forsch 60(2010) 48-55.
8. M.S. Al-Said, M.M. Ghorab, S.I. Al-qasoumi, E. M. El-Hossary, E.
Noaman, Eur. J. Med.Chem 45 (2010) 3011-3018.
9. S. Shaji, M. Shibu, Eappen, K.P.R. Nair, T.M.A. Rasheed, Spectrochim.
Acta A 60 (2004) 2275–2281.
10. G.B.V.S. Lakshmi, V. Ali, P.Kulriya, Azher M. Siddiqui, M. Husain, M.
Zulfequar, Physica B 392 (2007) 259–265.
11. W.B. Tzeng, K. Narayanan, J.L. Lin, C.C. Tung, Spectrochim. Acta A 55
(1999) 153–162.
12. B.Ballesteros, L. Santos, Spectrochim. Actat A 58 (2002) 1069–1081.
13. S. Bilal, Anwar-ul-Haq Ali Shah, R. Holze, Vibrational Spectroscopy 53
(2010) 279–284.
Please purchase PDF Split-Merge on www.verypdf.com to remove this watermark.

191
14. P.G. Nirmala, B.T. Gowda, Sabine Foro & HartmutFuess, Acta. Cryst. E65
(2009) o3185-o3194
15. G.M Sheldrick, SHELXS97 and SHELXL97, Programme for solution and
refinement of crystal structure, University of Gottingen, Germany, 1997.
16. A.L Spek, J .Appl.Cryst. Sect, 36 (2003) 7-13.
17. C.K.Johnson, ORTEPII. Report ORNL, 5138. Oak Ridge, National
Laboratory, Tennessee, USA, 1976.
18. A. Subhashini, M. Hemamalini, P. T. Muthiah, G. Bocelli, A. Cantoni,
J. Chem. Crystallogr. 39 (2009) 112-116.
19. F.H. Allen, O. Kennard, D.G Watson, L. Brammer, A.G. Orpen, R. Taylor,
J.Chem.Soc 2(1987) 1-12.
20. C. Chatterjee, J.K. Dattagupta, N.N Saha, Acta. Crystallogr Sect. B 38
(1982) 1845-1847.
21. M. Haridas, R.K. Tiwari, T.P Singh, Acta. Crystallogr. Sect C 40 (1984)
658-660.
22. M. Ghosh, A.K. Basak, S.K Mazumdar, Acta.Crystallogr. Sect C 47 (1991)
577-580.
23. E. Kendi, S. Ozbey, O. Bozdogan, R. Ertan, ActaCrystallogr Sect C 56
(2000) 457-458.
24. M. Takasuka, H. Nakai, Vib Spectrosc 25 (2001) 197-204.
25. S. Ozbey, A. Akbas, G.Ayhan-Kilcigil, R.Ertan, Acta.Crystallogr. Sect C
61 (2005) 559-561.
26. T.P Singh, U. Patel, M. Haridas, Acta.Crystallogr. Sect C 40 (1984) 2088-
2091.
27. Glidewell, John N. Low, Janet M.S. Skakle, L. James, L. Wardell,
Acta. Cryst. C 60 (2004) o33-o34.
Please purchase PDF Split-Merge on www.verypdf.com to remove this watermark.

192
28. V.L Abramenko, V.S Sergienko, Russ. J. Inert. Chem 47 (2002) 905-911.
29. A. Kalman, M. Czugler, G. Argay, ActaCrystallogr Sect B, 37 (1981) 868-
877.
30. C.A Hunter, Chem. Soc Rev, 23 (1994) 101-109.
31. T. Gelbrich, M.B. Hursthouse, T.L. Threlfall, (2007). Acta.Cryst. B63,
621–632.
32. G.L. Perlovich, V. Tkachev, K.J. Schaper, O.A.Raevsky, (2006).
Acta.Cryst. E62, o780–o782.
33. M.J. Frisch et al, Gaussian 03W, Revision C.02. Gaussian Inc, Wallingford,
2004.
34. H.B. Schlegel, J.Comput.Chem 3(1982) 214-218.
35. P.Hohenberg, W. Kohn, Phys. Rev 136 (1964) B864-B871.
36. A.D.Becker, J.Chem.Phys 98 (1993) 5648-5652.
37. C. Lee, et al, Phys Rev B 37 (1988) 785-789.
38. A. Frisch, et al, Gauss view user manual, Gaussian Inc, Pittsburgh, PA,
2000
39. M.H. Jamroz, Vibrational Energy Distribution Analysis VEDA 4
program,Warsaw, 2004.
40. J.B. Foresman, A. Frisch, Exploring Chemistry with Electronic Structure
Methods,Gaussian Inc., Pittsburgh, 1996.
41. R.M. Silverstein, G.C. Basle, and T.C. Morrill, Spectrometric Identification
of organicCompounds, John Wiley and Sons, New York, 1991.
42. W. Kemp, Organic Spectroscopy, MacMillan, London, 1996.
Please purchase PDF Split-Merge on www.verypdf.com to remove this watermark.

193
43. G.E Came, Ramírez de Arellano, C. M.del, S.Fustero, J.C. Pedregosa, An.
Asoc. Quím. Argent 94(2006) 4-6.
44. M. Karabacak, M. Cinar, M.Kurt, J.Mol. Struct 984 (2010) 137-145.
45. N. Colthup, L. Daly, S. Wiberly, Introduction of Infrared and Raman
Spectroscopy, 3rd ed. Academic Press, New York, 1990.
46. N. Roeges, A Guide to the Complete Interpretation of Infrared Spectra of
OrganicStructures, Wiley, New York, 1994.
47. Y. Sharma, Elementary Organic Spectroscopy-Principles and Chemical
Applications, S.Chande and Company Ltd., New Delhi, 1994
48. N. Sundaraganesan, G. Elanga, S. Sebastian, P. Subramani, Indian J. Pure
Appl. Phys. 47 (2009) 481–490.
49. S. George, Infrared and Raman Characteristic Group Wavenumbers, Tables
and Charts., 3rd ed. Wiley, Chichester, 2001.
50. D. Lin-Vien, N. Colthup, W. Fateley, J. Graselli, The Hand Book of
Infrared and Raman Characteristic Frequencies of Organic Molecules,
Academic Press, New York, 1991.
51. G. Socrates, Infrared Characteristic Group Frequencies, Wiley-Inter
Science Publication, New York, 1994.
52. H.A. Dabbagh, A. Teimouri, R. Shiasi, A. NajafiChermahini, J. Iran.
Chem. Soc 5 (2008) 74-82.
53. P.S. Binil, Y. S. Mary, H.T. Varghese, C. Y. Panicker, M.R. Anoop, T.K.
Manojkumar, Spectrochim. Acta A. 94 (2012) 101-109.
54. B.T Gowda, K. Mythoi, J.D.D’ Souza, Z.Naturforsch 57a (2002) 967-973.
55. E.D. Glendening, A.E. Reed, J.E. Carpenter, F. Weinhold,
NBO version 3.1, TCI,University of Wisconsin, Madison, (1998).
Please purchase PDF Split-Merge on www.verypdf.com to remove this watermark.