![[PPT]CHAPTER 6: MECHANICAL PROPERTIES - …materialteknologi.hig.no/Materiallare/W.D.Callister... · Web viewTitle CHAPTER 6: MECHANICAL PROPERTIES Author jhayton Last modified by](https://static.fdocuments.in/doc/165x107/5afb4ce17f8b9aac24910e7c/pptchapter-6-mechanical-properties-viewtitle-chapter-6-mechanical-properties.jpg)
Chapter 7: Mechanical Properties
38
Chapter 7 - 1 ISSUES TO ADDRESS... • Stress and strain: What are they and why are they used instead of load and deformation? Elastic behavior: When loads are small, how much deformation occurs? What materials deform least? • Plastic behavior: At what point does permanent deformation occur? What materials are most resistant to permanent deformation? • Toughness and ductility: What are they and how do we measure them? Chapter 7: Mechanical Properties
-
Upload
knox-browning -
Category
Documents
-
view
57 -
download
0
description
Chapter 7: Mechanical Properties. ISSUES TO ADDRESS. • Stress and strain : What are they and why are they used instead of load and deformation?. • Elastic behavior: When loads are small, how much deformation occurs? What materials deform least?. - PowerPoint PPT Presentation
Transcript of Chapter 7: Mechanical Properties

Chapter 7 - 1
ISSUES TO ADDRESS...
• Stress and strain: What are they and why are they used instead of load and deformation?
• Elastic behavior: When loads are small, how much deformation occurs? What materials deform least?
• Plastic behavior: At what point does permanent deformation occur? What materials are most resistant to permanent deformation?
• Toughness and ductility: What are they and how do we measure them?
Chapter 7: Mechanical Properties

Chapter 7 - 2
Elastic means reversible!
Elastic Deformation2. Small load
F
d
bonds stretch
1. Initial 3. Unload
return to initial
F
d
Linear- elastic
Non-Linear-elastic
Chapter 7 - 3
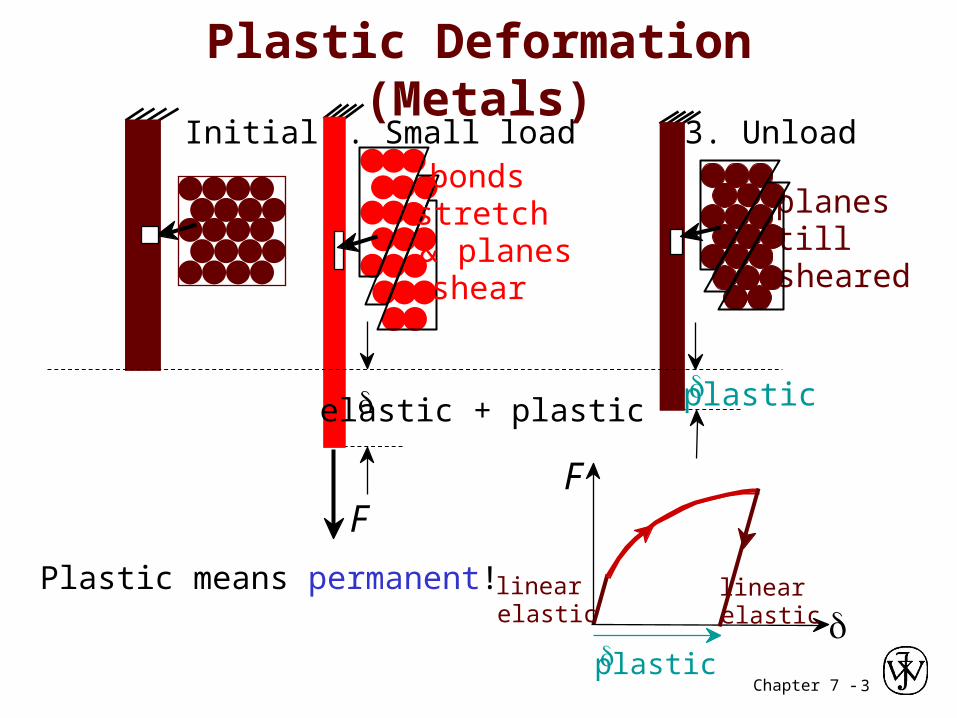
Plastic means permanent!
Plastic Deformation (Metals)
F
dlinear elastic
linear elastic
dplastic
1. Initial 2. Small load 3. Unload
planes still sheared
F
delastic + plastic
bonds stretch & planes shear
dplastic

Chapter 7 - 4
Stress has units: N/m2 or lbf /in2
Engineering Stress• Shear stress, t:
Area, Ao
Ft
Ft
Fs
F
F
Fs
t = Fs
Ao
• Tensile stress, s:
original area before loading
s =Ft
Ao2f
2m
Nor
in
lb=
Area, Ao
Ft
Ft

Chapter 7 - 5
• Simple tension: cable
Note: t = M/AcR here.
Common States of Stress
os= F
A
ot =
FsA
ss
M
M Ao
2R
FsAc
• Torsion (a form of shear): drive shaftSki lift (photo courtesy P.M. Anderson)
Ao = cross sectional
area (when unloaded)
FF
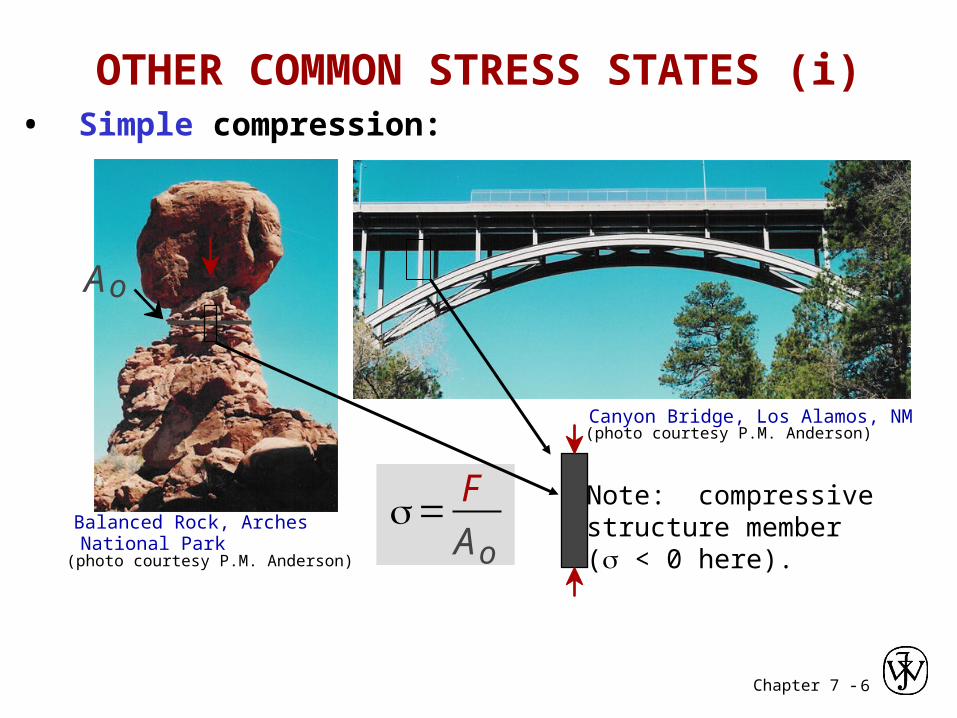
Chapter 7 - 6
(photo courtesy P.M. Anderson)Canyon Bridge, Los Alamos, NM
os= F
A
• Simple compression:
Note: compressivestructure member(s < 0 here).(photo courtesy P.M. Anderson)
OTHER COMMON STRESS STATES (i)
Ao
Balanced Rock, Arches National Park

Chapter 7 - 7
• Bi-axial tension: • Hydrostatic compression:
Pressurized tank
s < 0h
(photo courtesyP.M. Anderson)
(photo courtesyP.M. Anderson)
OTHER COMMON STRESS STATES (ii)
Fish under water
sz > 0
sq > 0

Chapter 7 - 8
• Tensile strain: • Lateral strain:
Strain is alwaysdimensionless.
Engineering Strain
• Shear strain:
q
90º
90º - qy
x qg = Dx/y = tan
e = d
Lo
Adapted from Fig. 7.1 (a) and (c), Callister & Rethwisch 3e.
d/2
Lowo
-deL= L
wo
dL/2
Chapter 7 - 9
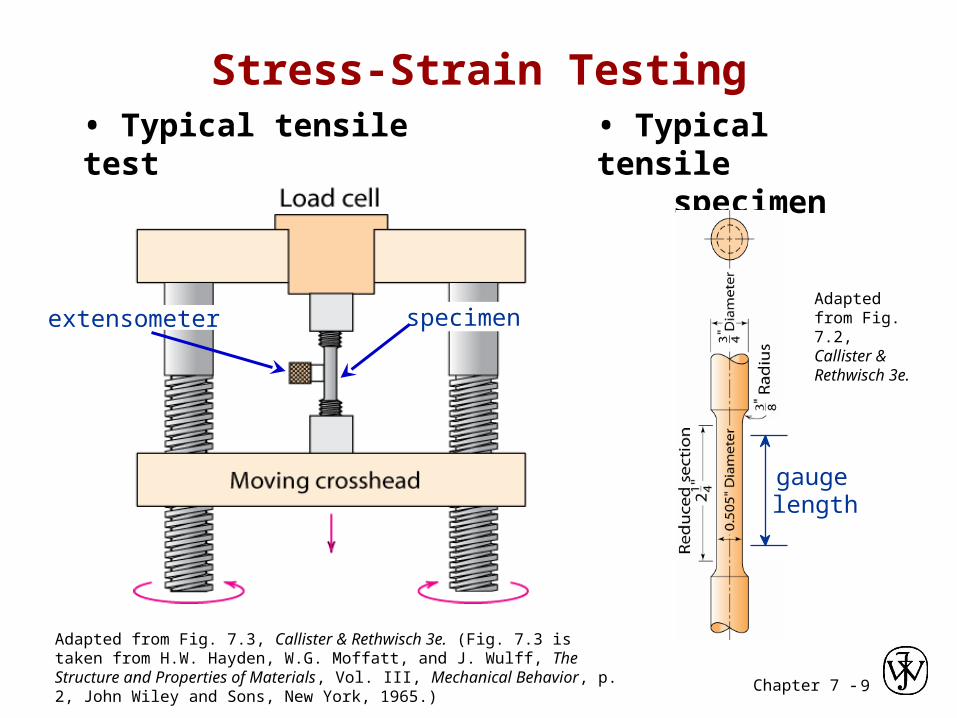
Stress-Strain Testing• Typical tensile test machine
Adapted from Fig. 7.3, Callister & Rethwisch 3e. (Fig. 7.3 is taken from H.W. Hayden, W.G. Moffatt, and J. Wulff, The Structure and Properties of Materials, Vol. III, Mechanical Behavior, p. 2, John Wiley and Sons, New York, 1965.)
specimenextensometer
• Typical tensile specimen
Adapted from Fig. 7.2,Callister & Rethwisch 3e.
gauge length
Chapter 7 - 10
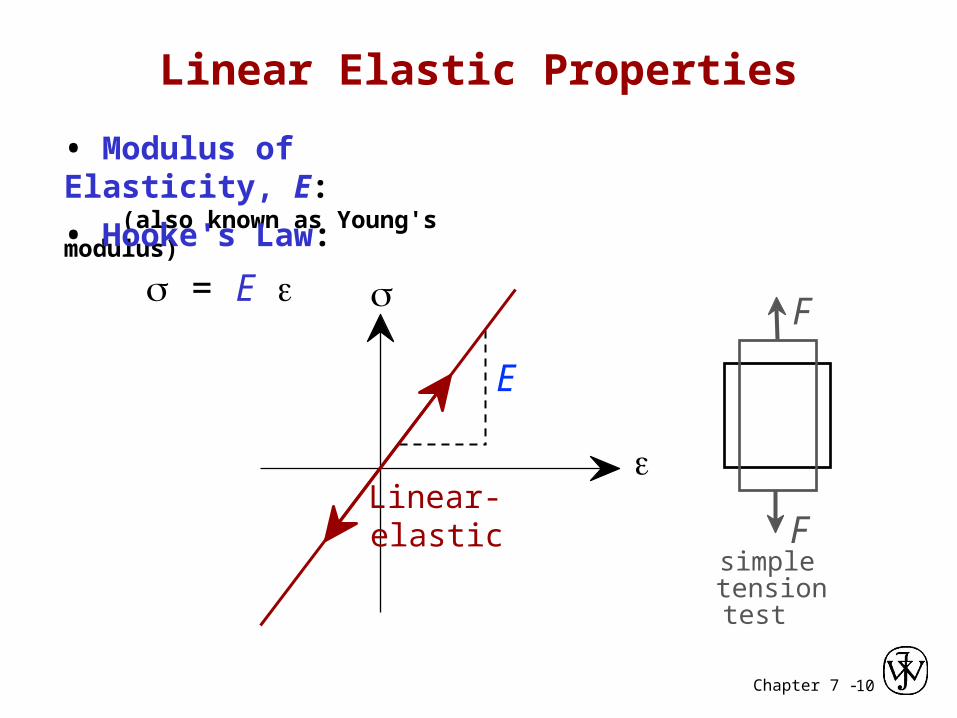
Linear Elastic Properties
• Modulus of Elasticity, E: (also known as Young's modulus)
• Hooke's Law:
s = E e s
Linear- elastic
E
e
F
Fsimple tension test

Chapter 7 - 11
Poisson's ratio, n
• Poisson's ratio, n:
Units:E: [GPa] or [psi]n: dimensionless
> 0.50 density increases
< 0.50 density decreases (voids form)
eL
e
-n
en= - L
e
metals: n ~ 0.33ceramics: n ~ 0.25polymers: n ~ 0.40
Chapter 7 - 12
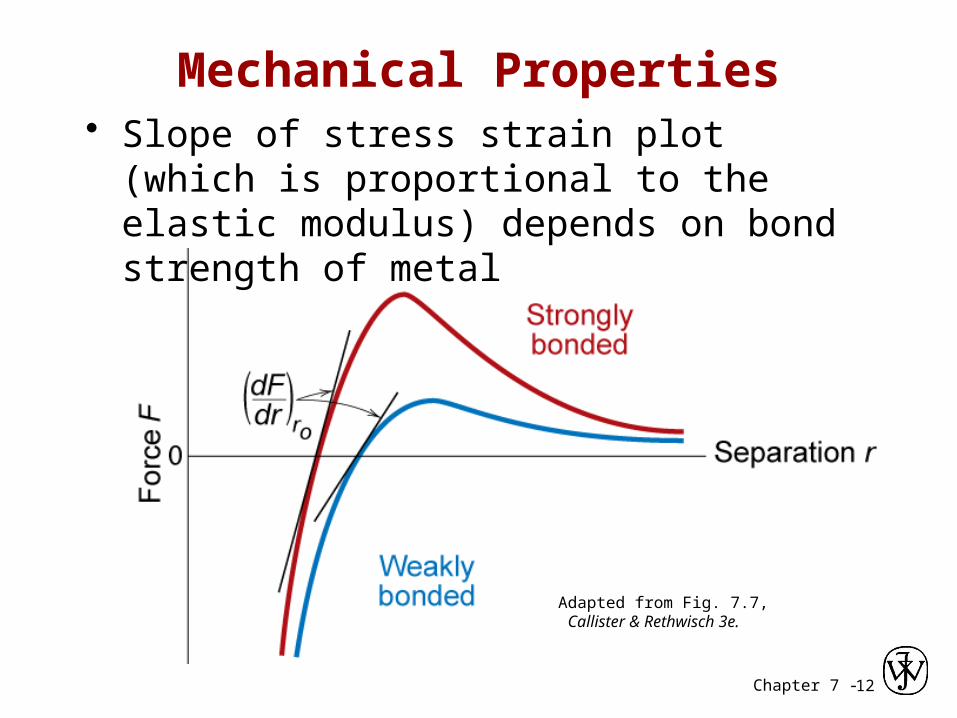
Mechanical Properties• Slope of stress strain plot (which is
proportional to the elastic modulus) depends on bond strength of metal
Adapted from Fig. 7.7, Callister & Rethwisch 3e.

Chapter 7 - 13
• Elastic Shear modulus, G:
tG
gt = G g
Other Elastic Properties
simpletorsiontest
M
M
• Special relations for isotropic materials:
2(1 + n)EG=
3(1 - 2n)
EK=
• Elastic Bulk modulus, K:
pressuretest: Init.
vol =Vo. Vol chg. = DV
P
P PP = -K
DVVo
P
DV
K Vo

Chapter 7 - 14
MetalsAlloys
GraphiteCeramicsSemicond
PolymersComposites
/fibers
E(GPa)
Based on data in Table B.2,Callister & Rethwisch 3e. Composite data based onreinforced epoxy with 60 vol%of alignedcarbon (CFRE),aramid (AFRE), orglass (GFRE)fibers.
Young’s Moduli: Comparison
109 Pa
0.2
8
0.6
1
Magnesium,Aluminum
Platinum
Silver, Gold
Tantalum
Zinc, Ti
Steel, NiMolybdenum
Graphite
Si crystal
Glass -soda
Concrete
Si nitrideAl oxide
PC
Wood( grain)
AFRE( fibers) *
CFRE*
GFRE*
Glass fibers only
Carbon fibers only
Aramid fibers only
Epoxy only
0.4
0.8
2
4
6
10
20
40
6080
100
200
600800
10001200
400
Tin
Cu alloys
Tungsten
<100>
<111>
Si carbide
Diamond
PTFE
HDPE
LDPE
PP
Polyester
PSPET
CFRE( fibers) *
GFRE( fibers)*
GFRE(|| fibers)*
AFRE(|| fibers)*
CFRE(|| fibers)*

Chapter 7 - 15
• Simple tension:
d= FLo
EAo
dL= -nFw o
EAo
• Material, geometric, and loading parameters all contribute to deflection.• Larger elastic moduli minimize elastic deflection.
Useful Linear Elastic Relationships
F
Aod/2
dL/2
Lowo
• Simple torsion:
a=2MLo
ro4G
M = moment a = angle of twist
2ro
Lo
Chapter 7 - 16
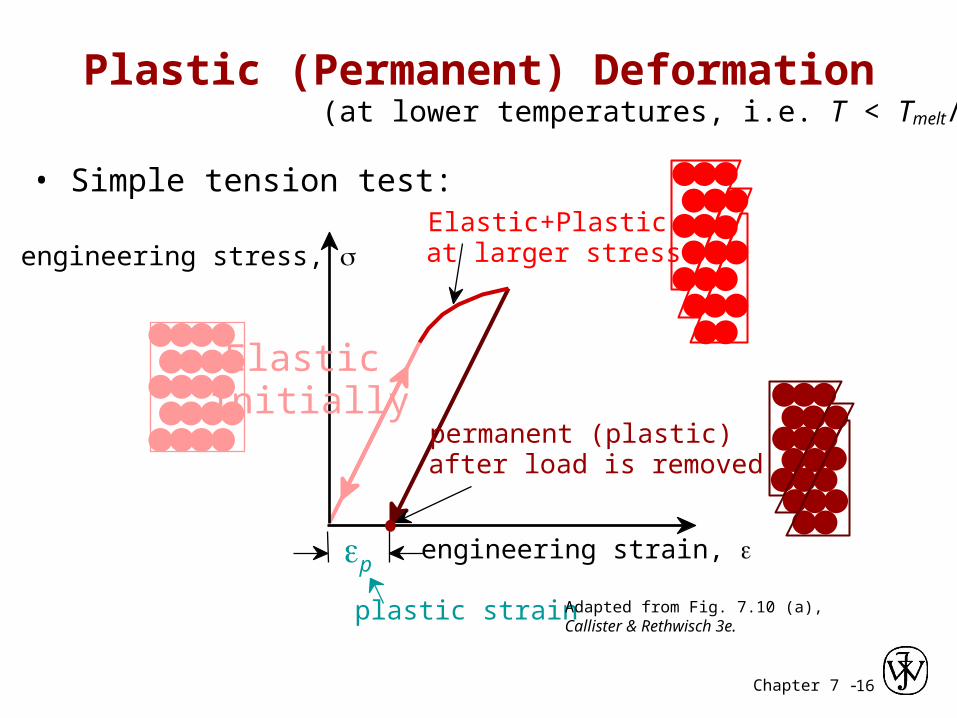
(at lower temperatures, i.e. T < Tmelt/3)Plastic (Permanent) Deformation
• Simple tension test:
engineering stress, s
engineering strain, e
Elastic+Plastic at larger stress
ep
plastic strain
Elastic initially
Adapted from Fig. 7.10 (a),Callister & Rethwisch 3e.
permanent (plastic) after load is removed

Chapter 7 - 17
• Stress at which noticeable plastic deformation has occurred.
when ep = 0.002
Yield Strength, sy
y = yield strength
Note: for 2 inch sample
= 0.002 = z/z
z = 0.004 in
Adapted from Fig. 7.10 (a),Callister & Rethwisch 3e.
tensile stress, s
engineering strain, e
sy
ep = 0.002
Chapter 7 - 18
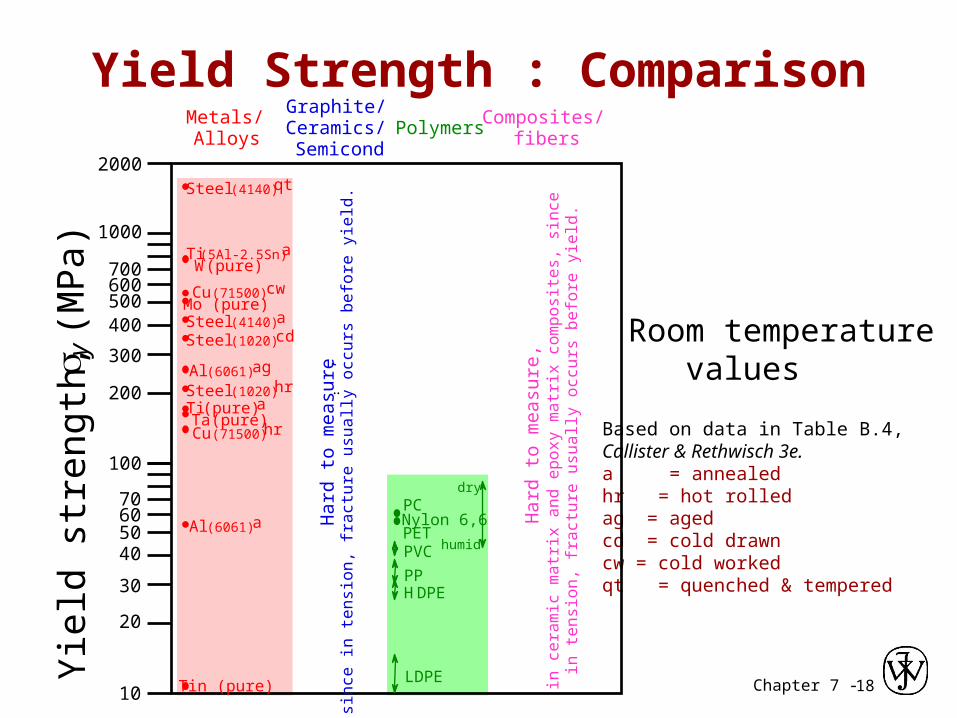
Room temperature values
Based on data in Table B.4,Callister & Rethwisch 3e. a = annealedhr = hot rolledag = agedcd = cold drawncw = cold workedqt = quenched & tempered
Yield Strength : ComparisonGraphite/ Ceramics/ Semicond
Metals/ Alloys
Composites/ fibers
Polymers
Yie
ld s
tren
gth,
sy
(MP
a)
PVC
Har
d to
mea
sure
,
sin
ce in
te
nsi
on
, fr
act
ure
usu
ally
occ
urs
be
fore
yie
ld.
Nylon 6,6
LDPE
70
20
40
6050
100
10
30
200
300
400500600700
1000
2000
Tin (pure)
Al (6061) a
Al (6061) ag
Cu (71500) hrTa (pure)Ti (pure) aSteel (1020) hr
Steel (1020) cdSteel (4140) a
Steel (4140) qt
Ti (5Al-2.5Sn) aW (pure)
Mo (pure)Cu (71500) cw
Har
d to
mea
sure
, in
ce
ram
ic m
atr
ix a
nd
ep
oxy
ma
trix
co
mp
osi
tes,
sin
cein
te
nsi
on
, fr
act
ure
usu
ally
occ
urs
be
fore
yie
ld.
HDPEPP
humid
dry
PC
PET
¨

Chapter 7 - 19
Tensile Strength, TS
• Metals: occurs when noticeable necking starts.• Polymers: occurs when polymer backbone chains are aligned and about to break.
Adapted from Fig. 7.11, Callister & Rethwisch 3e.
y
strain
Typical response of a metal
F = fracture or
ultimate
strength
Neck – acts as stress concentrator e
ngin
eerin
g TS
str
ess
engineering strain
• Maximum stress on engineering stress-strain curve.
Chapter 7 - 20
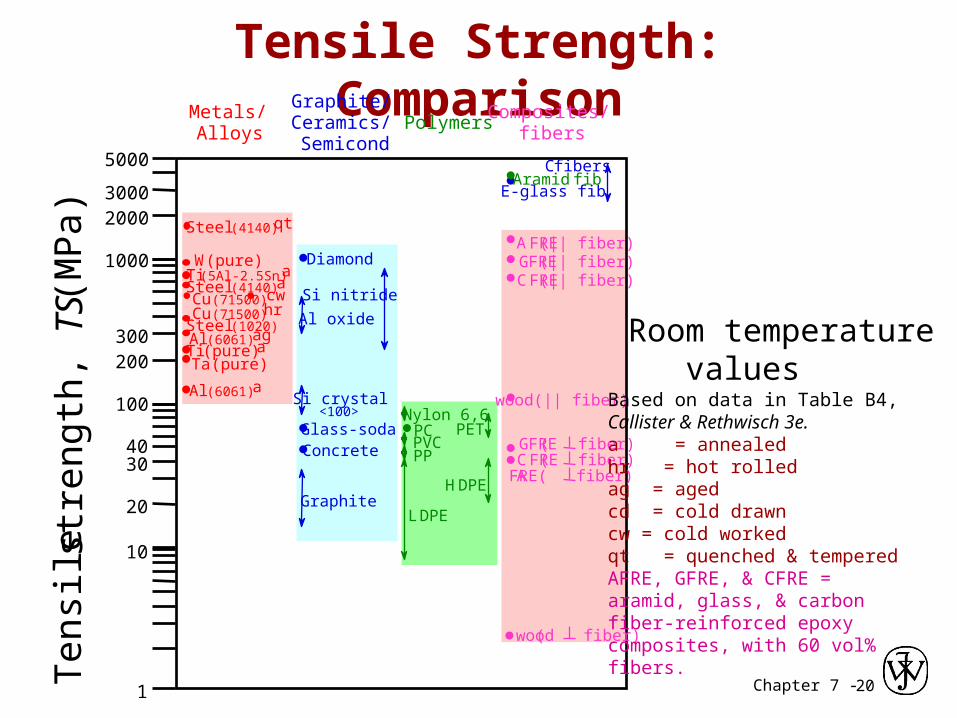
Tensile Strength: Comparison
Si crystal<100>
Graphite/ Ceramics/ Semicond
Metals/ Alloys
Composites/ fibers
Polymers
Tens
ile s
tren
gth,
TS
(M
Pa)
PVC
Nylon 6,6
10
100
200300
1000
Al (6061) a
Al (6061) agCu (71500) hr
Ta (pure)Ti (pure) aSteel (1020)
Steel (4140) a
Steel (4140) qt
Ti (5Al-2.5Sn) aW (pure)
Cu (71500) cw
LDPE
PP
PC PET
20
3040
20003000
5000
Graphite
Al oxide
Concrete
Diamond
Glass-soda
Si nitride
HDPE
wood ( fiber)
wood(|| fiber)
1
GFRE(|| fiber)
GFRE( fiber)
CFRE(|| fiber)
CFRE( fiber)
AFRE(|| fiber)
AFRE( fiber)
E-glass fib
C fibersAramid fib
Based on data in Table B4,Callister & Rethwisch 3e. a = annealedhr = hot rolledag = agedcd = cold drawncw = cold workedqt = quenched & temperedAFRE, GFRE, & CFRE =aramid, glass, & carbonfiber-reinforced epoxycomposites, with 60 vol%fibers.
Room temperature values

Chapter 7 - 21
• Plastic tensile strain at failure:
Ductility
• Another ductility measure: 100xA
AARA%
o
fo -=
x 100L
LLEL%
o
of -=
Lf
Ao AfLo
Adapted from Fig. 7.13, Callister & Rethwisch 3e.
Engineering tensile strain, e
Engineering tensile stress, s
smaller %EL
larger %EL
Chapter 7 - 22
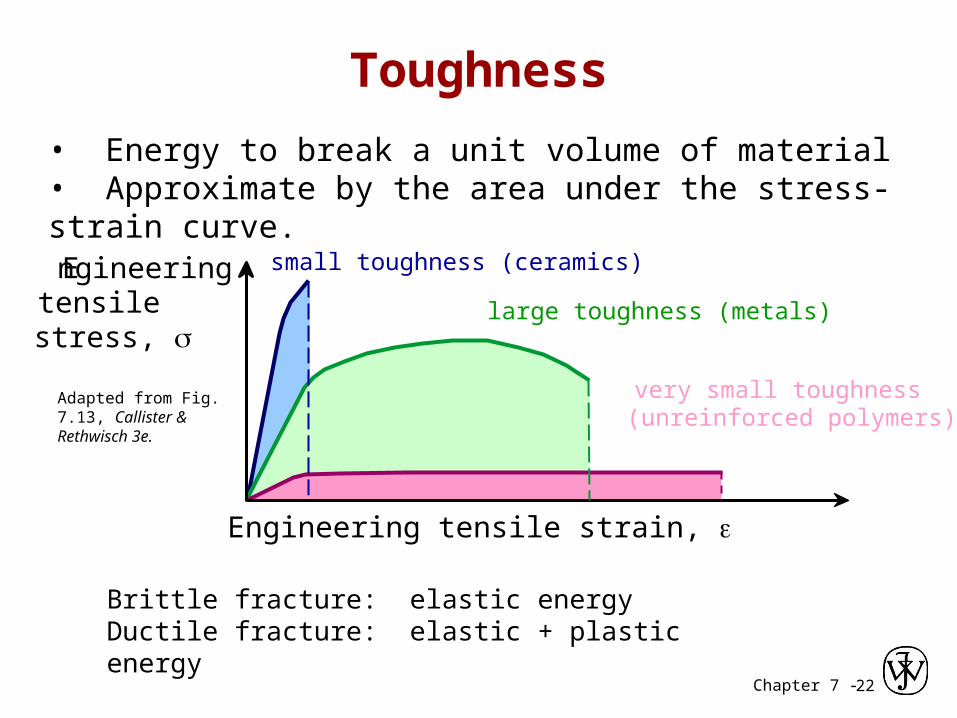
• Energy to break a unit volume of material• Approximate by the area under the stress-strain curve.
Toughness
Brittle fracture: elastic energyDuctile fracture: elastic + plastic energy
Adapted from Fig. 7.13, Callister & Rethwisch 3e.
very small toughness (unreinforced polymers)
Engineering tensile strain, e
Engineering tensile stress, s
small toughness (ceramics)
large toughness (metals)
Chapter 7 - 23
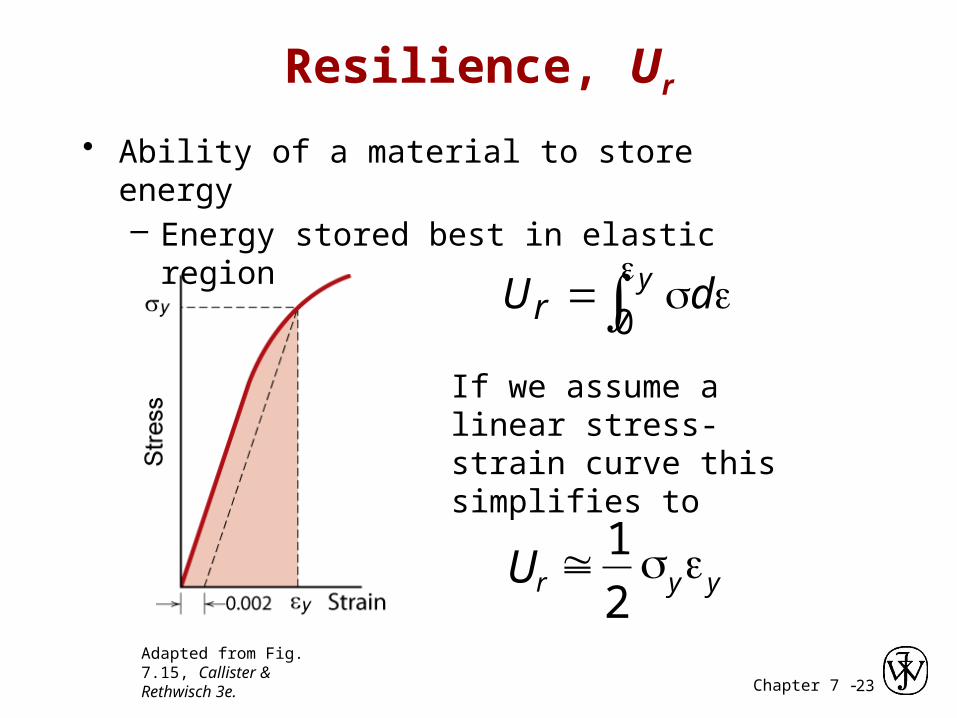
Resilience, Ur• Ability of a material to store energy
– Energy stored best in elastic region
If we assume a linear stress-strain curve this simplifies to
Adapted from Fig. 7.15, Callister & Rethwisch 3e.
yyr2
1U es@
y dUr 0

Chapter 7 - 24
Elastic Strain Recovery
Adapted from Fig. 7.17, Callister & Rethwisch 3e.
Str
ess
Strain
3. Reapplyload
2. Unload
D
Elastic strainrecovery
1. Load
syo
syi

Chapter 7 - 25
Mechanical Properties
Ceramic materials are more brittle than metals. Why is this so?
• Consider mechanism of deformation– In crystalline, by dislocation motion– In highly ionic solids, dislocation motion is difficult
• few slip systems• resistance to motion of ions of like charge (e.g., anions)
past one another
Chapter 7 - 26
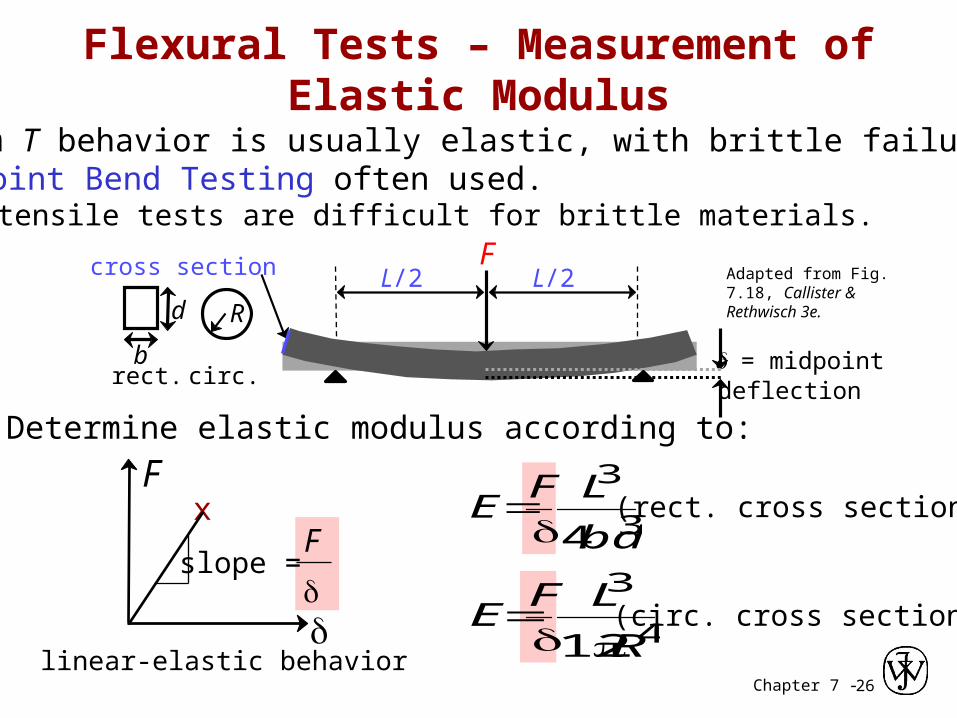
• Room T behavior is usually elastic, with brittle failure.• 3-Point Bend Testing often used. -- tensile tests are difficult for brittle materials.
Adapted from Fig. 7.18, Callister & Rethwisch 3e.
Flexural Tests – Measurement of Elastic Modulus
FL/2 L/2
d = midpoint deflection
cross section
R
b
d
rect. circ.
• Determine elastic modulus according to:
Fx
linear-elastic behaviord
F
dslope =
3
3
4bd
LFE
(rect. cross section)
4
3
12 R
LFE
(circ. cross section)
Chapter 7 - 27
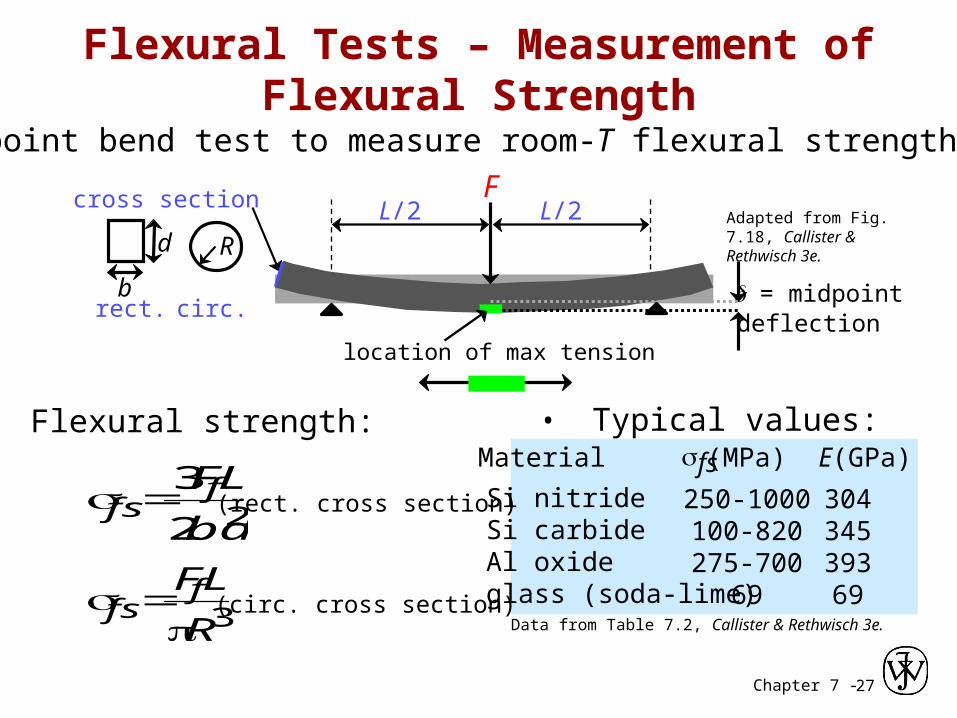
• 3-point bend test to measure room-T flexural strength.
Adapted from Fig. 7.18, Callister & Rethwisch 3e.
Flexural Tests – Measurement of Flexural Strength
FL/2 L/2
d = midpoint deflection
cross section
R
b
d
rect. circ.
location of max tension
• Flexural strength: • Typical values:
Data from Table 7.2, Callister & Rethwisch 3e.
Si nitrideSi carbideAl oxideglass (soda-lime)
250-1000100-820275-700
69
30434539369
Material sfs (MPa) E(GPa)
22
3
bd
LFffs (rect. cross section)
(circ. cross section)3R
LFffs
Chapter 7 - 2828
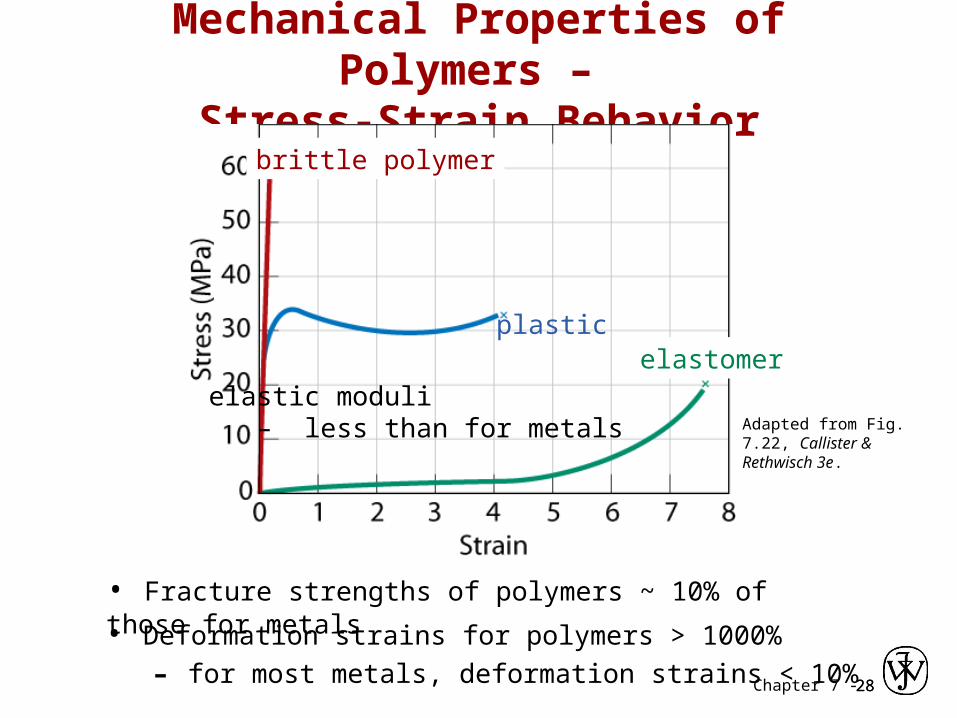
Mechanical Properties of Polymers – Stress-Strain Behavior
• Fracture strengths of polymers ~ 10% of those for metals
• Deformation strains for polymers > 1000%
– for most metals, deformation strains < 10%
brittle polymer
plasticelastomer
elastic moduli – less than for metals Adapted from Fig. 7.22,
Callister & Rethwisch 3e.
Chapter 7 - 2929
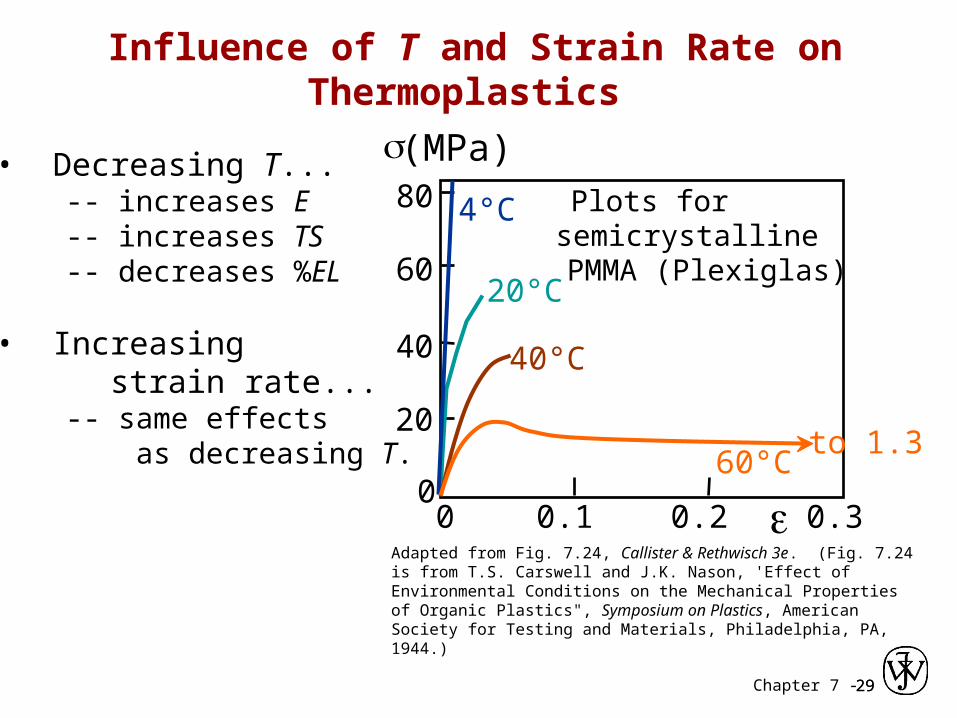
• Decreasing T... -- increases E -- increases TS -- decreases %EL
• Increasing strain rate... -- same effects as decreasing T.
Adapted from Fig. 7.24, Callister & Rethwisch 3e. (Fig. 7.24 is from T.S. Carswell and J.K. Nason, 'Effect of Environmental Conditions on the Mechanical Properties of Organic Plastics", Symposium on Plastics, American Society for Testing and Materials, Philadelphia, PA, 1944.)
Influence of T and Strain Rate on Thermoplastics
20
40
60
80
00 0.1 0.2 0.3
4°C
20°C
40°C
60°Cto 1.3
s(MPa)
e
Plots forsemicrystalline PMMA (Plexiglas)
Chapter 7 -
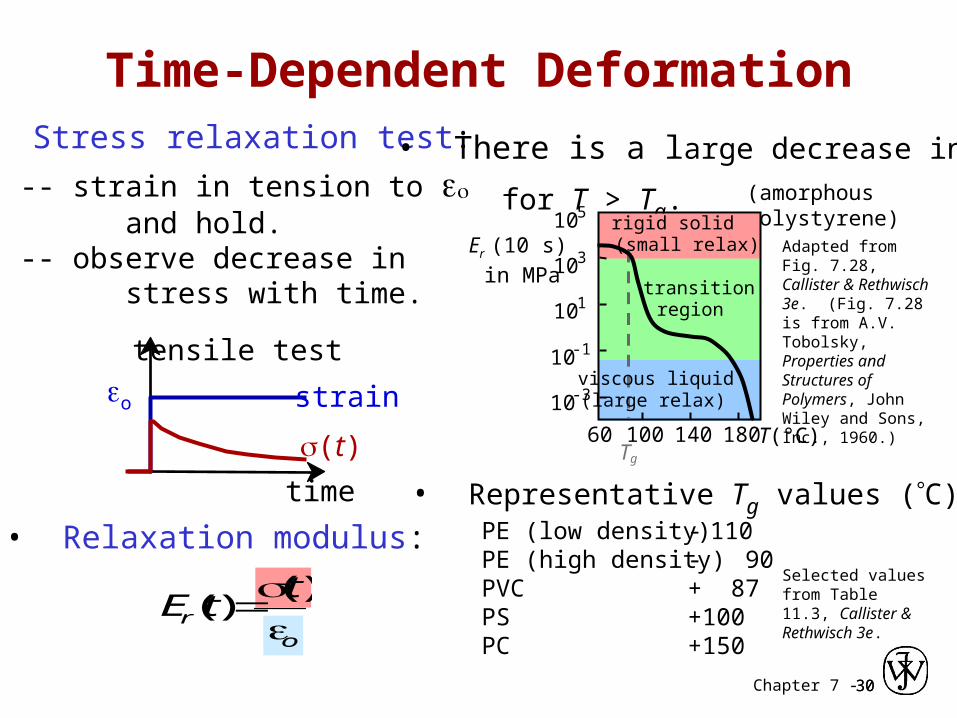
• Representative Tg values (C):PE (low density)PE (high density)PVCPSPC
- 110- 90+ 87+100+150
Selected values from Table 11.3, Callister & Rethwisch 3e.
3030
• Stress relaxation test:
-- strain in tension to eo and hold.-- observe decrease in stress with time.
or
ttE
)(
)(
• Relaxation modulus:
Time-Dependent Deformation
time
strain
tensile test
eo
s(t)
• There is a large decrease in Er
for T > Tg. (amorphouspolystyrene)
Adapted from Fig. 7.28, Callister & Rethwisch 3e. (Fig. 7.28 is from A.V. Tobolsky, Properties and Structures of Polymers, John Wiley and Sons, Inc., 1960.)
103
101
10-1
10-3
105
60 100 140 180
rigid solid (small relax)
transition region
T(°C)Tg
Er (10 s) in MPa
viscous liquid (large relax)
Chapter 7 - 31
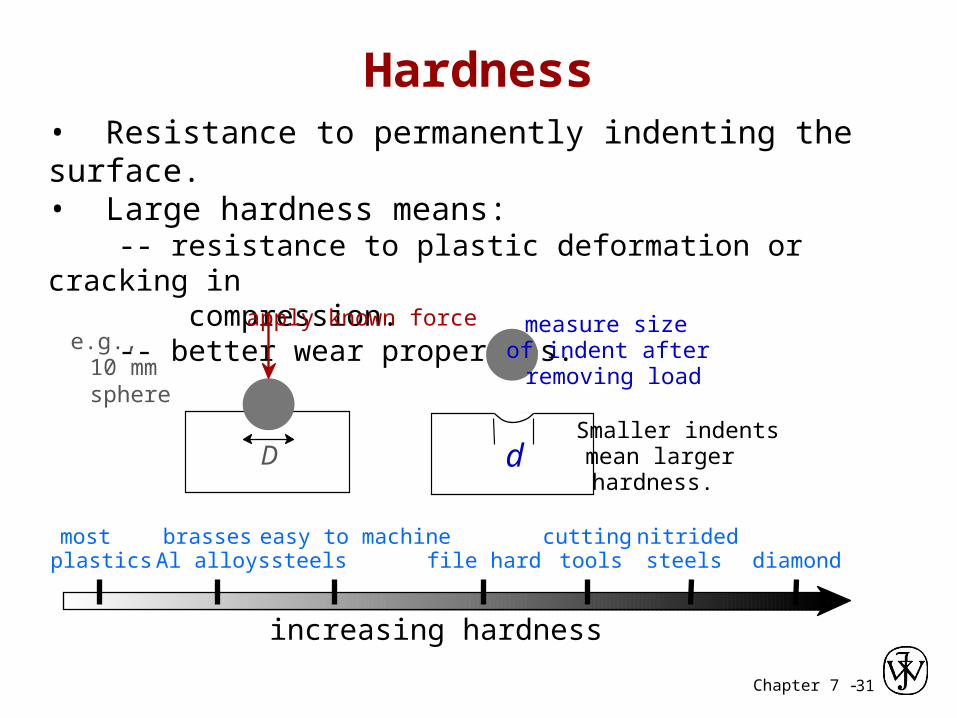
Hardness• Resistance to permanently indenting the surface.• Large hardness means: -- resistance to plastic deformation or cracking in compression. -- better wear properties.
e.g., 10 mm sphere
apply known force measure size of indent after removing load
dDSmaller indents mean larger hardness.
increasing hardness
most plastics
brasses Al alloys
easy to machine steels file hard
cutting tools
nitrided steels diamond
Chapter 7 - 32
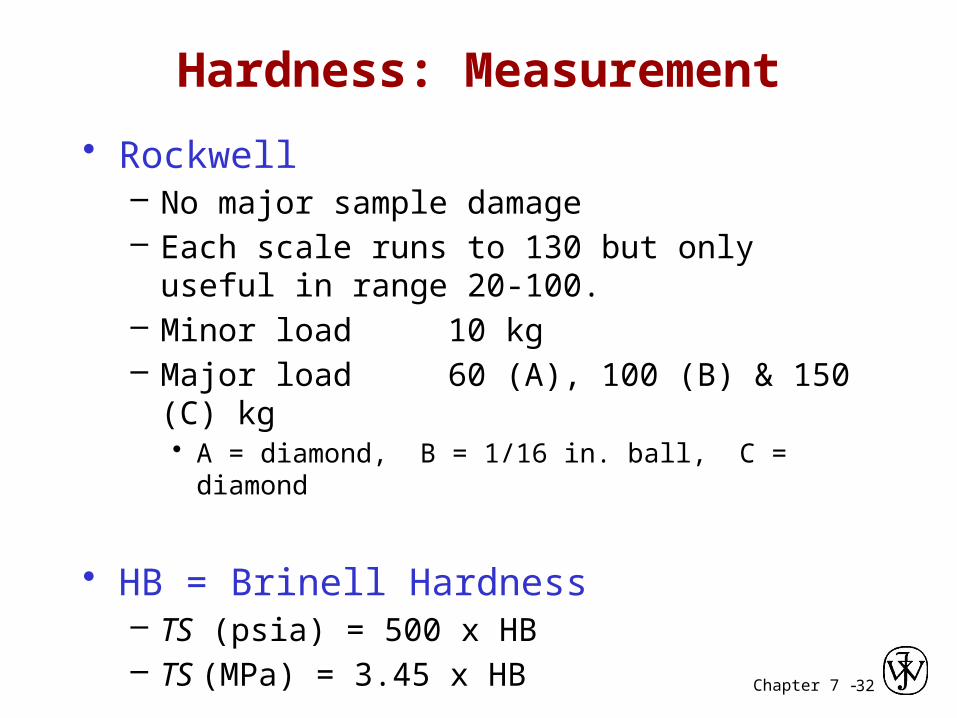
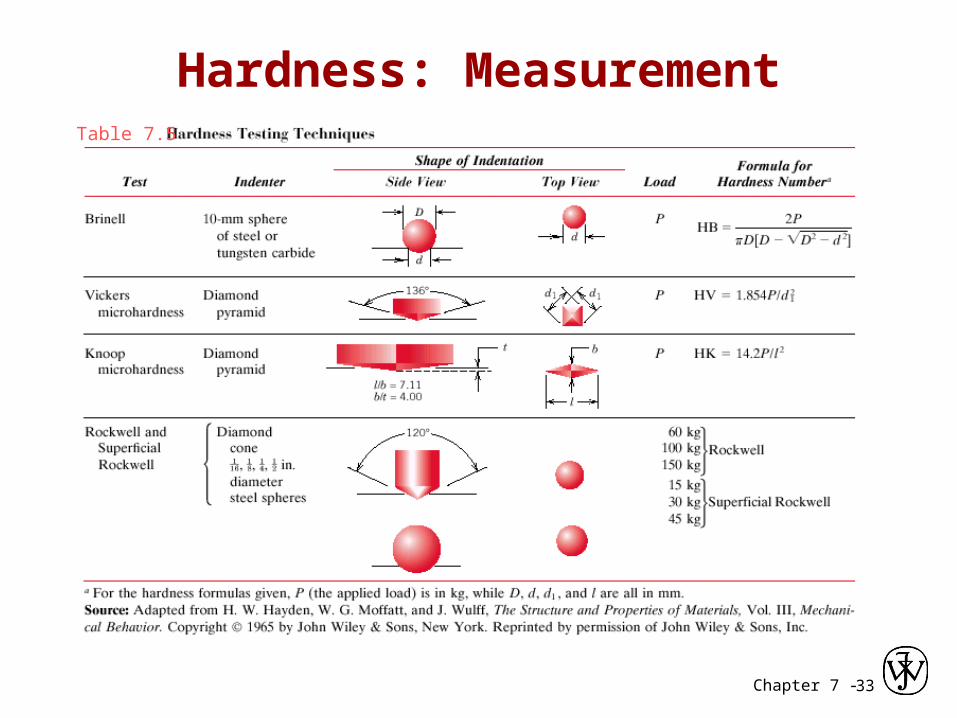
Hardness: Measurement
• Rockwell– No major sample damage– Each scale runs to 130 but only useful in range
20-100. – Minor load 10 kg– Major load 60 (A), 100 (B) & 150 (C) kg
• A = diamond, B = 1/16 in. ball, C = diamond
• HB = Brinell Hardness– TS (psia) = 500 x HB– TS (MPa) = 3.45 x HB
Chapter 7 - 33
Hardness: MeasurementTable 7.5

Chapter 7 - 34
True Stress & StrainNote: S.A. changes when sample stretched
• True stress
• True strainiT AF
oiT ln
1ln
1
T
T
Adapted from Fig. 7.16, Callister & Rethwisch 3e.
Chapter 7 - 35
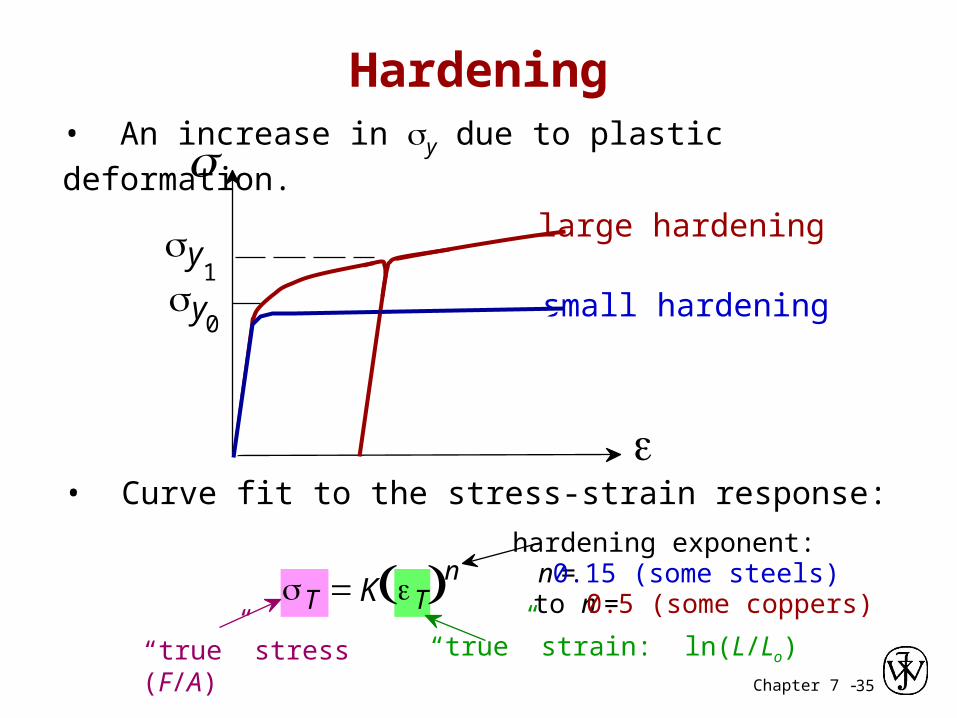
Hardening
• Curve fit to the stress-strain response:
sT =K eT( ) n
“true” stress (F/A) “true” strain: ln(L/Lo)
hardening exponent:n = 0.15 (some steels) to n = 0.5 (some coppers)
• An increase in sy due to plastic deformation.s
e
large hardening
small hardeningsy 0
sy 1

Chapter 7 - 36
Variability in Material Properties
• Elastic modulus is material property• Critical properties depend largely on sample flaws
(defects, etc.). Large sample to sample variability. • Statistics
– Mean
– Standard Deviation 2
1
2
1
n
xxs i
n
n
xx n
n
where n is the number of data points

Chapter 7 - 37
• Design uncertainties mean we do not push the limit.• Factor of safety, N
Ny
working
Often N isbetween1.2 and 4
• Example: Calculate a diameter, d, to ensure that yield does not occur in the 1045 carbon steel rod below. Use a factor of safety of 5.
Design or Safety Factors
220,000N
d2 / 4 5
Ny
working
1045 plain
carbon steel: sy = 310 MPa
TS = 565 MPa
F = 220,000N
d
Lo
d = 0.067 m = 6.7 cm
Chapter 7 - 38
• Stress and strain: These are size-independent measures of load and displacement, respectively.
• Elastic behavior: This reversible behavior often shows a linear relation between stress and strain. To minimize deformation, select a material with a large elastic modulus (E or G).
• Toughness: The energy needed to break a unit volume of material.
• Ductility: The plastic strain at failure.
Summary
• Plastic behavior: This permanent deformation behavior occurs when the tensile (or compressive) uniaxial stress reaches sy.