CHAPTER: 7 MANAGEMENT OF INVENTORY,...
43
130 CHAPTER: 7 MANAGEMENT OF INVENTORY, RECEIVABLES, CASH AND PAYABLES 7.1 MANAGEMENT OF INVENTORY Every company requires inventory for effective management of its activities. Inventory constitutes a major part of current assets in most of the organizations. It comprises of raw materials, work-in-progress, finished goods, consumables and stores. Management of these components of inventory is very useful in order to keep them at optimum level. For this purpose coordination among material department, manufacturing department, finance department and marketing department is absolutely necessary. The material department purchases the material, the manufacturing department changes it into finished product and the marketing department sells it. Other departments such as finance and personnel, help complement other three line and operational departments. Fundamental problem involved in the management of inventory is to attain equilibrium between the working efficiency and the costs connected with huge inventory of business enterprise with the purpose of restraining conflicts to the minimum while optimizing investment in the inventory. 7.1.1 INDIAN FARMERS FERTILIZER COOPERATIVE LIMITED (Table No.7.1.1) Inventory Turnover Ratio (in time) shows a continuous increase from 3.03 in 1999-2K to 6.69 in 2005-06 and from 4.43 to 17.98 in 2008-09. It averages at 5.94. Average Inventory Period (in days) shows a continuous decrease from 120.35 in 1999- 2K to 54.57 in 2005-06 and from 82.33 in 2006-07 to 20.31 in 2008-09. It averages at 77.33.
Transcript of CHAPTER: 7 MANAGEMENT OF INVENTORY,...

130
CHAPTER: 7
MANAGEMENT OF INVENTORY, RECEIVABLES, CASH AND
PAYABLES
7.1 MANAGEMENT OF INVENTORY
Every company requires inventory for effective management of its activities. Inventory
constitutes a major part of current assets in most of the organizations. It comprises of raw
materials, work-in-progress, finished goods, consumables and stores. Management of these
components of inventory is very useful in order to keep them at optimum level. For this
purpose coordination among material department, manufacturing department, finance
department and marketing department is absolutely necessary. The material department
purchases the material, the manufacturing department changes it into finished product and
the marketing department sells it. Other departments such as finance and personnel, help
complement other three line and operational departments.
Fundamental problem involved in the management of inventory is to attain equilibrium
between the working efficiency and the costs connected with huge inventory of business
enterprise with the purpose of restraining conflicts to the minimum while optimizing
investment in the inventory.
7.1.1 INDIAN FARMERS FERTILIZER COOPERATIVE LIMITED (Table
No.7.1.1)
Inventory Turnover Ratio (in time) shows a continuous increase from 3.03 in 1999-2K
to 6.69 in 2005-06 and from 4.43 to 17.98 in 2008-09. It averages at 5.94.
Average Inventory Period (in days) shows a continuous decrease from 120.35 in 1999-
2K to 54.57 in 2005-06 and from 82.33 in 2006-07 to 20.31 in 2008-09. It averages at
77.33.

131
MANAGEMENT OF INVENTORY-TABLE NO.7.1.1
Year ITR(IN TIME) AIP(IN DAYS)1999-2K 3.03 120.352000-01 3.84 95.062001-02 3.85 94.842002-03 4.03 90.622003-04 4.27 85.552004-05 6.07 60.132005-06 6.69 54.572006-07 4.43 82.332007-08 5.25 69.582008-09 17.98 20.31
Mean 5.94 77.33(Source: Annual Reports 1999-2009)
IFFCO
7.1.2 KRISHAK BHARTI COOPERATIVE LIMITED (Table No.7.1.2)
Inventory Turnover Ratio (in time) shows a continuous increase from 4.16 in 1999-2K
to 6.23 in 2003-04, alternate increase from 5.93 in 2004-05 to 7.07 in 2007-08. and finally
increases to 10.52. It averages and 6.15.
Average Inventory Period (in days) shows a continuous decrease from 87.81 in 1999-2K
to 58.63 in 2003-04, alternate decrease/increase from 61.59 in 2004-05 to 51.59 in 2007-
08 and finally decreases to 34.69 in 2008-09. It averages at 64.38.
MANAGEMENT OF INVENTORY-TABLE NO.7.1.2KRIBHCO
Year ITR(IN TIME) AIP(IN DAYS)1999-2K 4.16 87.812000-01 4.18 87.402001-02 4.26 85.742002-03 5.01 72.802003-04 6.23 58.632004-05 5.93 61.592005-06 7.19 50.792006-07 6.92 52.742007-08 7.07 51.592008-09 10.52 34.69
Mean 6.15 64.38(Source: Annual Reports 1999-2009)

132
7.1.3 COOPERATIVE SECTOR (Table No.7.1.3)
Inventory Turnover Ratio (in time) shows a continuous increase from 3.16 in 1999-2K
to 6.74 in 2005-06 from 4.67 in 2006-07 to 17.17 in 2008-09. It averages at 5.96.
Average Inventory Period (in days) shows a continuous decrease from 115.59 in 1999-
2K to 54.13 in 2005-06 from 78.12 in 2006-07 to 21.26 in 2008-09. It averages at 75.39.
MANAGEMENT OF INVENTORY-TABLE NO.7.1.3 COOP SECTOR
Year ITR(IN TIME) AIP(IN DAYS)1999-2K 3.16 115.592000-01 3.88 94.032001-02 3.90 93.562002-03 4.14 88.192003-04 4.47 81.722004-05 6.05 60.292005-06 6.74 54.132006-07 4.67 78.122007-08 5.44 67.062008-09 17.17 21.26
Mean 5.96 75.39(Source: Annual Reports 1999-2009)
7.1.4 FERTILIZERS AND CHEMICALS TRAVANCORE LIMITED (Table
No.7.1.4)
Inventory Turnover Ratio (in time) shows an alternate increase/decrease from 3.33 in
1999-2K to 4.33 in 2002-03 and continuous increase from 4.33 in 2003-04 to 5.24 in 2005-
06. Alternate decrease/increase took place from 4.48 in 2006-07 to 5.44 in 2008-09. It
averages at 4.28.
Average Inventory Period (in days) shows an alternate decrease/increase from 109.69 in
1999-2K to 84.32 in 2002-03 and continuous decrease from 84.23 in 2003-04 to 69.67 in
2005-06. Alternate increase /decrease took place from 81.46 in 2006-07 to 67.08 in 2008-
09. It averages at 89.47.

133
MANAGEMENT OF INVENTORY-TABLE NO.7.1.4FACT
Year ITR(IN TIME) AIP(IN DAYS)1999-2K 3.33 109.692000-01 4.45 82.112001-02 3.61 101.232002-03 4.33 84.322003-04 4.33 84.232004-05 5.00 72.942005-06 5.24 69.672006-07 4.48 81.462007-08 2.57 142.002008-09 5.44 67.08
Mean 4.28 89.47(Source: Annual Reports 1999-2009)
7.1.5 MADRAS FERTILIZERS LIMITED (Table No.7.1.5)
Inventory Turnover Ratio (in time) shows an alternate increase/decrease from 2.96 in
1999-2K to 2.82 in 2002-03 and from 3.60 in 2003-04 to 5.92 in 2006-07. Increase took
place from 6.86 in 2007-08 to 8.00 in 2008-09. It averages at 4.63.
Average Inventory Period (in days) shows an alternate decrease/increase from 123.48 in
1999-2K to 129.29 in 2002-03 decrease/increase from 101.35 in 2003-04 to 61.68 in
2006-07. Decrease took place from 53.21 in 2007-08 to 45.62 in 2008-09. It averages at
90.42.
MANAGEMENT OF INVENTORY-TABLE NO.7.1.5MFL
Year ITR(IN TIME) AIP(IN DAYS)1999-2K 2.96 123.482000-01 3.41 106.962001-02 2.64 138.362002-03 2.82 129.292003-04 3.60 101.352004-05 5.24 69.672005-06 4.89 74.602006-07 5.92 61.682007-08 6.86 53.212008-09 8.00 45.62
Mean 4.63 90.42(Source: Annual Reports 1999-2009)
134
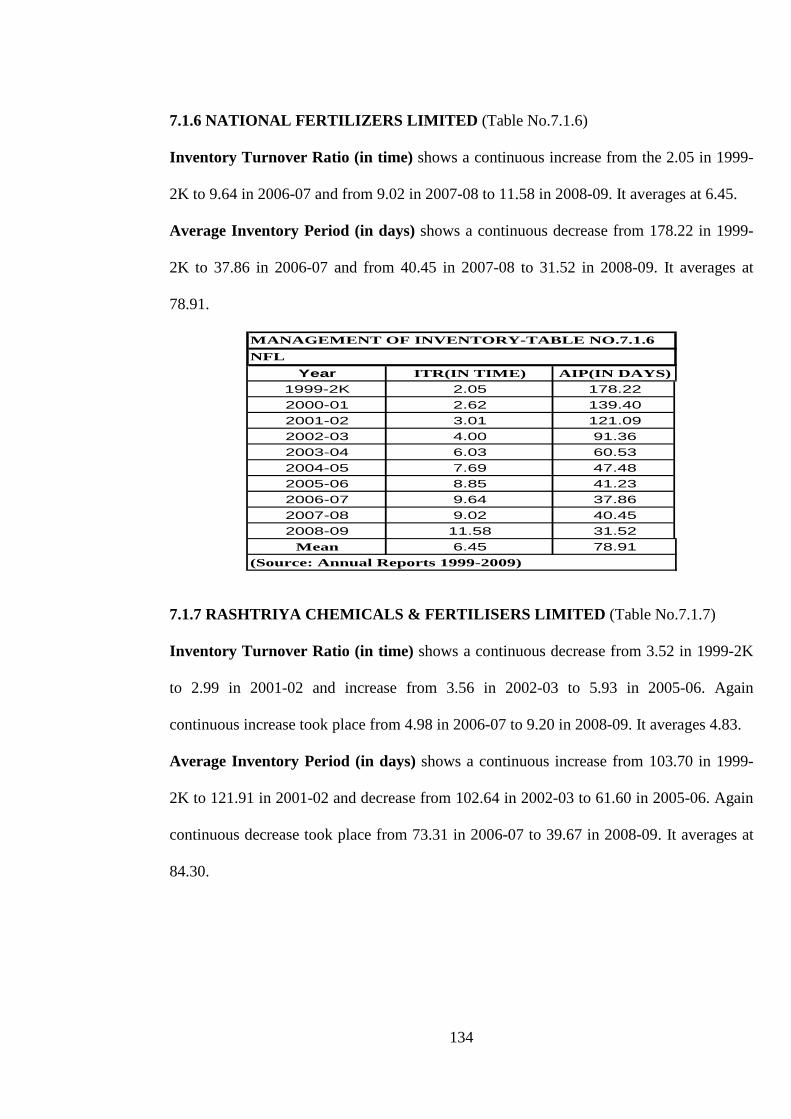
7.1.6 NATIONAL FERTILIZERS LIMITED (Table No.7.1.6)
Inventory Turnover Ratio (in time) shows a continuous increase from the 2.05 in 1999-
2K to 9.64 in 2006-07 and from 9.02 in 2007-08 to 11.58 in 2008-09. It averages at 6.45.
Average Inventory Period (in days) shows a continuous decrease from 178.22 in 1999-
2K to 37.86 in 2006-07 and from 40.45 in 2007-08 to 31.52 in 2008-09. It averages at
78.91.
MANAGEMENT OF INVENTORY-TABLE NO.7.1.6NFL
Year ITR(IN TIME) AIP(IN DAYS)1999-2K 2.05 178.222000-01 2.62 139.402001-02 3.01 121.092002-03 4.00 91.362003-04 6.03 60.532004-05 7.69 47.482005-06 8.85 41.232006-07 9.64 37.862007-08 9.02 40.452008-09 11.58 31.52
Mean 6.45 78.91(Source: Annual Reports 1999-2009)
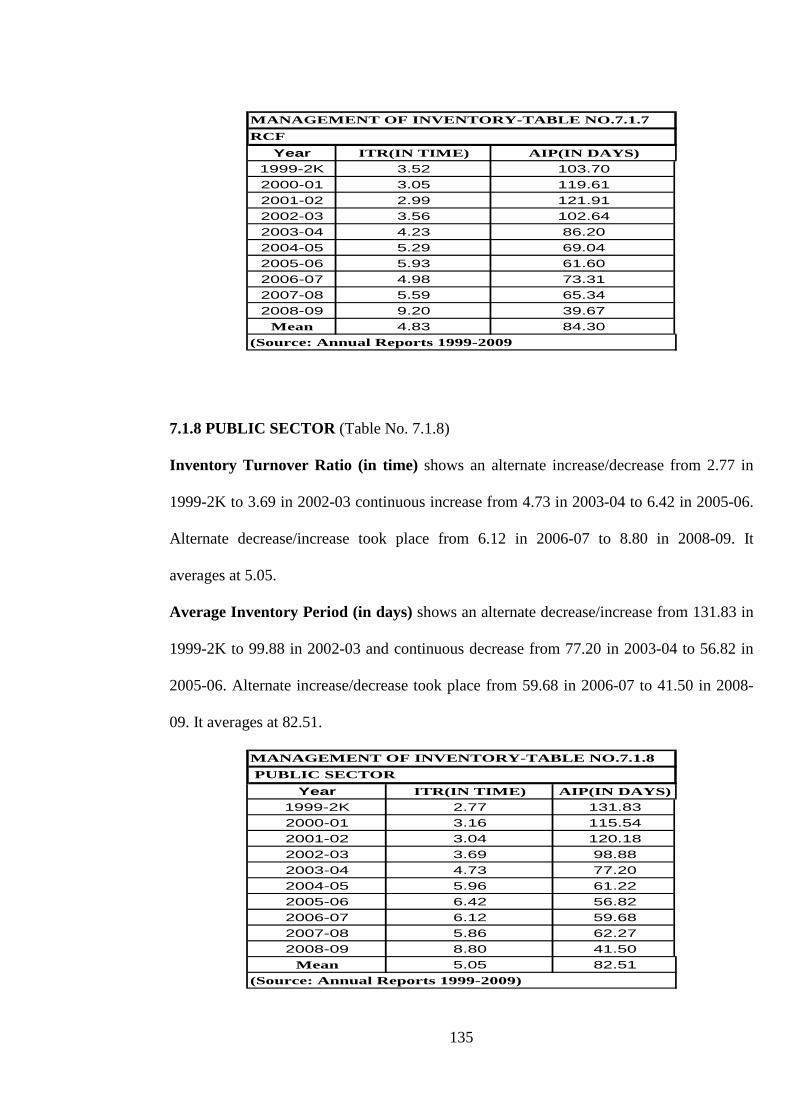
7.1.7 RASHTRIYA CHEMICALS & FERTILISERS LIMITED (Table No.7.1.7)
Inventory Turnover Ratio (in time) shows a continuous decrease from 3.52 in 1999-2K
to 2.99 in 2001-02 and increase from 3.56 in 2002-03 to 5.93 in 2005-06. Again
continuous increase took place from 4.98 in 2006-07 to 9.20 in 2008-09. It averages 4.83.
Average Inventory Period (in days) shows a continuous increase from 103.70 in 1999-
2K to 121.91 in 2001-02 and decrease from 102.64 in 2002-03 to 61.60 in 2005-06. Again
continuous decrease took place from 73.31 in 2006-07 to 39.67 in 2008-09. It averages at
84.30.
135
MANAGEMENT OF INVENTORY-TABLE NO.7.1.7RCF
Year ITR(IN TIME) AIP(IN DAYS)1999-2K 3.52 103.702000-01 3.05 119.612001-02 2.99 121.912002-03 3.56 102.642003-04 4.23 86.202004-05 5.29 69.042005-06 5.93 61.602006-07 4.98 73.312007-08 5.59 65.342008-09 9.20 39.67
Mean 4.83 84.30(Source: Annual Reports 1999-2009
7.1.8 PUBLIC SECTOR (Table No. 7.1.8)
Inventory Turnover Ratio (in time) shows an alternate increase/decrease from 2.77 in
1999-2K to 3.69 in 2002-03 continuous increase from 4.73 in 2003-04 to 6.42 in 2005-06.
Alternate decrease/increase took place from 6.12 in 2006-07 to 8.80 in 2008-09. It
averages at 5.05.
Average Inventory Period (in days) shows an alternate decrease/increase from 131.83 in
1999-2K to 99.88 in 2002-03 and continuous decrease from 77.20 in 2003-04 to 56.82 in
2005-06. Alternate increase/decrease took place from 59.68 in 2006-07 to 41.50 in 2008-
09. It averages at 82.51.
MANAGEMENT OF INVENTORY-TABLE NO.7.1.8 PUBLIC SECTOR
Year ITR(IN TIME) AIP(IN DAYS)1999-2K 2.77 131.832000-01 3.16 115.542001-02 3.04 120.182002-03 3.69 98.882003-04 4.73 77.202004-05 5.96 61.222005-06 6.42 56.822006-07 6.12 59.682007-08 5.86 62.272008-09 8.80 41.50
Mean 5.05 82.51(Source: Annual Reports 1999-2009)
136
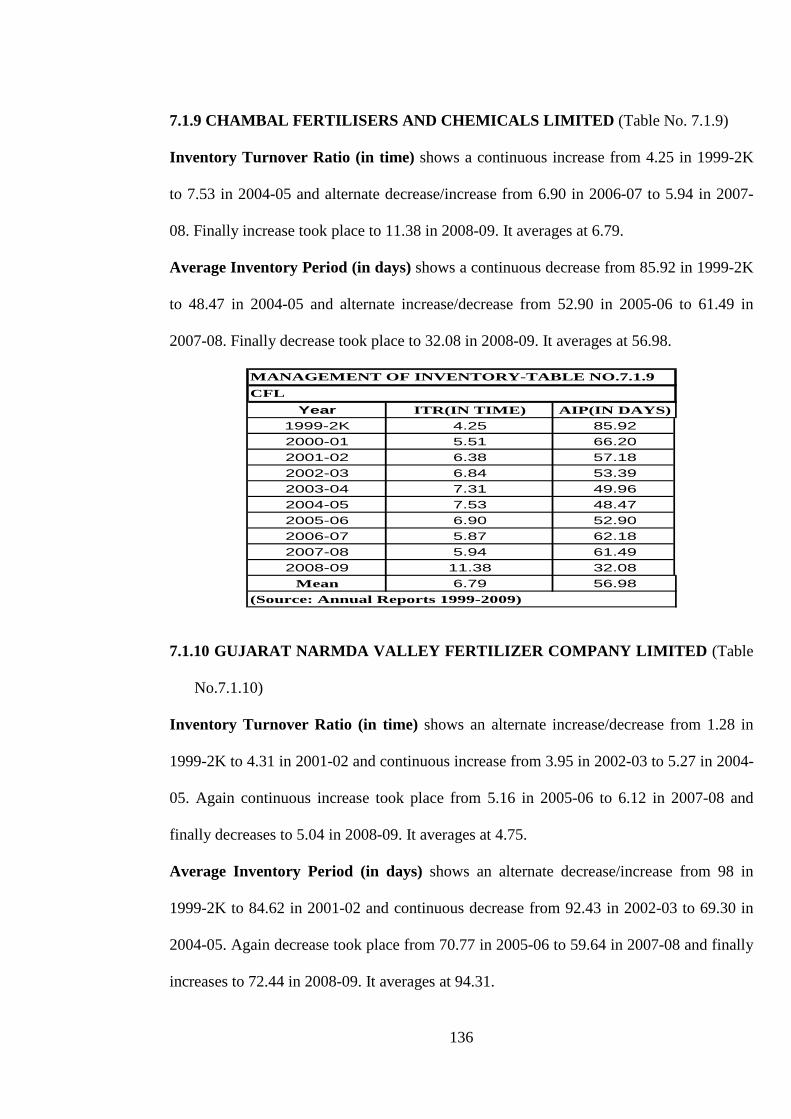
7.1.9 CHAMBAL FERTILISERS AND CHEMICALS LIMITED (Table No. 7.1.9)
Inventory Turnover Ratio (in time) shows a continuous increase from 4.25 in 1999-2K
to 7.53 in 2004-05 and alternate decrease/increase from 6.90 in 2006-07 to 5.94 in 2007-
08. Finally increase took place to 11.38 in 2008-09. It averages at 6.79.
Average Inventory Period (in days) shows a continuous decrease from 85.92 in 1999-2K
to 48.47 in 2004-05 and alternate increase/decrease from 52.90 in 2005-06 to 61.49 in
2007-08. Finally decrease took place to 32.08 in 2008-09. It averages at 56.98.
MANAGEMENT OF INVENTORY-TABLE NO.7.1.9CFL
Year ITR(IN TIME) AIP(IN DAYS)1999-2K 4.25 85.922000-01 5.51 66.202001-02 6.38 57.182002-03 6.84 53.392003-04 7.31 49.962004-05 7.53 48.472005-06 6.90 52.902006-07 5.87 62.182007-08 5.94 61.492008-09 11.38 32.08
Mean 6.79 56.98(Source: Annual Reports 1999-2009)
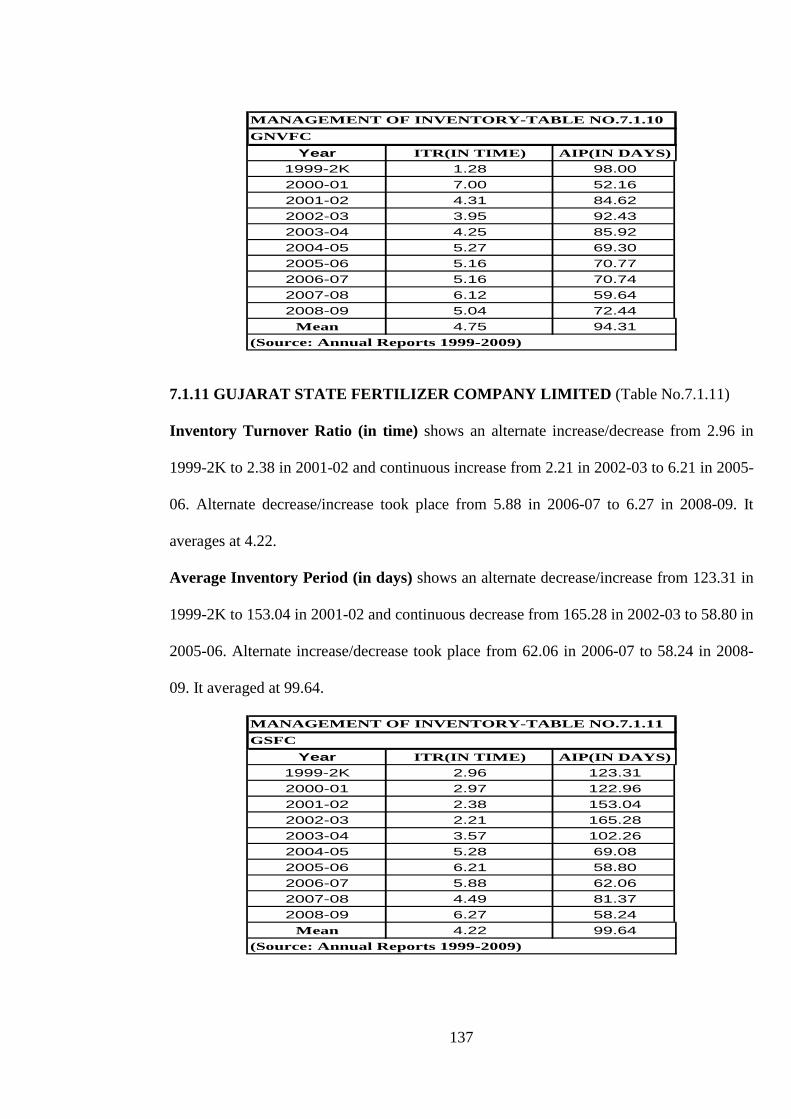
7.1.10 GUJARAT NARMDA VALLEY FERTILIZER COMPANY LIMITED (Table
No.7.1.10)
Inventory Turnover Ratio (in time) shows an alternate increase/decrease from 1.28 in
1999-2K to 4.31 in 2001-02 and continuous increase from 3.95 in 2002-03 to 5.27 in 2004-
05. Again continuous increase took place from 5.16 in 2005-06 to 6.12 in 2007-08 and
finally decreases to 5.04 in 2008-09. It averages at 4.75.
Average Inventory Period (in days) shows an alternate decrease/increase from 98 in
1999-2K to 84.62 in 2001-02 and continuous decrease from 92.43 in 2002-03 to 69.30 in
2004-05. Again decrease took place from 70.77 in 2005-06 to 59.64 in 2007-08 and finally
increases to 72.44 in 2008-09. It averages at 94.31.
137
MANAGEMENT OF INVENTORY-TABLE NO.7.1.10GNVFC
Year ITR(IN TIME) AIP(IN DAYS)1999-2K 1.28 98.002000-01 7.00 52.162001-02 4.31 84.622002-03 3.95 92.432003-04 4.25 85.922004-05 5.27 69.302005-06 5.16 70.772006-07 5.16 70.742007-08 6.12 59.642008-09 5.04 72.44
Mean 4.75 94.31(Source: Annual Reports 1999-2009)
7.1.11 GUJARAT STATE FERTILIZER COMPANY LIMITED (Table No.7.1.11)
Inventory Turnover Ratio (in time) shows an alternate increase/decrease from 2.96 in
1999-2K to 2.38 in 2001-02 and continuous increase from 2.21 in 2002-03 to 6.21 in 2005-
06. Alternate decrease/increase took place from 5.88 in 2006-07 to 6.27 in 2008-09. It
averages at 4.22.
Average Inventory Period (in days) shows an alternate decrease/increase from 123.31 in
1999-2K to 153.04 in 2001-02 and continuous decrease from 165.28 in 2002-03 to 58.80 in
2005-06. Alternate increase/decrease took place from 62.06 in 2006-07 to 58.24 in 2008-
09. It averaged at 99.64.
MANAGEMENT OF INVENTORY-TABLE NO.7.1.11GSFC
Year ITR(IN TIME) AIP(IN DAYS)1999-2K 2.96 123.312000-01 2.97 122.962001-02 2.38 153.042002-03 2.21 165.282003-04 3.57 102.262004-05 5.28 69.082005-06 6.21 58.802006-07 5.88 62.062007-08 4.49 81.372008-09 6.27 58.24
Mean 4.22 99.64(Source: Annual Reports 1999-2009)

138
7.1.12 NAGARJUNA FERTILIZERS & CHEMICALS LIMITED (Table No.7.1.12)
Inventory Turnover Ratio (in time) shows a continuous decrease from 4.08 in 1999-2K
to 2.15 in 2002-03 increase from 4.96 in 2003-04 to 18.82 in 2006-07. Again increase took
place from 11.42 in 2007-08 to 13.25 in 2008-09. It averages at 8.77.
Average Inventory Period (in days) shows a continuous increase from 89.44 in 1999-2K
to 169.70 in 2002-03 decrease from 73.55 in 2003-04 to 19.40 in 2006-07. Again decrease
took place from 31.96 in 2007-08 to 27.56 in 2008-09. It averages at 70.57.
MANAGEMENT OF INVENTORY-TABLE NO.7.1.12NAFL
Year ITR(IN TIME) AIP(IN DAYS)1999-2K 4.08 89.442000-01 3.47 105.262001-02 2.73 133.772002-03 2.15 169.702003-04 4.96 73.552004-05 12.05 30.282005-06 14.73 24.782006-07 18.82 19.402007-08 11.42 31.962008-09 13.25 27.56
Mean 8.77 70.57(Source: Annual Reports 1999-2009)
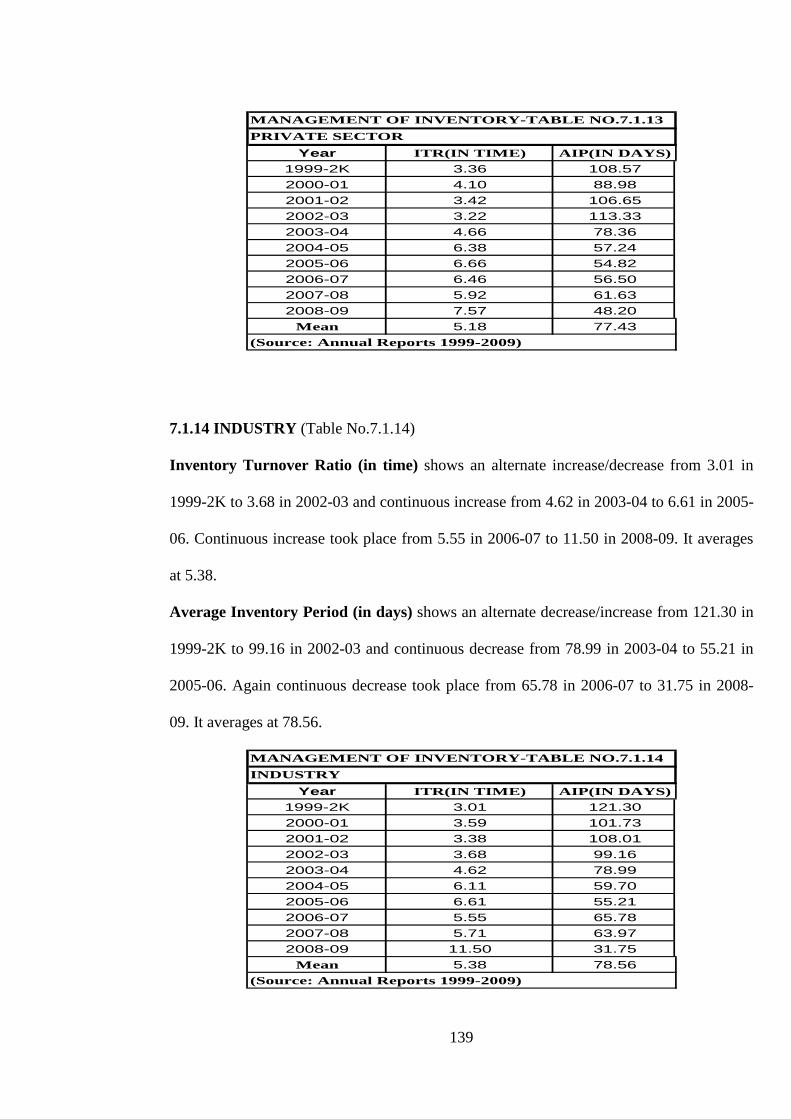
7.1.13 PRIVATE SECTOR (Table No.7.1.13)
Inventory Turnover Ratio (in time) shows an alternate increase/decrease from 3.36 in
1999-2K to 3.42 in 2001-02 continuous increase from 3.22 in 2002-03 to 6.66 in 2005-06.
Alternate decrease/increase took place from 6.46 in 2006-07 to 7.57 in 2008-09. It
averages at 5.18.
Average Inventory Period (in days) shows an alternate decrease/increase from 108.57 in
1999-2K to 106.65 in 2001-02 Continuous decrease from 113.33 in 2002-03 to 54.82 in
2005-06. Alternate increase/decrease took place from 56.50 in 2006-07 to 48.20 in 2008-
09. It averages at 77.43.
139
MANAGEMENT OF INVENTORY-TABLE NO.7.1.13PRIVATE SECTOR
Year ITR(IN TIME) AIP(IN DAYS)1999-2K 3.36 108.572000-01 4.10 88.982001-02 3.42 106.652002-03 3.22 113.332003-04 4.66 78.362004-05 6.38 57.242005-06 6.66 54.822006-07 6.46 56.502007-08 5.92 61.632008-09 7.57 48.20
Mean 5.18 77.43(Source: Annual Reports 1999-2009)
7.1.14 INDUSTRY (Table No.7.1.14)
Inventory Turnover Ratio (in time) shows an alternate increase/decrease from 3.01 in
1999-2K to 3.68 in 2002-03 and continuous increase from 4.62 in 2003-04 to 6.61 in 2005-
06. Continuous increase took place from 5.55 in 2006-07 to 11.50 in 2008-09. It averages
at 5.38.
Average Inventory Period (in days) shows an alternate decrease/increase from 121.30 in
1999-2K to 99.16 in 2002-03 and continuous decrease from 78.99 in 2003-04 to 55.21 in
2005-06. Again continuous decrease took place from 65.78 in 2006-07 to 31.75 in 2008-
09. It averages at 78.56.
MANAGEMENT OF INVENTORY-TABLE NO.7.1.14INDUSTRY
Year ITR(IN TIME) AIP(IN DAYS)1999-2K 3.01 121.302000-01 3.59 101.732001-02 3.38 108.012002-03 3.68 99.162003-04 4.62 78.992004-05 6.11 59.702005-06 6.61 55.212006-07 5.55 65.782007-08 5.71 63.972008-09 11.50 31.75
Mean 5.38 78.56(Source: Annual Reports 1999-2009)

140
Study shows that KRIBHCO, NFL, NAFL and Cooperative Sector have the highest RTR
in Cooperative Sector, Public Sector, Private Sector and Industry respectively. IFFCO,
MFL, GSFC and Public Sector have the highest AIP in Cooperative Sector, Public sector,
Private Sector and Industry respectively.
141
7.2 MANAGEMENT OF RECEIVABLES
A company sells its goods or services on credit to increase its sales which leads to
enhancement of profits. However sales on credit block the precious resource in the form of
receivables. The company therefore requires extra funds to meet short term obligations
relating to its day to day operational requirements. This attracts additional cost in the shape
of interest. Further, when receivables increase, the chances of bad debts also increase as
the receivables move upward. Piling up of receivables is both advantageous as well as
hazardous. Main purpose of receivables management is to keep the receivables at optimal
level so as to have maximum return on resources. Therefore the financial manager of a
company is accountable for the efficient and effective management of receivables.
Accordingly we can say that management of receivables entails taking decision pertaining
to the investment of resources in the portfolio which will give highest return on the
investment of the company.
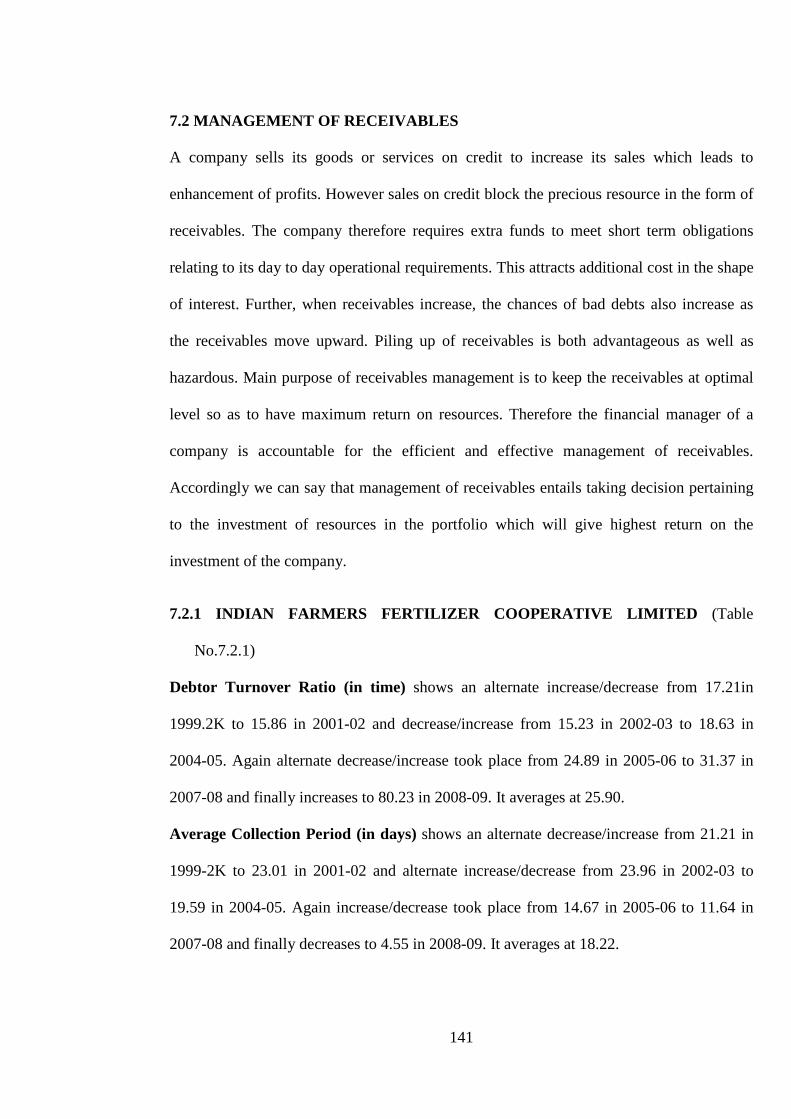
7.2.1 INDIAN FARMERS FERTILIZER COOPERATIVE LIMITED (Table
No.7.2.1)
Debtor Turnover Ratio (in time) shows an alternate increase/decrease from 17.21in
1999.2K to 15.86 in 2001-02 and decrease/increase from 15.23 in 2002-03 to 18.63 in
2004-05. Again alternate decrease/increase took place from 24.89 in 2005-06 to 31.37 in
2007-08 and finally increases to 80.23 in 2008-09. It averages at 25.90.
Average Collection Period (in days) shows an alternate decrease/increase from 21.21 in
1999-2K to 23.01 in 2001-02 and alternate increase/decrease from 23.96 in 2002-03 to
19.59 in 2004-05. Again increase/decrease took place from 14.67 in 2005-06 to 11.64 in
2007-08 and finally decreases to 4.55 in 2008-09. It averages at 18.22.
142
MANAGEMENT OF RECEIVABLES-TABLE NO.7.2.1IFFCO
Year DTR(IN TIME) ACP(IN DAYS)1999-2K 17.21 21.212000-01 18.17 20.092001-02 15.86 23.012002-03 15.23 23.962003-04 12.72 28.692004-05 18.63 19.592005-06 24.89 14.672006-07 24.71 14.772007-08 31.37 11.642008-09 80.23 4.55
Mean 25.90 18.22(Source: Annual Reports 1999-2009
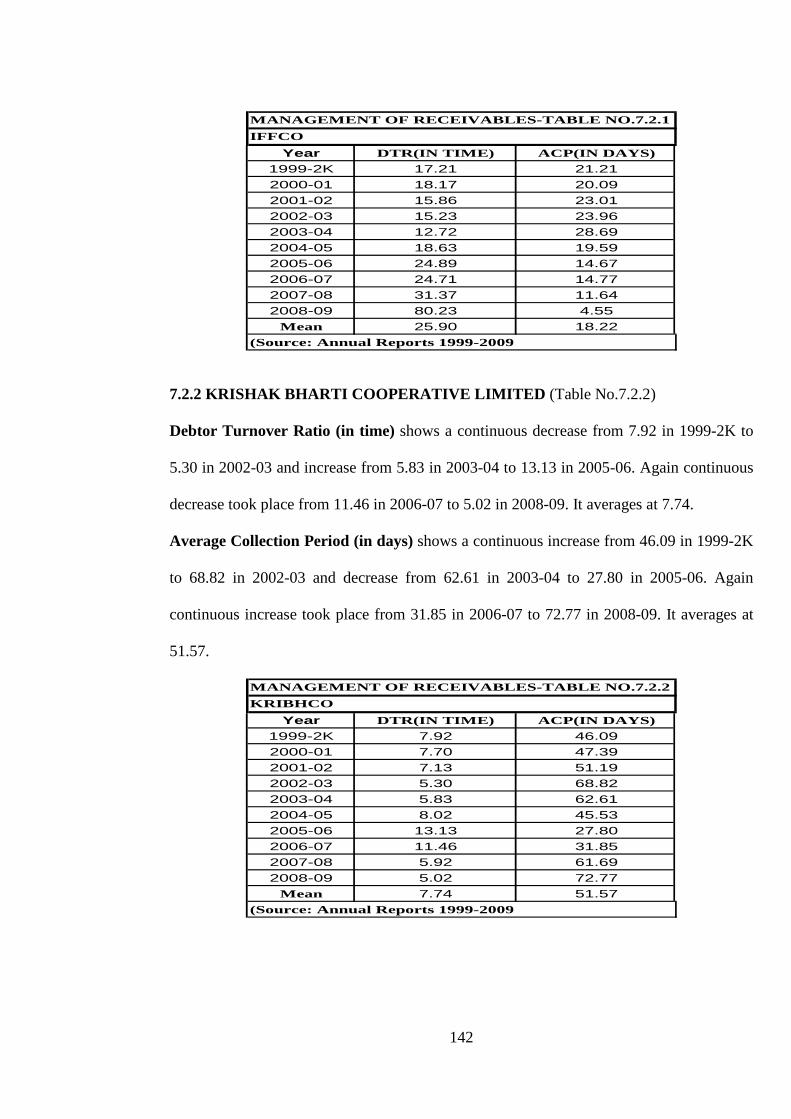
7.2.2 KRISHAK BHARTI COOPERATIVE LIMITED (Table No.7.2.2)
Debtor Turnover Ratio (in time) shows a continuous decrease from 7.92 in 1999-2K to
5.30 in 2002-03 and increase from 5.83 in 2003-04 to 13.13 in 2005-06. Again continuous
decrease took place from 11.46 in 2006-07 to 5.02 in 2008-09. It averages at 7.74.
Average Collection Period (in days) shows a continuous increase from 46.09 in 1999-2K
to 68.82 in 2002-03 and decrease from 62.61 in 2003-04 to 27.80 in 2005-06. Again
continuous increase took place from 31.85 in 2006-07 to 72.77 in 2008-09. It averages at
51.57.
MANAGEMENT OF RECEIVABLES-TABLE NO.7.2.2KRIBHCO
Year DTR(IN TIME) ACP(IN DAYS)1999-2K 7.92 46.092000-01 7.70 47.392001-02 7.13 51.192002-03 5.30 68.822003-04 5.83 62.612004-05 8.02 45.532005-06 13.13 27.802006-07 11.46 31.852007-08 5.92 61.692008-09 5.02 72.77
Mean 7.74 51.57(Source: Annual Reports 1999-2009
143
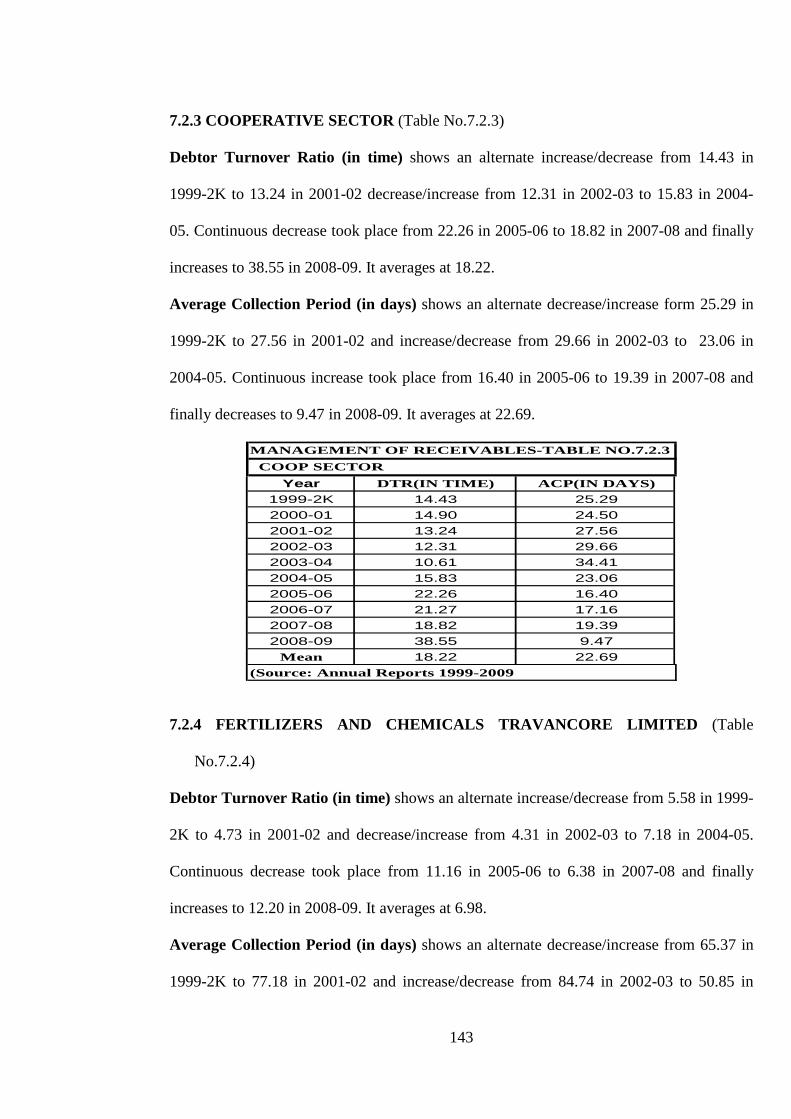
7.2.3 COOPERATIVE SECTOR (Table No.7.2.3)
Debtor Turnover Ratio (in time) shows an alternate increase/decrease from 14.43 in
1999-2K to 13.24 in 2001-02 decrease/increase from 12.31 in 2002-03 to 15.83 in 2004-
05. Continuous decrease took place from 22.26 in 2005-06 to 18.82 in 2007-08 and finally
increases to 38.55 in 2008-09. It averages at 18.22.
Average Collection Period (in days) shows an alternate decrease/increase form 25.29 in
1999-2K to 27.56 in 2001-02 and increase/decrease from 29.66 in 2002-03 to 23.06 in
2004-05. Continuous increase took place from 16.40 in 2005-06 to 19.39 in 2007-08 and
finally decreases to 9.47 in 2008-09. It averages at 22.69.
MANAGEMENT OF RECEIVABLES-TABLE NO.7.2.3 COOP SECTOR
Year DTR(IN TIME) ACP(IN DAYS)1999-2K 14.43 25.292000-01 14.90 24.502001-02 13.24 27.562002-03 12.31 29.662003-04 10.61 34.412004-05 15.83 23.062005-06 22.26 16.402006-07 21.27 17.162007-08 18.82 19.392008-09 38.55 9.47
Mean 18.22 22.69(Source: Annual Reports 1999-2009
7.2.4 FERTILIZERS AND CHEMICALS TRAVANCORE LIMITED (Table
No.7.2.4)
Debtor Turnover Ratio (in time) shows an alternate increase/decrease from 5.58 in 1999-
2K to 4.73 in 2001-02 and decrease/increase from 4.31 in 2002-03 to 7.18 in 2004-05.
Continuous decrease took place from 11.16 in 2005-06 to 6.38 in 2007-08 and finally
increases to 12.20 in 2008-09. It averages at 6.98.
Average Collection Period (in days) shows an alternate decrease/increase from 65.37 in
1999-2K to 77.18 in 2001-02 and increase/decrease from 84.74 in 2002-03 to 50.85 in

144
2004-05. Continuous increase took place from 32.70 in 2005-06 to 57.22 in 2007-08 and
finally decreases to 29.93 in 2008-09. It averages at 60.29.
MANAGEMENT OF RECEIVABLES-TABLE NO.7.2.4FACTYear DTR(IN TIME) ACP(IN DAYS)
1999-2K 5.58 65.372000-01 6.16 59.262001-02 4.73 77.182002-03 4.31 84.742003-04 3.54 103.042004-05 7.18 50.852005-06 11.16 32.702006-07 8.56 42.652007-08 6.38 57.222008-09 12.20 29.93
Mean 6.98 60.29(Source: Annual Reports 1999-2009
7.2.5 MADRAS FERTILIZERS LIMITED (Table No.7.2.5)
Debtor Turnover Ratio (in time) shows a decrease from 21.44 in 1999-2K to 8.89 in
2001-02 and increase from 12.51 in 2002-03 to 466.22 in 2008-09. It averages at 134.32.
Average Collection Period (in days) shows a continuous increase from 17.03 in 1999-2K
to 41.05 in 2001-02 and decrease from 29.17 in 2002-03 to 0.78 in 2008-09. It averages at
15.91.
MANAGEMENT OF RECEIVABLES-TABLE NO.7.2.5MFLYear DTR(IN TIME) ACP(IN DAYS)
1999-2K 21.44 17.032000-01 15.18 24.042001-02 8.89 41.052002-03 12.51 29.172003-04 13.04 28.002004-05 27.04 13.502005-06 111.15 3.282006-07 268.44 1.362007-08 399.32 0.912008-09 466.22 0.78
Mean 134.32 15.91(Source: Annual Reports 1999-2009

145
7.2.6 NATIONAL FERTILIZERS LIMITED (Table No.7.2.6)
Debtor Turnover Ratio (in time) shows a continuous decrease from 6.17 in 1999-2K to
5.04 in the year of 2003-04 and from 7.40 in 2004-05 to 3.78 in 2006-07. Increase took
place from 4.18 in 2007-08 to 6.01 in 2008-09. It averages at 5.46.
Average Collection Period (in days) shows a continuous from 59.12 in 1999-2K to 72.42
in 2003-04 and increase from 49.34 in 2004-05 to 96.45 in 2006-07. Decrease took place
from 87.38 in 2007-08 to 60.77 in 2008-09. It averages at 69.22.
MANAGEMENT OF RECEIVABLES-TABLE NO.7.2.6NFLYear DTR(IN TIME) ACP(IN DAYS)
1999-2K 6.17 59.122000-01 6.00 60.872001-02 5.28 69.092002-03 5.11 71.462003-04 5.04 72.422004-05 7.40 49.342005-06 5.59 65.352006-07 3.78 96.452007-08 4.18 87.382008-09 6.01 60.77
Mean 5.46 69.22(Source: Annual Reports 1999-2009
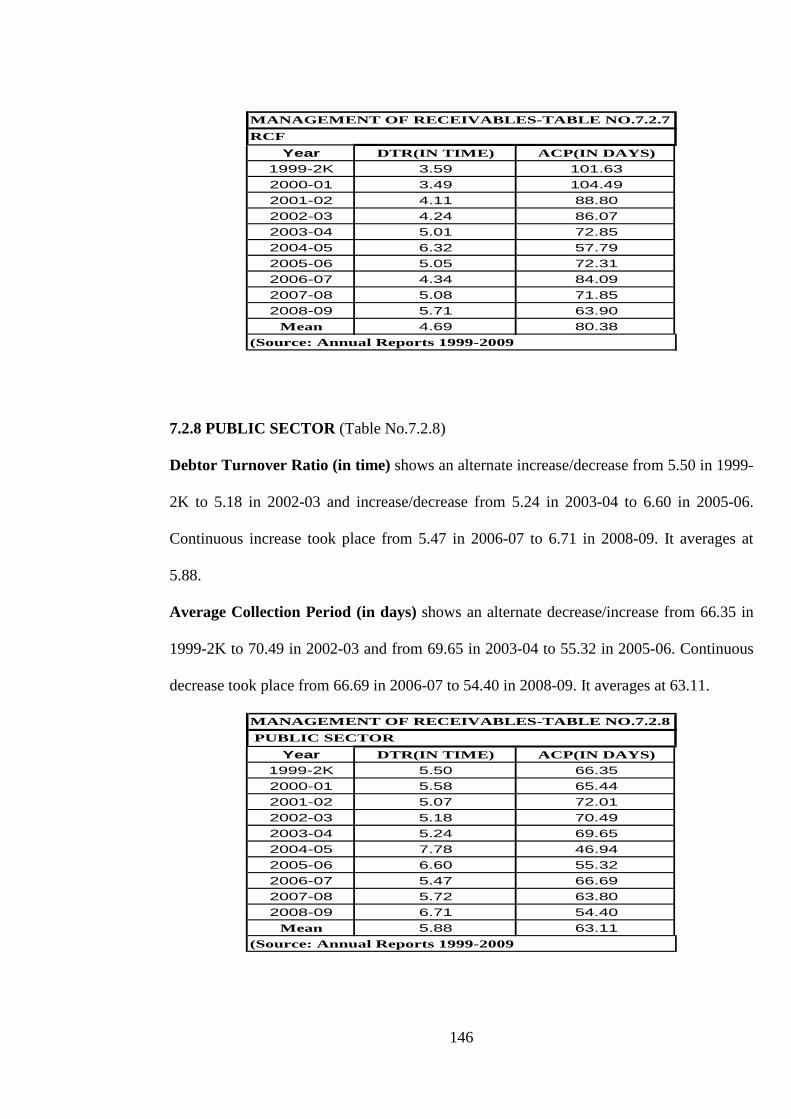
7.2.7 RASHTRIYA CHEMICALS & FERTILISERS LIMITED (Table No.7.2.7)
Debtor Turnover Ratio (in time) shows an alternate decrease/increase from 3.59 in 1999-
2K to 4.11 in 2001-02 and continuous increase from 4.24 in 2002-03 to 6.32 in 2004-05.
Alternate decrease/increase took place from 5.05 in 2005-06 to 5.08 in 2007-08 and finally
increases to 5.71 in 2008-09. It averages at 4.69.
Average Collection Period (in days) shows an alternate increase/decrease from 101.63 in
1999-2K to 88.80 in 2001-02 and continuous decrease from 86.07 in 2002-03 to 57.79 in
2004-05. Alternate increase/decrease took place from 72.31 in 2005-06 to 71.85 in 2007-
08 and finally decreases to 63.90 in 2008-09. It averages at 80.38.
146
MANAGEMENT OF RECEIVABLES-TABLE NO.7.2.7RCF
Year DTR(IN TIME) ACP(IN DAYS)1999-2K 3.59 101.632000-01 3.49 104.492001-02 4.11 88.802002-03 4.24 86.072003-04 5.01 72.852004-05 6.32 57.792005-06 5.05 72.312006-07 4.34 84.092007-08 5.08 71.852008-09 5.71 63.90
Mean 4.69 80.38(Source: Annual Reports 1999-2009
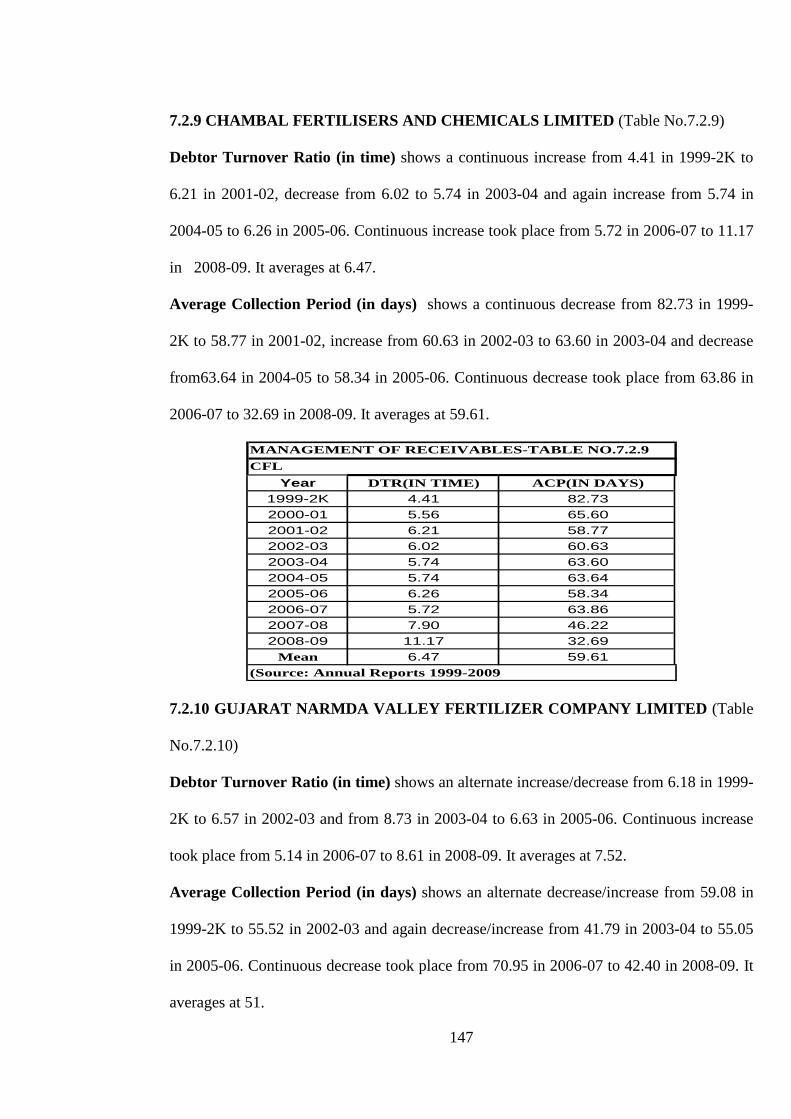
7.2.8 PUBLIC SECTOR (Table No.7.2.8)
Debtor Turnover Ratio (in time) shows an alternate increase/decrease from 5.50 in 1999-
2K to 5.18 in 2002-03 and increase/decrease from 5.24 in 2003-04 to 6.60 in 2005-06.
Continuous increase took place from 5.47 in 2006-07 to 6.71 in 2008-09. It averages at
5.88.
Average Collection Period (in days) shows an alternate decrease/increase from 66.35 in
1999-2K to 70.49 in 2002-03 and from 69.65 in 2003-04 to 55.32 in 2005-06. Continuous
decrease took place from 66.69 in 2006-07 to 54.40 in 2008-09. It averages at 63.11.
MANAGEMENT OF RECEIVABLES-TABLE NO.7.2.8 PUBLIC SECTOR
Year DTR(IN TIME) ACP(IN DAYS)1999-2K 5.50 66.352000-01 5.58 65.442001-02 5.07 72.012002-03 5.18 70.492003-04 5.24 69.652004-05 7.78 46.942005-06 6.60 55.322006-07 5.47 66.692007-08 5.72 63.802008-09 6.71 54.40
Mean 5.88 63.11(Source: Annual Reports 1999-2009
147
7.2.9 CHAMBAL FERTILISERS AND CHEMICALS LIMITED (Table No.7.2.9)
Debtor Turnover Ratio (in time) shows a continuous increase from 4.41 in 1999-2K to
6.21 in 2001-02, decrease from 6.02 to 5.74 in 2003-04 and again increase from 5.74 in
2004-05 to 6.26 in 2005-06. Continuous increase took place from 5.72 in 2006-07 to 11.17
in 2008-09. It averages at 6.47.
Average Collection Period (in days) shows a continuous decrease from 82.73 in 1999-
2K to 58.77 in 2001-02, increase from 60.63 in 2002-03 to 63.60 in 2003-04 and decrease
from63.64 in 2004-05 to 58.34 in 2005-06. Continuous decrease took place from 63.86 in
2006-07 to 32.69 in 2008-09. It averages at 59.61.
MANAGEMENT OF RECEIVABLES-TABLE NO.7.2.9CFL
Year DTR(IN TIME) ACP(IN DAYS)1999-2K 4.41 82.732000-01 5.56 65.602001-02 6.21 58.772002-03 6.02 60.632003-04 5.74 63.602004-05 5.74 63.642005-06 6.26 58.342006-07 5.72 63.862007-08 7.90 46.222008-09 11.17 32.69
Mean 6.47 59.61(Source: Annual Reports 1999-2009
7.2.10 GUJARAT NARMDA VALLEY FERTILIZER COMPANY LIMITED (Table
No.7.2.10)
Debtor Turnover Ratio (in time) shows an alternate increase/decrease from 6.18 in 1999-
2K to 6.57 in 2002-03 and from 8.73 in 2003-04 to 6.63 in 2005-06. Continuous increase
took place from 5.14 in 2006-07 to 8.61 in 2008-09. It averages at 7.52.
Average Collection Period (in days) shows an alternate decrease/increase from 59.08 in
1999-2K to 55.52 in 2002-03 and again decrease/increase from 41.79 in 2003-04 to 55.05
in 2005-06. Continuous decrease took place from 70.95 in 2006-07 to 42.40 in 2008-09. It
averages at 51.

148
MANAGEMENT OF RECEIVABLES-TABLE NO.7.2.10GNVFC
Year DTR(IN TIME) ACP(IN DAYS)1999-2K 6.18 59.082000-01 10.61 34.402001-02 5.97 61.152002-03 6.57 55.522003-04 8.73 41.792004-05 9.86 37.012005-06 6.63 55.052006-07 5.14 70.952007-08 6.90 52.882008-09 8.61 42.40
Mean 7.52 51.02(Source: Annual Reports 1999-2009
7.2.11 GUJARAT STATE FERTILIZER COMPANY LIMITED (Table No.7.2.11)
Debtor Turnover Ratio (in time) shows an alternate increase/decrease from 3.30 in 1999-
2K to 3.56 in 2001-02 and continuous increase from 2.57 in 2002-03 to 5.55 in 2004-05.
Alternate decrease/increase took place from 4.40 in 2005-06 to 5.32 in 2007-08 and finally
increases to 11.31 2008-09. It averages at 4.68.
Average Collection Period (in days) shows an alternate decrease/increase from 110.74 in
1999-2K to 102.55 in 2001-02 and continuous decrease from 142.16 in 2002-03 to 65.76 in
2004-05. Alternate increase/decrease took place from 82.89 in 2005-06 to 68.64 in 2007-
08 and finally decreases to 32.27 in 2008-09. It averages at 91.19.
MANAGEMENT OF RECEIVABLES-TABLE NO.7.2.11GSFC
Year DTR(IN TIME) ACP(IN DAYS)1999-2K 3.30 110.742000-01 3.59 101.552001-02 3.56 102.552002-03 2.57 142.162003-04 3.13 116.482004-05 5.55 65.762005-06 4.40 82.892006-07 4.11 88.882007-08 5.32 68.642008-09 11.31 32.27
Mean 4.68 91.19(Source: Annual Reports 1999-2009
149
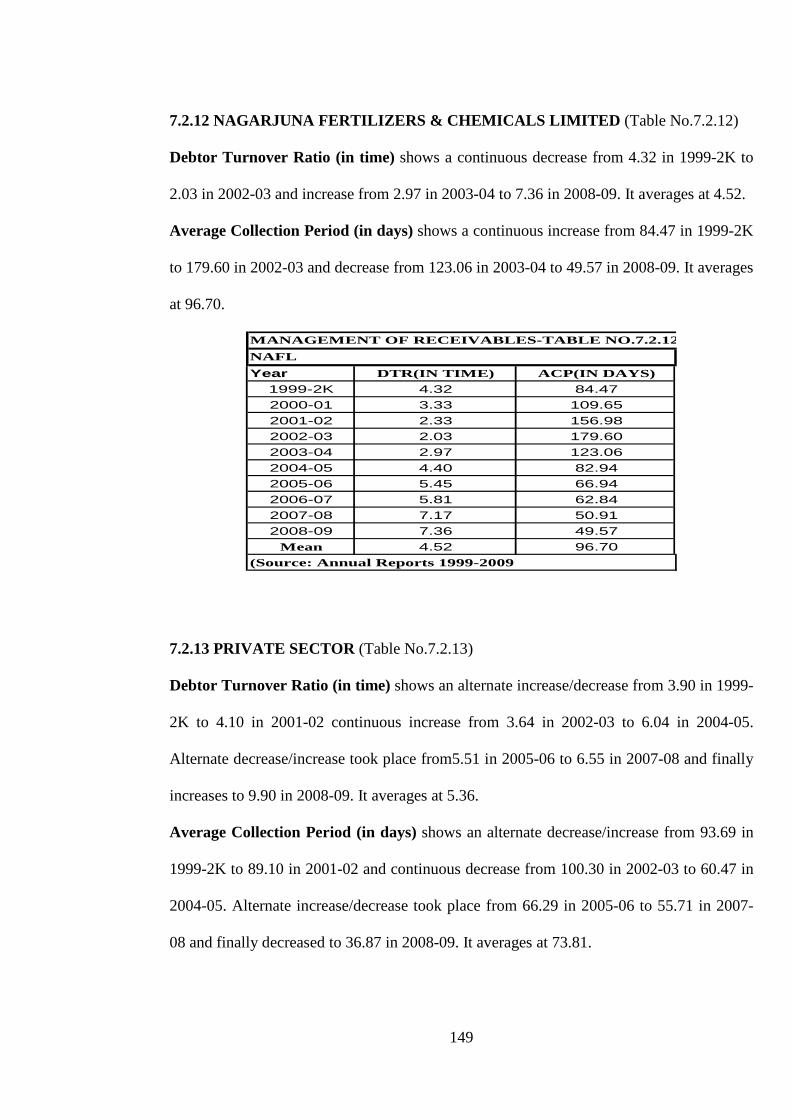
7.2.12 NAGARJUNA FERTILIZERS & CHEMICALS LIMITED (Table No.7.2.12)
Debtor Turnover Ratio (in time) shows a continuous decrease from 4.32 in 1999-2K to
2.03 in 2002-03 and increase from 2.97 in 2003-04 to 7.36 in 2008-09. It averages at 4.52.
Average Collection Period (in days) shows a continuous increase from 84.47 in 1999-2K
to 179.60 in 2002-03 and decrease from 123.06 in 2003-04 to 49.57 in 2008-09. It averages
at 96.70.
MANAGEMENT OF RECEIVABLES-TABLE NO.7.2.12NAFLYear DTR(IN TIME) ACP(IN DAYS)
1999-2K 4.32 84.472000-01 3.33 109.652001-02 2.33 156.982002-03 2.03 179.602003-04 2.97 123.062004-05 4.40 82.942005-06 5.45 66.942006-07 5.81 62.842007-08 7.17 50.912008-09 7.36 49.57
Mean 4.52 96.70(Source: Annual Reports 1999-2009
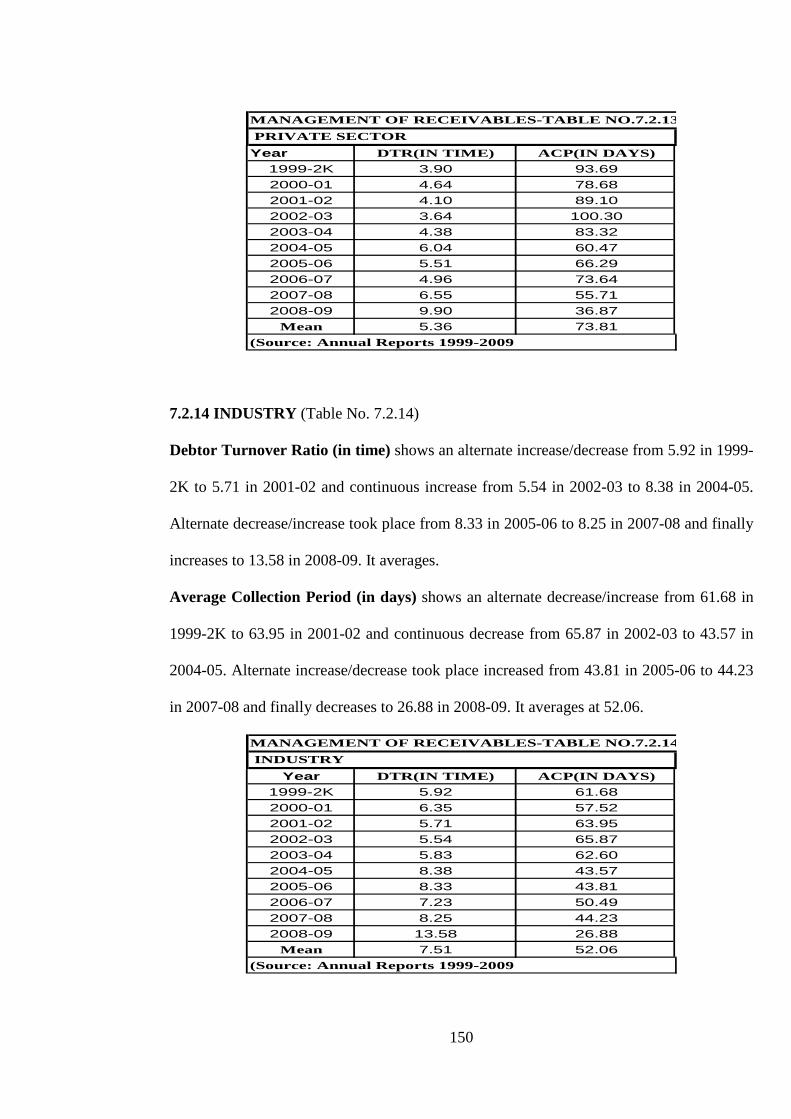
7.2.13 PRIVATE SECTOR (Table No.7.2.13)
Debtor Turnover Ratio (in time) shows an alternate increase/decrease from 3.90 in 1999-
2K to 4.10 in 2001-02 continuous increase from 3.64 in 2002-03 to 6.04 in 2004-05.
Alternate decrease/increase took place from5.51 in 2005-06 to 6.55 in 2007-08 and finally
increases to 9.90 in 2008-09. It averages at 5.36.
Average Collection Period (in days) shows an alternate decrease/increase from 93.69 in
1999-2K to 89.10 in 2001-02 and continuous decrease from 100.30 in 2002-03 to 60.47 in
2004-05. Alternate increase/decrease took place from 66.29 in 2005-06 to 55.71 in 2007-
08 and finally decreased to 36.87 in 2008-09. It averages at 73.81.
150
MANAGEMENT OF RECEIVABLES-TABLE NO.7.2.13 PRIVATE SECTORYear DTR(IN TIME) ACP(IN DAYS)
1999-2K 3.90 93.692000-01 4.64 78.682001-02 4.10 89.102002-03 3.64 100.302003-04 4.38 83.322004-05 6.04 60.472005-06 5.51 66.292006-07 4.96 73.642007-08 6.55 55.712008-09 9.90 36.87
Mean 5.36 73.81(Source: Annual Reports 1999-2009
7.2.14 INDUSTRY (Table No. 7.2.14)
Debtor Turnover Ratio (in time) shows an alternate increase/decrease from 5.92 in 1999-
2K to 5.71 in 2001-02 and continuous increase from 5.54 in 2002-03 to 8.38 in 2004-05.
Alternate decrease/increase took place from 8.33 in 2005-06 to 8.25 in 2007-08 and finally
increases to 13.58 in 2008-09. It averages.
Average Collection Period (in days) shows an alternate decrease/increase from 61.68 in
1999-2K to 63.95 in 2001-02 and continuous decrease from 65.87 in 2002-03 to 43.57 in
2004-05. Alternate increase/decrease took place increased from 43.81 in 2005-06 to 44.23
in 2007-08 and finally decreases to 26.88 in 2008-09. It averages at 52.06.
MANAGEMENT OF RECEIVABLES-TABLE NO.7.2.14 INDUSTRY
Year DTR(IN TIME) ACP(IN DAYS)1999-2K 5.92 61.682000-01 6.35 57.522001-02 5.71 63.952002-03 5.54 65.872003-04 5.83 62.602004-05 8.38 43.572005-06 8.33 43.812006-07 7.23 50.492007-08 8.25 44.232008-09 13.58 26.88
Mean 7.51 52.06(Source: Annual Reports 1999-2009

151
The study shows that IFFCO, MFL, GNVFC and Cooperative Sector have the highest RTR
in Cooperative Sector, Public Sector, Private Sector and Industry, respectively. KRIBHCO,
RCF, NAFL and Private Sector have the highest ACP in Cooperative Sector, Public
Sector, Private Sector and Industry, respectively.
152
7.3 MANAGEMENT OF CASH
Cash in an organization may be compared to the blood in human body. Just as blood gives
existence and vigor to the individual body, cash in the similar manner, gives existence,
power, earnings, liquidity and solvency to the organization. Stable and vigorous flow of
cash right through the whole trade process is the foundation of solvency. Cash is the major
liquid asset that an organization owns. As cash is the means of exchange it is the most
significant part of working capital. It is both the fundamental input which makes it
obligatory to carry on the company running on an uninterrupted basis and the eventual
production likely to be realized by selling goods and services. Therefore cash management
is quickly emerging as an important aspect of sound financial management of any
company. Cash management involves the efficient collection, disbursements and
temporary investment of cash. Although most firms establish a target level of cash
balances to maintain, they do not like to keep excess cash balance as interest can be earned
if these funds are invested in marketable securities. Thus the main objective of cash
management is the optimization of liquidity through an improved flow of funds.
7.3.1 INDIAN FARMERS FERTILIZER COOPERATIVE LIMITED (Table
No.7.3.1)
Cash Turnover Ratio (in time) shows a continuous increase from 4.92 in 1999-2K to
8.63 in 2001-02 and alternate decrease/increase from 6.75 in 2002-03 7.07 in 2004-05.
Continuous decrease took place from 9.16 in 2005-06 to 4.78 in 2007-08 and finally
increases to 20.34 in 2008-09. It averages at 7.81.
Average Age of Cash (in days) shows a continuous decrease from 74.19 in 1999-2K to
42.30 in 2001-02 and alternate increase/decrease from 54.06 in 2002-03 to 51.62 in 2004-
05. Continuous increase took place from 39.85 in 2005-06 to 76.40 in 2007-08 and finally
153
decreases to 17.94 in 2008-09. It averages at 55.56.
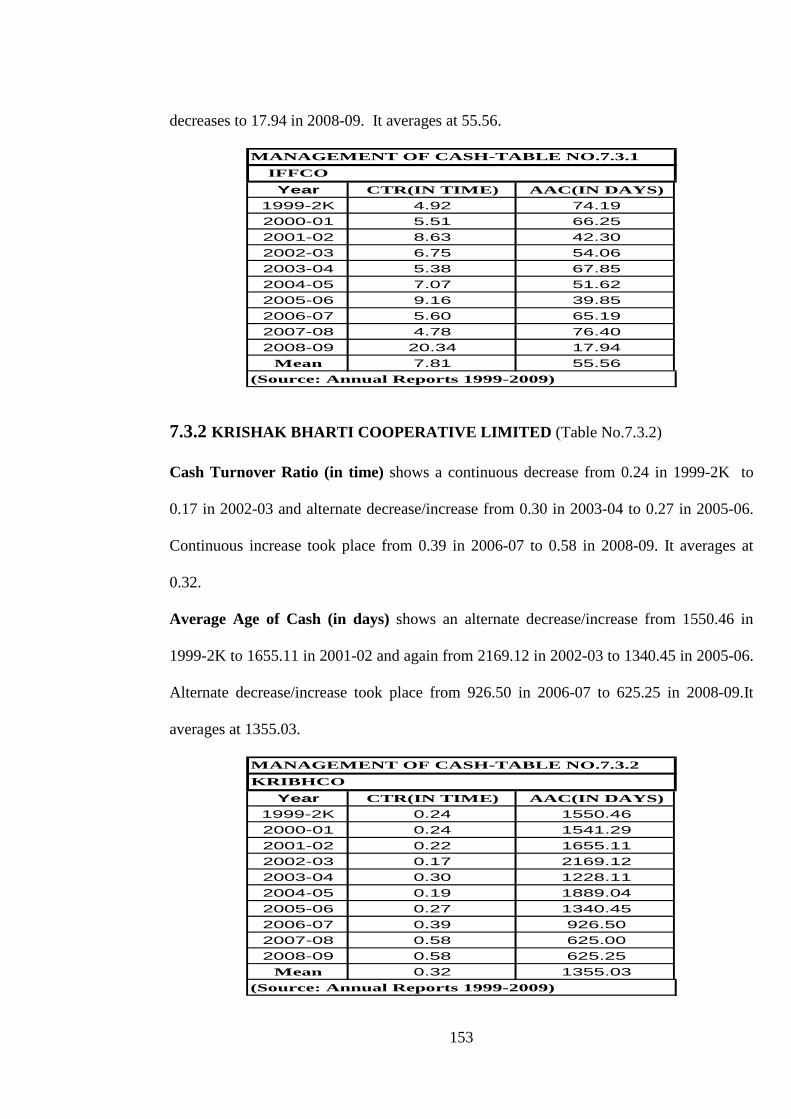
MANAGEMENT OF CASH-TABLE NO.7.3.1IFFCOYear CTR(IN TIME) AAC(IN DAYS)
1999-2K 4.92 74.192000-01 5.51 66.252001-02 8.63 42.302002-03 6.75 54.062003-04 5.38 67.852004-05 7.07 51.622005-06 9.16 39.852006-07 5.60 65.192007-08 4.78 76.402008-09 20.34 17.94
Mean 7.81 55.56(Source: Annual Reports 1999-2009)
7.3.2 KRISHAK BHARTI COOPERATIVE LIMITED (Table No.7.3.2)
Cash Turnover Ratio (in time) shows a continuous decrease from 0.24 in 1999-2K to
0.17 in 2002-03 and alternate decrease/increase from 0.30 in 2003-04 to 0.27 in 2005-06.
Continuous increase took place from 0.39 in 2006-07 to 0.58 in 2008-09. It averages at
0.32.
Average Age of Cash (in days) shows an alternate decrease/increase from 1550.46 in
1999-2K to 1655.11 in 2001-02 and again from 2169.12 in 2002-03 to 1340.45 in 2005-06.
Alternate decrease/increase took place from 926.50 in 2006-07 to 625.25 in 2008-09.It
averages at 1355.03.
MANAGEMENT OF CASH-TABLE NO.7.3.2KRIBHCO
Year CTR(IN TIME) AAC(IN DAYS)1999-2K 0.24 1550.462000-01 0.24 1541.292001-02 0.22 1655.112002-03 0.17 2169.122003-04 0.30 1228.112004-05 0.19 1889.042005-06 0.27 1340.452006-07 0.39 926.502007-08 0.58 625.002008-09 0.58 625.25
Mean 0.32 1355.03(Source: Annual Reports 1999-2009)

154
7.3.3 COOPERATIVE SECTOR (Table No.7.3.3)
Cash Turnover Ratio (in time) shows a continuous increase from 0.68 in 1999-2K to
3.60 in 2008-09. It averages at 1.30.
Average Age of Cash (in days) shows a continuous decrease from 539.83 in 1999-2K to
101.50 in 2008-09. It averages at 355.02.
MANAGEMENT OF CASH-TABLE NO.7.3.3COOP SECTOR
Year CTR(IN TIME) AAC(IN DAYS)1999-2K 0.68 539.832000-01 0.71 511.552001-02 0.80 454.622002-03 0.87 419.812003-04 0.93 392.062004-05 0.96 379.092005-06 1.34 272.902006-07 1.42 256.222007-08 1.64 222.652008-09 3.60 101.50
Mean 1.30 355.02(Source: Annual Reports 1999-2009)
7.3.4 FERTILIZERS AND CHEMICALS TRAVANCORE LIMITED (Table
No.7.3.4)
Cash Turnover Ratio (in time) shows a continuous increase from 2.27 in 1999-2K to
17.01 in 2003-04 and alternate increase/decrease from12.09 in 2004-05 to 6.90 in 2006-07.
Increase took place from 3.68 in 2007-08 to 7.43 in 2008-09. It averages at 8.10. Average
Age of Cash (in days) shows a continuous decrease from 161.11 in 1999-2K to 21.46 in
2003-04 alternate decrease/increase from 30.19 in 2004-05 to 52.87 in 2006-07. Decrease
took place from 99.14 in 2007-08 to 49.14 in 2008-09. It averages at 68.66.
155
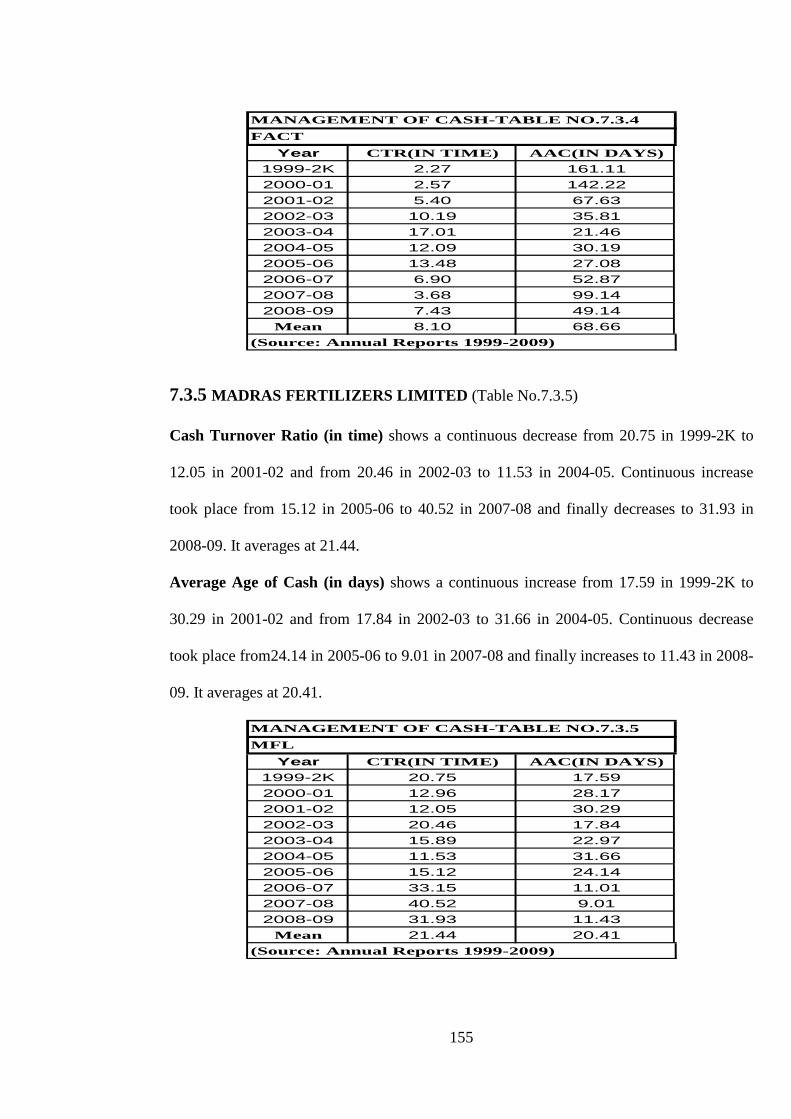
MANAGEMENT OF CASH-TABLE NO.7.3.4FACT
Year CTR(IN TIME) AAC(IN DAYS)1999-2K 2.27 161.112000-01 2.57 142.222001-02 5.40 67.632002-03 10.19 35.812003-04 17.01 21.462004-05 12.09 30.192005-06 13.48 27.082006-07 6.90 52.872007-08 3.68 99.142008-09 7.43 49.14
Mean 8.10 68.66(Source: Annual Reports 1999-2009)
7.3.5 MADRAS FERTILIZERS LIMITED (Table No.7.3.5)
Cash Turnover Ratio (in time) shows a continuous decrease from 20.75 in 1999-2K to
12.05 in 2001-02 and from 20.46 in 2002-03 to 11.53 in 2004-05. Continuous increase
took place from 15.12 in 2005-06 to 40.52 in 2007-08 and finally decreases to 31.93 in
2008-09. It averages at 21.44.
Average Age of Cash (in days) shows a continuous increase from 17.59 in 1999-2K to
30.29 in 2001-02 and from 17.84 in 2002-03 to 31.66 in 2004-05. Continuous decrease
took place from24.14 in 2005-06 to 9.01 in 2007-08 and finally increases to 11.43 in 2008-
09. It averages at 20.41.
MANAGEMENT OF CASH-TABLE NO.7.3.5MFL
Year CTR(IN TIME) AAC(IN DAYS)1999-2K 20.75 17.592000-01 12.96 28.172001-02 12.05 30.292002-03 20.46 17.842003-04 15.89 22.972004-05 11.53 31.662005-06 15.12 24.142006-07 33.15 11.012007-08 40.52 9.012008-09 31.93 11.43
Mean 21.44 20.41(Source: Annual Reports 1999-2009)

156
7.3.6 NATIONAL FERTILIZERS LIMITED (Table No.7.3.6)
Cash Turnover Ratio (in time) shows an alternate decrease/increase from 19.99 in 1999-
2K to 20.41 in 2001-02 and again from 33.69 in 2002-03 to 3.64 in 2004-05. Alternate
increase/decrease took place from 7.61 in 2005-06 to 9.43 in 2007-08 and finally decreases
to 6.41 in 2008-09. It averages at 17.88.
Average Age of Cash (in days) shows an alternate increase/decrease from 18.26 in 1999-
2K to 17.88 in 2001-02 and from 10.84 in 2002-03 to 100.24 in 2004-05. Alternate
decrease/increase took place from 47.98 in 2005-06 to 38.71 in 2007-08 and finally
increases to 56.90 in 2008-09. It averages at 42.15.
MANAGEMENT OF CASH-TABLE NO.7.3.6NFL
Year CTR(IN TIME) AAC(IN DAYS)1999-2K 19.99 18.262000-01 19.29 18.922001-02 20.41 17.882002-03 33.69 10.842003-04 3.47 105.102004-05 3.64 100.242005-06 7.61 47.982006-07 54.87 6.652007-08 9.43 38.712008-09 6.41 56.90
Mean 17.88 42.15(Source: Annual Reports 1999-2009)
7.3.7 RASHTRIYA CHEMICALS & FERTILISERS LIMITED (Table No.7.3.7)
Cash Turnover Ratio (in time) shows an alternate increase/decrease from 18.28 in
1999.2K to 5.82 in 2001-02 and again from 4.46 in 2002-03 to 6.21 in 2007-08. Finally
increase took place to 9.02 in 2008-09. It averages at 10.38.
Average Age of Cash (in days) shows an alternate decrease/increase from 19.97 in
1999.2K to 62.68 in 2001-02 and again from 81.81 in 2002-03 to 58.79 in 2007-08 and
finally decreases to 40.48 in 2008-09. It average at 45.99.

157
MANAGEMENT OF CASH-TABLE NO.7.3.7RCF
Year CTR(IN TIME) AAC(IN DAYS)1999-2K 18.28 19.972000-01 19.50 18.722001-02 5.82 62.682002-03 4.46 81.812003-04 13.69 26.662004-05 11.28 32.362005-06 11.33 32.222006-07 4.23 86.282007-08 6.21 58.792008-09 9.02 40.48
Mean 10.38 45.99(Source: Annual Reports 1999-2009)
7.3.8 PUBLIC SECTOR (Table No.7.3.8)
Cash Turnover Ratio (in time) shows a continuous increase from 9.03 in 1999-2K to
13.16 in 2002-03 and alternate decrease/increase from 8.39 in 2003-04 to 10.80 in 2005-
06. Continuous decrease took place from 13.98 in 2006-07 to 8.59 in 2008-09. It averages
at 9.98.
Average Age of Cash (in days) shows a continuous decrease from 40.41 in 1999-2K to
27.73 in 2002-03 and alternate increase/decrease from 43.53 in 2003-04 to 33.79 in 2005-
06. Continuous increase took place from 26.10 in 2006-07 to 42.47 in 2008-09. It averages
at 38.15.
MANAGEMENT OF CASH-TABLE NO.7.3.8PUBLIC SECTOR
Year CTR(IN TIME) AAC(IN DAYS)1999-2K 9.03 40.412000-01 9.43 38.692001-02 9.54 38.262002-03 13.16 27.732003-04 8.39 43.532004-05 6.68 54.632005-06 10.80 33.792006-07 13.98 26.102007-08 10.17 35.882008-09 8.59 42.47
Mean 9.98 38.15(Source: Annual Reports 1999-2009)
158
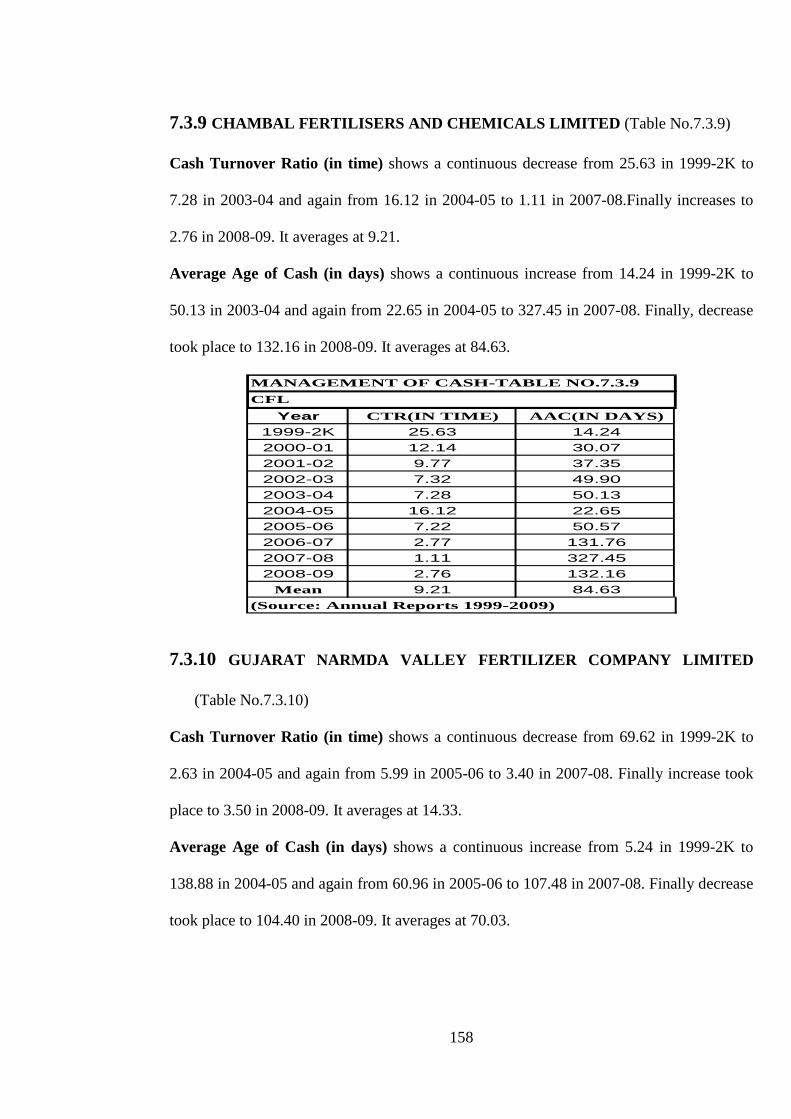
7.3.9 CHAMBAL FERTILISERS AND CHEMICALS LIMITED (Table No.7.3.9)
Cash Turnover Ratio (in time) shows a continuous decrease from 25.63 in 1999-2K to
7.28 in 2003-04 and again from 16.12 in 2004-05 to 1.11 in 2007-08.Finally increases to
2.76 in 2008-09. It averages at 9.21.
Average Age of Cash (in days) shows a continuous increase from 14.24 in 1999-2K to
50.13 in 2003-04 and again from 22.65 in 2004-05 to 327.45 in 2007-08. Finally, decrease
took place to 132.16 in 2008-09. It averages at 84.63.
MANAGEMENT OF CASH-TABLE NO.7.3.9CFL
Year CTR(IN TIME) AAC(IN DAYS)1999-2K 25.63 14.242000-01 12.14 30.072001-02 9.77 37.352002-03 7.32 49.902003-04 7.28 50.132004-05 16.12 22.652005-06 7.22 50.572006-07 2.77 131.762007-08 1.11 327.452008-09 2.76 132.16
Mean 9.21 84.63(Source: Annual Reports 1999-2009)
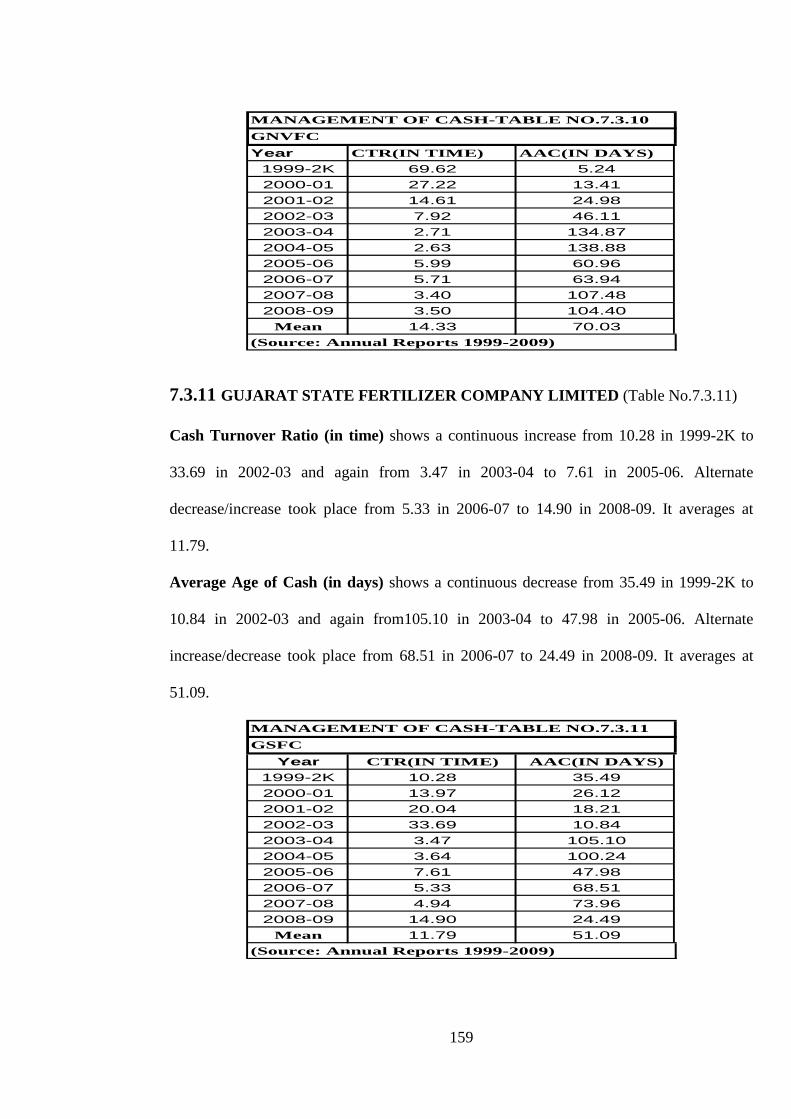
7.3.10 GUJARAT NARMDA VALLEY FERTILIZER COMPANY LIMITED
(Table No.7.3.10)
Cash Turnover Ratio (in time) shows a continuous decrease from 69.62 in 1999-2K to
2.63 in 2004-05 and again from 5.99 in 2005-06 to 3.40 in 2007-08. Finally increase took
place to 3.50 in 2008-09. It averages at 14.33.
Average Age of Cash (in days) shows a continuous increase from 5.24 in 1999-2K to
138.88 in 2004-05 and again from 60.96 in 2005-06 to 107.48 in 2007-08. Finally decrease
took place to 104.40 in 2008-09. It averages at 70.03.
159
MANAGEMENT OF CASH-TABLE NO.7.3.10GNVFCYear CTR(IN TIME) AAC(IN DAYS)1999-2K 69.62 5.242000-01 27.22 13.412001-02 14.61 24.982002-03 7.92 46.112003-04 2.71 134.872004-05 2.63 138.882005-06 5.99 60.962006-07 5.71 63.942007-08 3.40 107.482008-09 3.50 104.40
Mean 14.33 70.03(Source: Annual Reports 1999-2009)
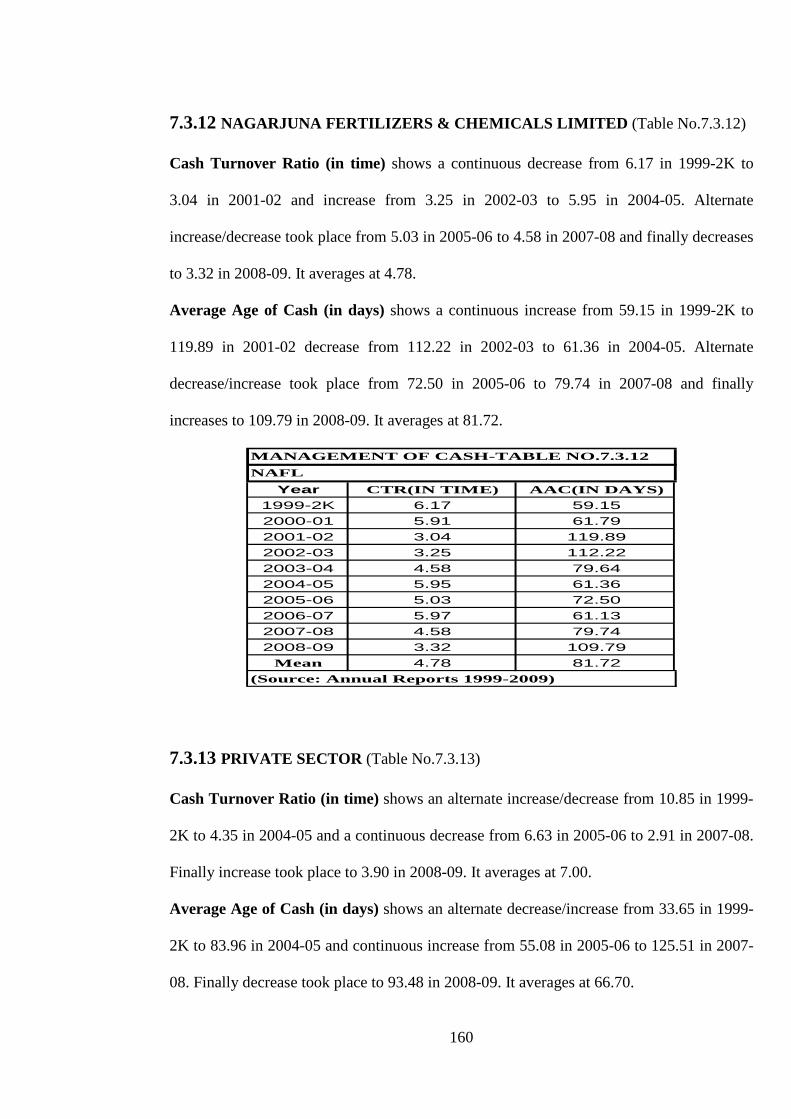
7.3.11 GUJARAT STATE FERTILIZER COMPANY LIMITED (Table No.7.3.11)
Cash Turnover Ratio (in time) shows a continuous increase from 10.28 in 1999-2K to
33.69 in 2002-03 and again from 3.47 in 2003-04 to 7.61 in 2005-06. Alternate
decrease/increase took place from 5.33 in 2006-07 to 14.90 in 2008-09. It averages at
11.79.
Average Age of Cash (in days) shows a continuous decrease from 35.49 in 1999-2K to
10.84 in 2002-03 and again from105.10 in 2003-04 to 47.98 in 2005-06. Alternate
increase/decrease took place from 68.51 in 2006-07 to 24.49 in 2008-09. It averages at
51.09.
MANAGEMENT OF CASH-TABLE NO.7.3.11GSFC
Year CTR(IN TIME) AAC(IN DAYS)1999-2K 10.28 35.492000-01 13.97 26.122001-02 20.04 18.212002-03 33.69 10.842003-04 3.47 105.102004-05 3.64 100.242005-06 7.61 47.982006-07 5.33 68.512007-08 4.94 73.962008-09 14.90 24.49
Mean 11.79 51.09(Source: Annual Reports 1999-2009)
160
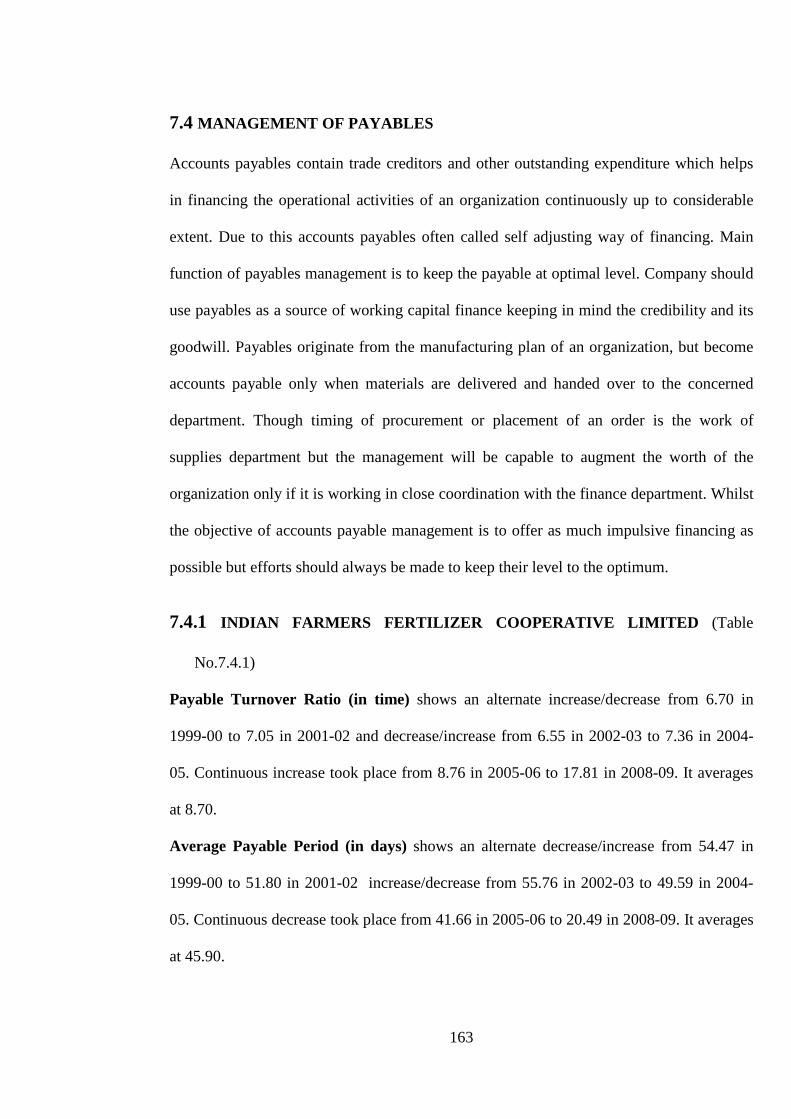
7.3.12 NAGARJUNA FERTILIZERS & CHEMICALS LIMITED (Table No.7.3.12)
Cash Turnover Ratio (in time) shows a continuous decrease from 6.17 in 1999-2K to
3.04 in 2001-02 and increase from 3.25 in 2002-03 to 5.95 in 2004-05. Alternate
increase/decrease took place from 5.03 in 2005-06 to 4.58 in 2007-08 and finally decreases
to 3.32 in 2008-09. It averages at 4.78.
Average Age of Cash (in days) shows a continuous increase from 59.15 in 1999-2K to
119.89 in 2001-02 decrease from 112.22 in 2002-03 to 61.36 in 2004-05. Alternate
decrease/increase took place from 72.50 in 2005-06 to 79.74 in 2007-08 and finally
increases to 109.79 in 2008-09. It averages at 81.72.
MANAGEMENT OF CASH-TABLE NO.7.3.12NAFL
Year CTR(IN TIME) AAC(IN DAYS)1999-2K 6.17 59.152000-01 5.91 61.792001-02 3.04 119.892002-03 3.25 112.222003-04 4.58 79.642004-05 5.95 61.362005-06 5.03 72.502006-07 5.97 61.132007-08 4.58 79.742008-09 3.32 109.79
Mean 4.78 81.72(Source: Annual Reports 1999-2009)
7.3.13 PRIVATE SECTOR (Table No.7.3.13)
Cash Turnover Ratio (in time) shows an alternate increase/decrease from 10.85 in 1999-
2K to 4.35 in 2004-05 and a continuous decrease from 6.63 in 2005-06 to 2.91 in 2007-08.
Finally increase took place to 3.90 in 2008-09. It averages at 7.00.
Average Age of Cash (in days) shows an alternate decrease/increase from 33.65 in 1999-
2K to 83.96 in 2004-05 and continuous increase from 55.08 in 2005-06 to 125.51 in 2007-
08. Finally decrease took place to 93.48 in 2008-09. It averages at 66.70.

161
MANAGEMENT OF CASH-TABLE NO.7.3.13PRIVATE SECTOR
Year CTR(IN TIME) AAC(IN DAYS)1999-2K 10.85 33.652000-01 11.86 30.772001-02 10.46 34.892002-03 10.56 34.562003-04 3.72 98.132004-05 4.35 83.962005-06 6.63 55.082006-07 4.75 76.922007-08 2.91 125.512008-09 3.90 93.48
Mean 7.00 66.70(Source: Annual Reports 1999-2009)
7.3.14 INDUSTRY (Table No.7.3.14)
Cash Turnover Ratio (in time) shows a continuous increase from 2.23 in 1999-2K to
2.70 in 2002-03 and again from 2.13 in 2003-04 to 3.33 in 2006-07. Increase took place
from 3.03 in 2007-08 to 4.66 in 2008-09. It averages at 2.85.
Average Age of Cash (in days) shows a continuous decrease from 163.94 in 1999-2K to
134.99 in 2002-03 and again from 171.31 in 2003-04 to 109.53 in 2006-07. Decrease took
place from 120.44 in 2007-08 to 78.25 in 2008-09. It averages at 134.64.
MANAGEMENT OF CASH-TABLE NO.7.3.14INDUSTRY
Year CTR(IN TIME) AAC(IN DAYS)1999-2K 2.23 163.942000-01 2.46 148.272001-02 2.49 146.792002-03 2.70 134.992003-04 2.13 171.312004-05 2.31 157.902005-06 3.18 114.932006-07 3.33 109.532007-08 3.03 120.442008-09 4.66 78.25
Mean 2.85 134.64(Source: Annual Reports 1999-2009)
IFFCO, MFL, GNVFC and Cooperative Sector have the highest CTR in Cooperative
Sector, Public Sector, Private Sector and Industry respectively. KRIBHCO, FACT, CFL
and Cooperative Sector have the highest AAC in Cooperative Sector, Public Sector,

162
Private Sector and Industry respectively.
163
7.4 MANAGEMENT OF PAYABLES
Accounts payables contain trade creditors and other outstanding expenditure which helps
in financing the operational activities of an organization continuously up to considerable
extent. Due to this accounts payables often called self adjusting way of financing. Main
function of payables management is to keep the payable at optimal level. Company should
use payables as a source of working capital finance keeping in mind the credibility and its
goodwill. Payables originate from the manufacturing plan of an organization, but become
accounts payable only when materials are delivered and handed over to the concerned
department. Though timing of procurement or placement of an order is the work of
supplies department but the management will be capable to augment the worth of the
organization only if it is working in close coordination with the finance department. Whilst
the objective of accounts payable management is to offer as much impulsive financing as
possible but efforts should always be made to keep their level to the optimum.
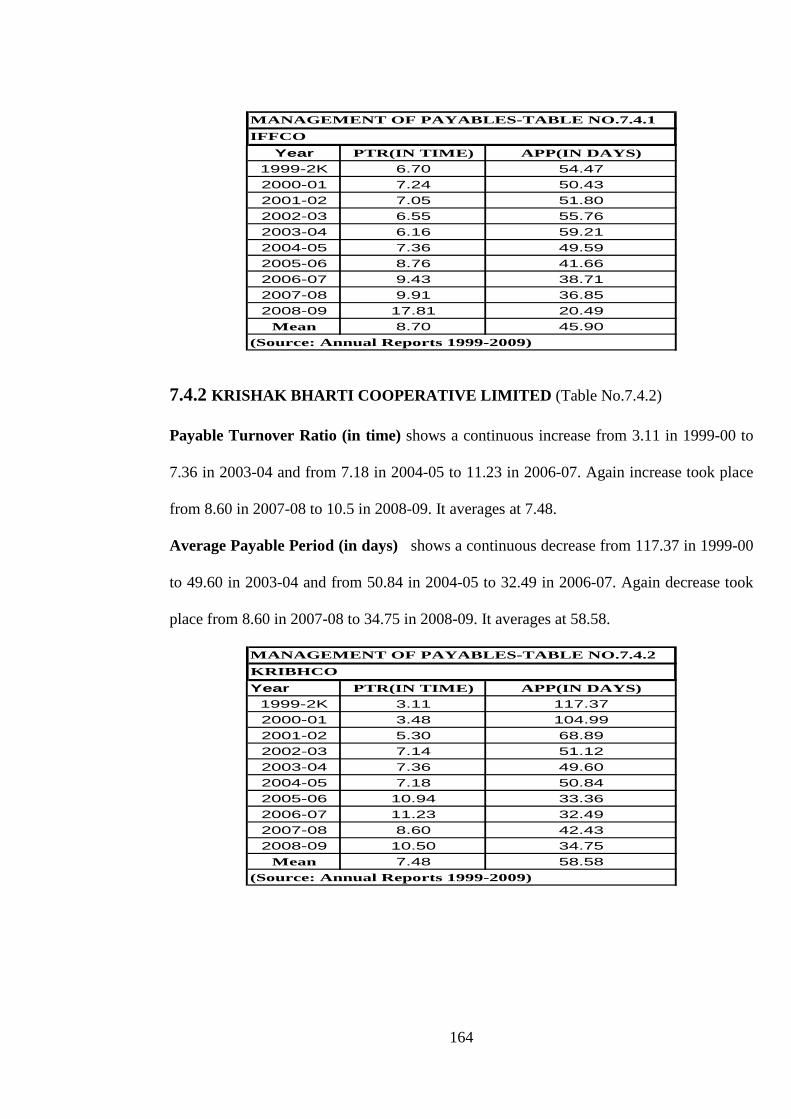
7.4.1 INDIAN FARMERS FERTILIZER COOPERATIVE LIMITED (Table
No.7.4.1)
Payable Turnover Ratio (in time) shows an alternate increase/decrease from 6.70 in
1999-00 to 7.05 in 2001-02 and decrease/increase from 6.55 in 2002-03 to 7.36 in 2004-
05. Continuous increase took place from 8.76 in 2005-06 to 17.81 in 2008-09. It averages
at 8.70.
Average Payable Period (in days) shows an alternate decrease/increase from 54.47 in
1999-00 to 51.80 in 2001-02 increase/decrease from 55.76 in 2002-03 to 49.59 in 2004-
05. Continuous decrease took place from 41.66 in 2005-06 to 20.49 in 2008-09. It averages
at 45.90.
164
MANAGEMENT OF PAYABLES-TABLE NO.7.4.1IFFCO
Year PTR(IN TIME) APP(IN DAYS)1999-2K 6.70 54.472000-01 7.24 50.432001-02 7.05 51.802002-03 6.55 55.762003-04 6.16 59.212004-05 7.36 49.592005-06 8.76 41.662006-07 9.43 38.712007-08 9.91 36.852008-09 17.81 20.49
Mean 8.70 45.90(Source: Annual Reports 1999-2009)
7.4.2 KRISHAK BHARTI COOPERATIVE LIMITED (Table No.7.4.2)
Payable Turnover Ratio (in time) shows a continuous increase from 3.11 in 1999-00 to
7.36 in 2003-04 and from 7.18 in 2004-05 to 11.23 in 2006-07. Again increase took place
from 8.60 in 2007-08 to 10.5 in 2008-09. It averages at 7.48.
Average Payable Period (in days) shows a continuous decrease from 117.37 in 1999-00
to 49.60 in 2003-04 and from 50.84 in 2004-05 to 32.49 in 2006-07. Again decrease took
place from 8.60 in 2007-08 to 34.75 in 2008-09. It averages at 58.58.
MANAGEMENT OF PAYABLES-TABLE NO.7.4.2KRIBHCOYear PTR(IN TIME) APP(IN DAYS)1999-2K 3.11 117.372000-01 3.48 104.992001-02 5.30 68.892002-03 7.14 51.122003-04 7.36 49.602004-05 7.18 50.842005-06 10.94 33.362006-07 11.23 32.492007-08 8.60 42.432008-09 10.50 34.75
Mean 7.48 58.58(Source: Annual Reports 1999-2009)
165
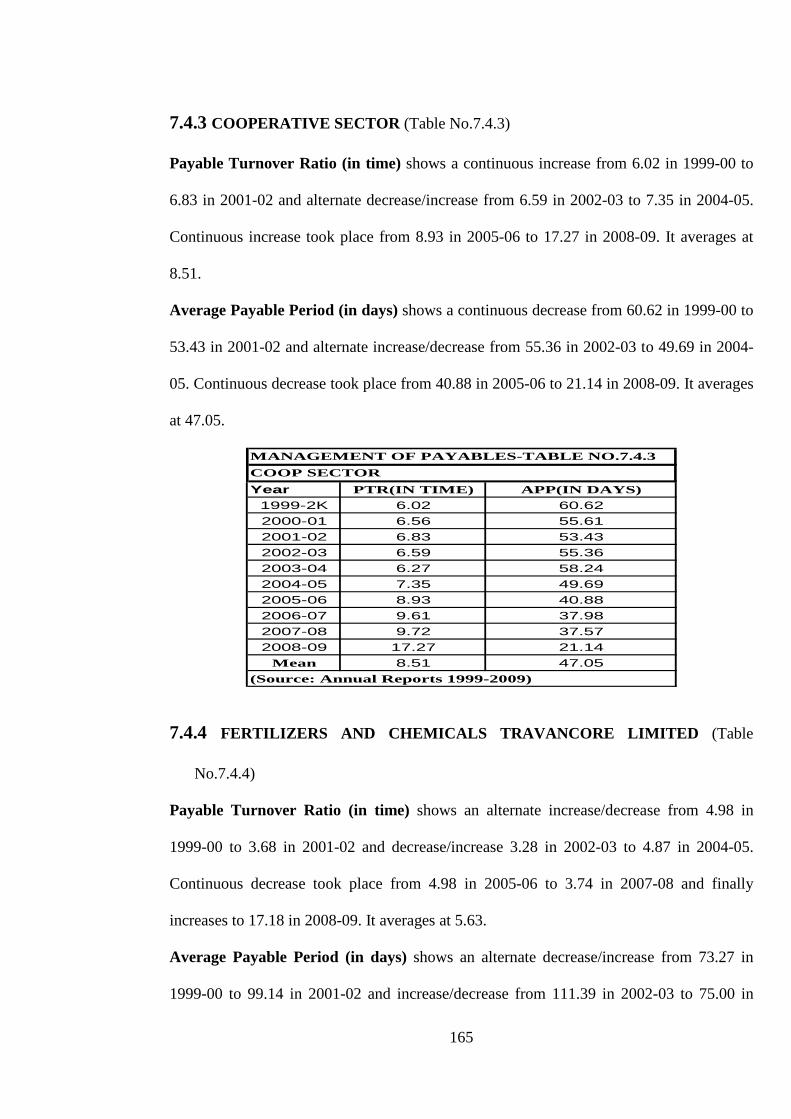
7.4.3 COOPERATIVE SECTOR (Table No.7.4.3)
Payable Turnover Ratio (in time) shows a continuous increase from 6.02 in 1999-00 to
6.83 in 2001-02 and alternate decrease/increase from 6.59 in 2002-03 to 7.35 in 2004-05.
Continuous increase took place from 8.93 in 2005-06 to 17.27 in 2008-09. It averages at
8.51.
Average Payable Period (in days) shows a continuous decrease from 60.62 in 1999-00 to
53.43 in 2001-02 and alternate increase/decrease from 55.36 in 2002-03 to 49.69 in 2004-
05. Continuous decrease took place from 40.88 in 2005-06 to 21.14 in 2008-09. It averages
at 47.05.
MANAGEMENT OF PAYABLES-TABLE NO.7.4.3COOP SECTORYear PTR(IN TIME) APP(IN DAYS)1999-2K 6.02 60.622000-01 6.56 55.612001-02 6.83 53.432002-03 6.59 55.362003-04 6.27 58.242004-05 7.35 49.692005-06 8.93 40.882006-07 9.61 37.982007-08 9.72 37.572008-09 17.27 21.14
Mean 8.51 47.05(Source: Annual Reports 1999-2009)
7.4.4 FERTILIZERS AND CHEMICALS TRAVANCORE LIMITED (Table
No.7.4.4)
Payable Turnover Ratio (in time) shows an alternate increase/decrease from 4.98 in
1999-00 to 3.68 in 2001-02 and decrease/increase 3.28 in 2002-03 to 4.87 in 2004-05.
Continuous decrease took place from 4.98 in 2005-06 to 3.74 in 2007-08 and finally
increases to 17.18 in 2008-09. It averages at 5.63.
Average Payable Period (in days) shows an alternate decrease/increase from 73.27 in
1999-00 to 99.14 in 2001-02 and increase/decrease from 111.39 in 2002-03 to 75.00 in
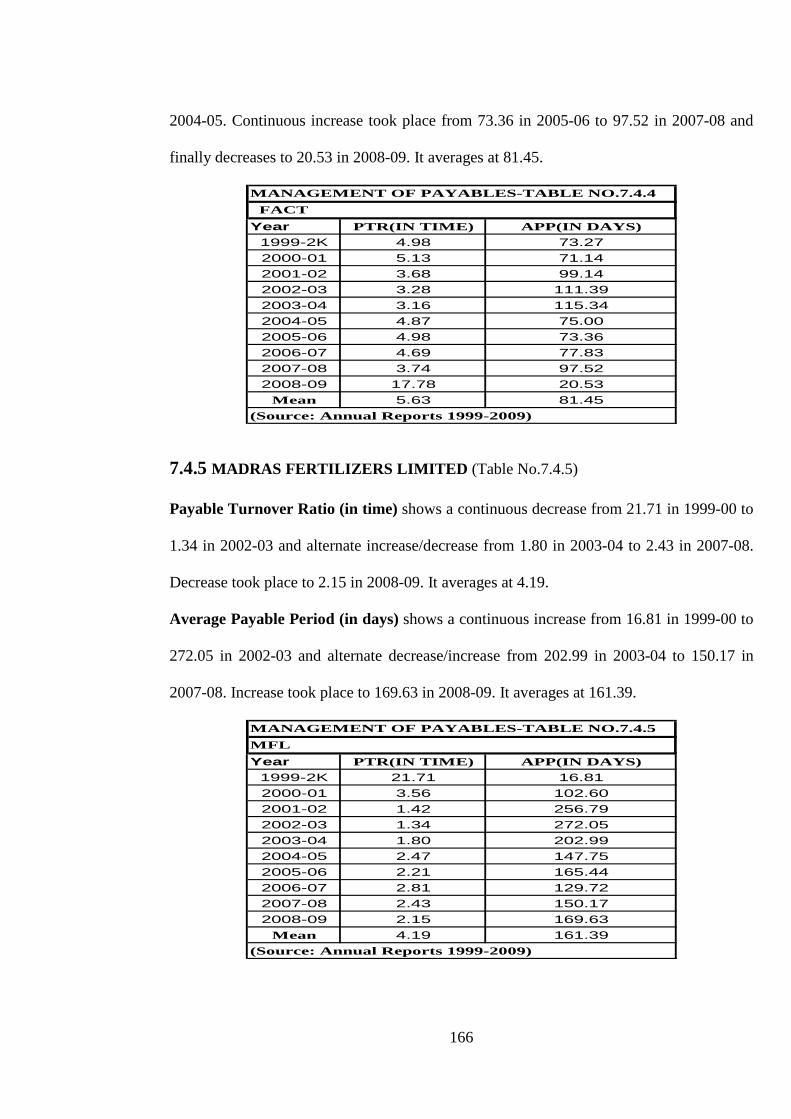
166
2004-05. Continuous increase took place from 73.36 in 2005-06 to 97.52 in 2007-08 and
finally decreases to 20.53 in 2008-09. It averages at 81.45.
MANAGEMENT OF PAYABLES-TABLE NO.7.4.4 FACTYear PTR(IN TIME) APP(IN DAYS)1999-2K 4.98 73.272000-01 5.13 71.142001-02 3.68 99.142002-03 3.28 111.392003-04 3.16 115.342004-05 4.87 75.002005-06 4.98 73.362006-07 4.69 77.832007-08 3.74 97.522008-09 17.78 20.53
Mean 5.63 81.45(Source: Annual Reports 1999-2009)
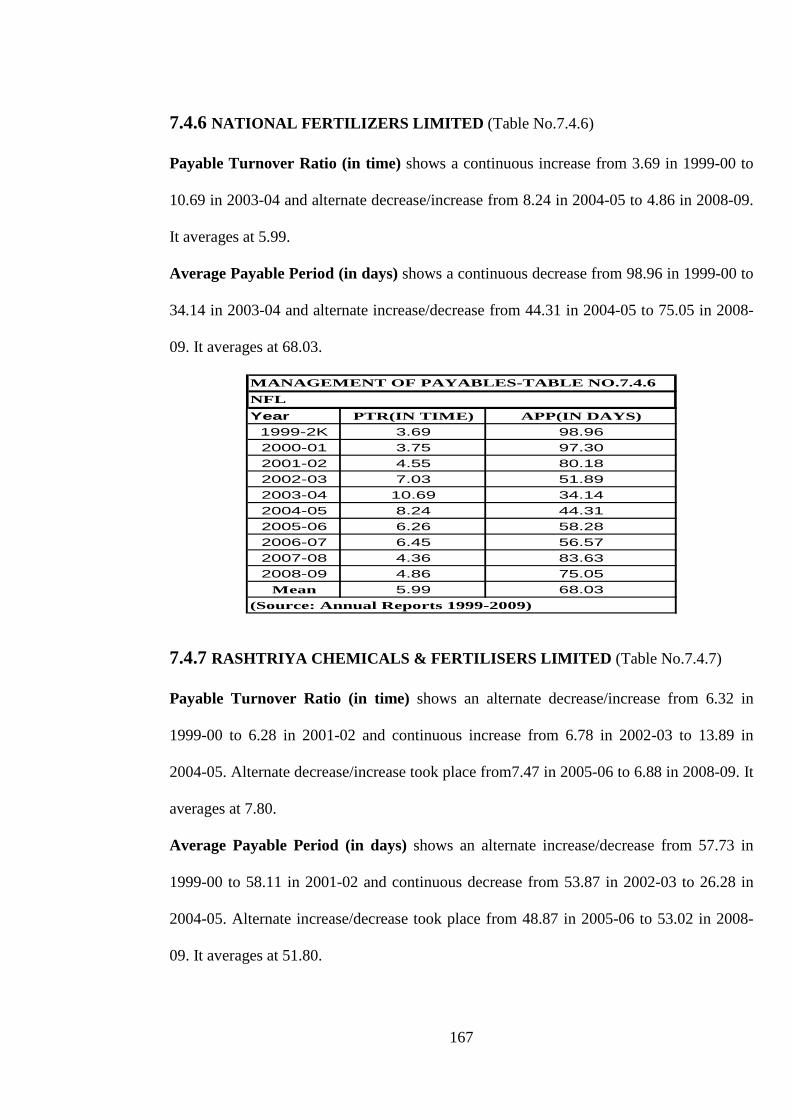
7.4.5 MADRAS FERTILIZERS LIMITED (Table No.7.4.5)
Payable Turnover Ratio (in time) shows a continuous decrease from 21.71 in 1999-00 to
1.34 in 2002-03 and alternate increase/decrease from 1.80 in 2003-04 to 2.43 in 2007-08.
Decrease took place to 2.15 in 2008-09. It averages at 4.19.
Average Payable Period (in days) shows a continuous increase from 16.81 in 1999-00 to
272.05 in 2002-03 and alternate decrease/increase from 202.99 in 2003-04 to 150.17 in
2007-08. Increase took place to 169.63 in 2008-09. It averages at 161.39.
MANAGEMENT OF PAYABLES-TABLE NO.7.4.5MFLYear PTR(IN TIME) APP(IN DAYS)1999-2K 21.71 16.812000-01 3.56 102.602001-02 1.42 256.792002-03 1.34 272.052003-04 1.80 202.992004-05 2.47 147.752005-06 2.21 165.442006-07 2.81 129.722007-08 2.43 150.172008-09 2.15 169.63
Mean 4.19 161.39(Source: Annual Reports 1999-2009)
167
7.4.6 NATIONAL FERTILIZERS LIMITED (Table No.7.4.6)
Payable Turnover Ratio (in time) shows a continuous increase from 3.69 in 1999-00 to
10.69 in 2003-04 and alternate decrease/increase from 8.24 in 2004-05 to 4.86 in 2008-09.
It averages at 5.99.
Average Payable Period (in days) shows a continuous decrease from 98.96 in 1999-00 to
34.14 in 2003-04 and alternate increase/decrease from 44.31 in 2004-05 to 75.05 in 2008-
09. It averages at 68.03.
MANAGEMENT OF PAYABLES-TABLE NO.7.4.6NFLYear PTR(IN TIME) APP(IN DAYS)1999-2K 3.69 98.962000-01 3.75 97.302001-02 4.55 80.182002-03 7.03 51.892003-04 10.69 34.142004-05 8.24 44.312005-06 6.26 58.282006-07 6.45 56.572007-08 4.36 83.632008-09 4.86 75.05
Mean 5.99 68.03(Source: Annual Reports 1999-2009)
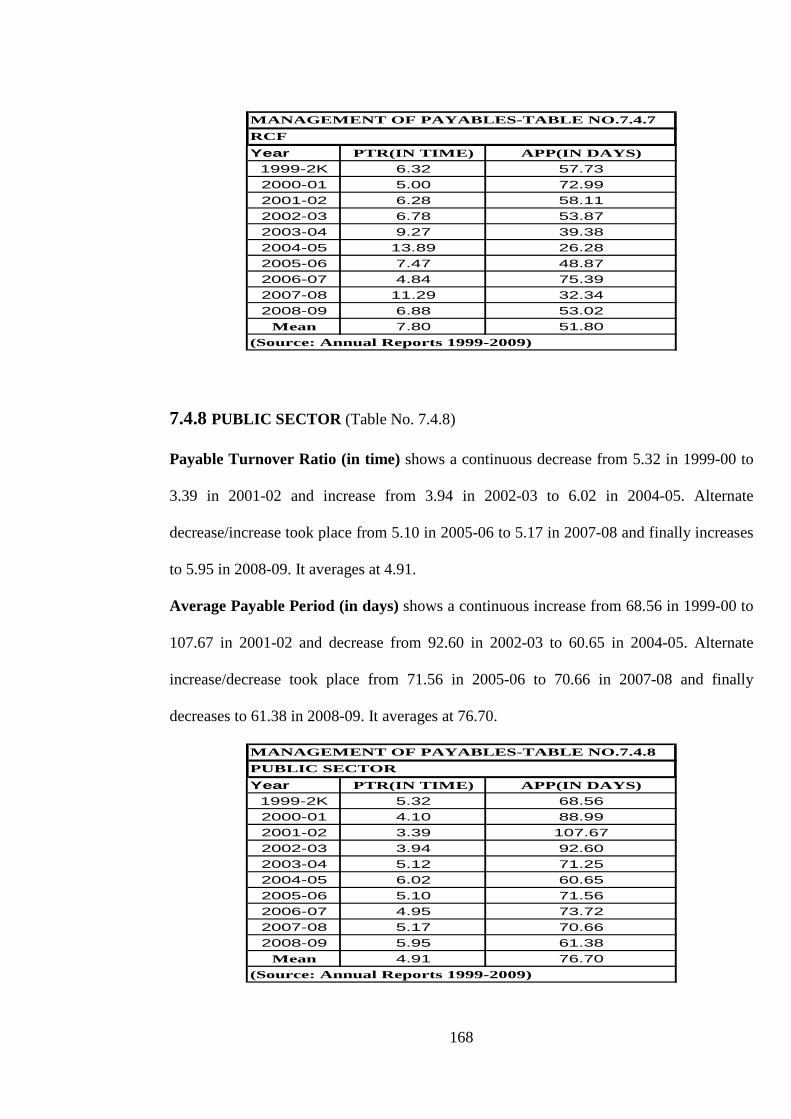
7.4.7 RASHTRIYA CHEMICALS & FERTILISERS LIMITED (Table No.7.4.7)
Payable Turnover Ratio (in time) shows an alternate decrease/increase from 6.32 in
1999-00 to 6.28 in 2001-02 and continuous increase from 6.78 in 2002-03 to 13.89 in
2004-05. Alternate decrease/increase took place from7.47 in 2005-06 to 6.88 in 2008-09. It
averages at 7.80.
Average Payable Period (in days) shows an alternate increase/decrease from 57.73 in
1999-00 to 58.11 in 2001-02 and continuous decrease from 53.87 in 2002-03 to 26.28 in
2004-05. Alternate increase/decrease took place from 48.87 in 2005-06 to 53.02 in 2008-
09. It averages at 51.80.
168
MANAGEMENT OF PAYABLES-TABLE NO.7.4.7RCFYear PTR(IN TIME) APP(IN DAYS)1999-2K 6.32 57.732000-01 5.00 72.992001-02 6.28 58.112002-03 6.78 53.872003-04 9.27 39.382004-05 13.89 26.282005-06 7.47 48.872006-07 4.84 75.392007-08 11.29 32.342008-09 6.88 53.02
Mean 7.80 51.80(Source: Annual Reports 1999-2009)
7.4.8 PUBLIC SECTOR (Table No. 7.4.8)
Payable Turnover Ratio (in time) shows a continuous decrease from 5.32 in 1999-00 to
3.39 in 2001-02 and increase from 3.94 in 2002-03 to 6.02 in 2004-05. Alternate
decrease/increase took place from 5.10 in 2005-06 to 5.17 in 2007-08 and finally increases
to 5.95 in 2008-09. It averages at 4.91.
Average Payable Period (in days) shows a continuous increase from 68.56 in 1999-00 to
107.67 in 2001-02 and decrease from 92.60 in 2002-03 to 60.65 in 2004-05. Alternate
increase/decrease took place from 71.56 in 2005-06 to 70.66 in 2007-08 and finally
decreases to 61.38 in 2008-09. It averages at 76.70.
MANAGEMENT OF PAYABLES-TABLE NO.7.4.8PUBLIC SECTORYear PTR(IN TIME) APP(IN DAYS)1999-2K 5.32 68.562000-01 4.10 88.992001-02 3.39 107.672002-03 3.94 92.602003-04 5.12 71.252004-05 6.02 60.652005-06 5.10 71.562006-07 4.95 73.722007-08 5.17 70.662008-09 5.95 61.38
Mean 4.91 76.70(Source: Annual Reports 1999-2009)

169
7.4.9 CHAMBAL FERTILISERS AND CHEMICALS LIMITED (Table No.7.4.9)
Payable Turnover Ratio (in time) shows a continuous increase from 4.00 in 1999-00 to
7.21 in 2002-03 and alternate decrease/increase from 6.54 in 2003-04 to 6.12 in 2005-06.
Again alternate increase/decrease took place from 9.67 in 2006-07 to 4.22 in 2008-09. It
averages at 6.48.
Average Payable Period (in days) shows a continuous decrease from 91.21 in 1999-00 to
50.61 in 2002-03 and alternate increase/decrease from 55.79 in 2003-04 to 59.67 in 2005-
06. Again alternate decrease/increase took place from 37.75 in 2006-07 to 86.54 in 2008-
09. It averages at 61.91.
MANAGEMENT OF PAYABLES-TABLE NO.7.4.9CFLYear PTR(IN TIME) APP(IN DAYS)1999-2K 4.00 91.212000-01 4.67 78.232001-02 6.30 57.902002-03 7.21 50.612003-04 6.54 55.792004-05 5.45 66.942005-06 6.12 59.672006-07 9.67 37.752007-08 10.58 34.502008-09 4.22 86.54
Mean 6.48 61.91(Source: Annual Reports 1999-2009)
7.4.10 GUJARAT NARMDA VALLEY FERTILIZER COMPANY LIMTED (Table
No.7.4.10)
Payable Turnover Ratio (in time) shows an alternate increase/decrease from 1.17 in
1999-00 to 2.96 in 2001-02 and from 2.77 in 2002-03 to 4.67 in 2004-05. Alternate
decrease/increase took place from 5.36 in 2005-06 to 5.52 in 2007-08 and finally increases
to 6.87 in 2008-09. It averages at 4.26.
Average Payable Period (in days) shows an alternate decrease/increase from 310.96 in
1999-00 to 123.42 in 2001-02 and increase/decrease from 131.61 in 2002-03 to 78.14 in

170
2004-05. Alternate increase/decrease took place from 68.04 in 2005-06 to 66.17 in 2007-
08 and finally decreases to 53.12 in 2008-09. It averages at 110.57.
MANAGEMENT OF PAYABLES-TABLE NO.7.4.10GNVFCYear PTR(IN TIME) APP(IN DAYS)1999-2K 1.17 310.962000-01 5.80 62.922001-02 2.96 123.422002-03 2.77 131.612003-04 2.70 135.322004-05 4.67 78.142005-06 5.36 68.042006-07 4.80 75.982007-08 5.52 66.172008-09 6.87 53.12
Mean 4.26 110.57(Source: Annual Reports 1999-2009)
7.4.11 GUJARAT STATE FERTILIZER COMPANY LIMITED (Table No.7.4.11)
Payable Turnover Ratio (in time) shows a continuous decrease from 2.08 in 1999-00 to
1.34 in 2002-03 and increase from 1.83 in 2003-04 to 10.14 in 2008-09. It averages at
3.53.
Average Payable Period (in days) shows a continuous increase from 175.18 in 1999-00
to 272.06 in 2002-03 and decrease from199.16 in 2003-04 to 36.01 in 2008-09. It averages
at 152.08.
MANAGEMENT OF PAYABLES-TABLE NO.7.4.11GSFC
Year PTR(IN TIME) APP(IN DAYS)1999-2K 2.08 175.182000-01 1.76 207.432001-02 1.60 227.562002-03 1.34 272.062003-04 1.83 199.162004-05 2.46 148.262005-06 3.08 118.592006-07 4.52 80.672007-08 6.53 55.882008-09 10.14 36.01
Mean 3.53 152.08(Source: Annual Reports 1999-2009)
171
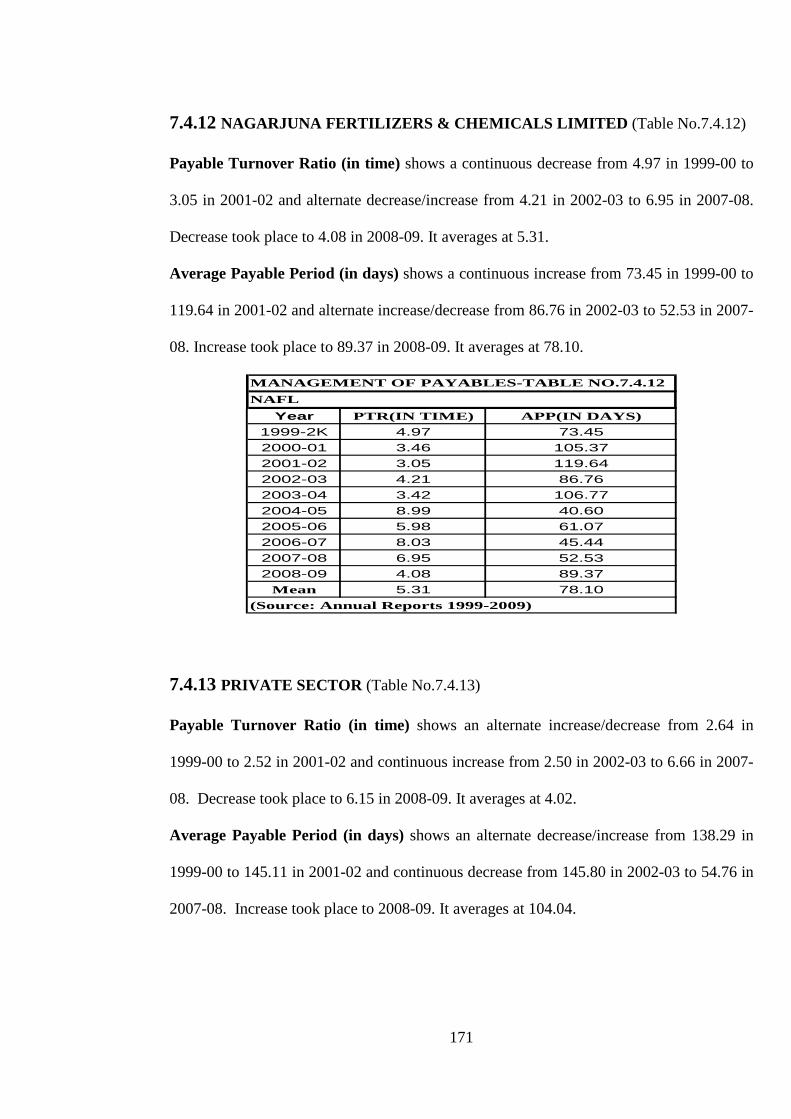
7.4.12 NAGARJUNA FERTILIZERS & CHEMICALS LIMITED (Table No.7.4.12)
Payable Turnover Ratio (in time) shows a continuous decrease from 4.97 in 1999-00 to
3.05 in 2001-02 and alternate decrease/increase from 4.21 in 2002-03 to 6.95 in 2007-08.
Decrease took place to 4.08 in 2008-09. It averages at 5.31.
Average Payable Period (in days) shows a continuous increase from 73.45 in 1999-00 to
119.64 in 2001-02 and alternate increase/decrease from 86.76 in 2002-03 to 52.53 in 2007-
08. Increase took place to 89.37 in 2008-09. It averages at 78.10.
MANAGEMENT OF PAYABLES-TABLE NO.7.4.12NAFL
Year PTR(IN TIME) APP(IN DAYS)1999-2K 4.97 73.452000-01 3.46 105.372001-02 3.05 119.642002-03 4.21 86.762003-04 3.42 106.772004-05 8.99 40.602005-06 5.98 61.072006-07 8.03 45.442007-08 6.95 52.532008-09 4.08 89.37
Mean 5.31 78.10(Source: Annual Reports 1999-2009)
7.4.13 PRIVATE SECTOR (Table No.7.4.13)
Payable Turnover Ratio (in time) shows an alternate increase/decrease from 2.64 in
1999-00 to 2.52 in 2001-02 and continuous increase from 2.50 in 2002-03 to 6.66 in 2007-
08. Decrease took place to 6.15 in 2008-09. It averages at 4.02.
Average Payable Period (in days) shows an alternate decrease/increase from 138.29 in
1999-00 to 145.11 in 2001-02 and continuous decrease from 145.80 in 2002-03 to 54.76 in
2007-08. Increase took place to 2008-09. It averages at 104.04.

172
MANAGEMENT OF PAYABLES-TABLE NO.7.4.13 PRIVATE SECTOR
Year PTR(IN TIME) APP(IN DAYS)1999-2K 2.64 138.292000-01 2.90 125.932001-02 2.52 145.112002-03 2.50 145.802003-04 2.78 131.252004-05 3.88 94.112005-06 4.45 81.972006-07 5.72 63.842007-08 6.66 54.762008-09 6.15 59.34
Mean 4.02 104.04(Source: Annual Reports 1999-2009)
7.4.14 INDUSTRY (Table No. 7.4.14)
Payable Turnover Ratio (in time) shows a continuous decrease from 4.47 in 1999-00 to
3.74 in 2001-02 and increase from 4.03 in 2002-03 to 10.00 in 2008-09. It averages at
5.54.
Average Payable Period (in days) shows a continuous increase from 81.61 in 1999-00 to
97.52 in 2001-02 and decrease from 90.67 in 2002-03 to 36.49 in 2008-09. It averages at
71.56.
MANAGEMENT OF PAYABLES-TABLE NO.7.4.14INDUSTRY
Year PTR(IN TIME) APP(IN DAYS)1999-2K 4.47 81.612000-01 4.19 87.152001-02 3.74 97.522002-03 4.03 90.672003-04 4.49 81.352004-05 5.55 65.812005-06 5.61 65.022006-07 6.34 57.582007-08 6.97 52.372008-09 10.00 36.49Mean 5.54 71.56
(Source: Annual Reports 1999-2009)
Study shows that IFFCO, RCF, CFL and Cooperative Sector have the highest PTR in
Cooperative Sector, Public Sector, Private Sector and Industry respectively. KRIBHCO,
MFL, GSFC and Private Sector have the highest APP in Cooperative Sector, Public Sector,
Private Sector and Industry respectively.