CHAPTER 7 Libraries and Educational Technology
18
CHAPTER 7 Libraries and Educational Technology This chapter contains statistics on libraries and the use of information technologies. These data show the extent of America’s public access to information technologies outside of formal classroom activities. The data also provide a cap- sule description of the magnitude and availability of library resources. The first section of the chapter (tables 419 to 424) deals with public libraries, elementary and secondary school libraries, and college and university libraries. It contains data on collections, population served, staff, and expendi- tures. Table 423 provides institutional-level information for the 60 largest college libraries in the country. The second part of the chapter (tables 425 to 430) pro- vides information on the availability and use of technology at school, home, and work. For example, the percentage of children using computers at school is shown over time. Also included are data on the use of home computers and the Internet by adults and school children, with comparisons among various demographic groups. Related data may be found in other chapters of the Digest. For example, statistics on the number of degrees conferred in computer and information sciences and library sciences are in chapter 3. Further information on survey methodolo- gies is in Appendix A: Guide to Sources and in the publica- tions cited in the table source notes. Libraries The average number of library staff per public school with a library was 1.7 in 2007–08, including 0.8 certified library/media specialists (table 419). On average, public school libraries had larger numbers of books on a per student basis in 2007–08 (2,015 per 100 students) than in 1999–2000 (1,803 per 100 students) and 2003–04 (1,891 per 100 students). In 2007–08, public elementary school librar- ies had larger holdings than public secondary school librar- ies on a per student basis (2,316 books per 100 students, compared to 1,432 books per 100 students). From 1991–92 to 1999–2000, the increase in college library operating expenditures was greater than the increase in enrollment; after adjustment for inflation, library operat- ing expenditures per full-time-equivalent (FTE) student rose 6 percent during this period (table 422). From 1999–2000 to 2005–06, library operating expenditures per FTE student dropped 12 percent. Overall, there was a net decrease of 7 percent in library operating expenditures per FTE student between 1991–92 and 2005–06. In 2005–06, the average library operating expenditure per FTE student was $472. In 2007, there were 9,214 public libraries in the United States with a total of 812 million books and serial volumes. The annual number of visits per capita was 4.9, and the annual reference transactions per capita were 1.0 (table 424). Computers and Technology In 2005, the average public school contained 154 instruc- tional computers (table 425). One important technological advance that has come to classrooms following the introduc- tion of computers has been connections to the Internet. The percentage of instructional rooms with internet access increased from 51 percent in 1998 to 94 percent in 2005 (fig- ure 29). Nearly all schools had access to the Internet in 2005 (table 425). The increasing number of computers in schools has coin- cided with rising percentages of students using computers (table 429). The percentage of elementary and secondary school students using computers at school rose from 70 per- cent in 1997 to 83 percent in 2003. In 2003, the use of com- puters at school by elementary and secondary school students varied by age and family income. Among students in elementary and secondary schools, a higher percentage of those age 10 or older than of those younger than 10 used computers at school. In general, a greater percentage of ele- mentary and secondary school students from higher income families than of students from lower income families used computers at school. For example, in 2003, about 80 percent of students from families with incomes of $20,000 to $24,999 used computers at school, compared to 86 percent of students from families with incomes of $75,000 or more. A majority of students in 2003 used computers at home (table 429). In 2003, about 68 percent of elementary and sec- ondary school students used computers at home, compared to 43 percent in 1997. From 1997 to 2003, the percentage of students using computers at home for school work rose from 25 to 47 percent. In 2003, a higher percentage of females than males used computers at home for school work (49 vs. 46 percent). About 54 percent of White elementary and sec- ondary school students used computers at home for school work in 2003, compared to 35 percent of Black students and 34 percent of Hispanic students. A greater percentage of stu- DIGEST OF EDUCATION STATISTICS 2009 605
Transcript of CHAPTER 7 Libraries and Educational Technology

CHAPTER 7 Libraries and Educational Technology
This chapter contains statistics on libraries and the use of information technologies. These data show the extent of America’s public access to information technologies outside of formal classroom activities. The data also provide a cap-sule description of the magnitude and availability of library resources.
The first section of the chapter (tables 419 to 424) deals with public libraries, elementary and secondary school libraries, and college and university libraries. It contains data on collections, population served, staff, and expendi-tures. Table 423 provides institutional-level information for the 60 largest college libraries in the country.
The second part of the chapter (tables 425 to 430) pro-vides information on the availability and use of technology at school, home, and work. For example, the percentage of children using computers at school is shown over time. Also included are data on the use of home computers and the Internet by adults and school children, with comparisons among various demographic groups.
Related data may be found in other chapters of the Digest. For example, statistics on the number of degrees conferred in computer and information sciences and library sciences are in chapter 3. Further information on survey methodolo-gies is in Appendix A: Guide to Sources and in the publica-tions cited in the table source notes.
Libraries The average number of library staff per public school
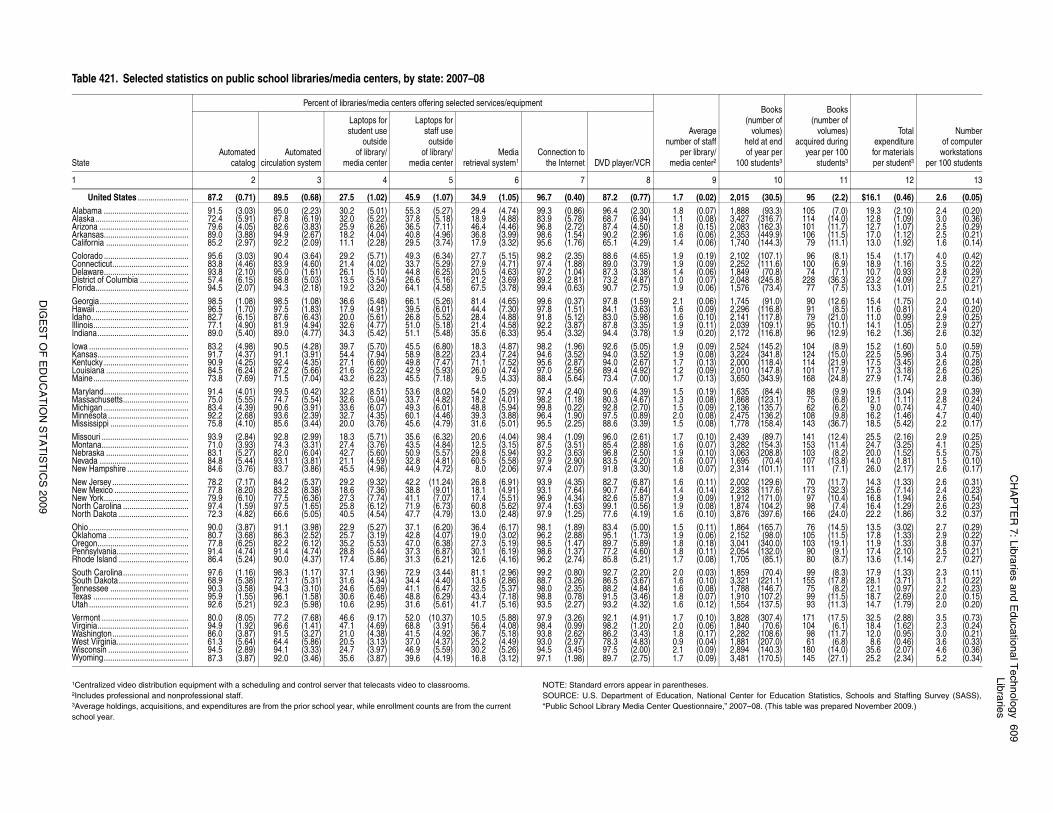
with a library was 1.7 in 2007–08, including 0.8 certified library/media specialists (table 419). On average, public school libraries had larger numbers of books on a per student basis in 2007–08 (2,015 per 100 students) than in 1999–2000 (1,803 per 100 students) and 2003–04 (1,891 per 100 students). In 2007–08, public elementary school librar-ies had larger holdings than public secondary school librar-ies on a per student basis (2,316 books per 100 students, compared to 1,432 books per 100 students).
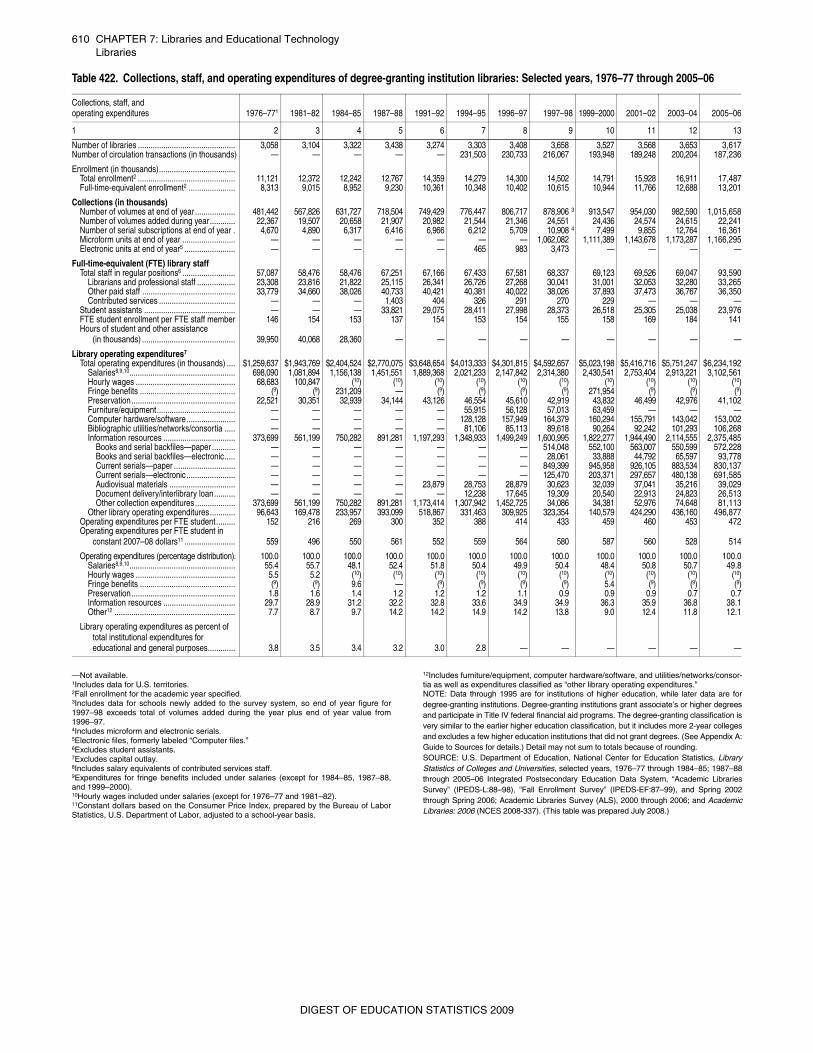
From 1991–92 to 1999–2000, the increase in college library operating expenditures was greater than the increase in enrollment; after adjustment for inflation, library operat-ing expenditures per full-time-equivalent (FTE) student rose 6 percent during this period (table 422). From 1999–2000 to 2005–06, library operating expenditures per FTE student dropped 12 percent. Overall, there was a net decrease of 7
percent in library operating expenditures per FTE student between 1991–92 and 2005–06. In 2005–06, the average library operating expenditure per FTE student was $472.
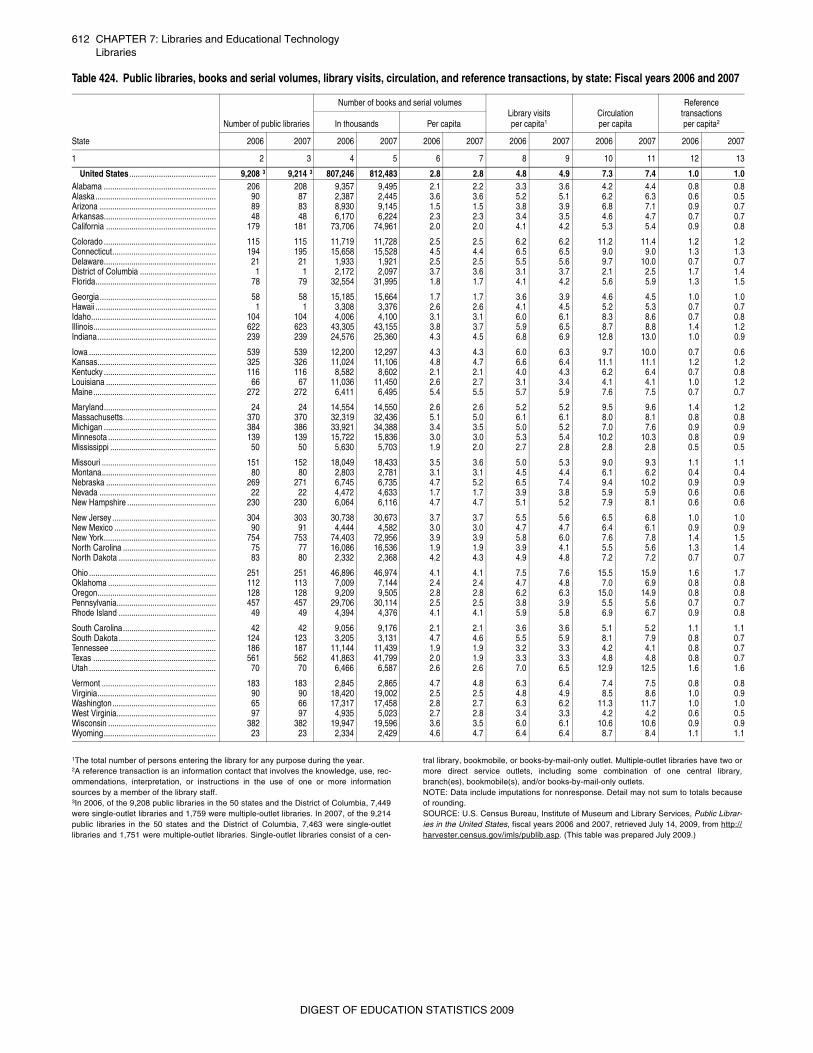
In 2007, there were 9,214 public libraries in the United States with a total of 812 million books and serial volumes. The annual number of visits per capita was 4.9, and the annual reference transactions per capita were 1.0 (table 424).
Computers and Technology In 2005, the average public school contained 154 instruc-
tional computers (table 425). One important technological advance that has come to classrooms following the introduc-tion of computers has been connections to the Internet. The percentage of instructional rooms with internet access increased from 51 percent in 1998 to 94 percent in 2005 (fig-ure 29). Nearly all schools had access to the Internet in 2005 (table 425).
The increasing number of computers in schools has coin-cided with rising percentages of students using computers (table 429). The percentage of elementary and secondary school students using computers at school rose from 70 per-cent in 1997 to 83 percent in 2003. In 2003, the use of com-puters at school by elementary and secondary school students varied by age and family income. Among students in elementary and secondary schools, a higher percentage of those age 10 or older than of those younger than 10 used computers at school. In general, a greater percentage of ele-mentary and secondary school students from higher income families than of students from lower income families used computers at school. For example, in 2003, about 80 percent of students from families with incomes of $20,000 to $24,999 used computers at school, compared to 86 percent of students from families with incomes of $75,000 or more.
A majority of students in 2003 used computers at home (table 429). In 2003, about 68 percent of elementary and sec-ondary school students used computers at home, compared to 43 percent in 1997. From 1997 to 2003, the percentage of students using computers at home for school work rose from 25 to 47 percent. In 2003, a higher percentage of females than males used computers at home for school work (49 vs. 46 percent). About 54 percent of White elementary and sec-ondary school students used computers at home for school work in 2003, compared to 35 percent of Black students and 34 percent of Hispanic students. A greater percentage of stu-
DIGEST OF EDUCATION STATISTICS 2009 605

606 CHAPTER 7: Libraries and Educational Technology
dents from higher income families than of students from lower income families reported using computers at home for school work. For instance, 63 percent of students from fam-ilies with incomes of $75,000 or more used a computer at home for school work, compared to 32 percent of students from families with incomes of $20,000 to $24,999.
The percentage of college students using computers at school rose from 63 percent in 1997 to 85 percent in 2003. About 76 percent used computers at home for school work in 2003 (table 429).
Computers are widely used in the workplace. In 2003, about 56 percent of all workers used computers at work
(table 430). More frequent use of computers at work was associated with higher levels of education and higher incomes. For example, 16 percent of high school dropouts and 40 percent of high school graduates used computers at work, compared to 82 to 87 percent of workers with bache-lor’s, master’s, first-professional, or doctor’s degrees. Among the common computer applications used by all employees using computers on the job were Internet/e-mail (75 percent), word processing/desktop publishing (68 per-cent), spreadsheets/databases (64 percent), and calendar/ schedule (57 percent).
Figure 29. Percentage of all public schools and instructional rooms with internet access: Selected years, fall 1994 through fall 2005 Percent 100
80
60
40
20
0
Schools with internet access
Instructional rooms with internet access
1994 1995 1996 1997 1998 1999 2000 2001 2002 2003 2005 Year
SOURCE: U.S. Department of Education, National Center for Education Statistics, Fast Response Survey System (FRSS), Internet Access in U.S. Public Schools and Classrooms: 1994–2005.
DIGEST OF EDUCATION STATISTICS 2009

s
DIG
ES
T O
F E
DU
CA
TIO
N S
TA
TIS
TIC
S 2
00
9
CH
AP
TE
R 7
: Lib
rarie
s an
d E
du
catio
na
l Te
chn
olo
gy
60
7
Lib
rarie
s
2007–08
l Elementary Secondary
Combined elementary/
secondary
7 8 9 10
)
) ) ) ) ) ) ) ) ) )
) ) ) ) ) )
) )
)
) )
) )
) ) ) ) )
59,700 (492)
1.65 (0.019) 0.73 (0.013) 0.61 (0.012) 0.13 (0.010) 0.22 (0.013) 0.13 (0.010) 0.08 (0.009) 0.70 (0.016) 0.39 (0.016) 0.31 (0.014)
87.5 (0.94) 89.9 (0.87) 35.9 (1.33) 96.5 (0.51) 86.7 (1.02) 23.0 (1.33)
26.9 (1.27) 45.2 (1.35)
2.5 (0.07)
2,316 (40.2) 93 (5.6)
113.3 (3.26) 5.9 (0.77)
$16.18 (0.591) 11.99 (0.389) 1.06 (0.088)
— (†) — (†)
17,800 (414)
2.04 (0.039) 0.98 (0.019) 0.88 (0.018) 0.10 (0.009) 0.21 (0.021) 0.14 (0.017) 0.07 (0.013) 0.86 (0.027) 0.60 (0.022) 0.26 (0.018)
90.6 (1.08) 92.6 (0.98) 35.1 (1.66) 98.6 (0.51) 89.6 (1.00) 26.4 (1.34)
29.8 (1.34) 50.1 (1.50)
2.9 (0.06)
1,432 (36.6) 81 (5.2)
62.1 (2.67) 4.5 (0.41)
$15.90 (0.647) 10.26 (0.504) 1.11 (0.054)
— (†) — (†)
4,400 (239)
1.42 (0.057) 0.66 (0.033) 0.49 (0.032) 0.18 (0.020) 0.24 (0.027) 0.15 (0.022) 0.08 (0.017) 0.51 (0.036) 0.27 (0.028) 0.24 (0.028)
69.8 (2.88)72.4 (3.15)20.6 (2.32)91.6 (1.90)84.5 (2.20)25.9 (2.76)
26.1 (2.57) 38.5 (2.85)
3.0 (0.17)
2,439 (132.3) 107 (13.3)
103.4 (7.41) 5.7 (0.84)
$17.00 (1.216) 12.10 (1.094) 1.16 (0.152)
— (†) — (†)
andard errors appear in parentheses. for Education Statistics, Schools and Staffing Survey (SASS), 2000, 2003–04, and 2007–08; and “Charter School Question-
9.)
Librarie
Table 419. Selected statistics on public school libraries/media centers, by level of school: 1999–2000, 2003–04, and 2007–08
Selected statistic 1999–2000
2003–04
Total Elementary Secondary
Combined elementary/
secondary Tota
1 2 3 4 5 6
Number of schools with libraries/media centers ........................................
Average number of staff per library/media center...................................... Certified library/media specialists ..........................................................
Full-time ............................................................................................. Part-time ............................................................................................
Other professional staff.......................................................................... Full-time ............................................................................................. Part-time ............................................................................................
Other paid employees............................................................................ Full-time ............................................................................................. Part-time ............................................................................................
Percent of libraries/media centers with certain media equipment Automated catalog ............................................................................... Automated circulation system .............................................................. Media retrieval system1........................................................................ Connection to Internet ......................................................................... Digital video disc (DVD) player/video cassette recorder (VCR) ........... Disability assistance technologies, such as TDD.................................
Percent of libraries/media centers with certain services Students permitted to check out laptops................................................ Staff permitted to check out laptops ......................................................
Number of library computer workstations per 100 students ......................
Average holdings per 100 students at the end of the school year2
Books (number of volumes) ................................................................... Audio and video materials......................................................................
Average additions per 100 students during the school year2
Books (number of volumes) ................................................................... Audio and video materials......................................................................
Total expenditures for library/media materials per pupil2,3 ......................... Books..................................................................................................... Audio and video materials...................................................................... Current serial subscriptions ................................................................... Electronic subscriptions .........................................................................
77,300 (421)
1.89 (0.018) 0.81 (0.007) 0.65 (0.007) 0.16 (0.006) 0.17 (0.007) 0.12 (0.005) 0.06 (0.004) 0.91 (0.014) 0.49 (0.008) 0.41 (0.014)
72.8 (0.69) 74.4 (0.65)
— (†) 90.1 (0.57)
— (†) — (†)
— (†) — (†)
— (†)
1,803 (19.7) 59 (0.9)
— (†) — (†)
$23.37 (0.438) 9.97 (0.153) 1.66 (0.032) 1.26 (0.016) 0.81 (0.018)
78,300
1.76 0.79 0.65 0.14 0.19 0.13 0.05 0.78 0.46 0.33
82.7 86.9
— 95.1 87.8 11.9
— —
2.3
1,891 80
99.3 5.1
$16.24 10.99
1.14 1.38 0.88
(548)
(0.014) (0.009) (0.009) (0.007) (0.008) (0.007) (0.005) (0.011) (0.009) (0.012)
(0.66) (0.61)
(†) (0.35) (0.60) (0.50)
(†) (†)
(0.04)
(45.1) (3.7)
(2.08) (0.19)
(0.322) (0.299) (0.045) (0.025) (0.033)
57,400 (440)
1.66 (0.018) 0.73 (0.012) 0.58 (0.010) 0.15 (0.009) 0.19 (0.011) 0.14 (0.009) 0.05 (0.006) 0.75 (0.013) 0.41 (0.011) 0.34 (0.014)
81.9 (0.89) 86.7 (0.82)
— (†) 94.1 (0.48) 87.0 (0.70) 10.2 (0.61)
— (†) — (†)
2.2 (0.05)
2,127 (70.2) 86 (5.7)
118.4 (3.13) 5.3 (0.28)
$16.00 (0.469) 11.72 (0.452)
1.11 (0.053) 1.06 (0.031) 0.39 (0.042)
16,300 (313)
2.09 (0.025) 1.03 (0.018) 0.92 (0.018) 0.11 (0.009) 0.14 (0.010) 0.11 (0.009) 0.03 (0.004) 0.93 (0.017) 0.65 (0.017) 0.28 (0.014)
90.6 (0.76) 92.8 (0.80)
— (†) 99.2 (0.22) 90.4 (1.19) 18.0 (0.79)
— (†) — (†)
2.5 (0.05)
1,376 (20.0) 65 (2.2)
61.2 (1.75) 4.4 (0.20)
$16.11 (0.320) 9.68 (0.275) 1.11 (0.062) 1.87 (0.049) 1.79 (0.061)
4,600 (201)
1.74 (0.116) 0.73 (0.023) 0.55 (0.027) 0.18 (0.020) 0.28 (0.036) 0.16 (0.022) 0.11 (0.031) 0.73 (0.085) 0.35 (0.028) 0.38 (0.085)
63.7 (2.59) 68.8 (2.45)
— (†) 92.6 (1.40) 89.1 (1.53) 11.7 (1.34)
— (†) — (†)
2.7 (0.17)
2,407 (117.7) 97 (13.6)
109.2 (8.40) 6.9 (0.83)
$21.24 (2.498) 10.19 (0.631) 1.96 (0.619) 2.50 (0.148) 1.25 (0.249)
81,900
1.72 0.78 0.66 0.13 0.22 0.13 0.08 0.72 0.43 0.29
87.2 89.5 34.9 96.7 87.2 23.9
27.5 45.9
2.6
2,015 90
95.3 5.4
$16.11 11.40 1.08
— —
(634
(0.017(0.011(0.010(0.007(0.010(0.008(0.007(0.013(0.013(0.011
(0.71(0.68(1.05(0.40(0.77(1.05
(1.02(1.07
(0.05
(30.5(3.8
(2.21(0.49
(0.461(0.291(0.055
(†(†
—Not available. NOTE: Detail may not sum to totals because of rounding. St†Not applicable. SOURCE: U.S. Department of Education, National Center 1Centralized video distribution equipment with a scheduling and control server that telecasts video to classrooms. “Public School Library Media Center Questionnaire,” 1999–2Average holdings, acquisitions, and expenditures are from the prior school year, while enrollment counts are from the current naire,” 1999–2000. (This table was prepared November 200school year. 3Includes other expenditures not separately shown.

60
8
CH
AP
TE
R 7
: Lib
rarie
s an
d E
du
catio
na
l Te
chn
olo
gy
Lib
rarie
s
DIG
ES
T O
F E
DU
CA
TIO
N S
TA
TIS
TIC
S 2
00
9
Secondary school libraries/media centers
s than 500 500 to 749 750 to 1,499 1,500 or more
9 10 11 12
(353) 3,000 (246) 5,100 (273) 3,300 (198)
(0.071) 1.78 (0.068) 2.18 (0.054) 2.94 (0.081) (0.035) 0.87 (0.035) 1.09 (0.026) 1.38 (0.046) (0.033) 0.80 (0.040) 1.02 (0.029) 1.31 (0.049)
6 (0.019) 0.07 (0.020) 0.07 (0.017) 0.07 (0.022) (0.044) 0.20 (0.051) 0.16 (0.026) 0.15 (0.033) (0.039) 0.11 (0.027) 0.13 (0.023) 0.12 (0.025)
0 (0.027) 0.09 (0.043) 0.04 (0.013) 0.03 (0.015) (0.041) 0.71 (0.050) 0.93 (0.045) 1.40 (0.068) (0.031) 0.51 (0.049) 0.66 (0.039) 1.07 (0.067)
5 (0.032) 0.20 (0.029) 0.28 (0.035) 0.34 (0.053)
(2.59) 94.0 (2.14) 97.2 (0.86) 98.4 (1.05) (2.49) 96.0 (1.72) 98.4 (0.44) 98.7 (0.81) (3.39) 34.1 (3.00) 37.9 (2.85) 36.4 (3.28)
0 (1.42) 99.9 (0.05) 100.0 (†) 100.0 (†)
(2.11) 89.9 (2.67) 92.3 (1.80) 89.3 (2.80) (1.91) 26.7 (3.14) 28.4 (2.06) 38.0 (3.38)
(2.84) 29.9 (3.18) 31.0 (2.40) 29.0 (2.76) (3.06) 49.7 (3.38) 54.5 (2.50) 51.1 (3.39)
(0.28) 3.8 (0.22) 2.9 (0.10) 1.9 (0.08)
(162.4) 1,854 (101.1) 1,332 (34.1) 975 (40.6) (14.4) 138 (30.0) 83 (8.5) 52 (4.1)
(11.48) 81.1 (8.27) 61.3 (4.78) 42.7 (2.66) (0.59) 6.1 (1.44) 4.8 (0.65) 3.4 (0.60)
(3.234) $18.51 (1.931) $16.68 (1.171) $11.75 (0.773) (1.454) 13.47 (1.905) 10.87 (1.103) 7.26 (0.386) (0.157) 1.20 (0.151) 1.19 (0.102) 0.91 (0.085)
ols not separately shown. Detail may not sum to totals because
for Education Statistics, Schools and Staffing Survey (SASS), 8. (This table was prepared November 2009.)
Table 420. Selected statistics on public school libraries/media centers, by level and enrollment size of school: 2007–08
Selected statistic
All public school libraries/media
centers
Elementary school libraries/media centers
Total Less than 150 150 to 499 500 to 749 750 or more Total Les
1 2 3 4 5 6 7 8
Number of schools with libraries/media centers ........................ 81,900 (634) 59,700 (492) 3,300 (399) 31,100 (1054) 16,400 (812) 8,900 (534) 17,800 (414) 6,300
Average number of staff per library/media center 1.72 (0.017) 1.65 (0.019) 1.28 (0.099) 1.58 (0.027) 1.73 (0.045) 1.89 (0.053) 2.04 (0.039) 1.59Certified library/media specialists .......................................... 0.78 (0.011) 0.73 (0.013) 0.60 (0.069) 0.70 (0.019) 0.76 (0.024) 0.86 (0.030) 0.98 (0.019) 0.73
Full-time ............................................................................. 0.66 (0.010) 0.61 (0.012) 0.25 (0.072) 0.53 (0.018) 0.71 (0.022) 0.81 (0.029) 0.88 (0.018) 0.57Part-time ............................................................................ 0.13 (0.007) 0.13 (0.010) 0.36 (0.070) 0.17 (0.014) 0.06 (0.016) 0.05 (0.013) 0.10 (0.009) 0.1
Other professional staff .......................................................... 0.22 (0.010) 0.22 (0.013) 0.20 (0.059) 0.23 (0.016) 0.20 (0.028) 0.21 (0.030) 0.21 (0.021) 0.27Full-time ............................................................................. 0.13 (0.008) 0.13 (0.010) 0.10 (0.051) 0.13 (0.014) 0.14 (0.021) 0.13 (0.021) 0.14 (0.017) 0.17Part-time ............................................................................ 0.08 (0.007) 0.08 (0.009) 0.10 (0.034) 0.09 (0.012) 0.06 (0.016) 0.09 (0.023) 0.07 (0.013) 0.1
Other paid employees............................................................ 0.72 (0.013) 0.70 (0.016) 0.48 (0.068) 0.65 (0.023) 0.78 (0.039) 0.82 (0.044) 0.86 (0.027) 0.59Full-time ............................................................................. 0.43 (0.013) 0.39 (0.016) 0.13 (0.046) 0.33 (0.019) 0.46 (0.035) 0.59 (0.044) 0.60 (0.022) 0.34Part-time ............................................................................
Percent of libraries/media centers with certain media equipment
0.29 (0.011) 0.31 (0.014) 0.34 (0.064) 0.32 (0.023) 0.31 (0.032) 0.23 (0.036) 0.26 (0.018) 0.2
Automated catalog ................................................................. 87.2 (0.71) 87.5 (0.94) 57.1 (6.87) 86.6 (1.56) 91.6 (1.55) 94.4 (1.62) 90.6 (1.08) 79.6Automated circulation system ................................................ 89.5 (0.68) 89.9 (0.87) 57.1 (6.78) 89.4 (1.35) 94.8 (1.19) 95.0 (1.84) 92.6 (0.98) 83.0Media retrieval system1.......................................................... 34.9 (1.05) 35.9 (1.33) 10.6 (4.72) 29.3 (1.62) 43.9 (2.68) 53.7 (3.51) 35.1 (1.66) 32.8Connection to Internet ........................................................... Digital video disc (DVD) player/video cassette
96.7 (0.40) 96.5 (0.51) 81.0 (5.95) 96.9 (0.55) 98.0 (0.53) 98.5 (0.70) 98.6 (0.51) 96.
recorder(VCR) ................................................................. 87.2 (0.77) 86.7 (1.02) 80.0 (5.53) 86.3 (1.27) 87.4 (1.71) 89.1 (2.21) 89.6 (1.00) 87.3Disability assistance technologies, such as TDD...................
Percent of libraries/media centers with certain services
23.9 (1.05) 23.0 (1.33) 14.7 (3.85) 20.2 (1.68) 24.6 (2.08) 33.1 (3.20) 26.4 (1.34) 18.4
Students permitted to check out laptops................................ 27.5 (1.02) 26.9 (1.27) 22.5 (6.15) 25.7 (1.72) 27.0 (2.23) 32.4 (3.13) 29.8 (1.34) 29.2Staff permitted to check out laptops ...................................... 45.9 (1.07) 45.2 (1.35) 30.7 (6.44) 42.4 (1.97) 48.4 (2.83) 54.6 (4.01) 50.1 (1.50) 46.3
Number of library computer workstations per 100 students ...........
Average holdings per 100 students at the end of the school year2
2.6 (0.05) 2.5 (0.07) 8.8 (1.24) 3.2 (0.13) 2.1 (0.10) 1.7 (0.11) 2.9 (0.06) 5.9
Books (number of volumes) ................................................... 2,015 (30.5) 2,316 (40.2) 6,384 (531.1) 2,993 (67.3) 2,117 (45.7) 1,559 (85.2) 1,432 (36.6) 3,203Audio and video materials......................................................
Average additions per 100 students during the school year2
90 (3.8) 93 (5.6) 157 (36.7) 105 (5.9) 89 (6.2) 82 (16.1) 81 (5.2) 132
Books (number of volumes) ................................................... 95.3 (2.21) 113.3 (3.26) 247.0 (38.53) 134.9 (5.28) 106.4 (5.76) 89.6 (6.32) 62.1 (2.67) 124.8Audio and video materials...................................................... 5.4 (0.49) 5.9 (0.77) 7.6 (2.14) 5.7 (0.44) 4.9 (0.55) 7.1 (2.47) 4.5 (0.41) 6.4
Total expenditures for library/media materials per pupil2.3 ................ $16.11 (0.461) $16.18 (0.591) $43.28 (11.551) $18.49 (0.700) $14.63 (0.799) $14.11 (1.496) $15.90 (0.647) $27.86Books..................................................................................... 11.40 (0.291) 11.99 (0.389) 21.99 (4.023) 13.80 (0.539) 11.25 (0.679) 10.23 (0.836) 10.26 (0.504) 17.30Audio and video materials...................................................... 1.08 (0.055) 1.06 (0.088) 1.90 (0.967) 1.24 (0.154) 0.88 (0.082) 1.01 (0.180) 1.11 (0.054) 1.57
†Not applicable. NOTE: Total includes combined elementary/secondary scho1Centralized video distribution equipment with a scheduling and control server that telecasts video to classrooms. of rounding. Standard errors appear in parentheses. 2Average holdings, acquisitions, and expenditures are from the prior school year, while enrollment counts are from the current SOURCE: U.S. Department of Education, National Center school year. “Public School Library Media Center Questionnaire,” 2007–03Includes other expenditures not separately shown.
DIG
ES
T O
F E
DU
CA
TIO
N S
TA
TIS
TIC
S 2
00
9
CH
AP
TE
R 7
: Lib
rarie
s an
d E
du
catio
na
l Te
chn
olo
gy
60
9
Lib
rarie
s
Books mber of
Books (number of
olumes) volumes) Total Number d at end acquired during expenditure of computer year per tudents3
year per 100 students3
for materials per student3
workstations per 100 students
10 11 12 13
(30.5) 95 (2.2) $16.1 (0.46) 2.6 (0.05) (93.3) 105 (7.0) 19.3 (2.10) 2.4 (0.20)
(316.7) 114 (14.0) 12.8 (1.09) 3.0 (0.36) (162.3) 101 (11.7) 12.7 (1.07) 2.5 (0.29) (449.9) 106 (11.5) 17.0 (1.12) 2.5 (0.21) (144.3) 79 (11.1) 13.0 (1.92) 1.6 (0.14) (107.1) 96 (8.1) 15.4 (1.17) 4.0 (0.42) (111.6) 100 (6.9) 18.9 (1.16) 3.5 (0.22)
(70.8) 74 (7.1) 10.7 (0.93) 2.8 (0.29) (245.8) 228 (36.3) 23.2 (4.09) 2.7 (0.27) (73.4) 77 (7.5) 13.3 (1.01) 2.5 (0.21) (91.0) 90 (12.6) 15.4 (1.75) 2.0 (0.14)
(116.8) 91 (8.5) 11.6 (0.81) 2.4 (0.20) (117.8) 79 (21.0) 11.0 (0.99) 2.9 (0.25) (109.1) 95 (10.1) 14.1 (1.05) 2.9 (0.27) (116.8) 96 (12.9) 16.2 (1.36) 2.6 (0.32) (145.2) 104 (8.9) 15.2 (1.60) 5.0 (0.59) (341.8) 124 (15.0) 22.5 (5.96) 3.4 (0.75) (118.4) 114 (21.9) 17.5 (3.45) 2.6 (0.28) (147.8) 101 (17.9) 17.3 (3.18) 2.6 (0.25) (343.9) 168 (24.8) 27.9 (1.74) 2.8 (0.36) (84.4) 88 (9.9) 19.6 (3.04) 2.9 (0.39)
(123.1) 75 (6.8) 12.1 (1.11) 2.8 (0.24) (135.7) 62 (6.2) 9.0 (0.74) 4.7 (0.40) (136.2) 108 (9.8) 16.2 (1.46) 4.7 (0.40) (158.4) 143 (36.7) 18.5 (5.42) 2.2 (0.17)
(89.7) 141 (12.4) 25.5 (2.16) 2.9 (0.25) (154.3) 153 (11.4) 24.7 (3.25) 4.1 (0.25) (208.8) 103 (8.2) 20.0 (1.52) 5.5 (0.75)
(70.4) 107 (13.8) 14.0 (1.81) 1.5 (0.10) (101.1) 111 (7.1) 26.0 (2.17) 2.6 (0.17) (129.6) 70 (11.7) 14.3 (1.33) 2.6 (0.31) (117.6) 173 (32.3) 25.6 (7.14) 2.4 (0.23) (171.0) 97 (10.4) 16.8 (1.94) 2.6 (0.54) (104.2) 98 (7.4) 16.4 (1.29) 2.6 (0.23) (397.6) 166 (24.0) 22.2 (1.86) 3.2 (0.37) (165.7) 76 (14.5) 13.5 (3.02) 2.7 (0.29)
(98.0) 105 (11.5) 17.8 (1.33) 2.9 (0.22) (340.0) 103 (19.1) 11.9 (1.33) 3.8 (0.37) (132.0) 90 (9.1) 17.4 (2.10) 2.5 (0.21)
(85.1) 80 (8.7) 13.6 (1.14) 2.7 (0.27) (70.4) 99 (8.3) 17.9 (1.33) 2.3 (0.11)
(221.1) 155 (17.8) 28.1 (3.71) 3.1 (0.22) (146.7) 75 (8.2) 12.1 (0.97) 2.2 (0.23) (107.2) 99 (11.5) 18.7 (2.69) 2.0 (0.15) (137.5) 93 (11.3) 14.7 (1.79) 2.0 (0.20) (307.4) 171 (17.5) 32.5 (2.88) 3.5 (0.73)
(70.6) 104 (6.1) 18.4 (1.62) 2.3 (0.24) (108.6) 98 (11.7) 12.0 (0.95) 3.0 (0.21) (207.0) 61 (6.8) 8.6 (0.46) 3.6 (0.33) (140.3) 180 (14.0) 35.6 (2.07) 4.6 (0.36) (170.5) 145 (27.1) 25.2 (2.34) 5.2 (0.34)
for Education Statistics, Schools and Staffing Survey (SASS), 8. (This table was prepared November 2009.)
Table 421. Selected statistics on public school libraries/media centers, by state: 2007–08
Percent of libraries/media centers offering selected services/equipment
(nuLaptops for Laptops for student use staff use Average v
outside outside number of staff hel
State Automated
catalog Automated
circulation system of library/
media center of library/
media center Media
retrieval system1 Connection to
the Internet DVD player/VCR per library/
media center2 of
100 s
1 2 3 4 5 6 7 8 9
United States ........................ 87.2 (0.71) 89.5 (0.68) 27.5 (1.02) 45.9 (1.07) 34.9 (1.05) 96.7 (0.40) 87.2 (0.77) 1.7 (0.02) 2,015 Alabama ........................................ 91.5 (3.03) 95.0 (2.23) 30.2 (5.01) 55.3 (5.27) 29.4 (4.74) 99.3 (0.86) 96.4 (2.30) 1.8 (0.07) 1,888 Alaska............................................ 72.4 (5.91) 67.8 (6.19) 32.0 (5.22) 37.8 (5.18) 18.9 (4.88) 83.9 (5.78) 68.7 (6.94) 1.1 (0.08) 3,427 Arizona .......................................... 79.6 (4.05) 82.6 (3.83) 25.9 (6.26) 36.5 (7.11) 46.4 (4.46) 96.8 (2.72) 87.4 (4.50) 1.8 (0.15) 2,083 Arkansas........................................ 89.0 (3.88) 94.9 (2.67) 18.2 (4.04) 40.8 (4.96) 36.8 (3.99) 98.6 (1.54) 90.2 (2.96) 1.6 (0.06) 2,353 California ....................................... 85.2 (2.97) 92.2 (2.09) 11.1 (2.28) 29.5 (3.74) 17.9 (3.32) 95.6 (1.76) 65.1 (4.29) 1.4 (0.06) 1,740 Colorado ........................................ 95.6 (3.03) 90.4 (3.64) 29.2 (5.71) 49.3 (6.34) 27.7 (5.15) 98.2 (2.35) 88.6 (4.65) 1.9 (0.19) 2,102 Connecticut.................................... 83.8 (4.46) 83.9 (4.60) 21.4 (4.02) 33.7 (5.29) 27.9 (4.71) 97.4 (1.88) 89.0 (3.79) 1.9 (0.09) 2,252 Delaware........................................ 93.8 (2.10) 95.0 (1.61) 26.1 (5.10) 44.8 (6.25) 20.5 (4.63) 97.2 (1.04) 87.3 (3.38) 1.4 (0.06) 1,849 District of Columbia ....................... 57.4 (6.15) 68.8 (5.03) 13.5 (3.54) 26.6 (5.16) 21.2 (3.69) 89.2 (2.81) 73.2 (4.87) 1.0 (0.07) 2,048 Florida............................................ 94.5 (2.07) 94.3 (2.18) 19.2 (3.20) 64.1 (4.58) 67.5 (3.78) 99.4 (0.63) 90.7 (2.75) 1.9 (0.06) 1,576 Georgia.......................................... 98.5 (1.08) 98.5 (1.08) 36.6 (5.48) 66.1 (5.26) 81.4 (4.65) 99.6 (0.37) 97.8 (1.59) 2.1 (0.06) 1,745 Hawaii ............................................ 96.5 (1.70) 97.5 (1.83) 17.9 (4.91) 39.5 (6.01) 44.4 (7.30) 97.8 (1.51) 84.1 (3.63) 1.6 (0.09) 2,296 Idaho.............................................. 82.7 (6.15) 87.6 (6.43) 20.0 (5.61) 26.8 (5.52) 28.4 (4.88) 91.8 (5.12) 83.0 (5.98) 1.6 (0.10) 2,141 Illinois............................................. 77.1 (4.90) 81.9 (4.94) 32.6 (4.77) 51.0 (5.18) 21.4 (4.58) 92.2 (3.87) 87.8 (3.35) 1.9 (0.11) 2,039 Indiana........................................... 89.0 (5.40) 89.0 (4.77) 34.3 (5.42) 51.1 (5.48) 35.6 (6.33) 95.4 (3.32) 94.4 (3.78) 1.9 (0.20) 2,172 Iowa ............................................... 83.2 (4.98) 90.5 (4.28) 39.7 (5.70) 45.5 (6.80) 18.3 (4.87) 98.2 (1.96) 92.6 (5.05) 1.9 (0.09) 2,524 Kansas........................................... 91.7 (4.37) 91.1 (3.91) 54.4 (7.94) 58.9 (8.22) 23.4 (7.24) 94.6 (3.52) 94.0 (3.52) 1.9 (0.08) 3,224 Kentucky ........................................ 90.9 (4.25) 92.4 (4.35) 27.1 (6.60) 49.8 (7.47) 71.1 (7.52) 95.6 (2.87) 94.0 (2.67) 1.7 (0.13) 2,000 Louisiana ....................................... 84.5 (6.24) 87.2 (5.66) 21.6 (5.22) 42.9 (5.93) 26.0 (4.74) 97.0 (2.56) 89.4 (4.92) 1.2 (0.09) 2,010 Maine............................................. 73.8 (7.69) 71.5 (7.04) 43.2 (6.23) 45.5 (7.18) 9.5 (4.33) 88.4 (5.64) 73.4 (7.00) 1.7 (0.13) 3,650 Maryland........................................ 91.4 (4.01) 99.5 (0.42) 32.2 (8.51) 53.6 (8.02) 54.0 (5.29) 97.4 (2.40) 90.6 (4.39) 1.5 (0.19) 1,635 Massachusetts............................... 75.0 (5.55) 74.7 (5.54) 32.6 (5.04) 33.7 (4.82) 18.2 (4.01) 98.2 (1.18) 80.3 (4.67) 1.3 (0.08) 1,868 Michigan ........................................ 83.4 (4.39) 90.6 (3.91) 33.6 (6.07) 49.3 (6.01) 48.8 (5.94) 99.8 (0.22) 92.8 (2.70) 1.5 (0.09) 2,136 Minnesota ...................................... 92.2 (2.68) 93.6 (2.39) 32.7 (4.35) 60.1 (4.46) 39.3 (3.88) 96.4 (1.90) 97.5 (0.89) 2.0 (0.08) 2,475 Mississippi ..................................... 75.8 (4.10) 85.6 (3.44) 20.0 (3.76) 45.6 (4.79) 31.6 (5.01) 95.5 (2.25) 88.6 (3.39) 1.5 (0.08) 1,778 Missouri ......................................... 93.9 (2.84) 92.8 (2.99) 18.3 (5.71) 35.6 (6.32) 20.6 (4.04) 98.4 (1.09) 96.0 (2.61) 1.7 (0.10) 2,439 Montana......................................... 71.0 (3.93) 74.3 (3.31) 27.4 (3.76) 43.5 (4.84) 12.5 (3.15) 87.5 (3.51) 85.4 (2.88) 1.6 (0.07) 3,282 Nebraska ....................................... 83.1 (5.27) 82.0 (6.04) 42.7 (5.60) 50.9 (5.57) 29.8 (5.94) 93.2 (3.63) 96.8 (2.50) 1.9 (0.10) 3,063 Nevada .......................................... 84.8 (5.44) 93.1 (3.81) 21.1 (4.59) 32.8 (4.81) 60.5 (5.58) 97.9 (2.90) 83.5 (4.20) 1.6 (0.07) 1,695 New Hampshire ............................. 84.6 (3.76) 83.7 (3.86) 45.5 (4.96) 44.9 (4.72) 8.0 (2.06) 97.4 (2.07) 91.8 (3.30) 1.8 (0.07) 2,314 New Jersey .................................... 78.2 (7.17) 84.2 (5.37) 29.2 (9.32) 42.2 (11.24) 26.8 (6.91) 93.9 (4.35) 82.7 (6.87) 1.6 (0.11) 2,002 New Mexico ................................... 77.8 (8.20) 83.2 (8.38) 18.6 (7.36) 38.8 (9.01) 18.1 (4.91) 93.1 (7.64) 90.7 (7.64) 1.4 (0.14) 2,238 New York........................................ 79.9 (6.10) 77.5 (6.36) 27.3 (7.74) 41.1 (7.07) 17.4 (5.51) 96.9 (4.34) 82.6 (5.87) 1.9 (0.09) 1,912 North Carolina ............................... 97.4 (1.59) 97.5 (1.65) 25.8 (6.12) 71.9 (6.73) 60.8 (5.62) 97.4 (1.63) 99.1 (0.56) 1.9 (0.08) 1,874 North Dakota ................................. 72.3 (4.82) 66.6 (5.05) 40.5 (4.54) 47.7 (4.79) 13.0 (2.48) 97.9 (1.25) 77.6 (4.19) 1.6 (0.10) 3,876 Ohio ............................................... 90.0 (3.87) 91.1 (3.98) 22.9 (5.27) 37.1 (6.20) 36.4 (6.17) 98.1 (1.89) 83.4 (5.00) 1.5 (0.11) 1,864 Oklahoma ...................................... 80.7 (3.68) 86.3 (2.52) 25.7 (3.19) 42.8 (4.07) 19.0 (3.02) 96.2 (2.88) 95.1 (1.73) 1.9 (0.06) 2,152 Oregon........................................... 77.8 (6.25) 82.2 (6.12) 35.2 (5.53) 47.0 (6.38) 27.3 (5.19) 98.5 (1.47) 89.7 (5.89) 1.8 (0.18) 3,041 Pennsylvania.................................. 91.4 (4.74) 91.4 (4.74) 28.8 (5.44) 37.3 (6.87) 30.1 (6.19) 98.6 (1.37) 77.2 (4.60) 1.8 (0.11) 2,054 Rhode Island ................................. 86.4 (5.24) 90.0 (4.37) 17.4 (5.86) 31.3 (6.21) 12.6 (4.16) 96.2 (2.74) 85.8 (5.21) 1.7 (0.08) 1,705 South Carolina............................... 97.6 (1.16) 98.3 (1.17) 37.1 (3.96) 72.9 (3.44) 81.1 (2.96) 99.2 (0.80) 92.7 (2.20) 2.0 (0.03) 1,859 South Dakota ................................. 68.9 (5.38) 72.1 (5.31) 31.6 (4.34) 34.4 (4.40) 13.6 (2.86) 88.7 (3.26) 86.5 (3.67) 1.6 (0.10) 3,321 Tennessee ..................................... 90.3 (3.58) 94.3 (3.10) 24.6 (5.69) 41.1 (6.47) 32.5 (5.37) 98.0 (2.35) 88.2 (4.84) 1.6 (0.08) 1,788 Texas ............................................. 95.9 (1.55) 96.1 (1.58) 30.6 (6.46) 48.8 (6.29) 43.4 (7.18) 98.8 (0.78) 91.5 (3.46) 1.8 (0.07) 1,910 Utah ............................................... 92.6 (5.21) 92.3 (5.98) 10.6 (2.95) 31.6 (5.61) 41.7 (5.16) 93.5 (2.27) 93.2 (4.32) 1.6 (0.12) 1,554 Vermont ......................................... 80.0 (8.05) 77.2 (7.68) 46.6 (9.17) 52.0 (10.37) 10.5 (5.88) 97.9 (3.26) 92.1 (4.91) 1.7 (0.10) 3,828 Virginia........................................... 94.9 (1.92) 96.6 (1.41) 47.1 (4.69) 68.8 (3.91) 56.4 (4.08) 98.4 (0.99) 98.2 (1.20) 2.0 (0.06) 1,840 Washington.................................... 86.0 (3.87) 91.5 (3.27) 21.0 (4.38) 41.5 (4.92) 36.7 (5.18) 93.8 (2.62) 86.2 (3.43) 1.8 (0.17) 2,282 West Virginia.................................. 61.3 (5.64) 64.4 (5.86) 20.5 (3.13) 37.0 (4.37) 25.2 (4.49) 93.0 (2.97) 78.3 (4.83) 0.9 (0.04) 1,881 Wisconsin ...................................... 94.5 (2.89) 94.1 (3.33) 24.7 (3.97) 46.9 (5.59) 30.2 (5.26) 94.5 (3.45) 97.5 (2.00) 2.1 (0.09) 2,894 Wyoming........................................ 87.3 (3.87) 92.0 (3.46) 35.6 (3.87) 39.6 (4.19) 16.8 (3.12) 97.1 (1.98) 89.7 (2.75) 1.7 (0.09) 3,481
1Centralized video distribution equipment with a scheduling and control server that telecasts video to classrooms. NOTE: Standard errors appear in parentheses. 2Includes professional and nonprofessional staff. SOURCE: U.S. Department of Education, National Center 3Average holdings, acquisitions, and expenditures are from the prior school year, while enrollment counts are from the current “Public School Library Media Center Questionnaire,” 2007–0school year.
610 CHAPTER 7: Libraries and Educational Technology Libraries
Table 422. Collections, staff, and operating expenditures of degree-granting institution libraries: Selected years, 1976–77 through 2005–06
Collections, staff, and operating expenditures 1976–771 1981–82 1984–85 1987–88 1991–92 1994–95 1996–97 1997–98 1999–2000 2001–02 2003–04 2005–06
1 2 3 4 5 6 7 8 9 10 11 12 13
Number of libraries .............................................. Number of circulation transactions (in thousands)
Enrollment (in thousands).................................... Total enrollment2 .............................................. Full-time-equivalent enrollment2 ......................
Collections (in thousands) Number of volumes at end of year................... Number of volumes added during year............ Number of serial subscriptions at end of year . Microform units at end of year ......................... Electronic units at end of year5 ........................
Full-time-equivalent (FTE) library staff Total staff in regular positions6 .........................
Librarians and professional staff .................. Other paid staff ............................................ Contributed services ....................................
Student assistants ........................................... FTE student enrollment per FTE staff member Hours of student and other assistance
(in thousands) ............................................
Library operating expenditures7
Total operating expenditures (in thousands) .... Salaries8,9,10.................................................. Hourly wages ............................................... Fringe benefits ............................................. Preservation................................................. Furniture/equipment..................................... Computer hardware/software....................... Bibliographic utilities/networks/consortia ..... Information resources ..................................
Books and serial backfiles—paper ........... Books and serial backfiles—electronic..... Current serials—paper ............................. Current serials—electronic ....................... Audiovisual materials ............................... Document delivery/interlibrary loan.......... Other collection expenditures ...................
Other library operating expenditures............ Operating expenditures per FTE student......... Operating expenditures per FTE student in
constant 2007–08 dollars11 ........................
Operating expenditures (percentage distribution). Salaries8,9,10.................................................. Hourly wages ............................................... Fringe benefits ............................................. Preservation................................................. Information resources .................................. Other12 .........................................................
Library operating expenditures as percent of total institutional expenditures for educational and general purposes.............
3,058 —
11,121 8,313
481,442 22,367 4,670
— —
57,087 23,308 33,779
— —
146
39,950
$1,259,637 698,090 68,683
(9) 22,521
— — —
373,699 — — — — — —
373,699 96,643
152
559
100.0 55.4 5.5 (9)
1.8 29.7 7.7
3.8
3,104 —
12,372 9,015
567,826 19,507 4,890
— —
58,476 23,816 34,660
— —
154
40,068
$1,943,769 1,081,894
100,847 (9)
30,351 — — —
561,199 — — — — — —
561,199 169,478
216
496
100.0 55.7 5.2 (9)
1.6 28.9 8.7
3.5
3,322 —
12,242 8,952
631,727 20,658 6,317
— —
58,476 21,822 38,026
— —
153
28,360
$2,404,524 1,156,138
(10) 231,209 32,939
— — —
750,282 — — — — — —
750,282 233,957
269
550
100.0 48.1 (10) 9.6 1.4
31.2 9.7
3.4
3,438 —
12,767 9,230
718,504 21,907 6,416
— —
67,251 25,115 40,733 1,403
33,821 137
—
$2,770,075 1,451,551
(10) —
34,144 — — —
891,281 — — — — — —
891,281 393,099
300
561
100.0 52.4 (10) —
1.2 32.2 14.2
3.2
3,274 —
14,359 10,361
749,429 20,982 6,966
— —
67,166 26,341 40,421
404 29,075
154
—
$3,648,654 1,889,368
(10) (9)
43,126 — — —
1,197,293 — — — —
23,879 —
1,173,414 518,867
352
552
100.0 51.8 (10) (9)
1.2 32.8 14.2
3.0
3,303 231,503
14,279 10,348
776,447 21,544 6,212
— 465
67,433 26,726 40,381
326 28,411
153
—
$4,013,333 2,021,233
(10) (9)
46,554 55,915
128,128 81,106
1,348,933 — — — —
28,753 12,238
1,307,942 331,463
388
559
100.0 50.4 (10) (9)
1.2 33.6 14.9
2.8
3,408 230,733
14,300 10,402
806,717 21,346 5,709
— 983
67,581 27,268 40,022
291 27,998
154
—
$4,301,815 2,147,842
(10) (9)
45,610 56,128
157,949 85,113
1,499,249 — — — —
28,879 17,645
1,452,725 309,925
414
564
100.0 49.9 (10) (9)
1.1 34.9 14.2
—
3,658 216,067
14,502 10,615
878,906 3
24,551 10,908 4
1,062,082 3,473
68,337 30,041 38,026
270 28,373
155
—
$4,592,657 2,314,380
(10) (9)
42,919 57,013
164,379 89,618
1,600,995 514,048 28,061
849,399 125,470 30,623 19,309 34,086
323,354 433
580
100.0 50.4 (10) (9)
0.9 34.9 13.8
—
3,527 193,948
14,791 10,944
913,547 24,436 7,499
1,111,389 —
69,123 31,001 37,893
229 26,518
158
—
$5,023,198 2,430,541
(10) 271,954 43,832 63,459
160,294 90,264
1,822,277 552,100 33,888
945,958 203,371 32,039 20,540 34,381
140,579 459
587
100.0 48.4 (10) 5.4 0.9
36.3 9.0
—
3,568 189,248
15,928 11,766
954,030 24,574 9,855
1,143,678 —
69,526 32,053 37,473
— 25,305
169
—
$5,416,716 2,753,404
(10) (9)
46,499 —
155,791 92,242
1,944,490 563,007 44,792
926,105 297,657 37,041 22,913 52,976
424,290 460
560
100.0 50.8 (10) (9)
0.9 35.9 12.4
—
3,653 200,204
16,911 12,688
982,590 24,615 12,764
1,173,287 —
69,047 32,280 36,767
— 25,038
184
—
$5,751,247 2,913,221
(10) (9)
42,976 —
143,042 101,293
2,114,555 550,599 65,597
883,534 480,138 35,216 24,823 74,648
436,160 453
528
100.0 50.7 (10) (9)
0.7 36.8 11.8
—
3,617 187,236
17,487 13,201
1,015,658 22,241 16,361
1,166,295 —
93,590 33,265 36,350
— 23,976
141
—
$6,234,192 3,102,561
(10) (9)
41,102 —
153,002 106,268
2,375,485 572,228
93,778830,137 691,585 39,02926,51381,113
496,877 472
514
100.0 49.8
(10) (9)
0.7 38.1 12.1
—
—Not available. 1Includes data for U.S. territories. 2Fall enrollment for the academic year specified. 3Includes data for schools newly added to the survey system, so end of year figure for 1997–98 exceeds total of volumes added during the year plus end of year value from 1996–97. 4Includes microform and electronic serials. 5Electronic files, formerly labeled “Computer files.” 6Excludes student assistants. 7Excludes capital outlay. 8Includes salary equivalents of contributed services staff. 9Expenditures for fringe benefits included under salaries (except for 1984–85, 1987–88, and 1999–2000). 10Hourly wages included under salaries (except for 1976–77 and 1981–82). 11Constant dollars based on the Consumer Price Index, prepared by the Bureau of Labor Statistics, U.S. Department of Labor, adjusted to a school-year basis.
12Includes furniture/equipment, computer hardware/software, and utilities/networks/consor-tia as well as expenditures classified as “other library operating expenditures.” NOTE: Data through 1995 are for institutions of higher education, while later data are for degree-granting institutions. Degree-granting institutions grant associate’s or higher degrees and participate in Title IV federal financial aid programs. The degree-granting classification is very similar to the earlier higher education classification, but it includes more 2-year colleges and excludes a few higher education institutions that did not grant degrees. (See Appendix A: Guide to Sources for details.) Detail may not sum to totals because of rounding. SOURCE: U.S. Department of Education, National Center for Education Statistics, Library Statistics of Colleges and Universities, selected years, 1976–77 through 1984–85; 1987–88 through 2005–06 Integrated Postsecondary Education Data System, “Academic Libraries Survey” (IPEDS-L:88–98), “Fall Enrollment Survey” (IPEDS-EF:87–99), and Spring 2002 through Spring 2006; Academic Libraries Survey (ALS), 2000 through 2006; and Academic Libraries: 2006 (NCES 2008-337). (This table was prepared July 2008.)
DIGEST OF EDUCATION STATISTICS 2009

CHAPTER 7: Libraries and Educational Technology 611 Libraries
Table 423. Collections, staff, and operating expenditures of the 60 largest college and university libraries: 2005–06
Institution
Rank order, by number of volumes
Number of volumes
at end of year (in
thousands)
Number of e-books at
end of year
Number of serials at
end of year
Full-time-equivalent staff Operating expenditures
(in thousands) Public service
hours per week
Gate count per week
Reference transactions
per week Total Librarians Total Salaries
and wages
1 2 3 4 5 6 7 8 9 10 11 12
Harvard University (MA)......................................... 1 15,827 867 98,988 1,265 420 $105,809 $58,047 168 38,945 5,554 Yale University (CT) ................................................ 2 12,369 167,205 73,953 706 170 74,938 31,304 111 14,599 1,958 University of Illinois at Urbana-Champaign........... 3 10,371 247,242 63,413 503 99 35,602 19,151 119 84,639 5,264 University of California, Berkeley ........................... 4 10,094 — 114,860 531 96 50,253 26,035 98 27,000 3,300 University of Texas at Austin................................... 5 9,022 — 53,125 536 100 41,586 19,810 107 71,992 6,149
Columbia University in the City of NY ................... 6 8,832 342,573 102,901 618 139 51,901 26,064 107 72,484 3,579 Stanford University (CA)......................................... 7 8,402 365,000 30,850 697 149 74,233 40,958 105 19,500 2,203 University of Michigan, Ann Arbor ......................... 8 8,273 1,028,674 118,654 574 158 49,053 23,204 168 72,696 2,711 University of California, Los Angeles..................... 9 8,157 24,299 77,509 622 125 50,894 26,271 97 69,736 1,975 University of Wisconsin, Madison.......................... 10 8,015 502,514 68,560 577 233 40,962 22,381 148 108,354 —
Cornell University (NY)........................................... 11 7,521 298,767 77,392 552 116 42,156 21,197 144 101,159 2,047 University of Chicago (IL) ....................................... 12 7,462 304,016 86,239 318 66 32,301 11,635 144 25,062 802 Indiana University, Bloomington............................. 13 7,242 237,835 71,330 486 97 32,453 14,313 168 87,561 2,346 University of Washington, Seattle Campus .......... 14 6,677 280,140 60,629 463 135 35,218 18,234 142 136,000 2,056 Princeton University (NJ)........................................ 15 6,618 222,911 41,775 397 97 41,714 17,639 115 11,777 910
University of Minnesota, Twin Cities ...................... 16 6,587 126,892 88,309 408 93 38,322 17,470 100 41,521 3,024 University of North Carolina at Chapel Hill............ 17 5,817 236 54,591 436 139 34,489 16,203 145 77,538 2,489 Ohio State University, Main Campus..................... 18 5,765 188,722 36,813 435 82 32,966 15,155 168 52,357 6,312 Duke University (NC).............................................. 19 5,665 26,000 57,223 359 113 33,532 14,598 137 62,999 2,635 University of Pennsylvania ..................................... 20 5,571 309,277 47,787 393 120 34,369 15,215 111 36,300 5,000
New York University................................................ 21 5,145 769,197 62,537 451 125 41,004 18,186 119 42,795 2,676 University of Virginia, Main Campus ..................... 22 5,103 270,603 71,832 373 97 30,273 15,703 149 78,134 3,225 Pennsylvania State U., Penn State Main Campus 23 5,070 18,200 71,230 611 124 48,878 23,496 168 40,417 3,830 University of Arizona............................................... 24 5,050 441,889 23,288 237 61 22,547 8,931 168 42,133 659 Rutgers University, New Brunswick/Piscataway... 25 5,003 176,995 40,848 321 68 23,161 12,831 105 47,280 1,408
University of Pittsburgh, Main Campus (PA)......... 26 4,909 224,216 50,232 362 120 30,357 11,869 118 83,242 3,565 University of Kansas, Main Campus ..................... 27 4,756 109,272 40,989 258 61 18,300 8,667 140 34,433 1,996 Michigan State University....................................... 28 4,736 53,101 35,994 271 69 22,260 10,046 138 41,594 773 Northwestern University (IL) .................................. 29 4,688 39,035 45,259 339 94 26,335 12,068 119 26,058 1,638 University of Iowa.................................................... 30 4,551 324,934 51,374 278 79 25,666 11,335 115 36,630 1,647
University of Oklahoma, Norman Campus........... 31 4,346 363,116 34,404 153 37 14,444 4,048 117 21,015 640 University of Georgia.............................................. 32 4,346 84,423 37,226 294 71 23,014 9,487 110 17,735 1,910 University of Florida ................................................ 33 4,168 273,671 85,169 431 99 27,435 12,339 111 28,421 5,736 University of Southern California........................... 34 3,969 287,712 60,718 375 68 31,894 14,534 159 55,000 1,100 Arizona State University at the Tempe Campus... 35 3,896 281,588 30,925 274 72 22,044 9,742 149 73,892 2,317
Johns Hopkins University (MD) ............................. 36 3,773 1,488,106 60,858 342 78 31,560 13,369 120 18,982 1,593 Washington University in St. Louis (MO) .............. 37 3,750 197,298 41,339 311 105 37,908 12,923 120 35,000 1,632 University of Tennessee ......................................... 38 3,735 266,279 35,265 354 123 29,754 11,944 138 39,332 1,743 University of Maryland, College Park.................... 39 3,690 200,000 32,777 304 145 25,284 11,195 162 54,935 4,550 University of Colorado at Boulder.......................... 40 3,641 40,677 30,221 212 52 19,210 8,252 104 2,051 2,391
University of Rochester (NY).................................. 41 3,607 13,056 26,760 214 91 18,122 8,231 119 4,196 922 Brigham Young University (UT) ............................. 42 3,594 144,910 30,895 380 84 23,943 11,177 105 82,860 3,580 Brown University (RI).............................................. 43 3,569 743,698 40,082 208 53 18,945 8,648 154 17,301 466 University of South Carolina, Columbia ................ 44 3,533 691 58,855 277 68 20,422 7,837 152 20,000 3,350 University of Delaware............................................ 45 3,471 317,560 12,532 207 52 16,937 7,199 100 19,138 2,052
Louisiana State U. and A&M College.................... 46 3,468 191,428 13,225 212 54 13,454 5,250 100 41,900 896 Wayne State University (MI)................................... 47 3,443 55,429 23,693 267 55 19,054 8,812 168 39,134 1,052 SUNY at Buffalo...................................................... 48 3,423 103,905 37,288 249 67 19,454 9,965 141 25,000 977 University of Hawaii at Manoa................................ 49 3,413 87,557 156,425 230 66 18,181 8,521 94 27,714 1,732 University of Kentucky ............................................ 50 3,406 226,680 31,897 263 85 19,569 8,009 140 60,367 1,955
University of California, Santa Barbara ................. 51 3,353 102,925 42,219 238 45 17,131 7,731 103 37,632 1,946 University of New Mexico, Main Campus ............. 52 3,340 195,522 18,143 299 72 21,484 — 103 39,631 1,783 North Carolina State University at Raleigh........... 53 3,301 278,271 49,480 276 94 22,409 10,033 146 33,325 1,103 Texas A&M University............................................. 54 3,300 280,779 45,806 367 91 28,372 11,077 142 47,114 866 University of Missouri, Columbia ........................... 55 3,295 25,386 36,244 211 57 14,414 6,051 110 42,000 1,730
University of California, Davis ................................ 56 3,258 402,112 41,921 254 54 18,509 8,776 95 33,245 1,289 University of Oregon............................................... 57 3,255 230,970 23,186 208 42 13,739 6,921 107 40,581 2,123 University of Notre Dame (IN)................................ 58 3,247 7,443 21,622 261 59 21,694 9,540 126 18,853 574 University of California, San Diego........................ 59 3,236 142,804 24,438 337 58 25,400 13,571 113 65,659 1,477 University of Cincinnati, Main Campus ................. 60 3,209 155,744 42,265 213 51 24,203 10,072 105 29,876 2,241
—Not available. SOURCE: U.S. Department of Education, National Center for Education Statistics, Aca-demic Libraries Survey (ALS), 2006. (This table was prepared July 2008.)
DIGEST OF EDUCATION STATISTICS 2009
612 CHAPTER 7: Libraries and Educational Technology Libraries
Table 424. Public libraries, books and serial volumes, library visits, circulation, and reference transactions, by state: Fiscal years 2006 and 2007
State
Number of public libraries
Number of books and serial volumes Library visits per capita1
Circulation per capita
Reference transactions per capita2In thousands Per capita
2006 2007 2006 2007 2006 2007 2006 2007 2006 2007 2006 2007
1 2 3 4 5 6 7 8 9 10 11 12 13
United States ......................................... Alabama .....................................................
9,208 3 9,214 3 807,246 812,483 2.8 2.8 4.8 4.9 7.3 7.4 1.0 1.0 206 208 9,357 9,495 2.1 2.2 3.3 3.6 4.2 4.4 0.8 0.8
Alaska......................................................... 90 87 2,387 2,445 3.6 3.6 5.2 5.1 6.2 6.3 0.6 0.5 Arizona ....................................................... 89 83 8,930 9,145 1.5 1.5 3.8 3.9 6.8 7.1 0.9 0.7 Arkansas..................................................... 48 48 6,170 6,224 2.3 2.3 3.4 3.5 4.6 4.7 0.7 0.7 California .................................................... 179 181 73,706 74,961 2.0 2.0 4.1 4.2 5.3 5.4 0.9 0.8
Colorado ..................................................... 115 115 11,719 11,728 2.5 2.5 6.2 6.2 11.2 11.4 1.2 1.2 Connecticut................................................. 194 195 15,658 15,528 4.5 4.4 6.5 6.5 9.0 9.0 1.3 1.3 Delaware..................................................... 21 21 1,933 1,921 2.5 2.5 5.5 5.6 9.7 10.0 0.7 0.7 District of Columbia .................................... 1 1 2,172 2,097 3.7 3.6 3.1 3.7 2.1 2.5 1.7 1.4 Florida......................................................... 78 79 32,554 31,995 1.8 1.7 4.1 4.2 5.6 5.9 1.3 1.5
Georgia....................................................... 58 58 15,185 15,664 1.7 1.7 3.6 3.9 4.6 4.5 1.0 1.0 Hawaii ......................................................... 1 1 3,308 3,376 2.6 2.6 4.1 4.5 5.2 5.3 0.7 0.7 Idaho........................................................... 104 104 4,006 4,100 3.1 3.1 6.0 6.1 8.3 8.6 0.7 0.8 Illinois.......................................................... 622 623 43,305 43,155 3.8 3.7 5.9 6.5 8.7 8.8 1.4 1.2 Indiana........................................................ 239 239 24,576 25,360 4.3 4.5 6.8 6.9 12.8 13.0 1.0 0.9
Iowa ............................................................ 539 539 12,200 12,297 4.3 4.3 6.0 6.3 9.7 10.0 0.7 0.6 Kansas........................................................ 325 326 11,024 11,106 4.8 4.7 6.6 6.4 11.1 11.1 1.2 1.2 Kentucky ..................................................... 116 116 8,582 8,602 2.1 2.1 4.0 4.3 6.2 6.4 0.7 0.8 Louisiana .................................................... 66 67 11,036 11,450 2.6 2.7 3.1 3.4 4.1 4.1 1.0 1.2 Maine.......................................................... 272 272 6,411 6,495 5.4 5.5 5.7 5.9 7.6 7.5 0.7 0.7
Maryland..................................................... 24 24 14,554 14,550 2.6 2.6 5.2 5.2 9.5 9.6 1.4 1.2 Massachusetts............................................ 370 370 32,319 32,436 5.1 5.0 6.1 6.1 8.0 8.1 0.8 0.8 Michigan ..................................................... 384 386 33,921 34,388 3.4 3.5 5.0 5.2 7.0 7.6 0.9 0.9 Minnesota ................................................... 139 139 15,722 15,836 3.0 3.0 5.3 5.4 10.2 10.3 0.8 0.9 Mississippi .................................................. 50 50 5,630 5,703 1.9 2.0 2.7 2.8 2.8 2.8 0.5 0.5
Missouri ...................................................... 151 152 18,049 18,433 3.5 3.6 5.0 5.3 9.0 9.3 1.1 1.1 Montana...................................................... 80 80 2,803 2,781 3.1 3.1 4.5 4.4 6.1 6.2 0.4 0.4 Nebraska .................................................... 269 271 6,745 6,735 4.7 5.2 6.5 7.4 9.4 10.2 0.9 0.9 Nevada ....................................................... 22 22 4,472 4,633 1.7 1.7 3.9 3.8 5.9 5.9 0.6 0.6 New Hampshire .......................................... 230 230 6,064 6,116 4.7 4.7 5.1 5.2 7.9 8.1 0.6 0.6
New Jersey ................................................. 304 303 30,738 30,673 3.7 3.7 5.5 5.6 6.5 6.8 1.0 1.0 New Mexico ................................................ 90 91 4,444 4,582 3.0 3.0 4.7 4.7 6.4 6.1 0.9 0.9 New York..................................................... 754 753 74,403 72,956 3.9 3.9 5.8 6.0 7.6 7.8 1.4 1.5 North Carolina ............................................ 75 77 16,086 16,536 1.9 1.9 3.9 4.1 5.5 5.6 1.3 1.4 North Dakota .............................................. 83 80 2,332 2,368 4.2 4.3 4.9 4.8 7.2 7.2 0.7 0.7
Ohio ............................................................ 251 251 46,896 46,974 4.1 4.1 7.5 7.6 15.5 15.9 1.6 1.7 Oklahoma ................................................... 112 113 7,009 7,144 2.4 2.4 4.7 4.8 7.0 6.9 0.8 0.8 Oregon........................................................ 128 128 9,209 9,505 2.8 2.8 6.2 6.3 15.0 14.9 0.8 0.8 Pennsylvania............................................... 457 457 29,706 30,114 2.5 2.5 3.8 3.9 5.5 5.6 0.7 0.7 Rhode Island .............................................. 49 49 4,394 4,376 4.1 4.1 5.9 5.8 6.9 6.7 0.9 0.8
South Carolina............................................ 42 42 9,056 9,176 2.1 2.1 3.6 3.6 5.1 5.2 1.1 1.1 South Dakota .............................................. 124 123 3,205 3,131 4.7 4.6 5.5 5.9 8.1 7.9 0.8 0.7 Tennessee .................................................. 186 187 11,144 11,439 1.9 1.9 3.2 3.3 4.2 4.1 0.8 0.7 Texas .......................................................... 561 562 41,863 41,799 2.0 1.9 3.3 3.3 4.8 4.8 0.8 0.7 Utah ............................................................ 70 70 6,466 6,587 2.6 2.6 7.0 6.5 12.9 12.5 1.6 1.6
Vermont ...................................................... 183 183 2,845 2,865 4.7 4.8 6.3 6.4 7.4 7.5 0.8 0.8 Virginia........................................................ 90 90 18,420 19,002 2.5 2.5 4.8 4.9 8.5 8.6 1.0 0.9 Washington................................................. 65 66 17,317 17,458 2.8 2.7 6.3 6.2 11.3 11.7 1.0 1.0 West Virginia............................................... 97 97 4,935 5,023 2.7 2.8 3.4 3.3 4.2 4.2 0.6 0.5 Wisconsin ................................................... 382 382 19,947 19,596 3.6 3.5 6.0 6.1 10.6 10.6 0.9 0.9 Wyoming..................................................... 23 23 2,334 2,429 4.6 4.7 6.4 6.4 8.7 8.4 1.1 1.1
1The total number of persons entering the library for any purpose during the year. 2A reference transaction is an information contact that involves the knowledge, use, rec-ommendations, interpretation, or instructions in the use of one or more information sources by a member of the library staff. 3In 2006, of the 9,208 public libraries in the 50 states and the District of Columbia, 7,449 were single-outlet libraries and 1,759 were multiple-outlet libraries. In 2007, of the 9,214 public libraries in the 50 states and the District of Columbia, 7,463 were single-outlet libraries and 1,751 were multiple-outlet libraries. Single-outlet libraries consist of a cen-
tral library, bookmobile, or books-by-mail-only outlet. Multiple-outlet libraries have two or more direct service outlets, including some combination of one central library, branch(es), bookmobile(s), and/or books-by-mail-only outlets. NOTE: Data include imputations for nonresponse. Detail may not sum to totals because of rounding. SOURCE: U.S. Census Bureau, Institute of Museum and Library Services, Public Librar-ies in the United States, fiscal years 2006 and 2007, retrieved July 14, 2009, from http:// harvester.census.gov/imls/publib.asp. (This table was prepared July 2009.)
DIGEST OF EDUCATION STATISTICS 2009

sandTechnology
CH
AP
TE
R 7
: Lib
rarie
s an
d E
du
catio
na
l Te
chn
olo
gy
61
3
Com
pute
rs and T
ech
nolo
gy
Percent of students eligible for free or reduced-price lunch2
Less than 35 percent
35 to 49 percent
50 to 74 percent
75 percent or more
12 13 14 15
7,450 (—) 8,160 (1,530) 5,650 (1,211) 6,560 (1,215) 4,930 (1,191) 4,990 (1,194) 2,500 (1,381) 2,280 (1,158)
39 (2.3) 60 (2.4) 74 (2.2) 92 (2.0) 95 (1.1) 99 (0.7) 99 (0.6) 98 (1.0)
100 (†) 99 (0.5)
2,905 (—) 3,630 (198) 3,900 (152) 4,394 (147) 4,781 (206) 4,982 (170) 5,049 (252) 5,352 (261)
78 (—) 95 (3.7)
109 (2.8) 120 (3.4) 137 (4.9) 142 (4.7) 155 (5.9) 166 (5.5)
286 (—) 2,064 (151) 2,762 (140) 3,608 (139) 4,225 (196) 4,586 (167) 4,751 (244) 5,239 (259)
13,630 (—) 12,090 (1,185) 13,910 (977) 12,410 (792) 14,750 (1,203) 13,240 (1,050) 14,870 (1,111) 14,350 (924)
35 (4.6) 48 (3.9) 59 (4.8) 93 (2.2) 98 (0.9) 99 (0.7)
100 (†) 100 (†) 100 (†) 100 (†)
806 (—) 1,105 (114) 1,245 (115) 1,373 (93) 1,707 (120) 1,673 (172) 1,923 (165) 2,193 (185)
59 (—) 91 (6.1) 90 (6.8)
111 (5.9) 116 (5.8) 126 (8.5) 129 (7.0) 153 (9.3)
46 (—) 608 (79) 778 (59)
1,064 (80) 1,447 (105) 1,474 (158) 1,724 (158) 2,090 (176)
12,810 (—) 13,970 (991) 16,100 (1,067) 17,030 (1,071) 16,630 (995) 19,040 (1,134) 18,580 (1,095) 18,290 (1,268)
32 (5.0) 41 (4.6) 53 (5.1) 88 (3.0) 96 (1.7) 97 (1.3) 99 (0.5)
100 (†) 100 (†) 100 (†)
950 (—) 1,127 (89) 1,429 (116) 1,606 (112) 1,862 (132) 2,265 (137) 2,248 (139) 2,687 (244)
74 (—) 81 (4.5) 89 (5.6) 94 (5.7)
112 (6.0) 119 (5.3) 121 (5.6) 147 (6.9)
57 (—) 439 (48) 810 (79)
1,215 (93) 1,529 (114) 2,049 (129) 2,121 (134) 2,583 (228)
13,170 (—) 14,540 (1,263) 11,990 (949) 13,910 (923) 14,710 (814) 14,770 (862) 16,290 (999) 17,570 (956)
18 (4.6) 31 (4.4) 53 (5.4) 79 (3.7) 89 (3.1) 94 (1.7) 97 (1.1) 99 (0.9) 99 (0.8) 99 (0.7)
882 (—) 1,235 (155) 1,170 (98) 1,384 (107) 1,698 (117) 1,792 (136) 1,960 (110) 2,440 (152)
67 (—) 85 (7.7) 98 (5.2) 99 (5.5)
115 (5.0) 122 (5.9) 120 (5.1) 139 (7.4)
36 (—) 458 (78) 428 (55) 858 (87)
1,289 (101) 1,549 (122) 1,726 (107) 2,332 (146)
DIG
ES
T O
F E
DU
CA
TIO
N S
TA
TIS
TIC
S 2
00
9
Computer
Table 425. Public schools and instructional rooms with internet access, by selected school characteristics: Selected years, 1994 through 2005
Schools, computers, instructional rooms, and access
All public schools
Instructional level1 Size of school enrollment Metropolitan status
Elementary Secondary Less than 300 300 to 999 1,000 or more City Urban fringe Town Rural
1 2 3 4 5 6 7 8 9 10 11
Estimated total number of schools
1995................... 1998................... 1999................... 2000................... 2001................... 2002................... 2003................... 2005...................
Percent of schools with internet access3
1994................... 1995................... 1996................... 1998................... 1999................... 2000................... 2001................... 2002................... 2003................... 2005...................
Number of computers for instructional purposes (in thousands)
19955.................. 1998................... 1999................... 2000................... 2001................... 2002................... 2003................... 2005...................
Average number of instructional computers perschool
19955.................. 1998................... 1999................... 2000................... 2001................... 2002................... 2003................... 2005...................
Number of instructional computers withinternet access (in thousands)
19955.................. 1998................... 1999................... 2000................... 2001................... 2002................... 2003................... 2005...................
77,850 (—) 78,790 (333) 78,400 (665) 80,130 (650) 81,070 (492) 82,040 (780) 82,230 (763) 82,480 (484)
35 (1.5) 50 (1.8) 65 (1.8) 89 (1.3) 95 (0.8) 98 (0.5) 99 (0.3) 99 (0.5)
100 4 (†) 100 4 (†)
5,621 (—) 7,111 (183) 7,806 (147) 8,776 (174)
10,058 (180) 10,711 (237) 11,180 (265) 12,672 (281)
72 (—) 90 (2.3)
100 (2.2) 110 (2.0) 124 (2.3) 131 (2.8) 136 (2.6) 154 (3.4)
447 (—) 3,569 (173) 4,809 (145) 6,759 (174) 8,500 (176) 9,658 (236)
10,361 (270) 12,245 (274)
57,710 (—) 59,170 (293) 59,580 (722) 59,780 (569) 61,640 (527) 62,130 (647) 62,300 (759) 61,920 (457)
30 (1.9) 46 (2.4) 61 (2.1) 88 (1.6) 94 (1.0) 97 (0.7) 99 (0.4) 99 (0.6)
100 4 (†) 100 4 (†)
3,453 (—) 4,519 (145) 4,923 (114) 5,296 (149) 6,165 (165) 6,775 (187) 6,879 (234) 7,701 (251)
60 (—) 76 (2.4) 83 (2.2) 89 (2.4)
100 (2.7) 109 (2.9) 110 (3.1) 124 (3.8)
232 (—) 2,100 (148) 2,773 (111) 3,813 (136) 4,936 (144) 5,912 (183) 6,225 (237) 7,361 (246)
18,080 (—) 19,190 (220) 17,110 (521) 18,410 (359) 17,630 (414) 17,610 (371) 17,890 (396) 18,910 (332)
49 (2.4) 65 (2.7) 77 (1.8) 94 (2.1) 98 (0.8)
100 4 (†) 100 4 (†) 100 4 (†) 100 (†) 100 (†)
2,021 (—) 2,549 (94) 2,728 (103) 3,271 (113) 3,654 (98) 3,705 (105) 4,087 (115) 4,783 (148)
112 (—) 133 (4.9) 159 (6.4) 178 (5.3) 207 (6.2) 210 (6.4) 228 (4.9) 253 (6.8)
187 (—) 1,450 (79) 1,945 (89) 2,779 (113) 3,357 (92) 3,525 (105) 3,935 (117) 4,706 (151)
20,670 (—) 20,100 (479) 20,020 (1,263) 20,070 (697) 20,670 (589) 21,430 (761) 21,620 (697) 20,960 (534)
30 (3.4) 39 (3.9) 57 (4.4) 87 (3.4) 96 (1.5) 96 (1.7) 99 (1.0) 96 (1.7)
100 (†) 100 (†)
850 (—) 952 (53)
1,021 (76) 1,135 (73) 1,085 (57) 1,347 (101) 1,275 (77) 1,566 (98)
41 (—) 47 (2.6) 51 (2.5) 57 (3.1) 52 (2.5) 63 (4.1) 59 (2.9) 75 (4.2)
59 (—) 407 (38) 663 (60) 882 (69) 874 (61)
1,214 (97) 1,156 (71) 1,515 (98)
50,040 (—) 50,660 (467) 50,390 (681) 51,890 (206) 51,970 (274) 51,880 (253) 51,950 (448) 53,420 (599)
35 (2.0) 52 (2.2) 66 (2.0) 89 (1.4) 94 (1.0) 98 (0.5) 99 (0.4)
100 4 (†) 100 4 (†)
99 (0.4)
3,600 (—) 4,414 (136) 4,952 (127) 5,524 (121) 6,273 (140) 6,533 (181) 6,709 (179) 7,966 (243)
72 (—) 87 (2.5) 98 (2.3)
106 (2.3) 121 (2.6) 126 (3.5) 129 (3.2) 149 (4.2)
315 (—) 2,276 (140) 2,988 (132) 4,191 (114) 5,229 (139) 5,827 (183) 6,169 (186) 7,642 (239)
7,140 (—) 8,040 (165) 7,990 (291) 8,170 (217) 8,430 (139) 8,730 (145) 8,660 (154) 8,100 (398)
58 (3.0) 69 (4.1) 80 (3.4) 95 (2.4) 96 (1.7) 99 (0.6)
100 (†) 100 (†) 100 (†) 100 (†)
1,171 (—) 1,744 (106) 1,834 (101) 2,117 (103) 2,700 (85) 2,831 (101) 3,196 (118) 3,139 (163)
164 (—) 217 (13.0) 229 (10.7) 259 (9.0) 320 (10.1) 324 (10.8) 369 (11.0) 388 (13.5)
73 (—) 887 (73)
1,158 (68) 1,686 (97) 2,396 (89) 2,618 (102) 3,036 (122) 3,089 (162)
17,910 (—) 20,700 (88) 21,030 (605) 21,120 (1,380) 18,000 (1,416) 18,550 (963) 18,800 (1,160) 19,010 (1,094)
40 (3.1) 47 (4.3) 64 (4.5) 92 (2.1) 93 (1.5) 96 (1.1) 97 (1.4) 99 (0.7)
100 (†) 99 (0.6)
1,497 (—) 2,148 (74) 2,320 (113) 2,537 (179) 2,685 (192) 2,662 (158) 2,825 (163) 3,132 (177)
84 (—) 104 (3.6) 110 (4.7) 120 (4.9) 149 (6.4) 144 (6.4) 150 (6.1) 165 (7.2)
96 (—) 1,026 (87) 1,265 (94) 1,782 (148) 2,175 (164) 2,329 (145) 2,593 (160) 3,009 (173)
18,460 (—) 26,270 (98) 26,250 (514) 26,580 (1,746) 26,260 (1,002) 26,430 (922) 26,490 (1,060) 23,820 (1,546)
38 (2.9) 59 (3.8) 75 (3.3) 85 (2.8) 96 (1.2) 98 (1.2) 99 (0.5)
100 (†) 100 4 (†) 99 (0.6)
1,526 (—) 2,606 (129) 2,975 (121) 3,396 (213) 3,791 (168) 4,043 (173) 4,188 (177) 4,058 (242)
83 (—) 99 (4.9)
113 (4.2) 128 (4.3) 144 (4.7) 153 (5.2) 158 (5.6) 170 (6.3)
131 (—) 1,334 (105) 1,887 (93) 2,688 (178) 3,178 (150) 3,677 (160) 3,887 (168) 3,912 (238)
19,540 (—) 11,310 (182) 11,240 (343) 11,880 (1,323) 10,180 (746) 10,770 (1,080) 10,600 (1,098) 11,810 (939)
29 (2.3) 47 (3.7) 61 (4.0) 90 (3.2) 94 (2.5) 98 (1.2)
100 (†) 98 (2.2)
100 (†) 100 (†)
1,404 (—) 1,047 (58) 1,022 (50) 1,155 (132) 1,134 (78) 1,320 (172) 1,357 (139) 1,819 (193)
72 (—) 93 (5.2) 91 (4.2) 97 (5.6)
111 (6.0) 123 (9.3) 128 (6.7) 154 (13.4)
126 (—) 481 (46) 691 (50) 955 (111)
1,008 (74) 1,222 (162) 1,264 (128) 1,784 (193)
21,940 20,520 19,890 20,550 26,630 26,280 26,350 27,850
35 48 60 92 96 99
100 4
98 100 100
1,195 1,311 1,489 1,689 2,448 2,686 2,810 3,663
54 64 75 82 92
102 107 132
94 727 966
1,335 2,139 2,431 2,616 3,541
(—) (273) (506)
(1,478) (1,087) (1,289) (1,422) (1,288)
(2.7) (3.8) (3.3) (3.4) (1.4) (0.9)
(†) (1.0)
(†) (†)
(—) (77) (75)
(131) (142) (164) (220) (255)
(—) (3.6) (3.6) (3.6) (4.0) (4.5) (4.9) (5.9)
(—) (73) (70) (91)
(137) (148) (217) (239)
33333333
See notes at end of table.

ntinued
61
4
CH
AP
TE
R 7
: Lib
rarie
s an
d E
du
catio
na
l Te
chn
olo
gy
Co
mp
ute
rs an
d T
ech
no
log
y
DIG
ES
T O
F E
DU
CA
TIO
N S
TA
TIS
TIC
S 2
00
9
Percent of students eligible for free or reduced-price lunch2
Less than 35 percent
35 to 49 percent
50 to 74 percent
75 percent or more
12 13 14 15
10 (—) 57 (2.0) 71 (2.2) 82 (1.2) 88 (1.2) 92 (1.1) 95 (0.8) 98 (0.6)
10.6 (0.6) 7.6 (0.3) 6.0 (0.2) 4.9 (0.2) 4.6 (0.1) 4.2 (0.1) 3.8 (0.1)
1,372 (60) 1,325 (46) 1,380 (46) 1,299 (48) 1,368 (45) 1,281 (51) 1,339 (50)
3 (0.5) 10 (1.2) 17 (1.6) 57 (2.4) 73 (2.3) 82 (1.5) 90 (1.2) 93 (0.8) 95 (1.0) 96 (0.8)
6 (—) 55 (4.2) 62 (3.6) 77 (2.9) 85 (2.0) 88 (2.0) 90 (2.3) 95 (1.0)
10.9 (1.2) 9.0 (0.4) 6.3 (0.4) 5.2 (0.2) 4.5 (0.3) 4.4 (0.3) 3.4 (0.2)
413 (39) 477 (34) 465 (28) 486 (34) 451 (38) 524 (39) 593 (51)
2 (0.4) 6 (1.4)
12 (2.2) 60 (5.1) 69 (3.4) 81 (2.9) 89 (2.2) 90 (2.1) 93 (1.4) 88 (4.3)
6 (—) 39 (2.9) 57 (2.8) 76 (2.6) 82 (2.5) 90 (1.5) 94 (1.0) 96 (1.0)
15.8 (1.4) 10.0 (0.8)
7.2 (0.4) 5.6 (0.3) 4.7 (0.2) 4.4 (0.2) 3.6 (0.2)
451 (29) 541 (42) 570 (36) 551 (35) 648 (38) 626 (38) 695 (56)
4 (1.8) 6 (1.9)
11 (2.8) 41 (3.9) 61 (3.1) 77 (2.8) 87 (2.4) 91 (1.4) 94 (1.1) 96 (0.8)
4 (—) 37 (4.6) 37 (3.6) 62 (3.1) 76 (2.2) 86 (1.6) 88 (1.5) 96 (0.8)
16.8 (2.5) 16.8 (2.2)
9.1 (0.7) 6.8 (0.3) 5.5 (0.3) 5.1 (0.2) 4.0 (0.2)
471 (42) 437 (34) 482 (29) 510 (29) 520 (33) 512 (34) 655 (39)
2 (0.9) 3 (1.0) 5 (1.8)
38 (4.3) 38 (4.4) 60 (3.3) 79 (2.4) 89 (1.9) 90 (1.5) 91 (2.5)
blished figures. therefore was rounded to 100 percent. poses. ers. could have been reported by fewer schools had a different sample Standard errors appear in parentheses.
ducation Statistics, Fast Response Survey System (FRSS), Inter-; and unpublished tabulations. (This table was prepared July 2007.)
Table 425. Public schools and instructional rooms with internet access, by selected school characteristics: Selected years, 1994 through 2005—Co
Schools, computers, instructional rooms, and access
All public schools
Instructional level1 Size of school enrollment Metropolitan status
Elementary Secondary Less than 300 300 to 999 1,000 or more City Urban fringe Town Rural
1 2 3 4 5 6 7 8 9 10 11
Percent of instructional computers withinternet access
19955.................. 1998................... 1999................... 2000................... 2001................... 2002................... 2003................... 2005...................
Number of publicschool students per instructional computer with internet access
1998................... 1999................... 2000................... 2001................... 2002................... 2003................... 2005...................
Number of instructional rooms6 (inthousands)
1998................... 1999................... 2000................... 2001................... 2002................... 2003................... 2005...................
Percent of instructional rooms6 with internet access3
1994................... 1995................... 1996................... 1998................... 1999................... 2000................... 2001................... 2002................... 2003................... 2005...................
8 (—) 50 (1.7) 62 (1.4) 77 (1.1) 85 (0.8) 90 (0.8) 93 (0.6) 97 (0.4)
12.1 (0.6) 9.1 (0.3) 6.6 (0.1) 5.4 (0.1) 4.8 (0.1) 4.4 (0.1) 3.8 (0.1)
2,709 (41) 2,811 (36) 2,905 (35) 2,851 (31) 2,988 (37) 3,004 (47) 3,283 (71)
3 (0.3) 8 (0.7)
14 (1.0) 51 (1.8) 64 (1.6) 77 (1.1) 87 (0.9) 92 (0.6) 93 (0.5) 94 (1.3)
7 (—) 46 (2.5) 56 (1.6) 72 (1.5) 80 (1.2) 87 (1.1) 90 (0.8) 96 (0.5)
13.6 (0.9) 10.6 (0.4) 7.8 (0.2) 6.1 (0.2) 5.2 (0.2) 4.9 (0.2) 4.1 (0.1)
1,772 (29) 1,830 (33) 1,864 (28) 1,854 (30) 2,006 (30) 1,998 (44) 2,152 (70)
3 (0.4) 8 (1.0)
13 (1.5) 51 (2.3) 62 (1.8) 76 (1.5) 86 (1.1) 92 (0.8) 93 (0.7) 93 (1.9)
9 (—) 57 (2.1) 71 (2.4) 85 (1.2) 92 (0.8) 95 (0.6) 96 (0.8) 98 (0.4)
9.9 (0.4) 7.0 (0.3) 5.2 (0.2) 4.3 (0.1) 4.1 (0.1) 3.8 (0.1) 3.3 (0.1)
916 (25) 926 (29) 972 (24) 929 (18) 919 (19) 952 (20)
1,078 (27)
4 (0.6) 8 (1.0)
16 (1.5) 52 (2.1) 67 (2.6) 79 (1.6) 88 (1.2) 91 (1.0) 94 (0.9) 95 (0.9)
7 (—) 43 (3.4) 65 (3.0) 78 (2.6) 81 (2.8) 90 (1.8) 91 (1.9) 97 (0.7)
9.1 (0.7) 5.7 (0.4) 3.9 (0.3) 4.1 (0.3) 3.1 (0.2) 3.2 (0.2) 2.4 (0.1)
349 (15) 360 (26) 377 (22) 332 (17) 396 (25) 378 (18) 426 (23)
3 (0.7) 9 (1.6)
15 (2.9) 54 (3.7) 71 (3.2) 83 (2.8) 87 (2.1) 91 (1.9) 93 (1.6) 92 (1.9)
9 (—) 52 (2.2) 60 (1.7) 76 (1.3) 83 (1.2) 89 (0.9) 92 (0.8) 96 (0.5)
12.3 (0.7) 9.4 (0.4) 7.0 (0.2) 5.6 (0.1) 5.0 (0.2) 4.7 (0.1) 3.9 (0.1)
1,740 (34) 1,805 (39) 1,871 (23) 1,829 (23) 1,896 (20) 1,919 (33) 2,152 (70)
3 (0.5) 8 (1.0)
13 (1.2) 53 (2.2) 64 (1.9) 78 (1.5) 87 (1.1) 93 (0.7) 93 (0.7) 94 (1.9)
6 (—) 51 (3.4) 63 (3.6) 80 (1.8) 89 (1.4) 92 (1.3) 95 (1.0) 98 (0.5)
13.0 (1.0) 10.0 (0.6)
7.2 (0.3) 5.4 (0.2) 5.1 (0.2) 4.3 (0.2) 4.0 (0.1)
620 (21) 645 (30) 657 (23) 690 (15) 696 (16) 707 (16) 705 (30)
3 (0.6) 4 (1.0)
16 (2.1) 45 (3.9) 58 (3.0) 70 (2.2) 86 (1.7) 89 (1.7) 94 (1.1) 94 (1.5)
6 48 55 70 81 87 92 96
14.1 11.4
8.2 5.9 5.5 5.0 4.2
839 857 866 726 748 777 849
4 6
12 47 52 66 82 88 90 88
(—) (3.0) (2.6) (2.1) (2.1) (1.6) (1.0) (0.7)
(1.2) (0.8) (0.4) (0.2) (0.2) (0.2) (0.2)
(22) (29) (56) (49) (36) (45) (62)
(0.8) (1.3) (1.6) (3.2) (2.6) (2.2) (2.1) (1.6) (1.0) (3.7)
9 (—) 51 (2.8) 63 (2.4) 79 (1.7) 84 (1.5) 91 (1.2) 93 (1.1) 96 (1.1)
12.4 (0.9) 9.1 (0.4) 6.6 (0.2) 5.7 (0.2) 4.9 (0.2) 4.6 (0.2) 4.1 (0.1)
981 (24) 1,049 (33) 1,086 (61) 1,068 (46) 1,101 (39) 1,104 (51) 1,050 (61)
4 (0.8) 8 (1.4)
16 (2.2) 50 (2.9) 67 (2.5) 78 (2.0) 87 (1.3) 92 (0.9) 94 (0.9) 96 (0.8)
9 46 68 83 89 93 93 98
12.2 8.2 6.2 5.0 4.4 4.1 3.4
390 375 413 339 378 375 439
3 8
14 55 72 87 91 96 97 98
(—) (4.1) (3.1) (2.5) (2.1) (1.9) (1.6) (0.6)
(1.2) (0.6) (0.3) (0.3) (0.4) (0.2) (0.2)
(14) (16) (47) (24) (40) (38) (41)
(0.6) (2.0) (1.9) (4.0) (3.4) (2.6) (2.2) (1.1) (0.9) (0.7)
8 55 65 79 87 90 93 97
8.6 6.6 5.0 4.6 4.0 3.8 3.0
498 530 541 718 761 748 945
3 8
14 57 71 85 89 93 94 95
(—) (3.4) (2.7) (2.1) (1.3) (1.4) (1.3) (0.7)
(0.8) (0.4) (0.3) (0.1) (0.2) (0.2) (0.1)
(17) (23) (39) (36) (48) (54) (67)
(0.4) (1.5) (2.2) (3.6) (3.0) (1.7) (1.3) (1.0) (1.2) (1.8)
—Not available †Not applicable. 1Data for combined schools are included in the totals and in analyses by other school characteristics, but are not shown separately. 2Percent of students eligible for free or reduced-price lunch was not available for some schools. In the 1994 survey, free and reduced-price lunch data came from the Common Core of Data (CCD) only and were missing for 430 schools (percentages pre-sented in this table are based on cases for which data were available). In subsequent years, free and reduced-price lunch informa-tion was obtained on the questionnaire, supplemented, if necessary, with CCD data. Missing data ranged from 0 schools (2002, 2003, and 2005) to 10 schools (1999).
3Some data differ slightly (e.g., by 1 percent) from previously pu4This estimate fell between 99.5 percent and 100.0 percent and5Includes computers used for instructional or administrative pur6Includes all classrooms, computer labs, and library/media centNOTE: For estimates that are 100 percent, the event defined been drawn. Detail may not sum to totals because of rounding.SOURCE: U.S. Department of Education, National Center for Enet Access in U.S. Public Schools and Classrooms: 1994–2005

CH
AP
TE
R 7
: Lib
rarie
s an
d E
du
catio
na
l Te
chn
olo
gy
61
5
Com
pute
rs and T
ech
nolo
gy
uring the year1
Conduct Health
nformation2 Government information3
financial transactions3,4 Look for jobs3
11 12 13 14
.3 (0.20) 44.7 (0.21) 30.4 (0.19) 18.7 (0.16)
.1 (0.28) 45.5 (0.30) 32.3 (0.28) 19.1 (0.24)
.1 (0.28) 44.0 (0.29) 28.6 (0.26) 18.3 (0.22)
.1 (0.23) 45.9 (0.24) 31.3 (0.22) 17.4 (0.18)
.6 (0.67) 41.1 (0.73) 22.3 (0.62) 25.6 (0.65)
.1 (0.73) 36.4 (0.81) 26.6 (0.74) 21.5 (0.69)
.6 (0.87) 45.4 (0.93) 35.2 (0.89) 21.5 (0.76)
— (†) — (†) — (†) — (†) — (†) — (†) — (†) — (†) .2 (0.38) — (†) — (†) — (†) .2 (0.42) 19.3 (0.48) 8.6 (0.34) 10.5 (0.38) .4 (0.59) 36.2 (0.63) 27.6 (0.59) 30.5 (0.60) .7 (0.68) 50.2 (0.69) 41.3 (0.68) 31.5 (0.64) .0 (0.45) 49.9 (0.46) 38.8 (0.44) 23.3 (0.38) .0 (0.44) 50.9 (0.44) 34.6 (0.42) 19.0 (0.35) .5 (0.52) 51.2 (0.52) 30.0 (0.48) 12.8 (0.35) .3 (0.78) 45.6 (0.78) 24.2 (0.67) 6.1 (0.37) .6 (1.09) 37.8 (1.06) 19.0 (0.86) 2.4 (0.34)
.8 (1.21) 40.4 (1.31) 22.9 (1.12) 34.5 (1.27)
.4 (1.23) 39.7 (1.34) 20.7 (1.11) 26.1 (1.20)
.8 (0.99) 39.3 (1.04) 24.8 (0.92) 23.6 (0.91)
.3 (0.90) 40.4 (0.95) 26.3 (0.85) 21.2 (0.79)
.6 (0.97) 41.9 (1.02) 27.3 (0.92) 18.5 (0.80)
.7 (0.63) 45.7 (0.67) 31.3 (0.62) 18.2 (0.52)
.0 (0.52) 51.5 (0.54) 38.4 (0.53) 15.9 (0.40)
.1 (0.33) 32.8 (0.45) 20.5 (0.39) 17.8 (0.37)
.3 (0.31) 15.8 (0.53) 5.6 (0.34) 7.0 (0.37) (†) — (†) — (†) — (†)
— (†) — (†) — (†) — (†) .9 (0.38) — (†) — (†) — (†) .2 (0.48) 15.8 (0.53) 5.6 (0.34) 7.0 (0.37) .9 (0.60) 45.4 (0.63) 31.5 (0.59) 25.8 (0.55)
.1 (0.44) 31.4 (0.65) 20.2 (0.56) 17.0 (0.52)
.6 (0.40) 15.4 (0.74) 5.6 (0.47) 6.4 (0.50) (†) — (†) — (†) — (†)
— (†) — (†) — (†) — (†) .6 (0.48) — (†) — (†) — (†) .9 (0.61) 15.4 (0.74) 5.6 (0.47) 6.4 (0.50) .2 (0.86) 45.0 (0.94) 32.7 (0.89) 26.0 (0.83)
DIG
ES
T O
F E
DU
CA
TIO
N S
TA
TIS
TIC
S 2
00
9
Table 426. Use of the Internet by persons 3 years old and over, by type of use and selected characteristics of students and other users: 2003
Number of persons using Percent using Percent using
Percent of internet users using the Internet for various activities d
Product
Selected characteristic the Internet
(in thousands) the Internet
anywhere the Internet
at school School
assignments E-mail and messaging Playing games Online courses
purchases and information
News, weather, and sports i
1 2 3 4 5 6 7 8 9 10
Total, all persons ...... 161,636 (309.1) 58.7 (0.14) — (†) — (†) 82.1 (0.15) 42.2 (0.19) 5.6 (0.09) 71.2 (0.17) 60.6 (0.19) 39
Sex Male ............................... 78,070 (343.4) 58.2 (0.21) — (†) — (†) 80.4 (0.22) 45.5 (0.27) 5.4 (0.12) 71.8 (0.25) 65.5 (0.26) 34Female ...........................
Race/ethnicity
83,567 (348.1) 59.2 (0.20) — (†) — (†) 83.7 (0.20) 39.2 (0.26) 5.7 (0.12) 70.6 (0.24) 55.9 (0.26) 44
White.............................. 122,243 (353.9) 65.1 (0.17) — (†) — (†) 84.8 (0.16) 41.4 (0.22) 5.5 (0.10) 74.4 (0.19) 62.9 (0.21) 41Black .............................. 14,898 (131.5) 45.2 (0.45) — (†) — (†) 71.1 (0.61) 50.2 (0.67) 5.6 (0.31) 59.7 (0.66) 50.8 (0.67) 33Hispanic ......................... 14,038 (132.7) 37.2 (0.43) — (†) — (†) 69.6 (0.68) 43.0 (0.73) 5.0 (0.32) 57.2 (0.73) 50.6 (0.74) 30Other..............................
Age
10,457 (133.9) 61.6 (0.65) — (†) — (†) 83.3 (0.64) 39.5 (0.84) 7.1 (0.44) 68.4 (0.79) 60.7 (0.83) 37
3 and 4........................... 1,662 (62.5) 19.9 (0.67) — (†) — (†) 26.5 (1.67) 64.6 (1.81) 0.6 (0.29) 15.4 (1.36) 11.3 (1.19) 5 to 9.............................. 8,259 (137.2) 42.0 (0.54) — (†) — (†) 33.5 (0.80) 64.8 (0.81) 1.0 (0.17) 17.3 (0.64) 16.6 (0.63) 10 to 14.......................... 14,570 (179.4) 68.9 (0.49) — (†) — (†) 62.4 (0.62) 66.1 (0.60) 1.1 (0.13) 34.4 (0.61) 35.7 (0.61) 615 to 19.......................... 15,768 (186.1) 77.7 (0.45) — (†) — (†) 84.0 (0.45) 61.1 (0.60) 5.0 (0.27) 61.3 (0.60) 55.4 (0.61) 1320 to 24.......................... 13,800 (174.9) 69.4 (0.50) — (†) — (†) 87.1 (0.44) 51.9 (0.65) 8.8 (0.37) 76.4 (0.56) 65.6 (0.62) 2825 to 29.......................... 12,492 (167.0) 66.7 (0.53) — (†) — (†) 88.7 (0.44) 42.2 (0.68) 8.0 (0.37) 83.1 (0.52) 71.0 (0.62) 4430 to 39.......................... 28,580 (242.3) 69.2 (0.35) — (†) — (†) 88.6 (0.29) 35.9 (0.44) 7.1 (0.23) 83.6 (0.34) 70.9 (0.41) 4540 to 49.......................... 29,978 (247.3) 67.5 (0.34) — (†) — (†) 88.3 (0.29) 33.1 (0.42) 6.3 (0.22) 83.4 (0.33) 70.1 (0.41) 4850 to 59.......................... 21,911 (215.9) 62.7 (0.40) — (†) — (†) 89.3 (0.32) 26.9 (0.46) 5.9 (0.24) 82.1 (0.40) 66.4 (0.49) 5060 to 69.......................... 9,677 (148.0) 43.9 (0.51) — (†) — (†) 87.5 (0.52) 27.7 (0.70) 3.7 (0.30) 77.8 (0.65) 60.2 (0.77) 4970 or older......................
Family income5
4,940 (106.9) 20.1 (0.39) — (†) — (†) 86.7 (0.74) 27.9 (0.98) 2.9 (0.37) 67.6 (1.03) 56.8 (1.08) 47
Less than $10,000 ......... 5,290 (112.1) 31.5 (0.63) — (†) — (†) 69.3 (1.11) 48.0 (1.20) 6.4 (0.59) 60.6 (1.17) 53.3 (1.20) 33$10,000 to $19,999........ 8,119 (195.6) 32.5 (0.66) — (†) — (†) 70.6 (1.12) 45.0 (1.22) 5.9 (0.58) 60.4 (1.20) 51.3 (1.23) 33$20,000 to $29,999........ 12,830 (243.1) 43.8 (0.64) — (†) — (†) 75.5 (0.84) 46.1 (0.97) 5.4 (0.44) 64.3 (0.94) 54.9 (0.97) 35$30,000 to $39,999........ 15,730 (267.2) 54.3 (0.65) — (†) — (†) 79.4 (0.71) 44.9 (0.88) 5.1 (0.39) 67.0 (0.83) 56.1 (0.88) 36$40,000 to $49,999........ 13,596 (249.8) 64.8 (0.73) — (†) — (†) 80.2 (0.76) 43.7 (0.94) 4.8 (0.40) 70.6 (0.86) 58.0 (0.94) 37$50,000 to $74,999........ 32,025 (365.2) 71.8 (0.47) — (†) — (†) 83.6 (0.46) 42.7 (0.61) 5.1 (0.27) 72.9 (0.55) 61.7 (0.60) 39$75,000 or more ............ 48,795 (429.4) 82.9 (0.34) — (†) — (†) 87.3 (0.33) 39.7 (0.49) 6.5 (0.25) 77.7 (0.42) 67.4 (0.47) 44
Total, all students ..... 49,520 (300.6) 66.1 (0.27) 48.8 (0.28) 82.2 (0.26) 70.1 (0.32) 59.3 (0.34) 5.9 (0.16) 49.8 (0.35) 46.5 (0.35) 20
Elementary/secondary6 ..... 34,636 (262.4) 59.4 (0.31) 43.3 (0.32) 77.9 (0.34) 60.6 (0.40) 64.2 (0.40) 2.0 (0.12) 37.1 (0.40) 36.0 (0.40) 93 and 4 years old ........... 1,063 (50.1) 23.2 (0.96) 7.6 (0.60) 29.4 (2.15) 25.1 (2.05) 63.5 (2.27) ‡ (†) 12.7 (1.57) 8.5 (1.32) —5 to 9 years old .............. 8,116 (136.0) 42.7 (0.55) 26.1 (0.49) 51.6 (0.85) 33.3 (0.81) 64.9 (0.82) 1.0 (0.17) 17.3 (0.65) 16.5 (0.63) 10 to 14 years old .......... 14,422 (178.5) 69.4 (0.49) 53.4 (0.53) 85.6 (0.45) 62.4 (0.62) 66.1 (0.61) 1.0 (0.13) 34.2 (0.61) 35.5 (0.61) 515 years old and over..... 11,035 (157.5) 79.5 (0.53) 63.6 (0.63) 91.9 (0.40) 81.6 (0.57) 61.3 (0.71) 4.2 (0.29) 57.8 (0.72) 53.6 (0.73) 12
College ..............................
Sex
14,884 (181.2) 89.5 (0.37) 68.1 (0.56) 92.0 (0.34) 92.4 (0.34) 47.8 (0.63) 14.9 (0.45) 79.2 (0.51) 71.1 (0.57) 34
Male ............................... Elementary/
24,107 (225.2) 64.6 (0.38) 47.7 (0.40) 80.7 (0.39) 66.8 (0.47) 64.1 (0.48) 5.3 (0.22) 50.5 (0.50) 49.9 (0.50) 16
secondary6 ........... 17,519 (195.3) 58.4 (0.44) 42.2 (0.44) 76.6 (0.49) 57.2 (0.58) 67.5 (0.54) 2.1 (0.17) 39.4 (0.57) 39.3 (0.57) 73 and 4 years old.... 591 (37.4) 24.2 (1.34) 7.2 (0.81) 26.9 (2.81) 23.7 (2.69) 66.4 (2.99) ‡ (†) 11.4 (2.01) 8.7 (1.79) —5 to 9 years old....... 4,051 (97.0) 41.8 (0.77) 25.1 (0.68) 50.4 (1.21) 30.2 (1.11) 66.8 (1.14) 1.2 (0.27) 18.9 (0.95) 17.8 (0.93) 10 to 14 years old... 7,233 (128.7) 68.1 (0.70) 51.9 (0.75) 84.0 (0.66) 58.0 (0.89) 68.9 (0.84) 1.4 (0.21) 37.6 (0.88) 38.1 (0.88) 415 years old and over 5,645 (114.1) 77.9 (0.75) 62.8 (0.87) 91.2 (0.58) 79.1 (0.83) 66.3 (0.97) 3.9 (0.40) 59.5 (1.01) 59.6 (1.01) 9
College....................... 6,587 (123.0) 90.0 (0.54) 70.2 (0.82) 91.4 (0.53) 92.3 (0.51) 55.1 (0.94) 13.6 (0.65) 79.8 (0.76) 77.9 (0.79) 29
See notes at end of table.

inued
61
6
CH
AP
TE
R 7
: Lib
rarie
s an
d E
du
catio
na
l Te
chn
olo
gy
Co
mp
ute
rs an
d T
ech
no
log
y
DIG
ES
T O
F E
DU
CA
TIO
N S
TA
TIS
TIC
S 2
00
9
uring the year1
Conduct Health
nformation2 Government information3
financial transactions3,4 Look for jobs3
11 12 13 14
.8 (0.48) 34.1 (0.62) 20.7 (0.53) 18.6 (0.51)
.1 (0.48) 16.2 (0.77) 5.7 (0.48) 7.6 (0.56) — (†) — (†) — (†) — (†) — (†) — (†) — (†) — (†) .1 (0.57) — (†) — (†) — (†) .6 (0.74) 16.2 (0.77) 5.7 (0.48) 7.6 (0.56) .4 (0.83) 45.8 (0.84) 30.4 (0.78) 25.7 (0.74)
.8 (0.40) 34.6 (0.55) 21.9 (0.48) 16.7 (0.43)
.5 (0.38) 17.3 (0.68) 6.7 (0.45) 5.8 (0.42) — (†) — (†) — (†) — (†) — (†) — (†) — (†) — (†) .4 (0.44) — (†) — (†) — (†) .9 (0.60) 17.3 (0.68) 6.7 (0.45) 5.8 (0.42) .7 (0.72) 46.8 (0.75) 32.7 (0.71) 24.4 (0.65) .8 (0.99) 28.2 (1.33) 12.7 (0.99) 22.8 (1.24)
.7 (0.92) 11.7 (1.42) 1.6 (0.55) 11.5 (1.41) — (†) — (†) — (†) — (†) — (†) — (†) — (†) — (†) .2 (1.33) — (†) — (†) — (†) .2 (1.27) 11.7 (1.42) 1.6 (0.55) 11.5 (1.41) .9 (1.89) 41.9 (1.97) 21.8 (1.65) 32.2 (1.87) .2 (1.02) 27.3 (1.47) 15.9 (1.21) 18.6 (1.29)
.6 (0.95) 13.9 (1.58) 3.7 (0.87) 9.0 (1.31) — (†) — (†) — (†) — (†) — (†) — (†) — (†) — (†) .5 (1.23) — (†) — (†) — (†) .3 (1.39) 13.9 (1.58) 3.7 (0.87) 9.0 (1.31) .5 (2.21) 41.8 (2.35) 29.0 (2.16) 29.0 (2.16)
.1 (1.71) 39.2 (2.07) 25.4 (1.85) 32.9 (1.99)
.6 (1.44) 37.2 (1.90) 19.8 (1.57) 21.4 (1.62)
.8 (1.32) 35.4 (1.75) 19.3 (1.44) 21.7 (1.51)
.5 (1.23) 31.9 (1.68) 20.7 (1.46) 19.1 (1.41)
.7 (1.33) 28.2 (1.82) 17.4 (1.53) 14.8 (1.43)
.2 (0.88) 35.0 (1.23) 20.5 (1.04) 17.2 (0.98)
.6 (0.69) 32.9 (0.97) 22.4 (0.86) 14.6 (0.73)
are subject to sampling and nonsampling error. Race categories tals because of rounding. Standard errors appear in parentheses.
, Current Population Survey (CPS), October 2003, unpublished
Table 426. Use of the Internet by persons 3 years old and over, by type of use and selected characteristics of students and other users: 2003—Cont
Number of persons using Percent using Percent using
Percent of internet users using the Internet for various activities d
Product
Selected characteristic the Internet
(in thousands) the Internet
anywhere the Internet
at school School
assignments E-mail and messaging Playing games Online courses
purchases and information
News, weather, and sports i
1 2 3 4 5 6 7 8 9 10
Female ........................... Elementary/
25,413 (230.4) 67.6 (0.37) 49.9 (0.40) 83.6 (0.36) 73.3 (0.43) 54.7 (0.48) 6.5 (0.24) 49.1 (0.48) 43.4 (0.48) 23
secondary6 ........... 17,117 (193.2) 60.5 (0.45) 44.4 (0.45) 79.3 (0.48) 64.0 (0.56) 60.8 (0.57) 1.9 (0.16) 34.8 (0.56) 32.6 (0.55) 113 and 4 years old.... 472 (33.4) 21.9 (1.37) 8.0 (0.90) 32.5 (3.32) 26.8 (3.14) 60.0 (3.47) ‡ (†) 14.3 (2.48) 8.3 (1.95) 5 to 9 years old....... 4,065 (97.2) 43.7 (0.79) 27.1 (0.71) 52.9 (1.21) 36.3 (1.16) 62.9 (1.17) 0.7 (0.20) 15.7 (0.88) 15.1 (0.86) 10 to 14 years old... 7,189 (128.3) 70.7 (0.69) 54.9 (0.76) 87.3 (0.60) 66.9 (0.85) 63.3 (0.87) 0.7 (0.15) 30.9 (0.84) 32.9 (0.85) 715 years old and over 5,390 (111.6) 81.2 (0.74) 64.5 (0.90) 92.6 (0.55) 84.1 (0.77) 56.0 (1.04) 4.4 (0.43) 56.1 (1.04) 47.4 (1.05) 14
College.......................
Race/ethnicity
8,297 (137.5) 89.0 (0.50) 66.4 (0.75) 92.4 (0.45) 92.4 (0.45) 42.0 (0.83) 15.9 (0.62) 78.8 (0.69) 65.7 (0.80) 39
White.............................. Elementary/
34,066 (260.6) 73.4 (0.32) 54.0 (0.36) 82.6 (0.32) 74.0 (0.37) 60.1 (0.41) 6.0 (0.20) 52.9 (0.42) 48.8 (0.42) 20
secondary6 ........... 23,592 (223.1) 67.1 (0.39) 48.7 (0.41) 78.2 (0.41) 65.1 (0.48) 65.7 (0.48) 1.9 (0.14) 39.9 (0.49) 38.0 (0.49) 93 and 4 years old.... 769 (42.6) 26.8 (1.27) 7.2 (0.74) 23.9 (2.37) 24.1 (2.37) 63.5 (2.67) ‡ (†) 9.9 (1.66) 6.5 (1.37) 5 to 9 years old....... 5,557 (113.2) 49.6 (0.73) 30.4 (0.67) 49.7 (1.03) 35.4 (0.99) 65.5 (0.98) 0.9 (0.19) 17.4 (0.78) 17.2 (0.78) 10 to 14 years old... 9,836 (149.1) 78.2 (0.57) 60.4 (0.67) 87.4 (0.52) 68.5 (0.72) 67.8 (0.72) 0.8 (0.14) 37.0 (0.75) 37.6 (0.75) 515 years old and over 7,430 (130.4) 87.4 (0.55) 69.6 (0.77) 92.9 (0.46) 87.2 (0.60) 63.4 (0.86) 4.1 (0.36) 63.5 (0.86) 57.4 (0.88) 12
College....................... 10,475 (153.6) 92.7 (0.38) 70.3 (0.66) 92.4 (0.40) 94.0 (0.36) 47.5 (0.75) 15.4 (0.54) 82.3 (0.57) 73.1 (0.67) 35Black ..............................
Elementary/ 5,810 (110.1) 53.0 (0.78) 40.8 (0.77) 82.6 (0.81) 57.4 (1.06) 61.5 (1.05) 5.9 (0.51) 41.9 (1.06) 39.3 (1.05) 18
secondary6 ........... 4,137 (96.7) 46.6 (0.87) 36.2 (0.83) 79.1 (1.04) 46.8 (1.27) 64.9 (1.21) 2.0 (0.36) 31.0 (1.18) 31.2 (1.18) 83 and 4 years old.... 103 (16.6) 15.0 (2.24) 7.2 (1.62) 51.6 (8.06) 32.5 (7.55) 56.8 (7.99) ‡ (†) 35.3 (7.70) 20.0 (6.45) 5 to 9 years old....... 925 (48.9) 33.1 (1.46) 21.5 (1.27) 58.2 (2.65) 27.1 (2.39) 65.6 (2.56) 0.6 (0.40) 20.0 (2.15) 16.3 (1.99) 10 to 14 years old... 1,732 (65.8) 53.6 (1.44) 42.7 (1.42) 83.8 (1.45) 45.5 (1.96) 68.6 (1.83) 2.1 (0.57) 29.0 (1.79) 31.6 (1.83) 815 years old and over 1,377 (59.1) 63.6 (1.69) 54.5 (1.75) 89.2 (1.37) 62.7 (2.13) 60.4 (2.16) 3.1 (0.76) 40.5 (2.17) 41.6 (2.17) 9
College....................... 1,673 (64.8) 80.0 (1.43) 60.7 (1.75) 91.4 (1.12) 83.5 (1.48) 53.0 (2.00) 15.4 (1.45) 68.9 (1.85) 59.4 (1.97) 33Hispanic .........................
Elementary/ 5,862 (116.2) 49.1 (0.80) 34.9 (0.76) 77.6 (0.95) 58.0 (1.13) 53.3 (1.14) 4.9 (0.49) 38.7 (1.11) 38.1 (1.11) 16
secondary6 ........... 4,517 (105.7) 44.2 (0.86) 31.2 (0.80) 74.5 (1.13) 49.1 (1.30) 56.1 (1.29) 2.8 (0.43) 29.1 (1.18) 30.3 (1.19) 83 and 4 years old.... 114 (18.6) 15.6 (2.35) 7.2 (1.67) 41.4 (8.08) 16.2 (6.04) 71.0 (7.44) ‡ (†) 7.0 (4.19) 10.6 (5.04) 5 to 9 years old....... 1,095 (56.5) 30.3 (1.33) 17.9 (1.11) 53.6 (2.63) 26.6 (2.33) 59.9 (2.59) 1.8 (0.70) 15.2 (1.89) 15.5 (1.91) 10 to 14 years old... 1,855 (72.3) 51.9 (1.46) 38.7 (1.42) 78.5 (1.67) 48.2 (2.03) 54.9 (2.02) 1.4 (0.48) 25.5 (1.77) 28.1 (1.82) 615 years old and over 1,454 (64.5) 63.2 (1.76) 47.9 (1.82) 87.6 (1.51) 69.8 (2.10) 53.7 (2.28) 5.3 (1.02) 45.8 (2.28) 45.8 (2.28) 10
College.......................
Family income5
1,344 (62.2) 78.4 (1.74) 56.9 (2.09) 88.2 (1.54) 88.1 (1.54) 43.9 (2.36) 12.0 (1.55) 71.2 (2.16) 64.2 (2.28) 31
Less than $10,000 ......... 2,642 (84.7) 51.9 (1.22) 41.1 (1.21) 81.4 (1.32) 64.0 (1.63) 56.0 (1.69) 7.9 (0.92) 51.9 (1.70) 50.3 (1.70) 27$10,000 to $19,999........ 3,477 (95.2) 52.8 (1.07) 41.8 (1.06) 82.2 (1.13) 60.8 (1.45) 52.5 (1.48) 6.9 (0.75) 46.7 (1.48) 42.6 (1.46) 22$20,000 to $29,999........ 4,226 (103.0) 55.8 (1.00) 42.8 (0.99) 79.7 (1.08) 64.5 (1.29) 56.5 (1.33) 6.8 (0.68) 47.3 (1.34) 43.4 (1.33) 22$30,000 to $39,999........ 4,860 (108.7) 62.8 (0.96) 45.1 (0.99) 78.5 (1.03) 66.8 (1.18) 60.9 (1.22) 6.6 (0.62) 45.1 (1.25) 41.4 (1.23) 20$40,000 to $49,999........ 3,812 (98.9) 69.0 (1.09) 49.7 (1.17) 80.2 (1.13) 65.5 (1.35) 60.1 (1.39) 5.5 (0.64) 48.2 (1.41) 41.2 (1.39) 18$50,000 to $74,999........ 9,038 (130.9) 72.1 (0.70) 51.6 (0.78) 82.0 (0.71) 71.5 (0.83) 60.9 (0.90) 5.0 (0.40) 49.9 (0.92) 46.9 (0.92) 20$75,000 or more ............ 14,314 (132.1) 79.5 (0.53) 57.3 (0.64) 84.3 (0.53) 76.2 (0.62) 61.9 (0.71) 5.9 (0.34) 54.0 (0.73) 51.3 (0.73) 18
—Not available. 5Excludes persons whose income data were not available. †Not applicable. 6Includes prekindergarten through grade 12. ‡Reporting standards not met. NOTE: Data are based on a sample survey of households and1Individuals may be counted in more than one internet activity. exclude persons of Hispanic ethnicity. Detail may not sum to to2Data are for persons 12 years old an d over. SOURCE: U.S. Department of Commerce, Census Bureau3Data are for persons 15 years old an d over. tabulations. (This table was prepared May 2005.) 4Includes online banking and stock and securities transactions.

DIG
ES
T O
F E
DU
CA
TIO
N S
TA
TIS
TIC
S 2
00
9
CH
AP
TE
R 7
: Lib
rarie
s an
d E
du
catio
na
l Te
chn
olo
gy
61
7
Com
pute
rs and T
ech
nolo
gy
specific applications1
s/design2 School
assignments3
Household records/
finances2 Games
10 11 12 13
(0.24) 75.9 (0.29) 30.8 (0.22) 58.5 (0.22)
(0.33) 73.9 (0.42) 31.6 (0.31) 61.5 (0.29) (0.30) 77.8 (0.39) 30.1 (0.29) 55.6 (0.28)
(0.27) 75.4 (0.34) 31.8 (0.26) 58.0 (0.25) (0.82) 79.3 (0.89) 26.9 (0.78) 64.8 (0.73) (0.93) 74.9 (0.97) 25.1 (0.87) 59.5 (0.83) (1.07) 76.7 (1.14) 31.4 (1.02) 54.2 (0.97)
(†) 61.9 (0.44) — (†) 86.0 (0.34) (0.24) 92.8 (0.29) 30.8 (0.22) 51.8 (0.24) (0.71) 93.1 (0.34) 6.2 (0.34) 72.4 (0.64) (0.78) 94.5 (0.53) 20.5 (0.64) 61.9 (0.77) (0.81) 94.2 (0.96) 37.1 (0.79) 54.2 (0.82) (0.52) 89.0 (1.26) 37.6 (0.52) 50.4 (0.53) (0.50) 88.6 (1.67) 37.5 (0.50) 47.3 (0.52) (0.58) 90.0 (2.49) 34.4 (0.58) 41.9 (0.60) (0.82) 69.8 (9.14) 31.8 (0.84) 44.3 (0.89) (0.98) ‡ (†) 25.4 (1.05) 47.0 (1.20)
(0.83) 78.5 (0.85) 22.5 (0.75) 64.4 (0.76) (0.82) 74.8 (1.02) 24.7 (0.76) 63.6 (0.75) (0.73) 72.8 (0.95) 27.1 (0.70) 62.8 (0.68) (0.80) 74.9 (1.03) 28.8 (0.76) 61.5 (0.73) (0.52) 74.9 (0.66) 30.5 (0.50) 59.3 (0.48) (0.43) 77.0 (0.51) 37.8 (0.42) 55.0 (0.39)
l ude persons o f Hispanic ethnicity. Detail may not sum to totals s.
, Current Population Survey (CPS), October 1997 and October ust 2004.)
Table 427. Number and percentage of home computer users, by type of application and selected characteristics: 1997 and 2003
Selected characteristic
1997 2003
Number of home computer users
(in thousands)
Percent of persons using
computers at home
Number of home computer users
(in thousands)
Percent of persons using
computers at home
Percent of home computer users using
Word processing Connect
to Internet E-mail Spreadsheets/
databases2 Graphic
1 2 3 4 5 6 7 8 9
Total, age 3 and over...................
Sex
81,013 (600.0) 31.7 (0.16) 156,744 (954.0) 56.9 (0.16) 53.1 (0.22) 82.7 (0.17) 72.7 (0.19) 32.0 (0.23) 37.6
Male .................................................. 41,260 (412.6) 33.1 (0.22) 76,777 (637.8) 57.2 (0.22) 49.5 (0.30) 82.4 (0.23) 70.5 (0.27) 33.7 (0.32) 39.5Female ..............................................
Race/ethnicity
39,753 (384.7) 30.3 (0.20) 79,967 (627.8) 56.7 (0.21) 56.7 (0.28) 83.0 (0.21) 74.8 (0.24) 30.3 (0.29) 35.9
White................................................. 68,026 (543.7) 36.9 (0.19) 119,495 (801.4) 63.7 (0.19) 53.9 (0.25) 84.9 (0.18) 75.4 (0.22) 32.6 (0.26) 38.6Black ................................................. 4,943 (136.3) 15.6 (0.36) 13,457 (254.7) 40.8 (0.48) 50.5 (0.76) 74.4 (0.67) 62.5 (0.74) 26.8 (0.77) 33.4Hispanic ............................................ 4,081 (139.0) 14.5 (0.41) 13,497 (300.2) 35.8 (0.49) 46.6 (0.85) 72.4 (0.76) 59.4 (0.83) 27.8 (0.90) 31.4Other.................................................
Age
3,963 (136.6) 34.8 (0.88) 10,296 (248.9) 60.7 (0.74) 56.3 (0.96) 81.1 (0.76) 71.6 (0.88) 36.4 (1.06) 39.3
3 to 14............................................... 18,774 (249.8) 39.1 (0.39) 30,772 (330.0) 62.6 (0.38) 37.9 (0.48) 57.6 (0.49) 34.5 (0.47) — (†) —15 and over ....................................... 62,239 (505.5) 30.0 (0.17) 125,972 (813.4) 55.7 (0.18) 56.8 (0.24) 88.8 (0.15) 82.0 (0.19) 32.0 (0.23) 37.6
15 to 19 ......................................... 8,395 (162.3) 43.1 (0.61) 14,656 (218.2) 72.2 (0.54) 68.9 (0.66) 86.6 (0.49) 77.9 (0.59) 23.2 (0.60) 43.820 to 24 ......................................... 4,975 (123.7) 28.5 (0.59) 11,848 (194.7) 59.6 (0.60) 63.7 (0.76) 86.4 (0.54) 80.6 (0.63) 29.9 (0.73) 40.925 to 29 ......................................... 5,963 (135.8) 31.7 (0.59) 11,059 (187.7) 59.0 (0.62) 56.0 (0.82) 88.5 (0.52) 83.7 (0.61) 36.2 (0.79) 42.130 to 39 ......................................... 15,393 (224.1) 35.8 (0.40) 26,407 (302.3) 64.0 (0.41) 54.3 (0.53) 89.7 (0.32) 83.3 (0.40) 35.5 (0.51) 40.640 to 49 ......................................... 15,346 (223.7) 38.3 (0.42) 27,660 (310.4) 62.3 (0.40) 55.4 (0.52) 90.1 (0.31) 82.7 (0.39) 35.3 (0.50) 37.350 to 59 ......................................... 7,679 (154.9) 28.5 (0.48) 19,976 (258.5) 57.2 (0.46) 55.4 (0.61) 90.7 (0.35) 83.4 (0.45) 32.5 (0.57) 33.660 to 69 ......................................... 3,162 (98.1) 16.2 (0.46) 9,233 (170.6) 41.8 (0.57) 51.8 (0.90) 87.9 (0.59) 81.9 (0.69) 28.5 (0.81) 29.070 or older .....................................
Family income4
1,327 (63.2) 5.9 (0.27) 5,134 (125.7) 20.9 (0.45) 43.9 (1.20) 84.5 (0.87) 78.1 (1.00) 20.5 (0.97) 20.6
Under $20,000 .................................. 7,374 (151.6) 11.0 (0.21) 11,951 (195.6) 28.6 (0.38) 48.5 (0.79) 70.1 (0.72) 59.9 (0.77) 23.2 (0.75) 31.5$20,000 to $29,999........................... 7,819 (156.3) 19.9 (0.35) 12,136 (197.2) 41.4 (0.50) 47.7 (0.78) 74.0 (0.69) 64.5 (0.75) 25.6 (0.77) 32.4$30,000 to $39,999........................... 10,370 (181.4) 28.5 (0.41) 15,176 (222.4) 52.4 (0.51) 45.6 (0.70) 78.9 (0.57) 68.7 (0.65) 24.9 (0.68) 31.8$40,000 to $49,999........................... 9,627 (174.4) 36.9 (0.52) 13,300 (207.1) 63.4 (0.57) 50.1 (0.75) 81.9 (0.58) 71.6 (0.68) 28.5 (0.75) 35.6$50,000 to $74,999........................... 21,685 (270.5) 46.5 (0.40) 31,581 (335.0) 70.8 (0.37) 51.9 (0.49) 85.6 (0.34) 74.8 (0.42) 30.8 (0.50) 37.4$75,000 or more ............................... 24,138 (287.3) 60.3 (0.42) 48,583 (433.0) 82.5 (0.27) 61.3 (0.38) 89.7 (0.24) 79.8 (0.31) 41.2 (0.43) 45.1
—Not available. 4Excludes persons whose income data were not available. †Not applicable. NO TE: Exclu des persons under age 3. Race categorie s exc‡Reporting standards not met. because of rounding. Standard errors appear in parenthese1Individuals may be counted in more than one computer activity. SOURCE: U.S. Department of Commerce, Census Bureau2Data are for persons 15 years old an d over. 2003, unpublished tabulations. (This table was prepared Aug3Data are for students only.

61
8
CH
AP
TE
R 7
: Lib
rarie
s an
d E
du
catio
na
l Te
chn
olo
gy
Co
mp
ute
rs an
d T
ech
no
log
y
DIG
ES
T O
F E
DU
CA
TIO
N S
TA
TIS
TIC
S 2
00
9
specific applications1
sing Graphics
and design Spreadsheets
and databases Personal finances
9 10 11 12
.32) — (†) — (†) — (†)
.39) — (†) — (†) — (†)
.96) — (†) — (†) — (†)
.60) — (†) — (†) — (†)
.64) — (†) — (†) — (†)
.66) 43.1 (0.71) 21.1 (0.59) 4.5 (0.30)
.77) 46.3 (0.86) 22.1 (0.71) 4.7 (0.36)
.33) 38.9 (2.31) 15.9 (1.73) 3.5 (0.88)
.27) 30.0 (2.12) 18.2 (1.78) 6.1 (1.11)
.57) 41.4 (2.75) 24.2 (2.40) 2.2 (0.82)
.59) 46.5 (0.70) 36.8 (0.68) 21.4 (0.58)
.69) 48.9 (0.84) 37.8 (0.81) 21.1 (0.69)
.05) 37.7 (2.22) 32.0 (2.13) 23.0 (1.93)
.32) 38.8 (2.43) 33.4 (2.35) 19.8 (1.99)
.06) 47.3 (2.59) 39.4 (2.53) 23.7 (2.20)
.94) 52.2 (1.36) 56.2 (1.35) 45.4 (1.36)
.45) — (†) — (†) — (†)
.55) — (†) — (†) — (†)
.29) — (†) — (†) — (†)
.82) — (†) — (†) — (†)
.91) — (†) — (†) — (†)
.95) 43.3 (0.99) 21.0 (0.82) 4.2 (0.40)
.91) 50.2 (1.05) 37.6 (1.01) 22.3 (0.87)
.61) 53.0 (2.05) 58.3 (2.03) 46.9 (2.05)
.44) — (†) — (†) — (†)
.56) — (†) — (†) — (†)
.43) — (†) — (†) — (†)
.88) — (†) — (†) — (†)
.89) — (†) — (†) — (†)
.93) 42.9 (1.02) 21.3 (0.85) 4.9 (0.45)
.78) 43.4 (0.95) 36.2 (0.92) 20.6 (0.77)
.09) 51.5 (1.81) 54.5 (1.81) 44.3 (1.80)
e person s of Hispanic ethnici ty. Detail ma y not su m to totals . , Current Population Survey (CPS), October 2003, unpublished
Table 428. Number and percentage of student home computer users, by type of application and selected characteristics: 2003
Selected characteristic of students Number
(in thousands)
Number using computers at home
(in thousands) Percent using
computers at home
Percent of home computer users using
Games Internet School
assignments E-mail Word proces
1 2 3 4 5 6 7 8
Total, all students .................
Elementary/secondary...........................
74,911 (312.9) 52,942 (286.3) 70.7 (0.24) 76.2 (0.27) 72.3 (0.28) 75.9 (0.27) 56.5 (0.31) 55.1 (0
58,273 (324.9) 39,364 (282.0) 67.6 (0.30) 82.8 (0.30) 66.0 (0.37) 69.9 (0.36) 46.2 (0.39) 46.8 (0Under age 5 ....................................... 4,590 (105.0) 2,291 (74.6) 49.9 (1.16) 84.3 (1.19) 29.2 (1.49) 15.1 (1.17) 8.9 (0.93) 9.4 (0Ages 5 to 9......................................... 19,015 (206.6) 11,887 (166.1) 62.5 (0.55) 87.6 (0.47) 45.9 (0.72) 42.0 (0.71) 18.8 (0.56) 22.6 (0Ages 10 to 14..................................... 20,788 (215.0) 14,875 (184.5) 71.6 (0.49) 85.3 (0.45) 74.1 (0.56) 85.1 (0.46) 53.0 (0.64) 56.5 (015 years old or over ........................... 13,880 (165.7) 10,311 (144.2) 74.3 (0.54) 73.4 (0.64) 85.8 (0.50) 92.4 (0.38) 76.3 (0.61) 69.1 (0
White.............................................. 8,500 (131.6) 7,186 (121.4) 84.5 (0.57) 75.3 (0.74) 90.2 (0.51) 93.3 (0.43) 81.5 (0.67) 72.1 (0Black .............................................. 2,164 (68.8) 1,073 (49.7) 49.6 (1.67) 73.5 (2.09) 73.6 (2.09) 90.3 (1.40) 60.7 (2.31) 59.0 (2Hispanic ......................................... 2,298 (75.0) 1,280 (57.5) 55.7 (1.72) 68.2 (2.16) 72.0 (2.08) 87.8 (1.51) 60.8 (2.26) 59.9 (2Other .............................................. 918 (45.9) 771 (42.2) 83.9 (1.88) 64.5 (2.68) 83.7 (2.07) 94.3 (1.30) 75.3 (2.41) 69.9 (2
Undergraduate....................................... 13,370 (162.9) 10,701 (146.8) 80.0 (0.50) 60.5 (0.69) 89.6 (0.43) 92.8 (0.37) 84.8 (0.51) 77.1 (0White.................................................. 8,964 (135.0) 7,551 (124.4) 84.2 (0.56) 60.8 (0.82) 91.1 (0.48) 93.0 (0.43) 86.5 (0.57) 78.7 (0Black .................................................. 1,766 (62.8) 1,151 (51.4) 65.2 (1.76) 62.1 (2.22) 83.2 (1.71) 91.1 (1.30) 77.0 (1.93) 72.4 (2Hispanic ............................................. 1,544 (62.7) 1,102 (53.6) 71.4 (1.91) 56.8 (2.47) 86.7 (1.69) 92.1 (1.34) 80.5 (1.98) 68.6 (2Other.................................................. 1,095 (49.9) 898 (45.4) 82.0 (1.80) 61.5 (2.52) 89.5 (1.59) 94.0 (1.23) 86.3 (1.78) 80.3 (2
Graduate................................................ 3,268 (66.0) 2,876 (64.1) 88.0 (0.83) 43.6 (1.35) 93.7 (0.66) 94.6 (0.61) 91.7 (0.75) 86.1 (0
Males ..................................................... 37,323 (253.4) 26,168 (219.6) 70.1 (0.35) 80.1 (0.36) 71.2 (0.41) 73.9 (0.40) 53.0 (0.45) 51.7 (0Elementary/secondary....................... 30,005 (252.4) 20,050 (211.6) 66.8 (0.43) 84.9 (0.40) 65.3 (0.53) 68.3 (0.51) 43.1 (0.55) 44.2 (0
Under age 5 ................................... 2,437 (76.9) 1,222 (54.6) 50.2 (1.59) 85.3 (1.59) 30.3 (2.06) 14.9 (1.60) 10.7 (1.38) 9.1 (1Ages 5 to 9..................................... 9,703 (150.9) 6,060 (120.3) 62.5 (0.77) 88.5 (0.64) 44.6 (1.00) 40.7 (0.99) 16.6 (0.75) 20.9 (0Ages 10 to 14................................. 10,622 (157.5) 7,453 (132.9) 70.2 (0.70) 87.5 (0.60) 73.9 (0.80) 83.3 (0.68) 48.0 (0.91) 53.0 (015 years old or over........................ 7,243 (121.9) 5,313 (104.9) 73.4 (0.76) 77.1 (0.84) 84.8 (0.72) 90.9 (0.58) 73.8 (0.88) 66.4 (0
Undergraduate ................................... 5,902 (110.4) 4,859 (100.5) 82.3 (0.72) 68.6 (0.97) 89.7 (0.64) 91.7 (0.58) 84.0 (0.77) 75.1 (0Graduate............................................ 1,416 (54.7) 1,259 (51.6) 88.9 (1.22) 48.9 (2.06) 93.8 (0.99) 94.1 (0.97) 91.6 (1.14) 81.2 (1
Females ................................................. 37,588 (254.1) 26,774 (221.7) 71.2 (0.34) 72.3 (0.40) 73.4 (0.39) 77.8 (0.37) 59.8 (0.44) 58.4 (0Elementary/secondary....................... 28,269 (246.1) 19,315 (208.0) 68.3 (0.43) 80.7 (0.45) 66.8 (0.53) 71.6 (0.51) 49.4 (0.56) 49.5 (0
Under age 5 ................................... 2,154 (72.3) 1,069 (51.1) 49.6 (1.69) 83.2 (1.79) 28.0 (2.15) 15.3 (1.72) 6.8 (1.21) 9.8 (1Ages 5 to 9..................................... 9,312 (147.9) 5,827 (118.0) 62.6 (0.79) 86.7 (0.70) 47.1 (1.02) 43.3 (1.02) 21.0 (0.84) 24.4 (0Ages 10 to 14................................. 10,166 (154.3) 7,422 (132.7) 73.0 (0.69) 83.1 (0.68) 74.4 (0.79) 86.8 (0.62) 57.9 (0.90) 60.0 (015 years old or over........................ 6,637 (116.9) 4,997 (101.9) 75.3 (0.77) 69.6 (0.95) 86.7 (0.70) 94.0 (0.49) 78.9 (0.84) 71.8 (0
Undergraduate ................................... 7,468 (123.7) 5,842 (109.9) 78.2 (0.70) 53.9 (0.95) 89.6 (0.58) 93.7 (0.47) 85.5 (0.67) 78.8 (0Graduate............................................ 1,852 (62.5) 1,617 (58.5) 87.3 (1.13) 39.5 (1.77) 93.5 (0.89) 95.1 (0.78) 91.8 (0.99) 90.0 (1
—Not available. NO TE: Estimates a s of Octobe r 1. Race categories exclud†Not applicable. because of rounding. Standard errors appear in parentheses1Individuals may be counted in more than one computer activity. SOURCE: U.S. Department of Commerce, Census Bureau
tabulations. (This table was prepared May 2005.)

CH
AP
TE
R 7
: Lib
rarie
s an
d E
du
catio
na
l Te
chn
olo
gy
61
9
Com
pute
rs and T
ech
nolo
gy
2003
and secondary1
College25 to 9
years old 10 to 14
years old 15 years
old or over
11 12 13 14
.1 (0.45) 90.3 (0.32) 91.2 (0.35) 84.9 (0.41)
.7 (0.64) 90.1 (0.45) 91.8 (0.47) 85.3 (0.60)
.7 (0.64) 90.6 (0.45) 90.5 (0.53) 84.6 (0.55)
.5 (0.56) 92.4 (0.37) 91.9 (0.43) 85.0 (0.49)
.5 (1.30) 88.0 (0.95) 89.9 (1.01) 83.8 (1.25)
.6 (1.27) 86.8 (1.01) 88.5 (1.10) 83.0 (1.50)
.3 (1.89) 86.1 (1.54) 94.1 (1.20) 87.6 (1.30)
.3 (3.82) 86.9 (3.39) 86.5 (4.37) 83.8 (3.12)
.8 (3.30) 91.3 (2.18) 88.3 (3.04) 90.1 (2.35)
.1 (3.11) 84.6 (2.41) 90.4 (2.40) 88.0 (2.48)
.0 (3.27) 89.1 (2.38) 89.2 (3.09) 86.7 (2.92)
.0 (3.00) 88.9 (2.16) 92.6 (2.31) 85.3 (2.81)
.0 (2.66) 87.0 (2.21) 90.8 (2.21) 84.4 (2.90)
.5 (2.67) 90.6 (1.86) 88.8 (2.59) 80.9 (3.17)
.2 (2.37) 94.0 (1.53) 90.4 (2.48) 85.7 (2.69)
.0 (2.29) 90.8 (1.56) 90.3 (1.94) 80.4 (2.63)
.5 (1.53) 92.6 (0.94) 92.4 (1.21) 83.1 (1.56)
.3 (1.15) 92.7 (0.81) 93.2 (0.96) 85.8 (1.16)
.5 (0.48) 90.5 (0.34) 91.2 (0.36) 84.6 (0.46)
.5 (1.33) 89.1 (1.09) 90.5 (1.36) 86.1 (0.85)
.5 (0.55) 71.6 (0.49) 74.3 (0.54) 81.6 (0.44)
.5 (0.77) 70.2 (0.70) 73.4 (0.76) 83.6 (0.63)
.6 (0.79) 73.0 (0.69) 75.3 (0.77) 80.0 (0.60)
.6 (0.64) 81.8 (0.54) 84.5 (0.57) 85.4 (0.49)
.6 (1.55) 50.8 (1.46) 49.6 (1.67) 67.5 (1.59)
.7 (1.46) 52.5 (1.48) 55.7 (1.72) 72.5 (1.79)
.6 (2.16) 75.7 (1.90) 83.9 (1.88) 83.1 (1.48)
DIG
ES
T O
F E
DU
CA
TIO
N S
TA
TIS
TIC
S 2
00
9
Table 429. Student use of computers, by level of enrollment, age, and student and school characteristics: 1993, 1997, and 2003
Student and school characteristic
1993 1997
Total
Elementary and
secondary1 College2 Total
Elementary and
secondary1 College2 Total
Elementary
Total Under 5
years old
1 2 3 4 5 6 7 8 9 10
Total .............................
Sex
Percent of students using computers at school
59.0 (0.32) 60.1 (0.38) 54.7 (0.71) 68.8 (0.27) 70.4 (0.32) 62.9 (0.60) 83.8 (0.20) 83.5 (0.24) 42.6 (1.14) 80
Male ................................. 59.4 (0.44) 59.9 (0.53) 57.4 (1.04) 70.1 (0.37) 71.0 (0.44) 66.3 (0.88) 83.7 (0.28) 83.4 (0.34) 43.5 (1.57) 79Female .............................
Race/ethnicity
58.7 (0.45) 60.5 (0.54) 52.4 (0.96) 67.6 (0.38) 69.9 (0.46) 60.2 (0.81) 83.8 (0.28) 83.5 (0.35) 41.5 (1.66) 80
White................................ 61.6 (0.37) 63.8 (0.45) 54.0 (0.81) 71.1 (0.32) 73.9 (0.38) 62.1 (0.70) 85.0 (0.24) 84.9 (0.30) 41.1 (1.44) 82Black ................................ 51.5 (0.98) 50.6 (0.98) 57.0 (2.54) 66.3 (0.74) 66.1 (0.75) 66.8 (1.78) 82.7 (0.56) 82.5 (0.67) 49.4 (3.18) 78Hispanic ........................... 52.3 (1.50) 52.3 (1.16) 52.1 (4.06) 61.5 (0.89) 61.3 (0.69) 62.6 (2.38) 80.3 (0.60) 79.8 (0.71) 39.5 (3.22) 75Other................................
Family income3
59.0 (2.24) 57.7 (2.50) 62.7 (4.20) 65.3 (1.32) 65.6 (1.45) 64.6 (2.56) 83.3 (0.77) 81.7 (1.01) 48.9 (4.78) 76
Less than $5,000 ............. 51.2 (1.32) 48.1 (1.50) 62.4 (2.73) 62.1 (1.21) 61.6 (1.41) 63.4 (2.36) 80.9 (1.87) 79.5 (2.31) 42.4 (9.47) 78$5,000 to $9,999.............. 53.3 (1.06) 53.1 (1.17) 54.3 (2.51) 63.5 (1.02) 61.9 (1.14) 70.4 (2.20) 84.4 (1.43) 82.4 (1.74) 49.2 (7.71) 77$10,000 to $14,999.......... 56.4 (1.03) 56.7 (1.13) 55.1 (2.50) 66.2 (0.96) 66.4 (1.06) 65.2 (2.26) 81.7 (1.37) 80.0 (1.61) 50.1 (7.20) 74$15,000 to $19,999.......... 58.1 (1.18) 59.4 (1.30) 52.3 (2.77) 65.9 (1.10) 66.5 (1.21) 63.2 (2.72) 81.3 (1.57) 79.8 (1.84) 26.6 (7.08) 77$20,000 to $24,999.......... 56.4 (1.07) 56.3 (1.18) 56.6 (2.58) 66.9 (0.99) 67.5 (1.10) 64.3 (2.24) 81.3 (1.41) 80.3 (1.61) 43.7 (7.03) 73$25,000 to $29,999.......... 60.0 (1.13) 61.9 (1.25) 52.4 (2.61) 68.5 (1.01) 70.4 (1.11) 61.2 (2.37) 81.9 (1.32) 81.3 (1.48) 35.6 (7.03) 78$30,000 to $34,999.......... 59.1 (1.08) 61.3 (1.20) 50.5 (2.46) 67.6 (0.97) 71.0 (1.05) 53.9 (2.31) 82.2 (1.33) 82.5 (1.46) 40.1 (7.16) 78$35,000 to $39,999.......... 60.7 (1.11) 63.3 (1.21) 49.0 (2.67) 69.0 (0.98) 71.1 (1.08) 60.4 (2.35) 87.1 (1.17) 87.5 (1.30) 54.8 (7.43) 85$40,000 to $49,999.......... 59.3 (0.94) 60.8 (1.04) 53.1 (2.12) 70.5 (0.79) 72.6 (0.85) 60.9 (1.99) 83.5 (1.08) 84.2 (1.18) 47.1 (6.20) 80$50,000 to $74,999.......... 62.6 (0.73) 64.9 (0.82) 55.0 (1.58) 71.7 (0.57) 74.2 (0.63) 63.2 (1.28) 83.8 (0.71) 84.0 (0.80) 35.7 (3.64) 80$75,000 or more ..............
Control of school
64.6 (0.90) 67.0 (1.04) 58.2 (1.78) 72.1 (0.60) 75.1 (0.68) 63.9 (1.25) 85.6 (0.57) 85.6 (0.65) 39.2 (2.98) 85
Public ............................... 60.2 (0.34) 61.6 (0.40) 54.0 (0.80) 70.2 (0.28) 72.1 (0.33) 62.3 (0.68) 85.2 (0.21) 85.4 (0.25) 47.7 (1.61) 80Private..............................
Total .............................
Sex
52.1 (0.85) 49.8 (1.10) 57.3 (1.52) 60.7 (0.73) 58.6 (0.96) 65.2 (1.27) 75.4 (0.60) 70.5 (0.82) 37.1 (1.61) 77
Percent of students using computers at home
27.0 (0.28) 24.5 (0.33) 36.2 (0.65) 45.1 (0.29) 42.8 (0.34) 53.2 (0.62) 70.7 (0.24) 67.6 (0.30) 49.9 (1.16) 62
Male ................................. 27.4 (0.39) 24.3 (0.45) 40.1 (0.99) 45.2 (0.40) 43.2 (0.48) 53.7 (0.93) 70.1 (0.35) 66.8 (0.43) 50.2 (1.59) 62Female .............................
Race/ethnicity
26.6 (0.39) 24.7 (0.47) 33.0 (0.87) 44.9 (0.40) 42.5 (0.49) 52.8 (0.83) 71.2 (0.34) 68.3 (0.43) 49.6 (1.69) 62
White................................ 32.8 (0.35) 30.8 (0.42) 39.2 (0.76) 54.9 (0.35) 53.9 (0.43) 58.2 (0.72) 80.1 (0.27) 78.3 (0.34) 59.6 (1.43) 74Black ................................ 10.9 (0.59) 8.7 (0.54) 22.7 (2.01) 21.1 (0.64) 19.1 (0.62) 31.0 (1.75) 50.2 (0.74) 46.2 (0.88) 31.7 (2.96) 41Hispanic ........................... 10.4 (0.90) 7.9 (0.62) 25.0 (3.31) 21.1 (0.74) 18.3 (0.54) 38.8 (2.40) 51.1 (0.76) 47.5 (0.88) 25.8 (2.88) 41Other................................ 28.7 (2.00) 25.8 (2.16) 36.0 (3.99) 49.1 (1.38) 46.5 (1.52) 56.3 (2.66) 74.6 (0.91) 71.3 (1.19) 57.5 (4.73) 61
See notes at end of table.

62
0
CH
AP
TE
R 7
: Lib
rarie
s an
d E
du
catio
na
l Te
chn
olo
gy
Co
mp
ute
rs an
d T
ech
no
log
y
DIG
ES
T O
F E
DU
CA
TIO
N S
TA
TIS
TIC
S 2
00
9
2003
and secondary1
College25 to 9
years old 10 to 14
years old 15 years
old or over
11 12 13 14
.9 (4.24)
.7 (3.66)
.8 (3.33)
.4 (3.67)
.1 (3.33)
.7 (3.21)
.7 (3.23)
.0 (3.23)
.9 (2.65)
.9 (1.67)
.3 (1.15)
.4 (0.59)
.3 (1.34)
29.5 (4.58) 41.3 (3.82) 43.2 (3.31) 49.1 (3.82) 52.5 (3.43) 59.5 (3.22) 64.9 (3.04) 71.9 (2.91) 77.5 (2.24) 83.8 (1.33) 91.0 (0.89)
70.1 (0.52) 84.7 (1.26)
34.2 (6.07) 40.1 (4.65) 42.9 (4.03) 48.4 (4.97) 53.9 (4.39) 61.9 (3.72) 72.9 (3.66) 74.6 (3.66) 78.2 (2.70) 86.5 (1.56) 94.1 (0.90)
73.1 (0.57) 89.3 (1.43)
75.2 (3.65) 77.7 (3.27) 75.2 (3.30) 74.6 (3.73) 77.8 (3.29) 78.3 (3.30) 76.1 (3.43) 78.5 (3.16) 86.6 (2.26) 87.8 (1.36) 91.7 (0.92)
80.9 (0.50) 84.1 (0.90)
.2 (0.50) 60.9 (0.53) 68.6 (0.57) 76.0 (0.48)
.4 (0.69) 58.5 (0.75) 66.7 (0.81) 77.1 (0.72)
.1 (0.72) 63.4 (0.75) 70.8 (0.82) 75.2 (0.65)
.1 (0.67) 70.5 (0.64) 78.9 (0.65) 79.8 (0.55)
.5 (1.32) 43.7 (1.45) 44.8 (1.66) 62.2 (1.65)
.2 (1.19) 42.6 (1.47) 48.9 (1.73) 66.7 (1.89)
.8 (1.97) 60.9 (2.16) 79.1 (2.08) 77.8 (1.65)
.4 (3.25) 22.7 (4.21) 30.4 (5.88) 73.8 (3.72)
.0 (2.75) 32.3 (3.62) 34.1 (4.49) 72.8 (3.49)
.4 (2.49) 34.6 (3.18) 36.8 (3.93) 72.2 (3.42)
.8 (2.42) 40.2 (3.75) 42.9 (4.92) 71.5 (3.87)
.9 (2.65) 40.7 (3.38) 48.8 (4.40) 73.4 (3.50)
.0 (2.47) 48.9 (3.28) 55.2 (3.81) 72.2 (3.58)
.4 (2.61) 55.4 (3.17) 64.1 (3.95) 69.0 (3.73)
.9 (2.93) 58.4 (3.19) 66.7 (3.96) 71.8 (3.46)
.3 (2.52) 67.6 (2.51) 71.4 (2.95) 79.0 (2.70)
.2 (1.77) 71.6 (1.62) 81.0 (1.79) 82.4 (1.58)
.2 (1.56) 83.6 (1.15) 90.0 (1.14) 85.7 (1.16)
.4 (0.53) 59.2 (0.56) 67.5 (0.60) 75.1 (0.55)
.3 (1.50) 76.5 (1.48) 83.3 (1.73) 79.3 (1.00)
d are subject to sampling and nonsampling error. Race categories parentheses. rrent Population Survey (CPS), October 1993, October 1997, and
d May 2005.)
Table 429. Student use of computers, by level of enrollment, age, and student and school characteristics: 1993, 1997, and 2003—Continued
Student and school characteristic
1993 1997
Total
Elementary and
secondary1 College2 Total
Elementary and
secondary1 College2 Total
Elementary
Total Under 5
years old
1 2 3 4 5 6 7 8 9 10
Family income3
Less than $5,000 ............. $5,000 to $9,999.............. $10,000 to $14,999.......... $15,000 to $19,999.......... $20,000 to $24,999.......... $25,000 to $29,999.......... $30,000 to $34,999.......... $35,000 to $39,999.......... $40,000 to $49,999.......... $50,000 to $74,999.......... $75,000 or more ..............
Control of school Public ............................... Private..............................
Total ...........................
Sex
9.7 (0.76) 8.0 (0.56)
11.4 (0.64) 15.1 (0.84) 16.8 (0.79) 21.1 (0.92) 24.1 (0.92) 27.1 (0.99) 32.2 (0.87) 43.0 (0.74) 56.1 (0.92)
25.3 (0.29) 37.4 (0.80)
4.3 (0.59) 4.2 (0.46) 6.7 (0.56)
11.2 (0.82) 13.6 (0.80) 19.1 (0.99) 22.6 (1.02) 24.9 (1.08) 31.6 (0.98) 42.9 (0.84) 58.1 (1.08)
23.0 (0.34) 35.0 (1.03)
28.3 (2.43) 25.0 (2.08) 33.4 (2.26) 31.0 (2.44) 31.0 (2.27) 29.0 (2.28) 29.7 (2.15) 36.1 (2.44) 34.4 (1.92) 43.5 (1.52) 50.9 (1.74)
34.5 (0.73) 42.5 (1.45)
22.6 (1.04) 15.8 (0.77) 18.4 (0.78) 20.7 (0.94) 30.5 (0.97) 34.6 (1.03) 38.7 (1.01) 44.1 (1.06) 50.6 (0.86) 61.7 (0.62) 74.2 (0.59)
43.2 (0.31) 56.1 (0.75)
15.2 (1.04) 9.3 (0.68)
13.6 (0.77) 16.5 (0.95) 26.2 (1.04) 32.0 (1.13) 36.1 (1.11) 42.6 (1.17) 50.4 (0.95) 62.2 (0.70) 77.2 (0.66)
40.9 (0.37) 56.1 (0.97)
43.7 (2.43) 42.9 (2.39) 39.7 (2.32) 41.2 (2.77) 47.5 (2.34) 45.0 (2.42) 49.2 (2.32) 50.5 (2.40) 51.7 (2.04) 59.9 (1.30) 65.8 (1.23)
52.4 (0.70) 56.1 (1.32)
44.1 (2.36) 47.0 (1.97) 47.0 (1.77) 48.3 (2.02) 53.1 (1.80) 59.0 (1.69) 64.2 (1.66) 70.0 (1.60) 75.9 (1.25) 81.3 (0.75) 88.6 (0.51)
69.3 (0.27) 78.3 (0.57)
29.8 (2.62) 36.6 (2.20) 39.3 (1.96) 40.8 (2.25) 46.6 (2.02) 54.7 (1.89) 61.5 (1.87) 67.8 (1.83) 73.4 (1.43) 79.5 (0.88) 87.6 (0.61)
66.3 (0.33) 75.6 (0.77)
20.5 (7.74) 31.0 (7.14) 36.4 (6.93) 16.5 (5.95) 27.1 (6.29) 40.6 (7.21) 41.4 (7.19) 49.0 (7.46) 54.6 (6.18) 58.9 (3.74) 66.1 (2.89)
41.1 (1.58) 59.3 (1.63)
2930323341475463687485
6077
Percent of students using computers at home for school work 14.8 (0.22) 12.0 (0.25) 25.0 (0.59) 28.6 (0.26) 24.8 (0.30) 42.5 (0.61) 53.6 (0.27) 47.2 (0.32) 7.5 (0.61) 26
Male ................................. 14.7 (0.31) 11.4 (0.34) 28.2 (0.91) 28.3 (0.37) 24.7 (0.42) 43.3 (0.92) 51.8 (0.38) 45.6 (0.45) 7.5 (0.83) 25Female .............................
Race
14.8 (0.32) 12.5 (0.36) 22.4 (0.77) 28.9 (0.37) 24.9 (0.43) 41.9 (0.82) 55.4 (0.37) 48.9 (0.47) 7.6 (0.89) 27
White................................ 18.0 (0.29) 15.1 (0.33) 27.4 (0.70) 35.0 (0.34) 31.3 (0.40) 47.0 (0.72) 60.4 (0.33) 54.1 (0.42) 7.3 (0.76) 29Black ................................ 5.7 (0.44) 4.3 (0.39) 13.4 (1.64) 12.5 (0.51) 10.4 (0.48) 22.8 (1.59) 39.8 (0.73) 34.6 (0.84) 8.2 (1.75) 22Hispanic ........................... 5.6 (0.68) 3.6 (0.42) 17.8 (2.92) 12.5 (0.60) 9.8 (0.42) 29.2 (2.24) 38.3 (0.74) 33.5 (0.83) 6.7 (1.65) 20Other................................
Family income3
15.8 (1.61) 12.4 (1.63) 24.5 (3.57) 33.6 (1.31) 29.3 (1.39) 45.3 (2.67) 57.2 (1.03) 49.4 (1.31) 10.3 (2.91) 26
Less than $5,000 ............. 6.6 (0.64) 2.4 (0.45) 21.1 (2.20) 15.1 (0.89) 8.0 (0.79) 35.5 (2.35) 36.5 (2.29) 19.4 (2.27) 4.2 (3.83) 14$5,000 to $9,999.............. 4.7 (0.44) 1.5 (0.28) 18.8 (1.88) 10.4 (0.65) 4.2 (0.47) 36.5 (2.32) 36.5 (1.90) 24.1 (1.96) 4.0 (3.01) 14$10,000 to $14,999.......... 7.2 (0.52) 3.0 (0.38) 27.1 (2.14) 11.4 (0.64) 6.7 (0.56) 32.4 (2.22) 36.9 (1.71) 27.1 (1.78) 14.3 (5.04) 14$15,000 to $19,999.......... 8.5 (0.65) 5.6 (0.60) 20.5 (2.12) 13.2 (0.79) 8.5 (0.72) 36.0 (2.70) 37.2 (1.95) 27.4 (2.04) 0.7 (1.36) 10$20,000 to $24,999.......... 9.7 (0.62) 6.3 (0.57) 24.5 (2.11) 19.4 (0.83) 15.0 (0.84) 37.1 (2.26) 40.5 (1.77) 31.9 (1.89) 8.2 (3.89) 18$25,000 to $29,999.......... 10.3 (0.69) 7.5 (0.66) 21.4 (2.06) 21.9 (0.90) 18.4 (0.94) 35.7 (2.33) 43.4 (1.70) 36.9 (1.84) 8.3 (4.05) 18$30,000 to $34,999.......... 12.9 (0.72) 10.8 (0.75) 20.8 (1.91) 24.4 (0.89) 20.3 (0.93) 40.5 (2.28) 46.8 (1.73) 41.8 (1.89) 8.8 (4.13) 20$35,000 to $39,999.......... 15.2 (0.80) 12.9 (0.83) 24.6 (2.20) 26.5 (0.94) 22.8 (0.99) 41.7 (2.37) 50.9 (1.75) 45.5 (1.96) 7.0 (3.82) 25$40,000 to $49,999.......... 17.1 (0.70) 15.4 (0.76) 23.3 (1.71) 30.1 (0.79) 28.3 (0.86) 38.5 (1.99) 56.9 (1.44) 51.6 (1.62) 12.9 (4.16) 26$50,000 to $74,999.......... 23.1 (0.63) 21.4 (0.70) 28.7 (1.38) 39.3 (0.62) 36.7 (0.70) 48.2 (1.32) 60.9 (0.94) 55.0 (1.09) 4.8 (1.63) 30$75,000 or more ..............
Control of school
30.2 (0.85) 29.5 (1.00) 32.0 (1.63) 48.3 (0.67) 47.3 (0.78) 51.3 (1.30) 68.2 (0.75) 62.8 (0.89) 6.5 (1.51) 36
Public ............................... 14.1 (0.24) 11.7 (0.26) 24.1 (0.66) 27.9 (0.28) 24.5 (0.32) 41.9 (0.69) 53.4 (0.29) 47.8 (0.35) 8.0 (0.87) 25Private.............................. 18.5 (0.65) 13.8 (0.75) 28.5 (1.33) 32.6 (0.70) 26.9 (0.87) 44.6 (1.32) 54.7 (0.69) 43.3 (0.89) 7.1 (0.85) 32
1Includes students enrolled in prekindergarten through grade 12, ages 3 and above. NOTE: Data are based on a sample survey of households an2Includes students enrolled at the undergraduate and postbaccalaureate levels. exclude persons of Hispanic ethnicity. Standard errors appear in3Excludes persons whose income data were not available. SOURCE: U.S. Department of Commerce, Census Bureau, Cu
October 2003, unpublished tabulations. (This table was prepare

CH
AP
TE
R 7
: Lib
rarie
s an
d E
du
catio
na
l Te
chn
olo
gy
62
1
Com
pute
rs and T
ech
nolo
gy
1993, 1997, and 2003
computer applications1
Word processing/ desktop Using 4 or more
ming publishing Other uses only categories
10 11 12 13
(0.23) 67.8 (0.29) 8.2 (0.17) 45.3 (0.31)
(0.70) 57.9 (1.05) 14.2 (0.74) 33.0 (1.00) (0.75) 67.8 (0.89) 8.5 (0.53) 47.2 (0.95) (0.48) 69.8 (0.57) 6.8 (0.31) 49.6 (0.62) (0.45) 69.7 (0.54) 7.1 (0.30) 48.4 (0.59) (0.50) 68.1 (0.65) 8.0 (0.38) 43.7 (0.69) (0.72) 63.7 (1.13) 11.1 (0.74) 35.0 (1.12)
(1.20) 43.2 (1.85) 21.6 (1.53) 21.4 (1.53) (0.43) 52.4 (0.66) 14.6 (0.47) 29.3 (0.60) (0.50) 62.5 (0.68) 10.0 (0.42) 39.6 (0.69) (0.71) 62.6 (0.95) 9.9 (0.58) 39.8 (0.96) (0.46) 78.0 (0.48) 3.7 (0.22) 57.3 (0.57) (0.77) 85.6 (0.67) 1.8 (0.25) 62.2 (0.92) (1.11) 81.7 (1.08) 2.9 (0.47) 56.9 (1.39) (0.37) 65.6 (0.43) 7.8 (0.24) 48.8 (0.45) (1.79) 39.7 (2.56) 23.3 (2.21) 20.5 (2.11) (0.72) 45.0 (1.01) 16.1 (0.74) 28.3 (0.91) (0.82) 58.2 (1.04) 10.6 (0.65) 40.8 (1.04) (1.24) 60.5 (1.46) 9.9 (0.90) 43.7 (1.49) (0.69) 76.9 (0.67) 2.6 (0.25) 61.7 (0.77) (1.18) 83.5 (0.99) 1.3 (0.31) 66.2 (1.26) (1.41) 80.1 (1.36) 2.5 (0.53) 58.5 (1.68) (0.28) 69.8 (0.40) 8.6 (0.24) 42.2 (0.43) (1.58) 46.8 (2.66) 19.8 (2.12) 22.3 (2.21) (0.52) 58.0 (0.87) 13.4 (0.60) 30.1 (0.81) (0.59) 66.0 (0.90) 9.6 (0.56) 38.5 (0.92) (0.79) 64.2 (1.24) 9.9 (0.77) 36.9 (1.24) (0.58) 79.2 (0.68) 4.9 (0.36) 52.5 (0.83) (0.93) 87.7 (0.89) 2.3 (0.41) 58.0 (1.33) (1.72) 85.0 (1.75) 3.9 (0.95) 53.6 (2.44)
(0.26) 68.6 (0.33) 7.8 (0.19) 46.2 (0.35) (0.82) 61.7 (1.06) 11.6 (0.70) 38.0 (1.06) (0.97) 63.0 (1.29) 10.4 (0.82) 39.6 (1.31) (1.20) 71.1 (1.29) 6.6 (0.71) 51.0 (1.43)
DIG
ES
T O
F E
DU
CA
TIO
N S
TA
TIS
TIC
S 2
00
9
Table 430. Percentage of workers, 18 years old and over, using computers on the job, by type of computer application and selected characteristics:
Percent
2003
Number Percent of on-the-job computer users using specificusing
computers at work,
Percent using computers at Percent using
using computers at work (in Spreadsheets/ Calendar/
Selected characteristic 1993 work, 1997 computers at work thousands) databases Internet/e-mail schedule Graphics/design Program
1 2 3 4 5 6 7 8 9
Total .................................................. 45.8 49.4 (0.24) 56.1 (0.19) 76,570 64.4 (0.30) 75.4 (0.27) 57.0 (0.31) 29.7 (0.29) 16.4
Age 18 to 24................................................. 34.4 37.1 (0.66) 38.5 (0.55) 6,575 56.0 (1.06) 62.1 (1.03) 48.9 (1.07) 21.7 (0.88) 12.4 25 to 29................................................. 48.3 52.5 (0.70) 56.9 (0.57) 8,203 66.2 (0.90) 75.6 (0.82) 58.3 (0.94) 30.3 (0.88) 18.8 30 to 39................................................. 50.7 53.3 (0.46) 59.0 (0.37) 19,225 68.0 (0.58) 78.3 (0.51) 61.8 (0.61) 31.7 (0.58) 18.0 40 to 49................................................. 51.3 54.9 (0.47) 60.8 (0.35) 21,772 66.9 (0.55) 77.1 (0.49) 59.0 (0.58) 31.8 (0.55) 17.7 50 to 59................................................. 43.9 50.7 (0.61) 60.1 (0.42) 15,423 62.5 (0.67) 76.5 (0.59) 54.6 (0.69) 29.7 (0.64) 15.1 60 or older.............................................
Educational attainment and sex
27.2 32.6 (0.88) 48.5 (0.67) 5,373 53.8 (1.18) 71.2 (1.07) 46.1 (1.18) 23.5 (1.00) 10.6
Not high school completer .................... 10.0 11.9 (0.48) 15.6 (0.50) 2,149 44.1 (1.85) 49.7 (1.86) 40.4 (1.83) 15.3 (1.34) 11.7 High school completer .......................... 34.2 36.4 (0.40) 40.4 (0.35) 16,914 53.3 (0.66) 61.4 (0.65) 47.7 (0.66) 18.5 (0.52) 11.8 Some college ........................................ 50.4 53.6 (0.53) 55.7 (0.42) 15,060 61.5 (0.68) 70.2 (0.64) 53.6 (0.70) 25.3 (0.61) 14.5 Associate’s degree................................ 58.2 60.7 (0.81) 62.9 (0.59) 7,813 61.1 (0.95) 71.7 (0.88) 54.4 (0.97) 26.1 (0.86) 15.4 Bachelor’s degree ................................. 68.8 73.9 (0.50) 82.0 (0.30) 22,540 73.3 (0.51) 85.6 (0.40) 64.2 (0.55) 37.4 (0.56) 20.1 Master’s degree .................................... 71.2 78.7 (0.81) 87.2 (0.43) 8,292 73.8 (0.83) 90.0 (0.57) 64.9 (0.91) 43.3 (0.94) 20.4 Doctor’s or professional degree ............ 66.9 74.6 (1.24) 85.4 (0.67) 3,803 68.8 (1.30) 88.0 (0.91) 66.1 (1.33) 37.5 (1.36) 19.3 Male ...................................................... 40.3 44.1 (0.31) 50.5 (0.25) 36,976 67.2 (0.42) 77.7 (0.37) 58.6 (0.44) 33.8 (0.42) 21.4
Not high school completer ................ 8.5 9.8 (0.53) 12.5 (0.55) 1,095 44.4 (2.59) 48.7 (2.61) 39.4 (2.55) 18.2 (2.01) 13.6 High school completer ...................... 24.2 27.1 (0.49) 31.9 (0.45) 7,305 52.1 (1.01) 60.1 (0.99) 45.0 (1.01) 21.6 (0.83) 14.9 Some college .................................... 42.8 46.0 (0.71) 49.2 (0.58) 6,718 62.0 (1.02) 71.4 (0.95) 53.0 (1.05) 29.3 (0.96) 18.7 Associate’s degree ............................ 52.6 55.2 (1.16) 56.9 (0.86) 3,326 64.8 (1.43) 74.1 (1.31) 53.5 (1.49) 33.2 (1.41) 22.1 Bachelor’s degree ............................. 69.8 74.3 (0.65) 82.5 (0.39) 11,787 77.6 (0.66) 88.4 (0.51) 68.0 (0.74) 40.4 (0.78) 25.6 Master’s degree................................. 75.4 79.8 (1.05) 88.0 (0.57) 4,186 78.7 (1.09) 92.1 (0.72) 69.0 (1.23) 44.9 (1.33) 26.8 Doctor’s or professional degree ........ 66.5 73.4 (1.43) 85.5 (0.78) 2,559 70.9 (1.55) 88.9 (1.08) 66.5 (1.61) 38.7 (1.66) 21.7
Female .................................................. 52.4 56.5 (0.32) 62.5 (0.24) 39,594 61.7 (0.42) 73.3 (0.38) 55.5 (0.43) 26.0 (0.38) 11.8 Not high school completer ................ 12.5 15.4 (0.80) 21.0 (0.83) 1,054 43.7 (2.64) 50.7 (2.66) 41.4 (2.62) 12.4 (1.75) 9.7 High school completer ...................... 45.2 46.9 (0.56) 50.7 (0.47) 9,609 54.2 (0.88) 62.4 (0.85) 49.7 (0.88) 16.2 (0.65) 9.5 Some college .................................... 58.6 61.5 (0.68) 62.4 (0.52) 8,341 61.2 (0.92) 69.3 (0.87) 54.2 (0.94) 22.2 (0.79) 11.1 Associate’s degree ............................ 63.7 65.4 (0.99) 68.3 (0.70) 4,487 58.4 (1.27) 70.0 (1.18) 55.1 (1.28) 20.7 (1.05) 10.4 Bachelor’s degree ............................. 67.6 73.5 (0.67) 81.5 (0.40) 10,752 68.7 (0.77) 82.6 (0.63) 60.1 (0.82) 34.1 (0.79) 14.0 Master’s degree................................. 66.5 77.5 (1.10) 86.3 (0.58) 4,106 68.9 (1.25) 87.7 (0.88) 60.7 (1.32) 41.7 (1.33) 13.9 Doctor’s or professional degree ........
Race/ethnicity
68.2 77.6 (2.06) 85.1 (1.09) 1,244 64.5 (2.34) 86.2 (1.69) 65.3 (2.33) 34.9 (2.34) 14.3
White..................................................... 48.7 53.8 (0.28) 61.6 (0.21) 59,806 65.5 (0.34) 76.6 (0.30) 56.7 (0.35) 30.7 (0.33) 16.0 Black ..................................................... 36.2 40.0 (0.74) 46.5 (0.61) 6,556 55.4 (1.09) 67.8 (1.02) 56.8 (1.08) 24.2 (0.94) 16.7 Hispanic ................................................ 29.3 30.2 (0.80) 31.2 (0.61) 5,421 58.9 (1.32) 68.1 (1.25) 56.5 (1.33) 24.8 (1.16) 15.6 Other..................................................... — — (†) 59.4 (0.86) 4,786 68.7 (1.32) 79.2 (1.16) 60.9 (1.39) 31.3 (1.32) 22.9
See notes at end of table.

1993, 1997, and 2003—Continued
DIG
ES
T O
F E
DU
CA
TIO
N S
TA
TIS
TIC
S 2
00
9
62
2
CH
AP
TE
R 7
: Lib
rarie
s an
d E
du
catio
na
l Te
chn
olo
gy
Co
mp
ute
rs an
d T
ech
no
log
y
computer applications1
ming
Word processing/ desktop
publishing Other uses only Using 4 or more
categories
10 11 12 13
(0.53) 79.9 (0.55) 2.8 (0.23) 61.3 (0.67) (0.48) 74.8 (0.50) 5.2 (0.25) 51.8 (0.58) (0.73) 55.3 (1.12) 15.7 (0.82) 29.7 (1.03) (0.57) 60.9 (0.87) 11.5 (0.57) 41.0 (0.87) (0.46) 66.0 (0.69) 8.5 (0.40) 37.5 (0.70) (3.71) 55.3 (7.49) 9.4 (4.39) 26.1 (6.61) (1.44) 61.1 (2.12) 9.9 (1.30) 31.8 (2.02) (1.41) 44.4 (1.82) 17.9 (1.40) 29.7 (1.67) (1.15) 42.0 (1.59) 17.4 (1.22) 27.5 (1.44) (1.27) 40.1 (1.98) 23.1 (1.70) 21.7 (1.66)
(0.97) 54.9 (1.39) 16.0 (1.03) 30.6 (1.29) (0.82) 59.4 (1.21) 12.8 (0.82) 32.0 (1.15) (0.72) 61.0 (1.02) 12.0 (0.68) 36.5 (1.01) (0.76) 63.9 (1.05) 9.8 (0.65) 39.3 (1.06) (0.50) 65.4 (0.65) 8.3 (0.38) 43.6 (0.67) (0.42) 76.4 (0.45) 4.5 (0.22) 56.3 (0.52)
are subject to sampling and nonsampling error. Race categories tals because of rounding. Standard errors appear in parentheses. Current Population Survey (CPS ), Octob er 1993, October 1997, repared May 2005.)
Table 430. Percentage of workers, 18 years old and over, using computers on the job, by type of computer application and selected characteristics:
Selected characteristic
Percent using
computers at work,
1993
Percent using computers at
work, 1997
2003
Percent using computers at work
Number using
computers at work (in
thousands)
Percent of on-the-job computer users using specific
Spreadsheets/ databases Internet/e-mail
Calendar/ schedule Graphics/design Program
1 2 3 4 5 6 7 8 9
Occupational group Management, business, and financial... [2] [2] (2) 80.8 (0.36) 15,840 79.8 (0.55) 88.0 (0.45) 69.1 (0.63) 35.8 (0.66) 18.5 Professional and related occupations ... [2] [2] (2) 78.8 (0.31) 22,517 64.4 (0.55) 81.9 (0.44) 58.7 (0.57) 38.9 (0.56) 22.1 Service occupations.............................. 23.2 26.4 (0.51) 28.2 (0.48) 5,898 48.8 (1.12) 58.4 (1.11) 48.9 (1.12) 20.0 (0.90) 12.0 Sales and related occupations.............. 44.5 51.7 (0.68) 61.1 (0.53) 9,464 61.4 (0.86) 73.0 (0.79) 53.6 (0.89) 26.4 (0.78) 11.7 Office and administrative support ......... [2] [2] (2) 73.9 (0.41) 14,206 63.2 (0.70) 70.4 (0.66) 54.4 (0.72) 19.3 (0.57) 11.5 Farming, fishing, and forestry ............... 7.9 8.6 (0.80) 10.8 (1.46) 132 55.5 (7.49) 57.7 (7.44) 42.2 (7.44) 20.7 (6.10) 6.5 Construction and extraction .................. 16.4 18.7 (0.73) 19.0 (0.68) 1,585 56.7 (2.15) 66.0 (2.06) 44.0 (2.15) 25.8 (1.90) 12.7 Installation, maintenance, and repair .... 11.7 12.6 (0.79) 42.0 (0.98) 2,229 50.8 (1.83) 61.4 (1.78) 44.5 (1.82) 21.1 (1.49) 18.3 Production occupations ........................ 21.8 23.7 (0.60) 29.6 (0.70) 2,869 52.4 (1.61) 54.9 (1.61) 43.0 (1.60) 26.0 (1.41) 14.9 Transportation and material moving...... 11.8 15.1 (0.80) 22.1 (0.71) 1,830 46.4 (2.01) 51.5 (2.02) 43.4 (2.00) 14.5 (1.42) 11.2
Family income3
Less than $20,000 ................................ 25.1 26.7 (0.51) 30.1 (0.62) 3,814 51.6 (1.40) 60.1 (1.37) 44.2 (1.39) 22.6 (1.17) 14.0 $20,000 to $29,999............................... 38.4 38.4 (0.61) 38.8 (0.63) 4,944 56.6 (1.22) 63.2 (1.18) 46.8 (1.23) 21.4 (1.01) 12.9 $30,000 to $39,999............................... 45.7 45.8 (0.62) 47.0 (0.59) 6,775 57.5 (1.04) 68.0 (0.98) 49.9 (1.05) 23.5 (0.89) 13.4 $40,000 to $49,999............................... 51.9 52.3 (0.71) 54.3 (0.64) 6,290 61.6 (1.06) 70.9 (0.99) 52.9 (1.09) 26.6 (0.96) 14.4 $50,000 to $74,999............................... 60.6 59.9 (0.50) 62.2 (0.41) 16,195 63.6 (0.65) 74.8 (0.59) 56.1 (0.67) 28.5 (0.61) 16.5 $75,000 or more ................................... 65.9 69.7 (0.51) 75.0 (0.30) 26,732 72.4 (0.47) 84.3 (0.38) 64.3 (0.51) 36.4 (0.51) 19.2
—Not available. NOTE: Data are based on a sample survey of households and†Not applicable. exclude persons of Hispanic ethnicity. Detail may not sum to to1Individuals may be counted in more than one computer activity. SOURCE : U.S . Department of Commerc e, Census Bureau, 2Due to changes in occupatio nal definitions, older data are not comparable to 2003 data. and October 2003, unpublished tabulations. (This table was p3Excludes persons whose income data were not available.