Chapter 7: Interval Estimation: One Populationdm.ieu.edu.tr/math280/m280-20142015-chap7-slide... ·...
30
Introduction Point Estimators Interval Estimators Chapter 7: Interval Estimation: One Population Department of Mathematics Izmir University of Economics Week 9-10 2014-2015 Chapter 7: Interval Estimation: One Population
Transcript of Chapter 7: Interval Estimation: One Populationdm.ieu.edu.tr/math280/m280-20142015-chap7-slide... ·...

IntroductionPoint Estimators
Interval Estimators
Chapter 7: Interval Estimation: One Population
Department of MathematicsIzmir University of Economics
Week 9-102014-2015
Chapter 7: Interval Estimation: One Population

IntroductionPoint Estimators
Interval Estimators
Introduction
In this chapter we will focus on
inferential statements concerning estimation of a single populationparameter, based on information contained in a random sample,
the estimation of population mean µ, population proportion p, andpopulation variance σ2, and
two estimation procedures:
First we estimate an unknown population parameter by a singlenumber called a point estimate.For most practical problems, a point estimate alone is notsufficient. So, a measure of variability is established by using aninterval of values called a confidence interval.
Chapter 7: Interval Estimation: One Population

IntroductionPoint Estimators
Interval Estimators
Estimators
Definition:
An estimator of a population parameter is a random variable depending onthe sample information. The value of an estimator provides an approximationto the unknown parameter. A specific value of the estimator is called asestimate.
We’ll deal with two kinds of estimators:
point estimator
interval estimator
Chapter 7: Interval Estimation: One Population
IntroductionPoint Estimators
Interval Estimators
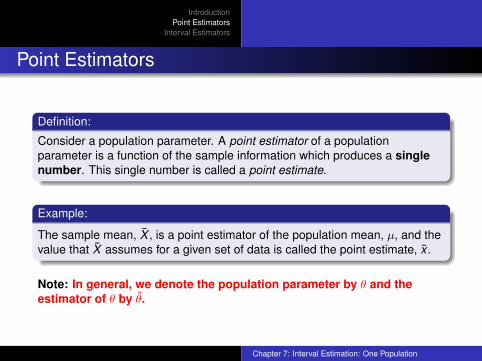
Point Estimators
Definition:
Consider a population parameter. A point estimator of a populationparameter is a function of the sample information which produces a singlenumber. This single number is called a point estimate.
Example:
The sample mean, X̄ , is a point estimator of the population mean, µ, and thevalue that X̄ assumes for a given set of data is called the point estimate, x̄ .
Note: In general, we denote the population parameter by θ and theestimator of θ by θ̂.
Chapter 7: Interval Estimation: One Population

IntroductionPoint Estimators
Interval Estimators
Properties of Point Estimators
Estimators are evaluated depending on three important properties:
unbiasedness
consistency
efficiency
Chapter 7: Interval Estimation: One Population

IntroductionPoint Estimators
Interval Estimators
Unbiasedness
Definition:
A point estimator is unbiased if its expected value is equal to the populationparameter. That is, if
E(θ̂) = θ,
then θ̂ is an unbiased estimator of the parameter θ.
Example:
The sample variance (s2) is an unbiased estimator of the population variance(σ2) because
E(s2) = σ2.
Interpretation: An unbiased estimator can estimate the populationparameter correctly on the average. In other words, if the estimator θ̂ isunbiased then the average θ̂ value is exactly correct. (It does not mean that aparticular θ̂ is exactly correct.)
Chapter 7: Interval Estimation: One Population

IntroductionPoint Estimators
Interval Estimators
Note: The estimators which are not unbiased are said to be biased.
Definition:
Let θ̂ be an estimator of θ. We define the bias in terms of θ̂ as follows
Bias(θ̂) = E(θ̂)− θ.
If Bias(θ̂) = 0, then θ̂ is unbiased.
If Bias(θ̂) 6= 0, then θ̂ is biased.
Chapter 7: Interval Estimation: One Population

IntroductionPoint Estimators
Interval Estimators
Consistency
Definition:
A point estimator θ̂ is a consistent estimator of the population parameter θ ifBias(θ̂) = E(θ̂)− θ becomes smaller as the sample size increases.
Example:
t2 = 1n
n∑i=1
(xi − x̄)2 is a consistent estimator of σ2 because, as n→∞, t2
approaches s2 = 1n−1
n∑i=1
(xi − x̄)2, which is an unbiased estimator of σ2.
Chapter 7: Interval Estimation: One Population

IntroductionPoint Estimators
Interval Estimators
Efficiency
Definition:
If there are several unbiased estimators of a parameter, the estimator withthe smallest variance is called the most efficient estimator.
Example:
Let θ be a population parameter with two point estimators θ̂1 and θ̂2 satisfyingVar(θ̂1) < Var(θ̂2). Then we say that θ̂1 is more efficient than θ̂2 because ithas a smaller variance.
Chapter 7: Interval Estimation: One Population

IntroductionPoint Estimators
Interval Estimators
Properties of Selected Point Estimators
Properties of Selected Point Estimators:
Population parameter Point estimator PropertiesMean, µ X unbiased, most efficientMean, µ Median, x̃ unbiased, not most efficient
Variance, σ2 s2 unbiased, most efficient
Chapter 7: Interval Estimation: One Population

IntroductionPoint Estimators
Interval Estimators
Confidence intervals for the mean: Population variance knownConfidence intervals for the mean: Population variance unknownConfidence intervals for the population proportionConfidence intervals for the variance of a normal population
Interval Estimators
Definition:
A confidence interval estimator for a population parameter is a rule fordetermining a range or an interval that is likely to include the parameter. Thecorresponding estimate is called a confidence interval estimate.
Note: An interval estimate is better than a point estimate since it allowsmore information about a population characteristic.
Chapter 7: Interval Estimation: One Population

IntroductionPoint Estimators
Interval Estimators
Confidence intervals for the mean: Population variance knownConfidence intervals for the mean: Population variance unknownConfidence intervals for the population proportionConfidence intervals for the variance of a normal population
Confidence Interval
Definition:
Let θ be unknown parameter. If
P(a < θ < b) = 1− α, 0 < α < 1,
then the interval (a, b) is called a 100(1− α)% confidence interval (CI) of θand the quantity 100(1− α)% is called the confidence level of the interval.
In repeated samples of the population, the true value of the populationparameter θ is contained in 100(1− α)% of the intervals.
Chapter 7: Interval Estimation: One Population

IntroductionPoint Estimators
Interval Estimators
Confidence intervals for the mean: Population variance knownConfidence intervals for the mean: Population variance unknownConfidence intervals for the population proportionConfidence intervals for the variance of a normal population
Now, we will construct confidence intervals for
population mean whenever the population is normally distributed andpopulation variance is known,
population mean whenever the population is normally distributed andpopulation variance is unknown,
population proportion, and
population variance whenever the population is normally distributed.
Chapter 7: Interval Estimation: One Population

IntroductionPoint Estimators
Interval Estimators
Confidence intervals for the mean: Population variance knownConfidence intervals for the mean: Population variance unknownConfidence intervals for the population proportionConfidence intervals for the variance of a normal population
CI for the mean of a population that is normallydistributed: Population variance known
In this section population variance (σ2) is known but population mean (µ) isunknown. Our aim is to find a range of values (rather than a single value) toestimate the population mean µ.
Assumptions:
Population is normally distributed. That is consider a random sample ofn observations from a normal distribution with known variance σ2.
If the population is not normal use a large sample.
Chapter 7: Interval Estimation: One Population

IntroductionPoint Estimators
Interval Estimators
Confidence intervals for the mean: Population variance knownConfidence intervals for the mean: Population variance unknownConfidence intervals for the population proportionConfidence intervals for the variance of a normal population
The confidence interval for the population mean with known variance is
x̄ − zα2
σ√n< µ < x̄ + zα
2
σ√n.
The confidence interval can be also written as
x̄ ±ME.
Here
zα2
is called the reliability factor,
SE = σ√n is the standard error,
ME = zα2σ√
n is the margin of error,
w = 2ME is the width,
UCL = x̄ + zα2σ√
n is the upper confidence limit, and
LCL = x̄ − zα2σ√
n is the lower confidence limit.
Chapter 7: Interval Estimation: One Population

IntroductionPoint Estimators
Interval Estimators
Confidence intervals for the mean: Population variance knownConfidence intervals for the mean: Population variance unknownConfidence intervals for the population proportionConfidence intervals for the variance of a normal population
Example: For 95% confidence level find the reliability factor.
Chapter 7: Interval Estimation: One Population

IntroductionPoint Estimators
Interval Estimators
Confidence intervals for the mean: Population variance knownConfidence intervals for the mean: Population variance unknownConfidence intervals for the population proportionConfidence intervals for the variance of a normal population
Example: Suppose that shopping times for customers at a local grocerystore are normally distributed with standard deviation of 20 minutes. Arandom sample of 64 shoppers in the local grocery store had a mean time of75 minutes. Find the standard error, margin of error, width, and the upper andlower confidence limits of a 95% confidence interval for the population meanµ.
Chapter 7: Interval Estimation: One Population

IntroductionPoint Estimators
Interval Estimators
Confidence intervals for the mean: Population variance knownConfidence intervals for the mean: Population variance unknownConfidence intervals for the population proportionConfidence intervals for the variance of a normal population
Example: A process produces bags of refined sugar. The weights of thecontents of these bags are normally distributed with standard deviation 1.2ounces. The contents of a random sample of 25 bags had a mean weight of19.8 ounces. Find the upper and lower confidence limits of 99% confidenceinterval for the true mean weight for all bags of sugar produced by theprocess.
Chapter 7: Interval Estimation: One Population

IntroductionPoint Estimators
Interval Estimators
Confidence intervals for the mean: Population variance knownConfidence intervals for the mean: Population variance unknownConfidence intervals for the population proportionConfidence intervals for the variance of a normal population
Common Levels of Confidence
Confidence level percentage α zα2
80 0.2 1.2890 0.1 1.64595 0.05 1.9698 0.02 2.3399 0.01 2.58
Chapter 7: Interval Estimation: One Population
IntroductionPoint Estimators
Interval Estimators
Confidence intervals for the mean: Population variance knownConfidence intervals for the mean: Population variance unknownConfidence intervals for the population proportionConfidence intervals for the variance of a normal population
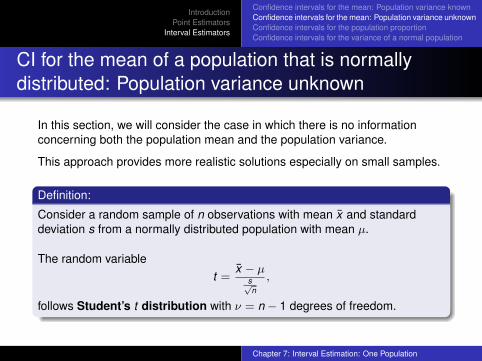
CI for the mean of a population that is normallydistributed: Population variance unknown
In this section, we will consider the case in which there is no informationconcerning both the population mean and the population variance.
This approach provides more realistic solutions especially on small samples.
Definition:
Consider a random sample of n observations with mean x̄ and standarddeviation s from a normally distributed population with mean µ.
The random variablet =
x̄ − µs√n
,
follows Student’s t distribution with ν = n − 1 degrees of freedom.
Chapter 7: Interval Estimation: One Population

IntroductionPoint Estimators
Interval Estimators
Confidence intervals for the mean: Population variance knownConfidence intervals for the mean: Population variance unknownConfidence intervals for the population proportionConfidence intervals for the variance of a normal population
Student’s t DistributionRemark:
Since the population standard deviation σ is unknown, we use thesample standard deviation s.If n ≤ 30 we use t-distribution, otherwise, i.e., if n > 30 we can usenormal distribution (z-distribution) by the Central Limit Theorem.The graph of density function of t is very similar to the one of standardnormal distribution. It gets closer to the normal distribution graph as νincreases.The reliability factor is denoted by tν,α2 ; note that
Shaded area =α
2= P(tν > tν,α2 )
Chapter 7: Interval Estimation: One Population

IntroductionPoint Estimators
Interval Estimators
Confidence intervals for the mean: Population variance knownConfidence intervals for the mean: Population variance unknownConfidence intervals for the population proportionConfidence intervals for the variance of a normal population
As an example, suppose that we require the number, which is exceeded withprobability 0.05, by a Student’s t random variable with 15 degrees of freedom.
Thenν = 15,
α
2= 0.05
and by the last property
P(t15 > t15,0.05) =α
2= 0.05.
Using the table for Student’s t distribution
t15,0.05 = 1, 753.
Chapter 7: Interval Estimation: One Population

IntroductionPoint Estimators
Interval Estimators
Confidence intervals for the mean: Population variance knownConfidence intervals for the mean: Population variance unknownConfidence intervals for the population proportionConfidence intervals for the variance of a normal population
CI for the mean of a normal distribution: Populationvariance unknown
Assumptions:
Population standard deviation is unknown.
Population is normally distributed.
t → Z as n increases. That is, for large samples Student’s t distributionbehaves similar to standard normal distribution. Therefore if thepopulation distribution is not normal, it is better to use a large sample.
Chapter 7: Interval Estimation: One Population

IntroductionPoint Estimators
Interval Estimators
Confidence intervals for the mean: Population variance knownConfidence intervals for the mean: Population variance unknownConfidence intervals for the population proportionConfidence intervals for the variance of a normal population
The confidence interval for the population mean with unknown variance is
x̄ − tn−1,α2
s√n< µ < x̄ + tn−1,α2
s√n.
The confidence interval can be also written as
x̄ ±ME,
whereME = tn−1,α2
s√n.
Chapter 7: Interval Estimation: One Population

IntroductionPoint Estimators
Interval Estimators
Confidence intervals for the mean: Population variance knownConfidence intervals for the mean: Population variance unknownConfidence intervals for the population proportionConfidence intervals for the variance of a normal population
Example. Calculate the margin of error to estimate the population mean µ foreach of the following:
a) α = 0.05, n = 6, s = 40,
b) α = 0.1, n = 64, s = 56,
c) 98% confidence interval, n = 120, s2 = 100.
Chapter 7: Interval Estimation: One Population

IntroductionPoint Estimators
Interval Estimators
Confidence intervals for the mean: Population variance knownConfidence intervals for the mean: Population variance unknownConfidence intervals for the population proportionConfidence intervals for the variance of a normal population
Example. Times in minutes that a random sample of five people spenddriving to work are
30 42 35 40 45
a) Calculate the standard error.
b) Find tν,α2 for a 95 percentage confidence interval for the true populationmean.
c) Calculate width for a 95% confidence interval for the population meantime spent driving to work.
Chapter 7: Interval Estimation: One Population

IntroductionPoint Estimators
Interval Estimators
Confidence intervals for the mean: Population variance knownConfidence intervals for the mean: Population variance unknownConfidence intervals for the population proportionConfidence intervals for the variance of a normal population
CI for the population proportion
Recall that, we denote the proportion of success of a population by p. Also, p̂refers the observed population proportion of successes in a random sampleof n observations from a population with proportion p.
Then, if np(1− p) > 5, a 100(1− α)% confidence interval for the populationproportion is given by
p̂ ±ME,
where
ME = zα2
√p̂(1− p̂)
n.
Chapter 7: Interval Estimation: One Population

IntroductionPoint Estimators
Interval Estimators
Confidence intervals for the mean: Population variance knownConfidence intervals for the mean: Population variance unknownConfidence intervals for the population proportionConfidence intervals for the variance of a normal population
Example: Suppose that a random sample of 142 graduate - admissionspersonnel was asked what role scores of standardized tests (such as theGMAT or GRE) play in the consideration of a candidate for graduate school.Of these sample members, 87 answered "very important". Find a 95%confidence interval for the population proportion of graduate admissionspersonnel with this view.
Chapter 7: Interval Estimation: One Population

IntroductionPoint Estimators
Interval Estimators
Confidence intervals for the mean: Population variance knownConfidence intervals for the mean: Population variance unknownConfidence intervals for the population proportionConfidence intervals for the variance of a normal population
CI for the variance of a normal population
Suppose that there is a random sample of n observations from a normallydistributed population with variance σ2.
If the observed sample variance is s2, then the lower and upper confidencelimits of a 100(1− α)% confidence interval for the population variance isgiven respectively by
LCL =(n − 1)s2
χ2n−1,α2
and UCL =(n − 1)s2
χ2n−1,1−α
2
.
Chapter 7: Interval Estimation: One Population

IntroductionPoint Estimators
Interval Estimators
Confidence intervals for the mean: Population variance knownConfidence intervals for the mean: Population variance unknownConfidence intervals for the population proportionConfidence intervals for the variance of a normal population
Example: A psychologist wants to estimate the variance of employee testscores. A random sample of 18 scores had a sample standard deviation of10.4. Find a 90% confidence interval for the population variance.
Chapter 7: Interval Estimation: One Population