Chapter- 7 GIS-T Applicationsnptel.ac.in/courses/105108073/module3/lecture7.pdf · Chapter-7: GIS-T...
35
Chapter-7: GIS-T Applications NPTEL Web Course (12 th Aug. 2011) Course Title: Geo-informatics in Transportation Engineering Course Co-ordinator: Dr. Ashish Verma, IISc Bangalore 150 Chapter- 7 GIS-T Applications Key words: GIS and transportation, matrix operations, SP analysis, network analysis. In the past, many individual developments, both technological and conceptual led to the rise of Transportation-GIS (GIS-T) especially during 1980s and 1990s. In this chapter, an attempt has been made to review these individual developments which led to the rise of GIS-T, and also to bring out the trends and future directions of research in this most exciting and useful field of GIS endeavour. 7.1 Introduction Transportation applications of GIS have become increasingly popular in recent years, so much so that they are routinely referred to by the acronym GIS-T. This is mainly due to the fact that to design an efficient transportation system, one needs to collect, manage, retrieve, and analyze a large amount of data, which is not possible with the manual and heuristic approaches prevailing till date. Hence, there is a need for an efficient database management system to handle such large-scale data, and Geographical Information Systems (GIS) is one such efficient system, which has been thoroughly described in previous chapters. But, GIS in transportation is more than just one more domain of application of generic GIS functionality. GIS-T has several data modeling, data manipulation, and data analysis requirements that are not fulfilled by conventional GIS. To quote, Vonderohe et al (1993), “the necessary enhancement to existing Transportation Information Systems (TISs) is the structuring of the attribute databases to provide consistent location reference data in a form compatible with the GIS, which in turn has been enhanced to represent and process geographic data in the forms required for transportation applications. Now-a-days, there are already many conferences which are fully devoted to GIS-T and even many of the general GIS conferences have special sessions on GIS-T and closely related topics such as infrastructure management. GIS-T is well represented in GIS journals such as computers, Environment and Urban Systems, the International Journal of Geographic Information Science, Geographical Systems, Transactions in GIS, GIS Development, and Geographic Information
Transcript of Chapter- 7 GIS-T Applicationsnptel.ac.in/courses/105108073/module3/lecture7.pdf · Chapter-7: GIS-T...

Chapter-7: GIS-T Applications NPTEL Web Course (12th Aug. 2011)
Course Title: Geo-informatics in Transportation Engineering Course Co-ordinator: Dr. Ashish Verma, IISc Bangalore
150
Chapter- 7
GIS-T Applications
Key words: GIS and transportation, matrix operations, SP analysis, network analysis.
In the past, many individual developments, both technological and conceptual led to the rise of
Transportation-GIS (GIS-T) especially during 1980s and 1990s. In this chapter, an attempt has
been made to review these individual developments which led to the rise of GIS-T, and also to
bring out the trends and future directions of research in this most exciting and useful field of GIS
endeavour.
7.1 Introduction
Transportation applications of GIS have become increasingly popular in recent years, so much so
that they are routinely referred to by the acronym GIS-T. This is mainly due to the fact that to
design an efficient transportation system, one needs to collect, manage, retrieve, and analyze a
large amount of data, which is not possible with the manual and heuristic approaches prevailing
till date. Hence, there is a need for an efficient database management system to handle such
large-scale data, and Geographical Information Systems (GIS) is one such efficient system,
which has been thoroughly described in previous chapters. But, GIS in transportation is more
than just one more domain of application of generic GIS functionality. GIS-T has several data
modeling, data manipulation, and data analysis requirements that are not fulfilled by
conventional GIS. To quote, Vonderohe et al (1993), “the necessary enhancement to existing
Transportation Information Systems (TISs) is the structuring of the attribute databases to provide
consistent location reference data in a form compatible with the GIS, which in turn has been
enhanced to represent and process geographic data in the forms required for transportation
applications.
Now-a-days, there are already many conferences which are fully devoted to GIS-T and even
many of the general GIS conferences have special sessions on GIS-T and closely related topics
such as infrastructure management. GIS-T is well represented in GIS journals such as computers,
Environment and Urban Systems, the International Journal of Geographic Information Science,
Geographical Systems, Transactions in GIS, GIS Development, and Geographic Information
Chapter-7: GIS-T Applications NPTEL Web Course (12th Aug. 2011)
Course Title: Geo-informatics in Transportation Engineering Course Co-ordinator: Dr. Ashish Verma, IISc Bangalore
151
Sciences. There have been special issues of traditional transportation journals devoted to GIS-T
and special GIS-T journals such as the IVHS Journal. Finally, there are GIS packages like
TransCAD, which have been developed specifically for GIS-T, although much of the additional
functionality required in GIS-T may also be found in the industry leading generic GIS packages.
In short, it is possible to state unequivocally that GIS-T has „arrived‟ and now represents one of
the most important application areas of GIS technology, Maguire et al (1993).
7.2 Geographic Information Systems and Transportation
The four major components of a GIS, encoding, management, analysis and reporting, have
specific considerations for transportation:
Encoding. Deals with issues concerning the representation of a transport system and its
spatial components. To be of use in a GIS, a transport network must be correctly
encoded, implying a functional topology composed of nodes and links. Other elements
relevant to transportation, namely qualitative and quantitative data, must also be encoded
and associated with their respective spatial elements. For instance, an encoded road
segment can have data related to its width, number of lanes, direction, peak hour traffic,
etc.
Management. The encoded information often is stored in a database and can be
organized along spatial (by region, country, census units, etc.), thematic (for highway,
transit, railway, terminals, etc.) or temporal (by year, month, week, etc.) considerations. It
is important to design a GIS database that organizes a large amount of heterogeneous data
in an integrated and seamless environment such that the data can be easily accessed to
support various transportation application needs.
Analysis. Considers the wide array of tools and methodologies available for transport
issues. They can range from a simple query over an element of a transport system (what
is the peak hour traffic of a road segment?) to a complex model investigating the
relationships between its elements (if a new road segment was added, what would be the
impacts on traffic and future land use developments?).
Reporting. A GIS would not be complete without all its visualization and data reporting
capabilities for both spatial and non-spatial data. This component is particularly

Chapter-7: GIS-T Applications NPTEL Web Course (12th Aug. 2011)
Course Title: Geo-informatics in Transportation Engineering Course Co-ordinator: Dr. Ashish Verma, IISc Bangalore
152
important as it offers interactive tools to convey complex information in a map format. A
GIS-T thus becomes a useful tool to inform people who otherwise may not be able to
visualize the hidden patterns and relationships embedded in the datasets (potential
relationships among traffic accidents, highway geometry, pavement condition, and
terrain).
Information in a GIS is often stored and represented as layers, which are a set of geographical
features linked with their attributes. In Figure - 7.1 a transport system is represented as three
layers related to land use, flows (spatial interactions) and the network. Each has its own features
and related data.
Figure - 7.1: Representation of Transportation System
7.3 Historical Development of GIS-T
The concept of GIS traces its root back to a handful of research initiatives in the US, Canada and
Europe during the late 1950s. It is widely acknowledged that the first real GIS was the Canada
Geographic Information System set up for the Canada Land Inventory. As far as GIS-T is

Chapter-7: GIS-T Applications NPTEL Web Course (12th Aug. 2011)
Course Title: Geo-informatics in Transportation Engineering Course Co-ordinator: Dr. Ashish Verma, IISc Bangalore
153
concerned, many individual developments, both technological and conceptual, have contributed
to its rise. Technologically, GIS-T, like GIS as a whole, benefited from developments in
management information systems and database techniques in general, and relational databases in
particular. The development of „stand alone‟ packages for carrying out specific operations such
as shortest path analysis and location-allocation modeling (Rushton et al, 1973), and more
recently the McTrans programs (University of Florida, Transportation Research Center) all
contributed to the development of GIS-T. On the hardware side, the development of powerful
and low cost desktop computing hardware assisted the introduction of GIS-T into even smallest
government departments of transportation.
Many conceptual developments were also important in aiding the rise of prominence of GIS-T.
These developments included works in operations research and programming, which led to new
algorithms for shortest path analysis, routing procedures, solving the „transportation problem‟ of
linear programming, and the dynamic segmentation of links within the GIS-T, (Church and
Sorensen, 1996). Frequently, these algorithms became embedded first in the stand-alone
packages such as Ostresh‟s (1973) shortest path analysis routines and then in the fully developed
GIS and GIS-T packages such as ARC/INFO and TransCAD, respectively. Equally important
was the development of a systems approach to transportation planning (Stopher and Meyburg
1975, Wilson 1974) and the so-called four-step model of trip generation, trip distribution, modal
split and network assignment, as discussed in the previous chapter.
One of the forerunners of the original GIS-T applications was the Geodata Analysis and Display
System (GADS) which was developed by the IBM Research Division in the mid 1970s to help
solve problems such as police beat and school boundary design, (Keen and Morton, 1978). While
GADS was not typical of the later generation GIS-T packages it did incorporate such datasets as
traffic pattern and transportation infrastructure; it was essentially a rudimentary GIS. Shortly,
after this, and totally independent of the American work, research in Sweden led to the
establishment of a road data bank which was used for transportation planning (Bydler and
Nilsson, 1977). In the Swedish system many of the fundamental problems and challenges in the
development of GIS-T, such as the node and link referencing system and the data content of the
system, were addressed and resolved for the first time.
Chapter-7: GIS-T Applications NPTEL Web Course (12th Aug. 2011)
Course Title: Geo-informatics in Transportation Engineering Course Co-ordinator: Dr. Ashish Verma, IISc Bangalore
154
The above represents a brief history of some of the more important milestones which led to the
development of GIS-T in the 1980s and 1990s. A more detailed account may be found in
Simkowitz (1988).
7.4 The Structure of a GIS-T
7.4.1 The Relational Database Management Model
Today most GIS-T uses a relational database model for the storage of attributes. Grayson (1991)
discusses the use of an external relational database management system (RDBMS) which uses
Structured Query Language (SQL) in conjunction with the ARC/INFO GIS. This approach is
becoming less necessary as many GIS and GIS-T packages incorporate their own RDBMS.
Other database models such as the flat files have been used but they became less popular in the
1980s because of the greater conceptual and operational elegance of the relational database
(Healey, 1991). Maguire et al (1993) describe the RoMIS system developed by Oracle
Corporation as part of their highways application package and also the HERMIS system
developed for the Ingres RDBMS. While these systems allow for the efficient storage of
transportation network and attribute data, they do not provide any geographical analysis or
mapping capabilities. Such capabilities are provided by ESRI‟s ARCHIS (ARC/INFO Highways
Information System) which also includes an interface to Oracle‟s RoMIS.
7.4.2 Spatial Databases
Bydler and Nilsson (1977) were among the first to address the complexity of developing a
location referencing system for a GIS-T. Goodwin et al (1995) provides a summary of the more
common systems. These include: link Ids using either a planar or non-planar graph
representation; linear referencing systems where location is specified as distance from an
established node or even a non-topologically significant point along the road (Goodwin et al,
1995 note that the USA is working towards a national standard for a linear referencing system);
coordinate systems (Scarponcini, 1995 describes seven different coordinate systems and two
different datum in use at the Minnesota department of transportation); street addresses (which

Chapter-7: GIS-T Applications NPTEL Web Course (12th Aug. 2011)
Course Title: Geo-informatics in Transportation Engineering Course Co-ordinator: Dr. Ashish Verma, IISc Bangalore
155
frequently suffer from the problem of ambiguity because similar names are located in close
proximity to one another), and finally cross street matching which defines points as offsets from
a given node and segments as the difference between two offsets.
7.5 Essential Operations and Capabilities Required for a GIS-T
A state-of-art review of the important capabilities of a GIS-T has been done by Nyerges (1989).
7.5.1 General GIS Operations Applied to Transportation-GIS
Many of the operations commonly found in commercial GIS-T packages or systems being run by
municipal governments or private firms (e.g. trucking companies) would incorporate the
standard capabilities to be found in any GIS. These operations include data editing, display and
spatial and conditional search functions.
One standard editing feature that is especially useful in GIS-T is the ability to manipulate
existing link attributes to produce entirely new attributes which have applications in
transportation planning. Thus it should be possible to divide the arc length by the speed limit in
order to estimate travel time (Rowell, 1996). The ability to edit data spatially is essential. For
example knowing the number of individuals with particular socioeconomic characteristics who
live within walking distance of a light rail transit station would help the transportation planner to
estimate the potential ridership. Display capabilities should allow for the import of raster images
as background information for the vector transportation database, thus allow users to orient
themselves to the real world.
Buffering capabilities are also a commonplace feature in generic GIS but they are particularly
important in GIS-T for determining the accessibility of population groups close to transportation
routes and services and for determining the environmental and noise impacts of these facilities
(Love, 1984; Aultman et al, 1997). It is also important to be able to combine spatial searches and
conditional queries within a GIS-T. For example, all narrow roads within 20 miles of a chosen
feature should be easily obtainable. Address geocoding is another critical feature for many GIS-T
applications (Arthur and Waters, 1995). Finally, the GIS-T should have report generating
Chapter-7: GIS-T Applications NPTEL Web Course (12th Aug. 2011)
Course Title: Geo-informatics in Transportation Engineering Course Co-ordinator: Dr. Ashish Verma, IISc Bangalore
156
capabilities. These are important for accident analysis and road maintenance (Bydler and
Nilsson, 1977).
7.5.2 Matrix Operation in GIS-T
Generic GIS packages usually store attribute data in the tabular form associated with traditional
spreadsheet and database technology, which is commonly known as the data view (Waters,
1995). In a GIS-T an equally useful form of storage is the matrix in which both rows and
columns represent the same set of geographical features, either points such as cities or areas such
as traffic analysis zones (TAZs), (Nyerges, 1995). The rows are usually regarded as the origins
and the columns the destinations. Thus each element of the matrix can store such information as
traffic or commodity flows, travel time or distance measures, and migration patterns. This is
known as the matrix view.
Because such matrices are the basis of many forms of analysis in transportation research, Taaffe
et al (1996), the GIS-T should be able to create, modify and edit such matrices. Traditionally
such matrices are square but some GIS-T packages such as TransCAD allow user to select sets of
columns, which may not be identical to the rows, and thus rectangular matrices are also possible.
One form of display that is common in transportation research is a map of desire lines,
portraying the flows from one zone to all other zones. This is also used in location-allocation
modeling to show the allocation of users to a facility. The ability to create such maps directly
from a matrix view is a useful feature in any GIS-T. The GIS-T user should be able to edit cells,
rows, columns, ranges of cells, or indeed the entire matrix in a single operation. The user should
be able to perform the full range of mathematical operations on one or more of cells in the matrix
or to apply a formula to the selected cells. It is helpful if the GIS-T package can switch
automatically between the data view and the matrix view. Figure - 7.2 shows a typical matrix
created using GIS tool.

Chapter-7: GIS-T Applications NPTEL Web Course (12th Aug. 2011)
Course Title: Geo-informatics in Transportation Engineering Course Co-ordinator: Dr. Ashish Verma, IISc Bangalore
157
Figure - 7.2: Typical Matrix (City Distance) Constructed using GIS
7.5.3 Various Modeling Procedures
7.5.3.1 TIGER:
By far the most prolific network structure for GIS-T applications has been the model accepted by
the U.S. Bureau of the Census for its Topologically Integrated Geographic Encoding and
Referencing (TIGER) files. The TIGER model had developed from some earlier network data
models, and it was marked by its adherence to the principle of planar enforcement. Planar
enforcement simply means that all lines in the network are forced into a single plane, and all
intersections of lines are defined in that plane. The planar enforced TIGER model presented
several difficulties. First, many transportation applications are not concerned with the polygons

Chapter-7: GIS-T Applications NPTEL Web Course (12th Aug. 2011)
Course Title: Geo-informatics in Transportation Engineering Course Co-ordinator: Dr. Ashish Verma, IISc Bangalore
158
that may have transportation features as their boundaries. It is the transportation features
themselves that are of interest. Secondly, the planar enforcement that was needed to generate
polygons also had the effect of splitting transportation features into many small segments
whenever two features crossed in the plane. Therefore, there were many “intersections” in the
network data structure that didn‟t correspond to any actual intersection in the transportation
network at all.
7.5.3.2 Shortest Path Analysis (SPA):
SPA is an essential precursor to many GIS-T operations. It is critical for route location models
for determining the minimum environmental cost route (Lee and Tomlin, 1997; Thirumalaivasan
and Guruswamy, 2000), for determining allocations in a location-allocation model, for trip
assignment in transportation planning models, Nyerges (1995), and for automatic vehicle
dispatch systems (AVDS). Densham (1996) discusses the importance of SPA routines within his
visual interactive location system, which is part of an interface with the TransCAD GIS-T. A
major concern in the recent years has been the size of problems, which can be handled by
existing algorithms and the solution speed. Zhan (1996) has explored the use of fast shortest path
algorithms on extensive road networks.
Shortest path algorithms in a GIS-T should be highly flexible in order to handle the many
subtleties of the real world. It should be possible to solve the problem for one origin and one
destination or for many origins and many destinations. The GIS-T should be able to store a
variety of cost and other variables for each link in the network. Shortest paths in terms of time,
distance, and cost may all be relevant. The number of lanes, their height and width, and
restrictions such as those on hazardous materials should all be incorporated into the calculations.
The more sophisticated GIS packages (e.g. ARC/Info and TransCAD) allow impedance
functions to be specified for turns of various types, traffic lights, on-off ramps, and other traffic
controls and management devices. Algorithms for handling some of these features of the real
world were originally developed in the 1960s, Kirby and Potts (1969), although much more
comprehensive procedures have been developed, Ziliaskopoulos and Mahmassani (1996) which
are likely to be quickly incorporated into standard GIS-T packages. Behavioural work on
Chapter-7: GIS-T Applications NPTEL Web Course (12th Aug. 2011)
Course Title: Geo-informatics in Transportation Engineering Course Co-ordinator: Dr. Ashish Verma, IISc Bangalore
159
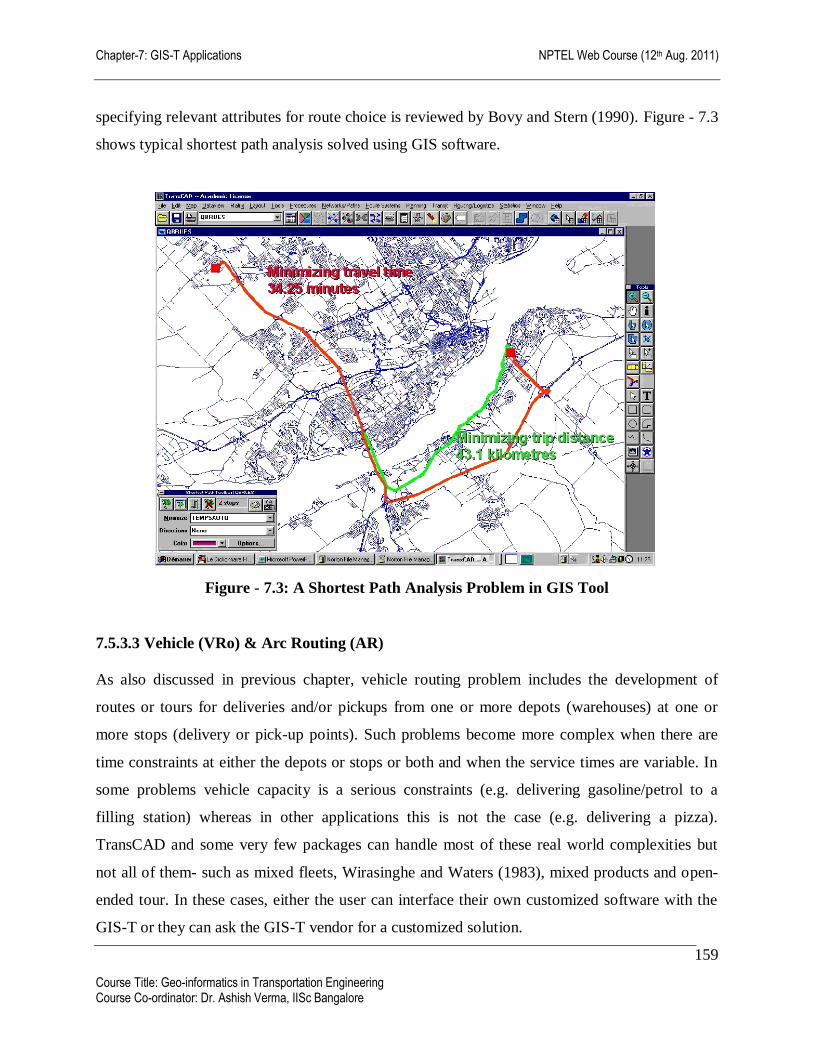
specifying relevant attributes for route choice is reviewed by Bovy and Stern (1990). Figure - 7.3
shows typical shortest path analysis solved using GIS software.
Figure - 7.3: A Shortest Path Analysis Problem in GIS Tool
7.5.3.3 Vehicle (VRo) & Arc Routing (AR)
As also discussed in previous chapter, vehicle routing problem includes the development of
routes or tours for deliveries and/or pickups from one or more depots (warehouses) at one or
more stops (delivery or pick-up points). Such problems become more complex when there are
time constraints at either the depots or stops or both and when the service times are variable. In
some problems vehicle capacity is a serious constraints (e.g. delivering gasoline/petrol to a
filling station) whereas in other applications this is not the case (e.g. delivering a pizza).
TransCAD and some very few packages can handle most of these real world complexities but
not all of them- such as mixed fleets, Wirasinghe and Waters (1983), mixed products and open-
ended tour. In these cases, either the user can interface their own customized software with the
GIS-T or they can ask the GIS-T vendor for a customized solution.

Chapter-7: GIS-T Applications NPTEL Web Course (12th Aug. 2011)
Course Title: Geo-informatics in Transportation Engineering Course Co-ordinator: Dr. Ashish Verma, IISc Bangalore
160
In the arc routing problems the GIS-T user is attempting to find routes which will allow for an
optimal (or at least an efficient) transversal of a set of arcs in the transportation network.
Applications include bus service and any residential delivery, pick-up or monitoring systems
such as mail delivery, solid waste collection, or meter reading, respectively. One of the aims of
such algorithm is to minimise the amount of „deadheading‟ which is the distance from the point
at which the service is completed back to the bus depot, mail sorting plant, or other base facility,
Waters et al (1986). Real world variations which a GIS-T should be able to handle, include
situations: where certain links may require service because they perhaps lack houses; where
service is required only on one side of a street; and where multiple passes may be required by
street cleaning vehicles. As with VRo problems there may be peculiar constraints such as time of
day restrictions, which may require customized solutions.
7.5.3.4 Spatial Interaction and Gravity Models
The gravity model is still used despite the limitations noted by Wilson (1974), although newer
forms of spatial interaction models such as the entropy maximising model popularised by Wilson
have largely replaced the more simplistic gravity model. GIS-T packages are now incorporating
these procedures as standard operations. Spatial interaction models are increasingly being used
as the basis for non-emergency applications of location-allocation models (Birkin et al, 1996;
Oppong, 1992).
7.5.3.5 The Urban Transportation Systems Planning (UTSP)
The four-step UTSP process of trip generation and attraction (how many trips?), trip distribution
(where do they go?), modal split (by what travel mode do they move?), and traffic or network
assignment (which route do they take?) is almost universally used in transportation planning
(Nyerges, 1995; Pas, 1995; Taaffe et al, 1996) and a GIS-T package should include procedures
for facilitating this process.
The aim of trip generation models is to predict the number of trips produced by each origin zone
or region. This task can be handled in many ways. The GIS-T analyst has to make choices
concerning the units of analysis, specifically, whether vehicle or person trips are being modeled

Chapter-7: GIS-T Applications NPTEL Web Course (12th Aug. 2011)
Course Title: Geo-informatics in Transportation Engineering Course Co-ordinator: Dr. Ashish Verma, IISc Bangalore
161
and whether to work at household or individual level (Caliper Corporation, 1996b; Wilson et al,
1974). Trip distribution models are used to predict the flow values in the transportation zone,
origin-destination matrix. Modal choice can be determined either at the zonal (aggregate) level or
at the individual (disaggregate) level. Estimation procedures may involve either revealed or
stated preference, Louviere (1988) and these can be modeled using popular choice such as
multinomial, binary, and nested logit models. Akiva and Lerman (1985) and Horowitz (1995)
provide comprehensive accounts of these procedures. Traffic assignment models are used to
allocate traffic volumes to the network based on the different strategies, a sophisticated GIS-T
should allow for a variety of traffic assignment strategies. TransCAD employs the following
strategies: all-or-nothing assignment; incremental assignment; capacity constraint assignment;
user equilibrium assignment; stochastic user equilibrium; and, finally, a system optimum
assignment.
Although it implies that the four-step model is strictly sequential, in practice the process is
usually iterative: in particular, the output from the traffic assignment may be used as input to the
earlier parts of the model (Nyerges, 1995; Miller and Storm, 1996). In addition, the GIS-T
should be used to evaluate the efficiency and effectiveness of the forecast in terms of system
parameters such as performance, safety, level of service, environmental concerns, and financial
considerations.
7.5.3.6 GIS in Land Use Modeling
GIS is an enabling technology for land use modeling, and typically are either linked to or is used
to feed data to most current land use models. This useful connection between GIS and land use
models was recognized early on. One of the first uses of the SYMAP, a computer mapping
software was to visualize the outputs of land use simulators.
Although none are in widespread use, there are many land use models that have been developed.
Thirteen are described by Wegener (1995). Many of the more recent models have been linked to
some form of GIS for gathering inputs or the presentation of results. The California Urban
Futures Model (Landis, 1994) is built upon a GIS platform, and predicts housing developments
for sites: however, it does not treat transportation as a determinant of land use. In models that do

Chapter-7: GIS-T Applications NPTEL Web Course (12th Aug. 2011)
Course Title: Geo-informatics in Transportation Engineering Course Co-ordinator: Dr. Ashish Verma, IISc Bangalore
162
include transport, both zonal (polygonal) and grid cell structures have been used, and historically
most models were aggregate in nature, as were the prevalent transport forecasting models in use.
In general, land use models have not been very detailed geographically, and tend to be coarser in
detail than the transport models that are used. There are computational limits, and some data may
not be available at more detailed geographic scales (Green and Flowerdew, 1996).
With the maturation of choice models, land use models are becoming more disaggregate and
behavioral in nature, and will require and benefit from the greater geographic detail that GIS
technology can provide. For example, the UrbanSim model development effort incorporates
disaggregate data which is aggregated to a grid layer with square cells that are 150 m on a side.
Parcel-based land use models can be envisioned, which may be the most natural level for
modeling.
GIS technology offers the prospects of providing great volumes of data for modeling from
existing data systems and tools for obtaining and creating other data needed for land use models.
Aerial photography and remote sensing can provide measurements of variables that are important
but are not captured in the municipal GIS. Buffering and polygon overlay can be used to create
new variables. A GIS has many facilities for managing spatial data of diverse types, and thus
offers useful data management for the entities of interest in a land use model, be the roads,
households, residential, dwellings, land use polygons, shopping centers, or employment sites.
Any data of interest can be associated with these polygons, lines, or points.
7.5.3.7 Freight Modeling
The scale independence of a GIS-T based modeling system has facilitated national and inter-
regional fright transport model applications. Among these are multimodal models that include
shipment by truck, rail, air, and sea. In USA, GIS-T (TransCAD) has been used to synthesize
modal freight networks and apply a traffic model for freight modeling for capacity analysis.
Extensive use of GIS-T technology was made to integrate state level data sets, national data sets,
freight data, and traffic information in a consistent network. Figure - 7.4 shows typical freight
demand analysis.

Chapter-7: GIS-T Applications NPTEL Web Course (12th Aug. 2011)
Course Title: Geo-informatics in Transportation Engineering Course Co-ordinator: Dr. Ashish Verma, IISc Bangalore
163
Figure - 7.4: Freight Modelling using GIS
7.5.3.8. Public Policy Making
In the policy making process, different studies can be carried out using GIS. One of the examples
of this is freight traffic analysis using GIS. This includes integrating truck count data that can be
visualized with GIS in a number of ways: by volume, by percentage of total traffic and by
percentage growth. This type of data can be used to evaluate truck impacts and design mitigation
measures such as designing truck routes, and where to impose truck restrictions.
Likewise GIS are an especially important tool when environmental impacts have to be estimated.
These data have spatial extents, so overlaying them with traffic volumes in GIS is an excellent
method. Another important issue in public planning is to find patterns in the locations of logistic
centers for an optimal planning of public infrastructure for freight transport. These GIS based
routing systems can also be used to evaluate the impacts of major incidents that may close down
a section of highway.

Chapter-7: GIS-T Applications NPTEL Web Course (12th Aug. 2011)
Course Title: Geo-informatics in Transportation Engineering Course Co-ordinator: Dr. Ashish Verma, IISc Bangalore
164
7.6 Some Specialized Studies Done using GIS-T
Following are some of the examples, illustrating the studies done using GIS-T. They can be
broadly classified into, Transport Management Systems, Travel Demand Modeling, Route
Planning, and Other Studies.
7.6.1 Transport Management Systems Studies
Many studies have been attempted in GIS-T environment. Simkowitz (1990) points out that a
pavement management system (PMS) should address all aspects of the pavement management
process from planning and programming through project development and implementation.
Simkowitz shows how GIS technology can be used to expand and enhance each of these PMS
components. All reported concepts and results have been incorporated into TransCAD, the GIS
for transportation software. His conclusions are that the coupling of appropriate GIS technology
with stand-alone PMS can result in a greatly enhanced PMS process and also that TransCAD has
all the tools for comprehensive PMS/GIS. Partheeban & Santhakumar (1999) described the
development of a database for highways around Tiruchirapalli, India (GIS/HAT) using GIS
developed in Visual BASIC language. They have tried to present GIS in VB as a viable
alternative to the existing GIS software, which are costly to be purchased by planners from
developing countries. Kharola and Gopalkrishna (1999) have presented GIS as a powerful
analytical tool and discuss its introduction into urban transport undertakings especially with
regard to fleet management. Singh (1999), developed the GIS database in TransCAD and used it
for the planning and management of regional road network. A study region of five districts
around Mumbai Metropolitan Region was considered for this purpose. The objective functions of
his study were: a) to develop the GIS database structure for the regional road network based on
the organizational hierarchy of the PWD in the country, and b) to develop GIS based procedure
for road network management, rural road planning and, road safety analysis. The main drawback
with his work is that the database is based on the secondary data obtained from PWD, which is
incomplete and inaccurate at many places. Dueker and Butler (2000) developed a framework and
principles for sharing transportation data, both of which are based on an enterprise GIS-T model
that defines relations among transportation data elements. The data model guards against
Chapter-7: GIS-T Applications NPTEL Web Course (12th Aug. 2011)
Course Title: Geo-informatics in Transportation Engineering Course Co-ordinator: Dr. Ashish Verma, IISc Bangalore
165
ambiguities and provides a basis for the development of the framework and principles for sharing
transportation data. A model to synchronies the management and query of temporal and spatially
referenced transportation data in GIS has been described by Sutton and Wyman (2000). The
model employs a method referred to as dynamic location, which facilitates spatial intersect
queries from geographic shapes without the use of topological relationships.
7.6.2 Route Planning Studies
Lepofsky et al (1993), describes the methods employing GIS-T that can provide the capability to
perform transportation hazard analysis and incident management. Incident management
considerations include those of emergency response deployment and rerouting to bypass the
affected area. Transportation hazard analysis also addresses dynamic routing and emergency
preparedness in the case of hazardous-materials transport release, and involves comprehensive
risk assessment and evacuation planning. The paper concludes with a discussion of how the GIS-
T approach to incident management may be extended to address dynamic management in an
intelligent-vehicle-highway-system environment. Sadek et al (1999) developed a decision-aid
tool using GIS for multicriteria evaluation of route alignments. Possible alignments are evaluated
based on community disruption and environmental, geotechnical and geometric design criteria.
Results of the case study demonstrates the advantages of the decision-aid tool and highlighted its
potential in providing a quick, multicriteria screening evaluation of possible route alignments.
Thirumalaivasan and Guruswamy (2000) used the route module available in Arc-Info (a GIS
based software) to find optimal routes between two given points for emergency services, such as
ambulance and fire services, based on minimum travel time criteria. Southworth and Peterson
(2000) describe the development and application of a single, integrated digital representation of a
multimodal and transcontinental freight transportation network. The paper focuses on the routing
of the tens of thousands of intermodal freight movements reported in United States Commodity
Flow Survey.
7.6.3 Travel Demand Modeling
Miller and Storm (1996), reports on the development of a prototype geographic information
system design to support network equilibrium-based travel demand models, which is an attempt
Chapter-7: GIS-T Applications NPTEL Web Course (12th Aug. 2011)
Course Title: Geo-informatics in Transportation Engineering Course Co-ordinator: Dr. Ashish Verma, IISc Bangalore
166
to advance the standard practice of sequential approach. The key features of GIS design includes
(a) realistic representation of the multimodal transportation network, (b) increased likelihood of
database integrity after updates, (c) effective user interfaces, and (d) efficient implementation of
network equilibrium solution algorithms. Souleyrette and Anderson (1998) presented tools and
recommended steps for developing urban transportation models using desktop GIS. Taking the
case study of Ames, Iowa, these procedures and tools are shown to facilitate integration of
spatially referenced data for efficient model development. An integrated transit-oriented travel
demand modeling procedure within the framework of GIS has been presented by Choi and Jang
(2000). Focusing on transit network development, this paper presents both the procedure and
algorithm for automatically generating both the link and line data for transit demand modeling
from the conventional street network data using spatial analysis and dynamic segmentation. Rao
(2000) has done a comparative study of various traffic assignment techniques using TransCAD.
7.6.4 Other Studies
Pathan et al (1993), described the results from a study about growth trends of the urban areas in
the Bombay metropolitan region using multi-date remote sensing data and ARC/INFO GIS
package. The spatial growth trends are examined in relation to the population and the population
density has been computed for different periods. Based upon these densities, the extent of land
required for urban development for the year 2001 has been calculated. Soni et al (1996)
described some basics of GIS technology and its applications and suitability for transportation
engineers. Cesar and Darcy (1998) described a new methodology for performing travel time
studies using Global Positioning System (GPS) and geographic information system (GIS)
technologies. The data collection procedure uses GPS receivers to automatically collect time,
local coordinates, and speed at regular sampling periods, for example every one second. The data
reduction procedure filters and aggregates GPS data to compute travel time and speed along
highways. The data reporting procedure uses a GIS-based management information system to
define queries, tabular reports, and color-coded maps to document travel time data along these
highway segments. O‟sullivan et al (2000) investigated the application of existing desktop GIS
to the assessment of accessibility by public transport. Two approaches to the measurement of

Chapter-7: GIS-T Applications NPTEL Web Course (12th Aug. 2011)
Course Title: Geo-informatics in Transportation Engineering Course Co-ordinator: Dr. Ashish Verma, IISc Bangalore
167
accessibility- aggregate accessibility measures and the space-time geography framework- were
described. It has been suggested by authors that isocrones (lines of equal travel time) are a
natural way to combine these approaches in a GIS setting. Thill (2000) placed the concept of
GIS-T in broader perspective of research in GIS and Geographic Information Science. He
emphasised on the requirements specific of the transportation domain of application of this
emerging information technology as well as on core research challenges. Ziliaskopoulos and
Waller (2000) developed an internet-based GIS that brings together spatio-temporal data, models
and users in a single efficient framework to be used for a wide range of transportation
applications- planning, engineering and operation. They also discussed the implementation issues
and necessary models needed to support the system. Xiong (2000) described a three-stage
matching algorithm (node matching, segment matching, and edge matching) that combines
bottom-up and top-down procedures to carry out the network matching computation. Kwan
(2000) describes several GIS-based three-dimensional (3D) geovisualisation methods for dealing
with the spatial and temporal dimensions of human activity-travel patterns at the same time while
avoiding the interpretative complexity of multivariate pattern generalisation or recognision
methods. Bachman et al (2000) presented a GIS-based modeling approach called the Mobile
Emission Assessment System for Urban and Regional Evaluation (MEASURE). MEASURE
provides researchers and planners with a means of assessing motor vehicle emissions reduction
strategy. The authors have discussed the benefits and challenges related to mobile source
emissions modeling in a GIS framework and identifies future GIS mobile emissions modeling
research needs. You and Kim (2000) developed and evaluated a hybrid travel time forecasting
model with GIS technologies for predicting link travel times in congested road networks. Taylor
et al (2000) described a case study application of developing an integrated GIS-GPS for
collecting on-road traffic data from a probe vehicle for traffic congestion studies. Peng and
Huang (2000) presents a web-based transit information system design that uses Internet
Geographic Information Systems (GIS) technologies to integrate Web serving, GIS processing,
network analysis and database management.
Likewise, GIS has been tried for many other applications to transportation like, pedestrian
accessibility, highway management, prediction of urban traffic air pollution, regional planning,
Chapter-7: GIS-T Applications NPTEL Web Course (12th Aug. 2011)
Course Title: Geo-informatics in Transportation Engineering Course Co-ordinator: Dr. Ashish Verma, IISc Bangalore
168
road environmental impact, transportation improvement site selection, land use planning, land
use-transport planning etc. The following sub-sections describe few of the studies in greater
detail.
7.6.5 Design and Development of Interactive Trip Planning for Web-Based Transit
Information Systems
Peng and Huang (2000) developed a Web-based transit information system that allows transit
users to plan a trip itinerary and to query service-related information, such as schedules and
routes using Internet Geographic Information Systems (GIS) technologies. A unique feature of
the system is that it integrates Internet GIS into the system design so that the user interface is
map-based. The user can interact with the transit network and street maps, conducting query,
search, and map rendering. The interactive map-based user interface also allows the system to
incorporate other information, such as shops, theatres, parks, and other local attractions. This is
very important for visitors who may want to explore these sites around their destinations. A path
finding algorithm for transit network is proposed to handle the special characteristics of transit
networks, e.g., time-dependent services, common bus lines on the same street, and non-
symmetric routing with respect to an origin/destination pair. The algorithm takes into account the
overall level of services and service schedule on a route to determine the shortest path and
transfer points. A framework is created to categorize the development of transit information
systems on the basis of content and functionality, from simple static schedule display to more
sophisticated real time transit information systems.
7.6.6 IMPACT: An Integrated GIS-Based Model for Simulating the Consequences of
Demographic Changes and Population Ageing on Transportation
Maoh et al, (2009) developed an application of IMPACT (integrated model for population
ageing consequences on transportation), a GIS-based model capable of assessing the
ramifications of demographic changes, including population ageing, on the performance and
usage of urban transportation systems. Unlike existing operational models, IMPACT possesses
unique and novel features that enable it to model demographic changes and urban travel demand

Chapter-7: GIS-T Applications NPTEL Web Course (12th Aug. 2011)
Course Title: Geo-informatics in Transportation Engineering Course Co-ordinator: Dr. Ashish Verma, IISc Bangalore
169
for various age cohorts. The development of IMPACT follows the modular approach. The result
is a versatile, stand-alone GIS-T model with an extensive set of policy handles that can be used
to simulate scenarios relating to changes in (1) vital statistics (fertility, mortality, and migration
rates), (2) land use characteristics per TAZ, including employment, new residential development,
dwelling rent values, availability of schools, parks, recreational facilities, and the existence of
commercial and industrial land uses, and (3) transportation infrastructure such as the
enhancement of the level of service for existing road infrastructure or building new roads.
Furthermore, the system can be used to simulate scenarios that pertain to changes in the socio-
economic characteristics (e.g. people with driving licenses, car ownership levels, employment
status, and household structure) of the driving population in the city.
7.6.7 A GIS-based approach for the screening assessment of noise and vibration impacts
from transit projects
Hamed and Effat (2007) presented a GIS-based tool for the assessment of airborne-noise and
ground-borne vibration from public transit systems, and its application to an actual project. The
tool was based on the US Federal Transit Administration‟s (FTA) approach, and incorporates
spatial information, satellite imaging, geo-statistical modeling, and software programming. They
presented a methodology of using spatial modeling, Geographic Information System, Visual
Basic modeling, and satellite images to assess the environmental impacts from transit projects. A
case study was presented on the application of the model for assessing the air-borne noise and
ground-borne vibration impact resulting from a LRT project in an urban center in the Middle
East. Specifically, the assessment was used in a multi-criteria analysis to evaluate two alternative
alignments for the rail tracks. The method fully automates the assessment process; allows the
evaluation of a very large number of potential receptor points; and allows the presentation of the
results in a graphical format.
7.6.8 Geographic Information Systems (GIS) Based Model of Dairy Manure
Transportation and Application with Environmental Quality Consideration
Paudel et al, (2009) used the survey information to develop a minimum cost spatial dairy manure
transportation model where environmental quality and crop nutrient requirements were treated as
Chapter-7: GIS-T Applications NPTEL Web Course (12th Aug. 2011)
Course Title: Geo-informatics in Transportation Engineering Course Co-ordinator: Dr. Ashish Verma, IISc Bangalore
170
constraints. The GIS model incorporated land use types, exact locations of dairy farms and
farmlands, road networks, and distances from each dairy farm to receiving farmlands to identify
dairy manure transportation routes that minimized costs relative to environmental and other
constraints. Analyses indicated that the characteristics of dairy manure, its bulk and relatively
low primary N2, P2O5 and K2O nutrient levels limit the distribution areas or distances between
the farms and the land over which the manure can be economically spread. Physical properties of
the land limit the quantities of nutrients that can be applied because of excess nutrient buildup in
soil and potential to harm nearby water bodies and downstream people and places. Longer
distances between dairy and farmland favor the use of commercial fertilizers due to the high cost
of manure transportation. The GIS-based model made it possible to determine a least- cost dairy
manure application distance for Louisiana‟s major dairy production area. An optimal
transportation route identified is a real world path with minimum cumulative impedance between
the dairy farm origin and farm and pasture land destination using the existing road network. The
analysis identified the shortest and cheapest existing road network by calculating and cumulating
the contributions of all cost elements involved in the loading and transportation of manure from
its origin to the point of final destination including the farm application cost.
7.6.9 A GIS-Based Environmental Modeling System for Transportation Planners
Brown and Affum (2002) developed a GIS-based environmental modeling system, termed
TRAEMS, for use by transport planners in assessing the environmental effects of road traffic
plans. The system utilises capabilities of GIS to integrate the output from a transport planning
activity with land use information to model the environmental impacts of different road traffic
scenarios. TRAEMS enables planners to test transport related environmental impacts at the same
time as they are testing the traffic carrying efficiencies of network plans. TRAEMS operates
entirely within the MapInfo environment, as an additional item in the MapInfo main menu, in the
form of pull down menu. It is user-friendly, simple to use and requires no prior knowledge of
MapInfo. All input data and out- put are maintained in MapInfo format, keeping everything
simple and uniform. The various components are designed as individual programs in modular
form, linked together through a common controller. Separate sub-modules have been designed

Chapter-7: GIS-T Applications NPTEL Web Course (12th Aug. 2011)
Course Title: Geo-informatics in Transportation Engineering Course Co-ordinator: Dr. Ashish Verma, IISc Bangalore
171
for each of the environmental factors of interest, namely: traffic noise, air pollution, energy
consumption and storm water pollution. Through the identification of total pollutant load, and the
location of this load in the network, the model has the potential to allow transport and land use
planners to examine environmental consequences, not just transport consequences of proposals.
7.7 Software Available for GIS-T
There are many generic or multipurpose GIS packages, which can be used for GIS-T. Idrisi is a
low cost, raster-oriented package with some vector analysis capabilities suitable for GIS-T
applications, including the ability to calculate minimum cost paths, Eastman (1995). ESRI has
been gradually increasing the functionality of its low-end ArcView software as it has released
newer versions. ArcView Version 3.0 introduced an extension called Network Analyst who has a
variety of automated routing functions, ESRI (1996). Among the high-end commercial packages
are Intergraph‟s Microstation, GeoMedia and ESRI‟s ARC/INFO system, both of which have
full network analysis functionality, Rodcay (1995). The other main generic software available
are (CSDMS, 2000): AutoCAD Map software which is based upon AutoCAD Release 14;
MapInfo which is a comprehensive desktop mapping software with a powerful graphical display
program; ILWIS which uses an object-oriented approach in which maps, such as point, segment,
polygon and raster maps are data objects; TNTmips which is MicroImages flagship product for
geospatial analysis; GRAM++ which has been developed by CSRE IIT Bombay and which
includes modules for import/export of different format data, map editing, raster analysis, vector
analysis, network analysis etc. (Venkatachalam et al, 2001). But, among all these, probably the
best known specialised GIS-T software package is Caliper Corporation‟s TransCAD, a superset
of their GIS Plus system. It includes all the standard GIS-T operations discussed above. Caliper
also produces the in-expensive Maptitude desktop GIS package, which has extensive GIS-T
functionality.
7.7.1 TransCAD
TransCAD is the first and only Geographic Information System (GIS) designed for use by
transportation professionals to store, display, manage, and analyze transportation data.

Chapter-7: GIS-T Applications NPTEL Web Course (12th Aug. 2011)
Course Title: Geo-informatics in Transportation Engineering Course Co-ordinator: Dr. Ashish Verma, IISc Bangalore
172
TransCAD combines GIS and transportation modeling capabilities in a single integrated
platform, providing capabilities that are unmatched. TransCAD can be used for all modes of
transportation, at any scale or level of detail. With TransCAD, you can create high-quality map
output using many of thematic mapping styles and options, unlimited colors, and fully-scalable
line styles and true type map symbols. With a few clicks of the mouse, automatic mapping
technology helps to create color and pattern coded maps, dot-density maps, scaled-symbol maps,
and maps with integrated pie charts and bar charts. TransCAD also provides specialized mapping
functions for transportation applications:
TransCAD is a state-of-the-art GIS that can be used to create and customize maps, build and
maintain geographic data sets, and perform many different types of spatial analysis. TransCAD
includes sophisticated GIS features such as polygon overlay, buffering, and geocoding, and has
an open system architecture that supports data sharing on local and wide-area networks.
TransCAD is the only software package that fully integrates GIS with demand modeling and
logistics Functionality. The various advantages in TransCAD are:-
GIS makes it possible for models to be much more accurate. Network distances and
travel times are based on the actual shape of the road network and a correct
representation of highway interchanges. Also, with networks we can specify complex
road attributes such as truck exclusions, delays at intersections, one-way streets, and
construction zones.
The entire modeling process is more efficient. Data preparation is greatly facilitated and
the database and visualization capabilities catch errors before they cause problems.
The third advantage is the GIS itself. In TransCAD, different modeling equations can
easily be derived and applied for different geographic sub areas. Similarly, TransCAD
brings new and much-needed capabilities for measuring geographic accessibility.
Lastly, the GIS approach provides a graphical solution that is easily understood. Users
can convey highly technical information to the non-practitioner in a very straightforward
and understandable manner.
Chapter-7: GIS-T Applications NPTEL Web Course (12th Aug. 2011)
Course Title: Geo-informatics in Transportation Engineering Course Co-ordinator: Dr. Ashish Verma, IISc Bangalore
173
7.7.2 MapInfo
MapInfo provides location intelligence solutions through combining software, data (both spatial
and non spatial) and consultancy with project management, systems design and development,
training and support. MapInfo produces a wide range of software including Spatial Cartridges for
databases (Spatial Ware), Routing, Geocoding (Mapmaker), Site Analysis, Risk Analysis,
Market Analysis, and the Envies web services suite along with the more traditional Geographic
Information System (GIS) software.
7.8 Future Developments
7.8.1 Use of Expert Systems (ES) and Other Techniques
In the near future GIS-T is likely to benefit from an infusion of techniques related to ES.
Heikkila et al (1990) suggest that ES can be used to determine which infrastructure
improvements are appropriate in the light of changes within the GIS-T. The GIS-T can then be
used to evaluate the effects of the infrastructure change and this information can be entered into
the ES. Taylor (1990) has developed design criteria for knowledge based route guidance advisors
which take into account not only the characteristics of the system but also the characteristics of
the users to whom the advice is targeted. Spring and Hummer (1994), have demonstrated the use
of engineering knowledge regarding accident causation to identify hazardous locations.
Panchanathan and Faghri (1994), discussed the development of a knowledge-based geographic
information system for managing and analyzing safety-related information for rail-highway
grade crossings. Besides this, in future, there will be an increased use of advance techniques like
Genetic Algorithm (GA), Simulated Annealing (SA), Decision Support Systems (DSS) etc. or
some customized software, with GIS-T to get optimal solutions or to solve specific problems
which are at present cannot be solved with present GIS-T tools.
7.8.2 Internet GIS-T
In future, data and maps and software will all be available on the internet for downloading or
simply viewing, Maguire et al (1993). Many organisations are already making extensive use of

Chapter-7: GIS-T Applications NPTEL Web Course (12th Aug. 2011)
Course Title: Geo-informatics in Transportation Engineering Course Co-ordinator: Dr. Ashish Verma, IISc Bangalore
174
the internet and this is particularly true of municipal transportation departments which frequently
make traffic service maps available over the map. Peng and Huang (2000) have done such a
study to develop a web-based transit information system. Bertazzon and Waters (1996) have
built a web site, which incorporates GIS functionality for determining shortest paths and provide
route guidance and weather information on the web in real time.
7.8.3 Intelligent Transportation Systems (ITS) and GIS-T
As we all will agree, Intelligent Transportation Systems (ITS) is the future of transportation and
there is bound to be an increase in the research in this key area, which is mainly the integration
of GIS-T with GPS technologies. Two main components in this area are Intelligent Vehicle
Highway Systems (IVHS), and Automatic Vehicle Location Systems (AVLS).
IVHS is a generic term for a number of GIS-T related applications, Johns (1990), including:
automatic vehicle identification and billing (AVI); weighing in motion; collision warning and
guidance; driver information and route guidance through advanced travel orientation systems
(ATOS); advanced trip planning systems (ATPS); advanced travel conditions systems (ATCS);
advanced traffic signal control and operation; automatic incident detection; and automobile
vehicle spacing among a number of others. Goodwin (1994) notes that ORNL in the USA is
developing an information infrastructure to support data sharing across all IVHS applications and
uses.
AVLS systems are designed to locate vehicles at all times. Klesh (1989) noted that there are as
many categories of AVLS as there are modes of travel. Concentrating on road vehicle
applications AVLS were divided into two distinct categories: dispatch and stand-alone systems.
The latter, often known as AVNS, are in-vehicle systems which are used to determine the
shortest route between the vehicle‟s present location and an intended destination, and have been
discussed in detail by Jeffrey (1987) and White (1991). Klesh notes that the dispatch category
(AVDS or AVMS) supports variety of applications in the private sector (e.g. application for
taxicab companies, delivery and collection, services, and security agencies) and in the public
Chapter-7: GIS-T Applications NPTEL Web Course (12th Aug. 2011)
Course Title: Geo-informatics in Transportation Engineering Course Co-ordinator: Dr. Ashish Verma, IISc Bangalore
175
sector (e.g. police, fire department, ambulance, transit services). AVDS may employ GPS, a
beacon, or some other technology to fix the vehicle‟s position, but in addition this information is
relayed to a central site from which additional resources may be dispatched, if and when
necessary. Holland (1990) provides a detailed review of the use of AVLS technology in many
urban transit systems and notes how it can be integrated with scheduling programs developed for
transit operations. The next chapter will discuss ITS in much greater detail.
7.8.4 Temporal GIS-T
The construction of temporal GIS databases is one of the ongoing challenges for the GIS
community. Such formulations are particularly useful in the transportation sector. A series of
recent papers (Clark et al, 1996; Crawford-Tilley et al, 1996; Masuoka et al, 1996) discuss the
design of a temporal GIS-T for the Baltimore-Washington region.
The Flow Chart in Figure - 7.5 summarizes the application of GIS trends.
.

Chapter-7: GIS-T Applications NPTEL Web Course (12th Aug. 2011)
Course Title: Geo-informatics in Transportation Engineering Course Co-ordinator: Dr. Ashish Verma, IISc Bangalore
176
GIS-T applications
Prevailing trends Future developments
Service area analysis; O’Sullivan et.al(2000).
Pavement management system; Simkowitz(1990).
Transportation hazard analysis and incident management; Lepofsky et.al(1993).
Urban growth trend analysis; Pathan et.al(1993).
Urban transportation systems planning and management; Stopher & Meyburg(1975), Wilson(1974), Nyerges(1995), Pas (1995), Taaffe et.al(1996),
Miller & Storm(1996), Souleyrette & Anderson(1998).
Travel time studies; Rowell(1996), You & Kim(2000), Cesar & Darcy(1998).
Evaluation of route alignments; Sadek et.al(1999).
Evaluation of assignment techniques; Rao(2000).
Planning & management of road network; Grayson (1991)
Network information system; Bydler & Nilsson(1977), Partheeban & Santhakumar(1999).
Routing of transit & other services; Waters et.al(1986), Church & Sorenson(1996), Wirasinghe & Waters(1983).
Shortest path analysis; Church & Sorensen(1996), Ostresh(1973), Lee & Tomlin(1997), Thirumalaivasan & Guruswamy(2000), Zhan(1996), Kirby & Potts(1969), Ziliaskopoulos & Mahmassani(1996), Bovy(1990).
Transportation data sharing; Dueker & Butler(2000), Sutton & Wyman(2000).
Network matching procedures; Xiong(2000).
Freight transportation planning; Southworth & Peterson(2000).
Human activity travel pattern studies; Kwan(2000).
Traffic congestion studies; Taylor et.al(2000).
Pollution emission assessment systems; Bachman et.al(2000).
Transit information systems; Kharola & Gopalkrishna(1999).
Accident analysis; Bydler & Nilsson(1977).
Pedestrian accessibility studies; Aultman et.al(1997).
Regional planning; Nyerges(1995), Singh(1999).
Environmental & noise impact studies; Love(1984).
Transportation improvement site selection.
Land use planning.
Integrated landuse-transport planning; Horowitz(1995).
Location-allocation modelling; Rushton et.al(1973), Densham(1996), Birkin et.al(1996), Oppong(1992).
Review studies; Maguire et.al(1993), Nyerges(1989), Simkowitz(1988), Soni et.al(1996), Thill(2000).
Knowledge based GIS; Spring & Hummer(1994), Panchanathan & Faghri(1994), Heikkila et.al(1990), Taylor(1990).
Web based GIS; Bertazzon & Waters(1996), Peng & Huang(2000), Ziliaskopoulos & Waller(2000).
Intelligent Transportation Systems (ITS); Johns(1990), Klesh(1989),
Goodwin(1994), Jeffrey(1987), White(1991), Holland(1990).
Mass transit planning; Choi & Jang(2000).
Temporal GIS; Clark et.al(1996), Crawford-Tilley et.al(1996), Masuoka
et.al(1996).
Knowledge based GIS
Web based
GIS
GIS coupled
with
customized
software or
advanced
optimization
technique.
Integration of GIS and GPS
for Intelligent
Transportation
Systems (ITS).
Integrated
urban
transport /
land use
transport
planning
Facility
location planning.
Real time
traveler
information
systems.
Cargo fleet
management
& routing.
Temporal GIS
Figure – 7.5:
GIS-T Review
Chapter-7: GIS-T Applications NPTEL Web Course (12th Aug. 2011)
Course Title: Geo-informatics in Transportation Engineering Course Co-ordinator: Dr. Ashish Verma, IISc Bangalore
177
References:
1. Akiva, B.M., Lerman, S. (1985), “Discrete Choice Analysis: Theory and Application to
Travel Demand”, Cambridge (USA), MIT Press.
2. Arthur, R.M., Waters, N.M., (1995), “GIS to maximise photo-radar deployment
effectiveness”, Proceedings GIS/LIS 96, Vol.1, Falls Church, ACSM/ASPRS: 20-8.
3. Armstrong J. M. and Khan A. M. (2004). “Modelling urban transportation emissions: role of
GIS”. Computer, Environ. and Urban Systems 28 (2004) 421–433.
4. Aultman-Hall, L., Roorda, M., Baetz, B.W. (1997), “Using GIS for evaluation of
neighborhood pedestrian accessibility”, Journal of Transp. Engg., ASCE, Vol.123, No.1, pp.
10-21.
5. Bachman, W., Sarasua, W., Hallmark, S., Guensler, R. (2000), “Modeling regional mobile
source emissions in a geographic information framework”, Transportation Research C 8:
205-229.
6. Bertazzon, S., Waters, N.M. (1996), “The use of GIS applications on the internet for
marketing tourist destinations”, Proceedings GIS/LIS 96 Falls Church, ACSM/ASPRS: 870-
81.
7. Birkin, M., Clarke, G., Clarke, M., Wilson, A. (1996), “Intelligent GIS: Location Decisions
and Strategic Planning”, Cambridge (UK), GoeInformation International.
8. Bovy, P.H.L., Stern, E. (1990), “Route choice: wayfinding in transport networks”, Dordrecht,
Kluwer.
9. Brown A. L., and Aff um J. K. (2002). “A GIS-based environmental modelling system for
transportation planners”. Computer, Environ. and Urban Systems 26 (2002) 577–590.
10. Bydler, R., Nilsson, A. (1977), “The Swedish road data bank and its use in road planning”,
Cartographica, Monograph 20: 68-84.
11. Caliper Corporation, (1996b), “Travel Demand Modelling With TransCAD 3.0”, Newton,
Caliper Corporation.
12. Cesar, A.Q., Darcy, B. (1998), “Travel time studies with global positioning and geographic
information systems: an integrated methodology”, Transportation Research Part C 6: 101-27.
Chapter-7: GIS-T Applications NPTEL Web Course (12th Aug. 2011)
Course Title: Geo-informatics in Transportation Engineering Course Co-ordinator: Dr. Ashish Verma, IISc Bangalore
178
13. Choi, K., Jang, W. (2000), “Development of a transit network from a street map database
with spatial analysis and dynamic segmentation”, Transportation Research C 8: 129-146.
14. Church, R.L., Sorensen, P. (1996), “Integrating normative location models into GIS:
problems and prospects with the p-median model”. In Longley, P., Batty, M. (eds), “Spatial
Analysis: Modelling in a GIS Environment”, Cambridge (UK), GeoInformation
International: 167-83.
15. Clark, S.C., Starr, J., Acevedo, W., Solomon, C. (1996), “Development of the temporal
transportation database for the analysis of urban development in the Baltimore Washington
region”, Proceedings Annual ASPRS/ACSM Conference. Falls Church, ACSM/ASPRS 3:
77-88.
16. Crawford-Tilley, J., Acevedo, W., Foresman, T., Prince, W. (1996), “Developing a temporal
database of urban development for the Baltimore-Washington region”, Proceedings Annual
ASPRS/ACSM Conference. Falls Church, ACSM/ASPRS 3: 101-10.
17. CSDMS (2000). “GIS@development”, Vol. IV Issue 11, 20-21.
18. Densham, P.J. (1996), “Visual interactive locational analysis”. In Longley, P., Batty,
M.(eds.). “Spatial Analysis: Modelling in a GIS Environment”, Cambridge (UK),
GeoInformation International: 185-205.
19. Dueker, K.J., Butler, J.A. (2000), “A geographic information system framework for
transportation data sharing”, Transportation Research Part C 8: 13-36.
20. Eastman, J.R. (1995), “Idrisi for Windows: User‟s Guide”, Version 1.0, Worcester (USA),
Clark Labs, The Idrisi Project.
21. ESRI. (1996), “ArcView GIS Extensions (ArcView Network Analyst; ArcView Spatial
Analyst)”, White Paper Series, Redlands, ESRI.
22. Goodwin, C.W.H. (1994), “Towards a common language for IVHS databases”, Proceedings
GIS/LIS 94 Falls Church, ACSM/ASPRS: 351-60.
23. Goodwin, C.W.H., Gordon, S.R., Siegel, D. (1995), “Reinterpreting the location referencing
problem: a protocol approach, Proceedings GIS-T 95”, Geographic Information Systems for
Transportation Symposium. Washington DC, AASHTO: 76-88.
Chapter-7: GIS-T Applications NPTEL Web Course (12th Aug. 2011)
Course Title: Geo-informatics in Transportation Engineering Course Co-ordinator: Dr. Ashish Verma, IISc Bangalore
179
24. Grayson, T.H. (1991), “Expanding GIS functionality using DBMS tools: a network analysis
prototype based on SQL”, Proceedings URISA Annual Conference, San Francisco, Vol.1,
145-55.
25. Hameda M. and Effat W. (2006). “A GIS-based approach for the screening assessment of
noise and vibration impacts from transit projects”. Journal of Environmental Management 84
(2007) 305–313.
26. Healey, R.G., (1991), “Database management systems”. In Maguire, D.J., Goodchild, M.F.,
Rhind, D.W. (eds). “Geographical Information systems: Principles and Applications”,
Harlow, Longman/New York, John Wiley & Sons Inc. Vol.1: 251-67.
27. Heikkila, E.J., Moore, J.E., Kim, T.J. (1990), “Future directions for EGIS: applications to
land use and transportation planning”. In Kim, T.J., Wiggins, L.L., Wright, J.R. (eds).
“Expert Systems: Applications to Urban Planning”. New York, Springer: 225-40.
28. Holland, A. (1990), “The impact of AVM on transit operations”, Unpublished MSc. Thesis,
Department of Geography, University of Calgary.
29. Horowitz, J.L. (1995), “Modeling choices of residential location and mode of travel to
work”. In Hanson, S. (ed.). “The Geography of Urban Transportation”, 2nd edition. New
York, Guilford Press: 219-39.
30. Jeffrey, D. (1987), “Route guidance and in-vehicle information systems”. In Bonsall, P., Bell,
M.(eds.). “Information Technology Applications in Transportation”, Utrecht, VNU Science
Press: 319-51.
31. Johns, R.C. (1990), “Transportation information systems using machine vision technology”,
Proceedings URISA Annual Conference, Washington DC, URISA 1: 199-208.
32. Keen, P.G.W., Morton, M.S.S. (1978), “Decision Support Systems: An Organisational
Perspective”, Reading (USA), Addison-Wesley.
33. Kharola, P.S., Gopalkrishna, B., (1999), “Geographic Information System and Fleet
Management in an Urban Transport Corporation”, Indian Journal of Transport Management,
Vol.23, No.6, pp.353-360.
34. Kirby, R.F., Potts, R.B. (1969), “The minimum route problem for networks with turn
penalties and prohibitions”, Transportation Research B: 397-408.

Chapter-7: GIS-T Applications NPTEL Web Course (12th Aug. 2011)
Course Title: Geo-informatics in Transportation Engineering Course Co-ordinator: Dr. Ashish Verma, IISc Bangalore
180
35. Klesh, L. (1989), “Design and implementation of automatic dispatch vehicle information and
location systems”, Unpublished MSc Thesis, Department of Geomatics Engineering,
University of Calgary.
36. Kwan, M-P. (2000), “Interactive geovisualization of activity-travel patterns using three-
dimensional geographical information systems: a methodological exploration with a large
data set”, Transportation Research C 8: 185-203.
37. Lee, B.D., Tomlin, C.D. (1997), “Automate transportation corridor allocation”, GIS World
10(1): 56-60.
38. Lepofsky, M., Abkowitz, M., Cheng, P. (1993), “Transportation hazard analysis in integrated
GIS environment”, Journal of Transp. Engg., ASCE, Vol.119, No.2, pp239-254.
39. Louviere, J. (1988), “Conjoint analysis of stated preferences”, Journal of Transport
Economics and Policy 22: 93-119.
40. Love, B. (1984), “The effect of road traffic noise on housing prices in Calgary 1978-1982”,
Unpublished MSc Thesis, Department of Geography, University of Calgary.
41. Maguire, D.J., Smith, R., Jones, S. (1993), “GIS on the move: some transportation
applications of GIS”, Proceedings Thirteenth Annual ESRI User Conference, Vol.3, 39-46.
42. Maoh H. (2009). “IMPACT: An integrated GIS-based model for simulating the
consequences of demographic changes and population ageing on transportation”. Computers,
Environment and Urban Systems 33 (2009) 200–210.
43. Masuoka, P., Acevedo, W., Fifer, S., Foresman, T., Tuttle, M. (1996), “Techniques for
visualising urban growth using a temporal GIS database”. Proceedings Annual
ASPRS/ACSM Conference. Falls Church, ACSM/ASPRS 3: 89-100.
44. Miller, H.J., Storm, J.D. (1996), “Geographic information system design for network
equilibrium-based travel demand models”, Transpn. Res.-C, Vol.4, No.6, pp. 373-389.
45. Nyerges, T.L., (1989), “GIS support for micro-macro spatial modeling”, Proceedings of
AutoCarto 9, Falls Church, ACSM/ASPRS: 567-79.
46. Nyerges, T.L., (1995), “Geographical Information System support for urban/regional
transportation analysis”. In Hanson, S.(ed.). “The Geography of Urban Transportation”, 2nd
edition. New York, Guilford Press: 240-65.

Chapter-7: GIS-T Applications NPTEL Web Course (12th Aug. 2011)
Course Title: Geo-informatics in Transportation Engineering Course Co-ordinator: Dr. Ashish Verma, IISc Bangalore
181
47. Oppong, J.R. (1992), “Location-allocation models for primary health care in Suhum District
Ghana”, Unpublished Ph.D. Thesis, Department of Geography, University of Alberta,
Edmonton.
48. Ostresh, L.M. (1973), “A shortest path algorithm”. In Rushton, G., Goodchild, M.F., Ostresh,
L. (eds). “Computer Programs for Location-Allocation Problems”, Monograph No.6. Iowa,
Department of Geography, University of Iowa.
49. O‟sullivan, D., Morrison, A., Shearer, J. (2000), “Using Desktop GIS for the Investigation of
Accessibility by Public Transport: an Isocrone Approach”, Int. J. Geographical Information
Science, Vol.14, No.1, pp.85-104.
50. Panchanathan, S., Faghri, A. (1994), “Knowledge-based geographic information system for
safety analysis at rail-highway grade crossings”, Transportation Research Record 1497: 91-
100.
51. Partheeban, P., Santhakumar, S.M. (1999), “Geographic Information System for Major
Roads: A Case Study of Tiruchirapalli”, Indian Highways, IRC, Vol.27, No.12, pp.31-38.
52. Pas, E.I. (1995), “The urban transportation planning process”. In Hanson, S. (ed.). “The
Geography of Urban Transportation”, 2nd edition. New York, Guildford Press: 53-77.
53. Pathan, S.K., Sastry, S.V.C., Dhinwa, P.S., Rao, M., Majumdar, K.L., Kumar, D.S., Patkar,
V.N., Phatak, V.N. (1993), “Urban growth trend analysis using GIS techniques- a case study
of the Bombay metropolitan region”, Int. J. Remote Sensing, Vol.14, No.17: 3169-3179.
54. Paudel K. P., (2009). “Geographic information systems (GIS) based model of dairy manure
transportation and application with environmental quality consideration”. (Elsevier) Waste
Management 29 (2009) 1634–1643.
55. Peng, Z-R., Huang, R. (2000), “Design and development of interactive trip planning for web-
based transit information systems”, Transportation Research C 8: 409-425.
56. Rao, V.S. (2000), “A comparative study of traffic assignment techniques using TransCAD”,
Unpublished M-Tech Thesis, IIT Bombay, Mumbai, India.
57. Rodcay, G.K. (ed.) (1995), “GIS World Sourcebook 1996”, Fort Collins, GIS World Inc.
58. Rowell, R.C., (1996), “Theory and practice: linear referencing at the Idaho Transportation
Department”, Proceedings GIS-T 96, Geographic Information Systems for Transportation
Symposium. Washington DC, 1-9.

Chapter-7: GIS-T Applications NPTEL Web Course (12th Aug. 2011)
Course Title: Geo-informatics in Transportation Engineering Course Co-ordinator: Dr. Ashish Verma, IISc Bangalore
182
59. Rushton, G., Goodchild, M.F., Ostresh, L. (eds), (1973), “Computer Programs for Location-
Allocation Problems”, Monograph No.6. Iowa, Department of Geography, University of
Iowa.
60. Sadek, S., Bedran, M., Kaysi, I. (1999), “GIS platform for multicriteria evaluation of route
alignments”, Journal of Transportation Engg, ASCE, 125(2), 144-151.
61. Scarponcini, P. (1995), “A method for determining a standard linear reference scheme”,
Proceedings GIS-T 95, Geographic Information Systems for Transportation Symposium,
Washington DC, AASHTO: 1-22.
62. Simkowitz, H.J. (1988), “Transportation applications of geographic information systems”,
Computers, Environment and Urban Systems 12: 253-71.
63. Simkowitz, H.J. (1990), “Using geographic information system technology to enhance the
pavement management process”, Transportation Research Record 1261, pp.10-19.
64. Singh, A.K. (1999), “Planning and management of regional road network in GIS
environment”, Unpublished Ph.D. Thesis, IIT Bombay, Mumbai, India.
65. Soni, S.K., Durai, B.K., Kumar, P., Murty, A.V.S.R. (1996), “Geographical Information
System: A Technology for Transportation Engineers”, Indian Highways, IRC, Vol.4, No.2,
pp.53-58.
66. Souleyrette, R.R., Anderson, M.D. (1998), “Developing Small Area Network Planning
Models Using Desktop GIS”, Journal of Urban Planning and Development, ASCE, Vol.124,
No.2, pp.55-71.
67. Southworth, F., Peterson, B.E. (2000), “Intermodal and international freight network
modeling”, Transportation Research C 8: 147-166.
68. Spring, G.S., Hummer, J. (1994), “Identification of hazardous highway locations using
knowledge-based GIS: a case study”, Transportation Research Record 1497: 83-90.
69. Stopher, P.R., Meyburg, A.H. (1975), “Urban Transportation Modelling and Planning”,
Lexington, D C Heath and Co.
70. Sutton, J.C., Wyman M.M. (2000), “Dynamic location: an iconic model to synchronize
temporal and spatial transportation data”, Transportation Research Part C 8: 37-52.
71. Taaffe, E.J., Gauthier, H.L., O‟Kelly, M.E., (1996), “Geography of Transportation”, 2nd
edition. Upper Saddle River, Prentice –Hall.

Chapter-7: GIS-T Applications NPTEL Web Course (12th Aug. 2011)
Course Title: Geo-informatics in Transportation Engineering Course Co-ordinator: Dr. Ashish Verma, IISc Bangalore
183
72. Taylor, M.A.P. (1990), “Knowledge-based systems for transport network analysis: a fifth
generation perspective on transport network problems”, Transportation Research A 24: 3-14.
73. Taylor, M.A.P., Woolley, J.E., Zito, R. (2000), “Integration of the global positioning system
and geographical information systems for traffic congestion studies”, Transportation
Research C 8: 257-285.
74. Thill, J-C. (2000), “Geographic information systems for transportation in perspective”,
Transportation Research Part C 8: 3-12.
75. Thirumalaivasan, D., Guruswamy, V. (2000), “Optimal route analysis using GIS”,
http://www.gisdevelopment.net/application/transportation/d_thirum.htm.
76. Venkatachalam, P., Mohan, K., Suri, J.K., Chandrasekar, A.T., Mishra, V. (2001), “Teaching
GIS principles through multimedia based GIS tutor”, GIS@development , Vol. V Issue 1:
24-27.
77. Vonderohe, A.P., Travis, L., Smith, R.L., Tsai, V. (1993), “Adaptation of geographic
information systems for transportation”, National Cooperative Highway Research Program
Report 359, Transportation Research Board, Washington, DC.
78. Waters, N.M., (1995), “GIS, database technology and beautiful formulae”. In Rodcay, G.K.
(ed.). “GIS World Sourcebook 1996”, Fort Collins, GIS World Inc.
79. Waters, N.M., Wirasinghe, S.C., Baboloa, A., Marion, K.E.D. (1986), “Location of bus
garages”, Journal of Advanced Transportation 20: 35-150.
80. White, M. (1991), “Car navigation systems”. In Maguire, D.J., Goodchild, M.F., Rhind,
D.W. (eds). “Geographical Information systems: Principles and Applications”, Harlow,
Longman/New York, John Wiley & Sons Inc. Vol.2: 115-25.
81. Wilson, A.G. (1974), “Urban and Regional Models in Geography and Planning”, New York,
John Wiley & Sons Inc.
82. Wirasinghe, S.C., Waters, N.M. (1983), “An approximate procedure for determining the
number, capacities and locations of solid waste transfer stations in an urban region”,
European Journal of Operations Research 12: 105-11.
83. Xiong, D. (2000), “A three-stage computational approach to network matching”,
Transportation Research C 8: 71-89.

Chapter-7: GIS-T Applications NPTEL Web Course (12th Aug. 2011)
Course Title: Geo-informatics in Transportation Engineering Course Co-ordinator: Dr. Ashish Verma, IISc Bangalore
184
84. You, J., Kim, T.J. (2000), “Development and evaluation of a hybrid travel time forecasting
model”, Transportation Research C 8: 231-256.
85. Zhan, F.B. (1996), “A set of shortest path algorithms that run fastest on real road networks”,
Proceedings GIS/LIS 96, Falls Church, ACSM/ASPRS: 755-64.
86. Ziliaskopoulos, A.K., Mahmassani, H.S. (1996), “A note on least time path computation
considering delays and prohibitions for intersection movements”, Transportation Research B
30: 359-67.
87. Ziliaskopoulos, A.K., Waller, S.T. (2000), “An internet-based geographic information system
that integrates data, models and users for transportation application”, Transportation
Research C 8: 427-444.
Exercises
1. Explain the structure of GIS in Transportation.
2. What are the essential capabilities of GIS in transportation?
3. Explain how Shortest Path (SP) analysis is performed in GIS.
4. Write a brief note on matrix operations in GIS.
5. Categorize the applications of GIS in different fields of transportation.
Assignment
1. Perform the conventional Travel demand modeling procedure (preferably using tutorials or
example given in software) using TransCAD or any other GIS software.