Chapter 7 Drivers of Growth: Technology, Policy, and ...
23
Chapter 7 Drivers of Growth: Technology, Policy, and Institutions
Transcript of Chapter 7 Drivers of Growth: Technology, Policy, and ...

Chapter 7
Drivers of Growth:
Technology, Policy, and Institutions

Copyright ©2015 Pearson Education, Inc. All rights reserved. 7-2
Preview
• To understand how technology differs from the conventional production inputs of capital and labor
• To examine policies to promote productivity growth
• To examine how basic institutions drive economic growth
• To develop a theory of economic growth that analyzes productivity changes endogenously

Copyright ©2015 Pearson Education, Inc. All rights reserved. 7-3
Endogenous Growth Theory
• Endogenous growth theory explains why advances in technology endogenouslyfuel sustained economic growth
• The models are often referred to as Romer models after Paul Romer

Copyright ©2015 Pearson Education, Inc. All rights reserved. 7-4
Allocation of Labor
• The Romer model differs from the Solow model in its assumption about labor, which is the same as the population :N
where Labor that produces goods/services
Labor that produces R&D
p A
p
A
N L L
L
L
= +
=
=

Copyright ©2015 Pearson Education, Inc. All rights reserved. 7-5
Allocation of Labor (cont’d)
• Assume that the fraction of the population devoted to R&D is , the amounts of labor devoted to producing R&D and goods and services are, respectively:
(1 )A
P
L N
L N
= a
= - a
a

Copyright ©2015 Pearson Education, Inc. All rights reserved. 7-6
Production Function
• The production function is the largely the same as that of the Solow model, except that A now can change over time:
• Because labor in the above equation is only the subset of labor devoted to producing goods and services:
0.3 0.7t t t tY A K L=
0.3 0.7t t t PtY A K L=

Copyright ©2015 Pearson Education, Inc. All rights reserved. 7-7
Production Function (cont’d)
• Similarly, output per worker is expressed in terms of only workers devoted to producing goods and services:
0.3 where
Pt t Pt
tPt
p
tPt
p
y A k
YyL
KkL
=
=
=

Copyright ©2015 Pearson Education, Inc. All rights reserved. 7-8
Production of Technology
• Assume the increase in technology is proportional LA, so that the production function for technology is:
where indicates how productive labor is in producing ideas.
• Because technology is nonrivalrous, At is used in producing more technology At
1t t t t AA A A A L+ - = D = c
c
D

Copyright ©2015 Pearson Education, Inc. All rights reserved. 7-9
Production of Technology (cont’d)
• Incorporating nonrivalry into our economic model allows us to explain sustained growth in per-capita income. Without it, as in the Solow model, diminishing returns to capital eventually lead output per capita to rest at a steady state without growth.
• The production function in terms of the growth rate of technology gA:
tA
t
A g NAD
= = ca
Copyright ©2015 Pearson Education, Inc. All rights reserved. 7-10
Sustained Growth in the Romer Model
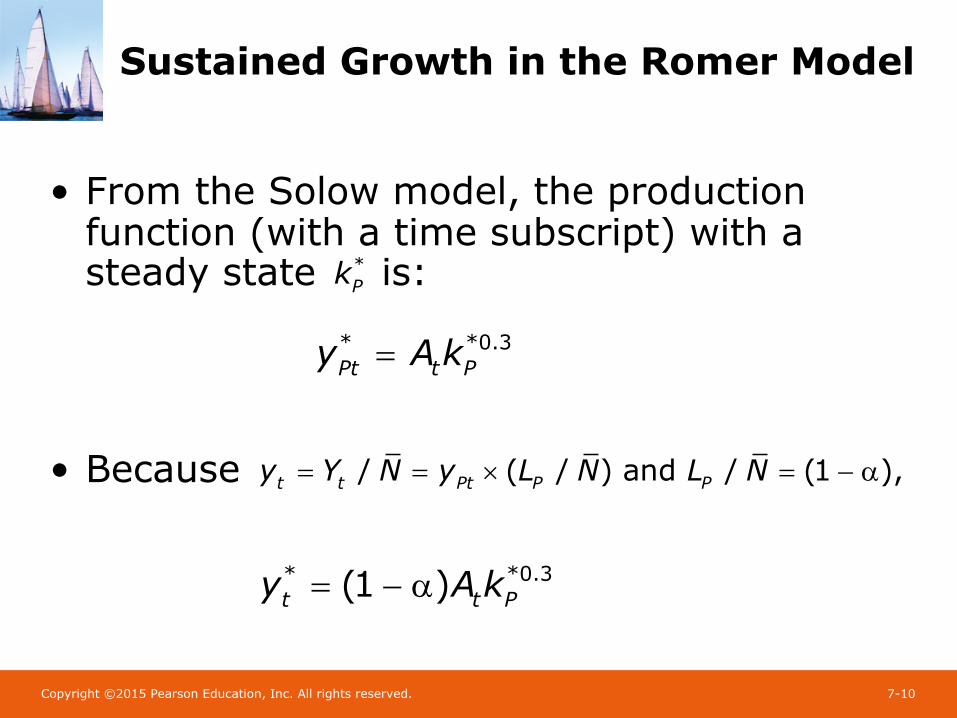
• From the Solow model, the production function (with a time subscript) with a steady state is:
• Because
* *0.3Pt t Py A k=
*Pk
/ ( / ) and / (1 ),t t Pt P Py Y N y L N L N= = ´ = - a
* *0.3(1 )t t Py A k= - a

Copyright ©2015 Pearson Education, Inc. All rights reserved. 7-11
Sustained Growth in the Romer Model (cont’d)
• In this Romer model, output per person grows at a constant rate, which is called a balanced growth path
• This steady rate of growth contrasts with the Solow model, where output per person reaches a steady state
• In Figure 7.1, the vertical axis is a ratio scale (or logarithmic scale), in which equal distances reflect the same percentage change: The balanced growth path in the Romer model is a straight line so that its slope represents the rate of growth at 1.43 over time

Copyright ©2015 Pearson Education, Inc. All rights reserved. 7-12
FIGURE 7.1 Balanced Growth Path in the Romer Model

Copyright ©2015 Pearson Education, Inc. All rights reserved. 7-13
Factors That Affect Endogenous Growth
• Three factors in the Romer model can change the economy’s growth rate: 1. The fraction of the population that is engaged
in R&D 2. The productiveness of R&D 3. The total population in the economy

Copyright ©2015 Pearson Education, Inc. All rights reserved. 7-14
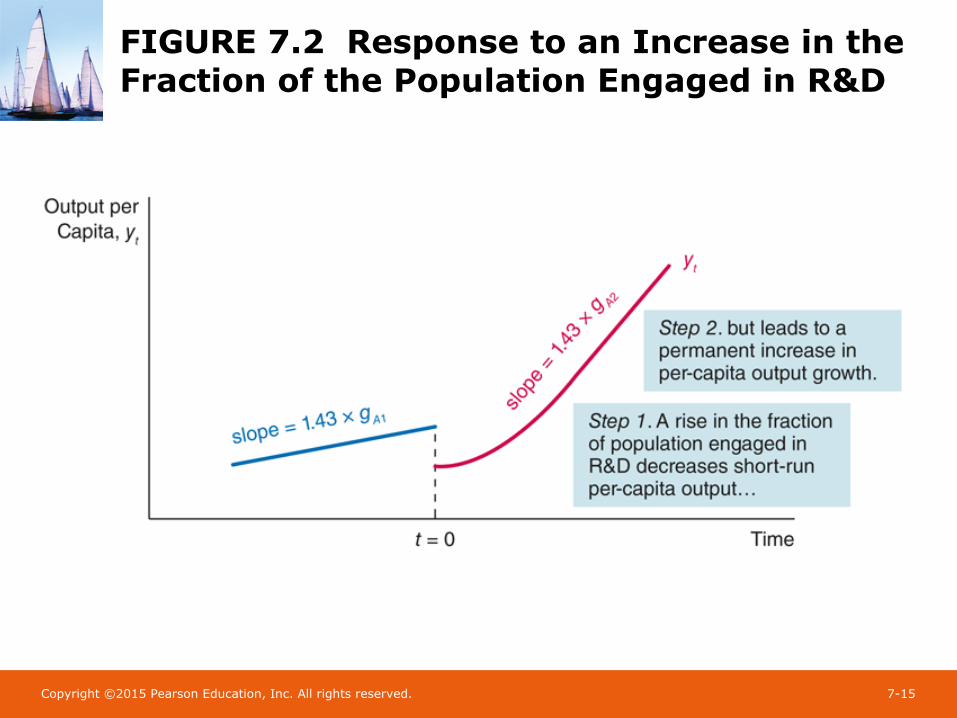
Effects of an Increase in the Fraction of the Population Engaged in R&D
• When more resources are devoted to research and development, the level of per capita output at first falls, but the growth rate of per capita output will rise permanently:– As more labor is devoted to R&D production,
less labor goes to producing goods and services, thus LP drops immediately
– The decline in LP pushes up the capital-labor ratio kPt, which in turn will approach the steady state over time, so that the economy will be on a new, higher balance growth path
Copyright ©2015 Pearson Education, Inc. All rights reserved. 7-15
FIGURE 7.2 Response to an Increase in the Fraction of the Population Engaged in R&D

Copyright ©2015 Pearson Education, Inc. All rights reserved. 7-16
Effects of Changes in the Productiveness of R&D
• When R&D becomes more productive, output per capita grows at a more rapid rate:– An increase in the productivity of R&D, x, rises
the growth rate of A, gA– The slope of yt is higher (steeper)

Copyright ©2015 Pearson Education, Inc. All rights reserved. 7-17
FIGURE 7.3 Response to a Rise in the Productiveness of R&D
Copyright ©2015 Pearson Education, Inc. All rights reserved. 7-18
Response to an Increase in the Total Population,
• A rise in population at first leads to a decline in per-capita output, but the growth rate of per-capita output will rise permanently:– The capital-labor ratio kPt falls immediately, so
that yt falls at first– As , it will grow for a time above the
long-run growth rate– An increase in population leads to a decline in
living standards in the short run, but it improves living standards in the long run
N
*Pt Pk k<

Copyright ©2015 Pearson Education, Inc. All rights reserved. 7-19
FIGURE 7.4 Response to an Increase in the Total Population

Copyright ©2015 Pearson Education, Inc. All rights reserved. 7-20
Application: Does Population Growth Improve Living Standards?
• Does population growth leads to lower living standards (the Solow model prediction) or higher living standards (the Romer model prediction)?
• The nonrivalry of ideas leads to technological spillover, which might explain why countries with high population growth don’t have high per-capita income
• But for the world as a whole, historical evidence suggests that higher populations are positively associated with higher living standards

Copyright ©2015 Pearson Education, Inc. All rights reserved. 7-21
FIGURE 7.5 World Population and Per-Capita GDP over the Very Long Run
Source: Maddison, Angus. Historical statistics, population and per capita GDP levels, 1-2006. www.ggdc.net/maddison/

Copyright ©2015 Pearson Education, Inc. All rights reserved. 7-22
The Romer Model and Saving
• A higher saving rate results in a higher level of output per capita, but not a higher sustained growth rate:– Greater saving raises investment in capital, and
so kPt– As kPt reaches a higher steady-state value, the
economy returns to a balanced growth path where Yt is growing at the same rate as before

Copyright ©2015 Pearson Education, Inc. All rights reserved. 7-23
FIGURE 7.6 Response to a Rise in the Saving Rate