Chapter 7
64
1 Chapter 7 Inventories and Cost of Goods Sold Financial Accounting, Alternate 4e by Porter and Norton
-
Upload
valentine-glover -
Category
Documents
-
view
11 -
download
0
description
Chapter 7. Inventories and Cost of Goods Sold. Financial Accounting, Alternate 4e by Porter and Norton. Inventory of Wholesalers and Retailers. Purchased in finished form Resold without transformation. Classified as “Merchandise Inventory” on balance sheet. - PowerPoint PPT Presentation
Transcript of Chapter 7

1
Chapter 7 Inventories and
Cost of Goods Sold
Financial Accounting, Alternate 4e by Porter and Norton

2
Inventory of Wholesalers and Retailers
Purchased in finished form Resold without transformation Classified as “Merchandise Inventory”
on balance sheet

3
CURRENT ASSETS:
Cash and cash equivalents $ 884,670 $1,248,246
Net accounts and notes receivable 775,339 553,273
Merchandise inventory 1,409,736 1,234,243
Prepaid expenses and other current assets 33,165 39,246
Assets of discontinued operations --- 577,703
TOTAL CURRENT ASSETS 3,102,910 3,652,711
Property, plant and equipment, net 853,778 988,947
Deferred income taxes 22,362 2,647
Other assets 24,252 11,354
Assets of discontinued operations --- 142,519
TOTAL ASSETS $3,799,117 $4,542,033
CIRCUIT CITYConsolidated Balance Sheets [Partial]
2003 2002ASSETS (in thousands)
More than 1/3 of
currentassets
4
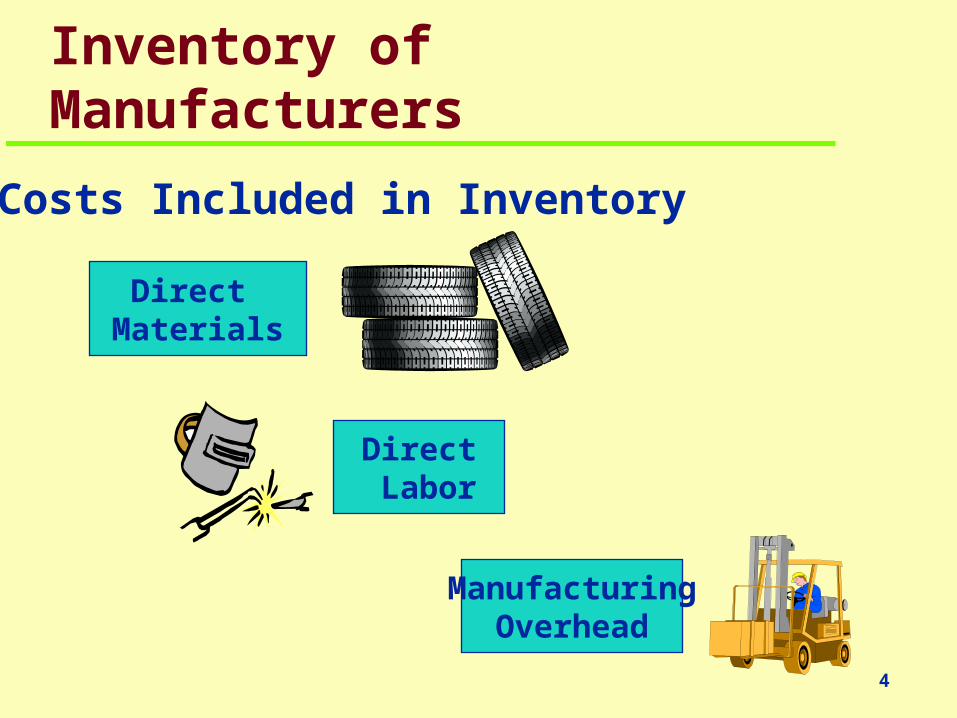
Inventory of Manufacturers
ManufacturingOverhead
Direct Materials
Direct Labor
Costs Included in Inventory

5
Inventory of Manufacturers
ManufacturingOverhead
Direct Materials
Direct Labor Manufacture
Products
Work in Process
FinishedGoods
Raw Materials
Costs Includedin Inventory
Balance SheetClassifications

6
Current assets:Cash and cash equivalents $ 575.5 $ 304.0Accounts receivable less allowance for
doubtful accounts of $77.4 and $72.1 1,807.1 1,621.4Inventories:
Finished goods 1,348.2 1,399.9Work in progress 13.0 15.1Raw materials 12.6 9.1
1,373.8 1,424.1Deferred income taxes 140.8 113.3Prepaid expenses 260.5 162.5
Total current assets 4,157.7 3,625.3
Property, plant and equipment, net 1,614.5 1,618.8Identifiable intangible assets and goodwill 437.8 397.3Deferred income taxes and other assets 233.0 178.2TOTAL ASSETS $ 6,443.0 $ 5,819.6
NIKE, INC.Consolidated Balance Sheets [Partial]
May 31,2002 2001ASSETS (in millions)

7
Income Statement of a Merchandiser
Cash sales $ 350,000Credit sales 124,000
Total 474,000Less: Sales returns &
allowances ( 12,400) Sales discounts ( 34,600)
Net sales $ 427,000
Contra-accounts used for control and analysis purposes

8
Credit Terms and Sales Discounts
n/30 Payment due 30 days from invoice date
1/10, n/30 Deduct 1% of invoice amount if paid within 10 days; otherwise
full invoice amount is due in 30 days
2/10, n/30 Deduct 2% of invoice amount if paid within 10 days; otherwise full
invoice amount is due in 30 days
9
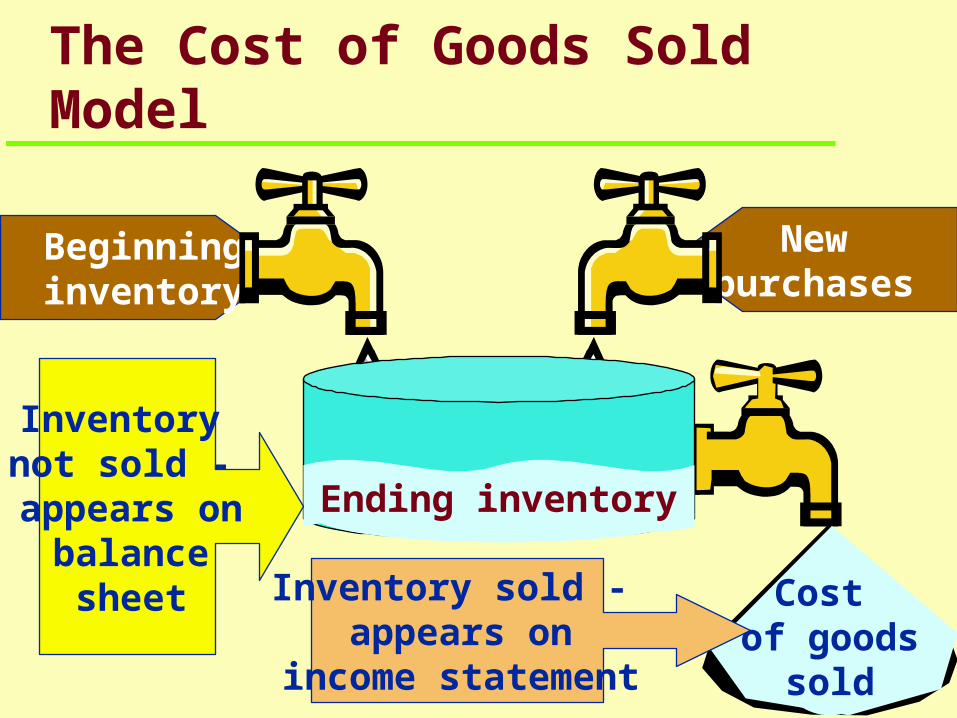
Newpurchases
Beginninginventory
The Cost of Goods Sold Model
Cost of goods
sold
Inventory not sold - appears on
balancesheet Inventory sold -
appears onincome statement
Ending inventory

10
An increase in ending inventory means more was bought than sold
The Cost of Goods Sold Model
Beginning inventory $ 15,000
Plus: Cost of goods purchased 63,000
= Cost of goods available for sale 78,000
Less: Ending inventory ( 18,000)
= Cost of goods sold $ 60,000
“Pool” of goodsavailable to sell
during the period

11
Perpetual Inventory Systems
Point of sale terminals have improved ability of mass merchandisers to maintain perpetual systems
Inventory records are updated after each purchase or sale

12
Periodic Inventory Systems
Reduces record-keeping but also decreases ability to track theft, breakage, etc. and prepare interim financial statements
Inventory records are updated periodically
based on physical inventory counts

13
Cost of Goods Purchased
Includes invoice price:
Less:
Purchase returns and allowances
Purchase discounts
Plus:
Transportation-in

14
Recording Purchase Discounts
Assets = Liab. + O/E + Rev. – Exp.
Cash (495) Accts Pay. 500 Purch. Discounts 5
($ 500 x 1% = $5 discount)
To record payment within discount period to supplier who offers 1% purchase discount.

15
FOB Destination Point
No sale or purchase until inventory reaches its destination Seller responsible for inventory while in transit
Seller Buyer
TitlePasses at
Destination

16
FOB Shipping Point
Both sale and purchase recorded upon shipment Buyer responsible for inventory while in transit
Seller Buyer
TitlePasses when
Shipped

17
Inventory Valuation and Income Measurement
Value Assigned toInventory
on BalanceSheet
ValueExpensedas Cost of Goods Soldon IncomeStatement
When Sold =

18
Beginning inventory $ 500
+ Purchases 1,200
= Cost of goods available for sale 1,700
Calculating Cost of Goods Sold
Internal calculation
- Ending inventory (600)
= Cost of goods sold $ 1,100

19
Inventory costs include
Any freight costs incurred by buyer Cost of insurance for inventory in transit Cost of storing inventory before selling Excise and sales taxes

20
Inventory Costing MethodsFour costing methods available:
SpecificIdentification
WeightedAverage
First-in, First-out(FIFO)
Last-in, First-out(LIFO)

Beginning inventory, Jan. 1: 500 units (unit cost $10)
Inventory purchases:Date Units Unit Cost1/20 300 $ 114/8 400 129/5 200 1312/12 100 14Total purchases 1,000
Ending inventory, Dec. 31: 600 units
Detailed Costing Method Example
Calculate the cost of goods sold and ending inventory under each method using the data below:
21

22
Specific Identification Method
Step 1: Identify the specific units in inventory at the end of the year and their costs.

23
Specific Identification Method
Units in ending inventory:
Date purchased Units Cost Total cost
1/20 100 $11 $1,100
4/8 300 12 3,600
9/5 200 13 2,600
Ending inventory 600 $7,300
Units x Cost = Total cost

24
Specific Identification Method
Step 2: Identify the units sold and calculate the cost of goods sold.

25
Specific Identification Method
Date purchased Units Cost Total cost
Beg. Inventory 500 $10 $5,000
1/20 200 11 2,200
4/8 100 12 1,200
12/12 100 14 1,400
Cost of goods sold 900 $9,800
Units x Cost = Total cost

26
Weighted Average Method
Step 1: Calculate the cost of goods available for sale.

27
Weighted Average Cost Method
Date purchased Units Cost Total cost
Beg. inventory 500 $10 $ 5,000
1/20 300 11 3,300
4/8 400 12 4,800
9/5 200 13 2,600
12/12 100 14 1,400
Cost of goods available for sale 1,500 $17,100

28
Weighted Average Method
Step 2: Divide the cost of goods availablefor sale by the total units todetermine the weighted averagecost per unit.
:

29
Weighted Average Method
Cost of Goods Available Units Available
$17,100 1,500
= $ 11.40/unit

30
Weighted Average Method
Step 3: Calculate ending inventory and COGS by multiplying the weighted average cost per unit by the # of units in ending inventory and the # of units sold.
XAvg.Cost
# Units
31
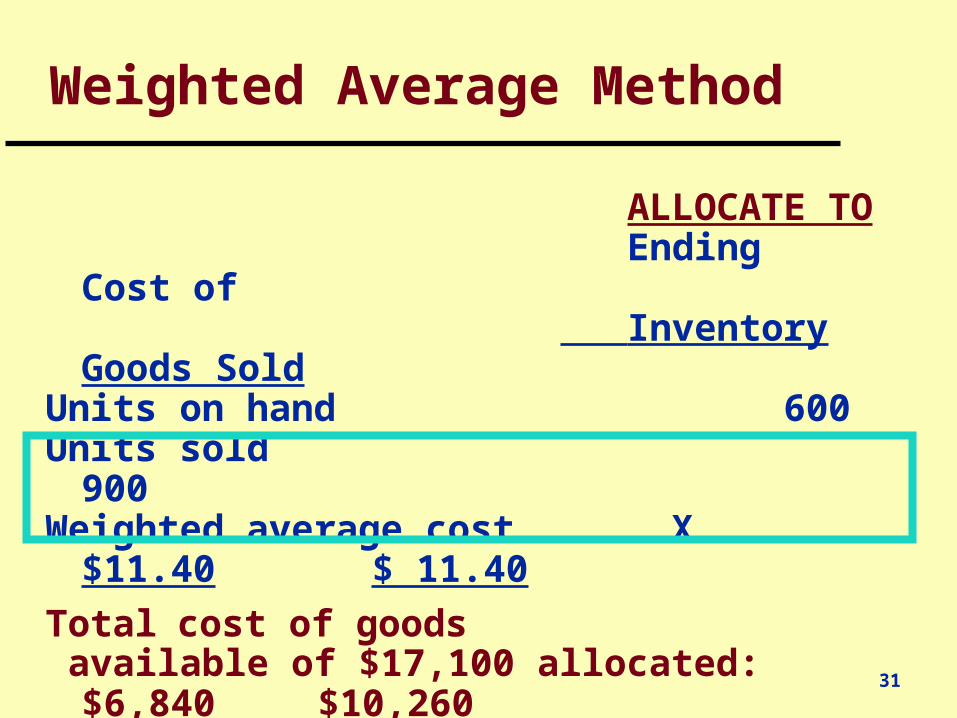
Weighted Average Method
ALLOCATE TO Ending Cost of Inventory Goods
SoldUnits on hand 600 Units sold 900Weighted average cost X $11.40 $ 11.40
Total cost of goods available of $17,100 allocated: $6,840 $10,260

32
First-in, First-out (FIFO) Method
Step 1: Assign the cost of the beginning inventory to cost of goods sold.
1stin
33
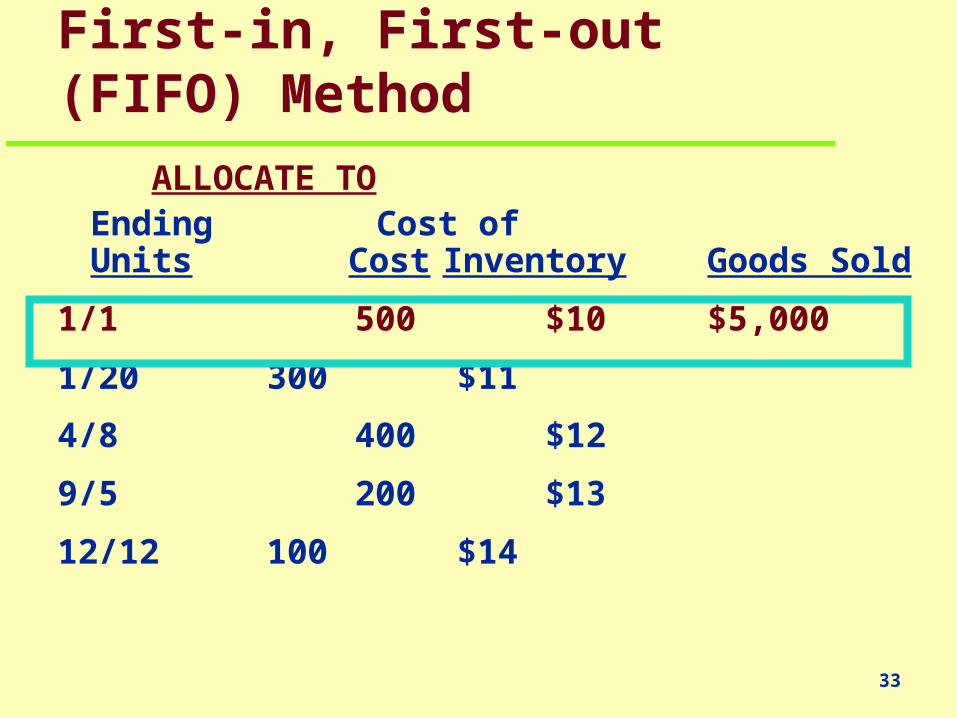
First-in, First-out (FIFO) Method
ALLOCATE TOEnding Cost ofUnits Cost Inventory Goods Sold
1/1 500 $10 $5,000
1/20 300 $11
4/8 400 $12
9/5 200 $13
12/12 100 $14

34
First-in, First-out (FIFO) Method
Step 2: Continue to work forward until you assign the total # of units sold during the period to cost of goods sold. Allocate the remaining units to ending inventory.
2nd3rd etc.

35
First-in, First-out (FIFO) Method
ALLOCATE TOEnding Cost ofUnits Cost Inventory Goods Sold
1/1 500 $10 $5,000
1/20 300 $11 3,300
4/8 300 / 100 $12 $3,600 1,200
9/5 200 $13 2,600
12/12 100 $14 1,400
TOTALS $7,600 $9,500

36
Last-in, First-out (LIFO) Method
Step 1: Assign the cost of the last units purchased to cost of goods sold.
1stin

37
Last-in, First-out (LIFO) Method
ALLOCATE TOEnding Cost ofUnits Cost Inventory Goods Sold
1/1 500 $10
1/20 300 $11
4/8 400 $12
9/5 200 $13
12/12 100 $14 $1,400

38
1stin
Step 2: Work backward until you assign the total # of units sold during the period to cost of goods sold (allocate the remaining units to ending inventory).
Last-in, First-out (LIFO) Method

39
Last-in, First-out (LIFO) Method
ALLOCATE TOEnding Cost ofUnits Cost Inventory Goods Sold
1/1 500 $10 $5,000
1/20 100 / 200 $11 1,100 $2,200
4/8 400 $12 4,800
9/5 200 $13 2,600
12/12 100 $14 1,400
TOTALS $6,100 $11,000

40
Comparison of Costing Methods
Cost of GoodsSold
Ending Inventory
11,000
6,840
7,600
10,260
9,500
17,100
17,000
17,100
WeightedAverage
FIFO
LIFO
Goods Available for Sale
6,100
Specific Identification $7,300 9,800 $17,100

41
Comparison of Costing Methods
X XX
XX
Weighted Avg. FIFO LIFO
In periods of rising prices:
highest COGS? lowest COGS?highest gross margin?lowest net income?lowest income taxes?

42
LIFO Issues
LIFO Liquidation liquidation can result in high gross margin
(and large tax bill) LIFO Conformity Rule
if used for tax, LIFO must also be used for books
LIFO Reserve difference between inventory value stated at
FIFO and value stated at LIFO

43
Reasons for Inventory Errors
Mathematical mistakes Physical inventory counting errors Cut-off problems - in-transit Goods on consignment

44
Effect of Inventory Errors on the Income Statement
(In 000s) Reported Corrected EffectSales $1,000 $1,000Beginning inventory $ 200 200 Add: Purchases 700 700 Goods available for sale $ 900 $ 900 Less: Ending inventory 300 250 $50 OSCost of goods sold $ 600 $ 650 50 USGross margin $ 400 $ 350 50 OSOperating expenses 150 150Net income 250 200 50 OS
OS = overstatement
US = understatement

45
Effect of Inventory Errors on the Income Statement
(in 000s) Reported Corrected EffectSales $1,500 $1,500Beginning inventory $ 300 250 $50 OS Add: Purchases 1,100 1,100 Goods available for sale $1,400 $1,350 50 OS Less: Ending inventory 350 350Cost of goods sold $1,050 $1,000 50 OSGross margin $ 450 $ 500 50 USOperating expenses 120 120Net income 330 380 50 US
OS = overstatement
US = understatement

46
Counterbalancing Errors
Assume ending inventory is overstated (+) by $50,000 in 2004:
2004 Beginning inventory $xxx,xxx Add: Purchases xxx,xxx = Goods available for sale xxx,xxx Less: Ending inventory + 50,000
= Cost of goods sold - 50,000

47
Counterbalancing Errors
2004 ending inventory becomes 2005 beginning inventory:
2004 2005Beginning inventory $ xxx,xxx + 50,000Add: Purchases xxx,xxx = Goods available for sale xxx,xxx Less: Ending inventory +50,000 = Cost of goods sold - 50,000

48
The 2004 error reverses in 2005 (but 2004 inventory and both 2004 and 2005 profits are misstated by $50,000):
2004 2005
Beginning inventory $xxx,xxx $+50,000
Add: Purchases xxx,xxx xxx,xxx
= Goods available for sale xxx,xxx + 50,000
Less: Ending inventory + 50,000 xxx,xxx
= Cost of goods sold
Counterbalancing Errors
- 50,000 + 50,000
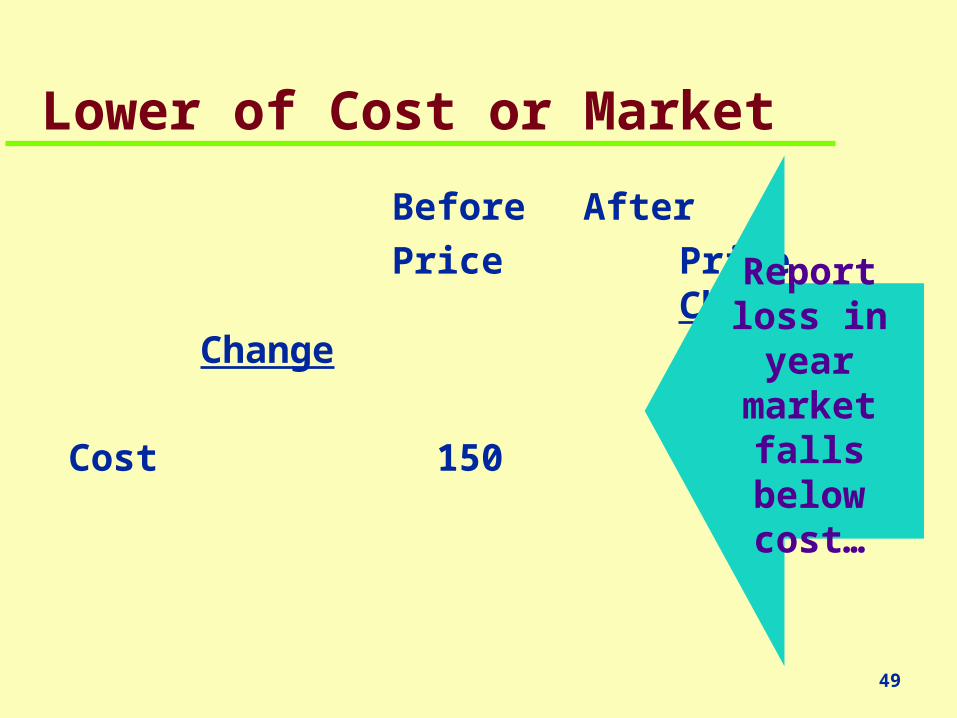
Lower of Cost or Market
Before After
Price PriceChange Change
Cost 150 120
Report loss in year
market falls below cost…
49

Before After
Price PriceChange Change
Selling price $200 $160
Cost 150 120
Gross margin $ 50 $ 40
Lower of Cost or Market
Gross margin % 25% 25%
…to maintain
normal G.M.%
when sold
50

51
Market = replacement cost (not retail value) Cost determined under one of four methods Justified on basis of conservatism Can be applied to:
entire inventory individual items groups of items
Lower of Cost or Market

52
Estimating Inventory Values
Sometimes impossible or impractical to measure inventory at cost– Estimation is necessary
Two methods used to estimate ending inventory values:– gross profit method– retail inventory method

53
Gross Profit Method
1 Beginning inventory
2 + Purchases
3 = Cost of goods available for sale
4 - Ending inventory
5 = Cost of goods sold
Use income statement model butreverse steps 4 and 5
54
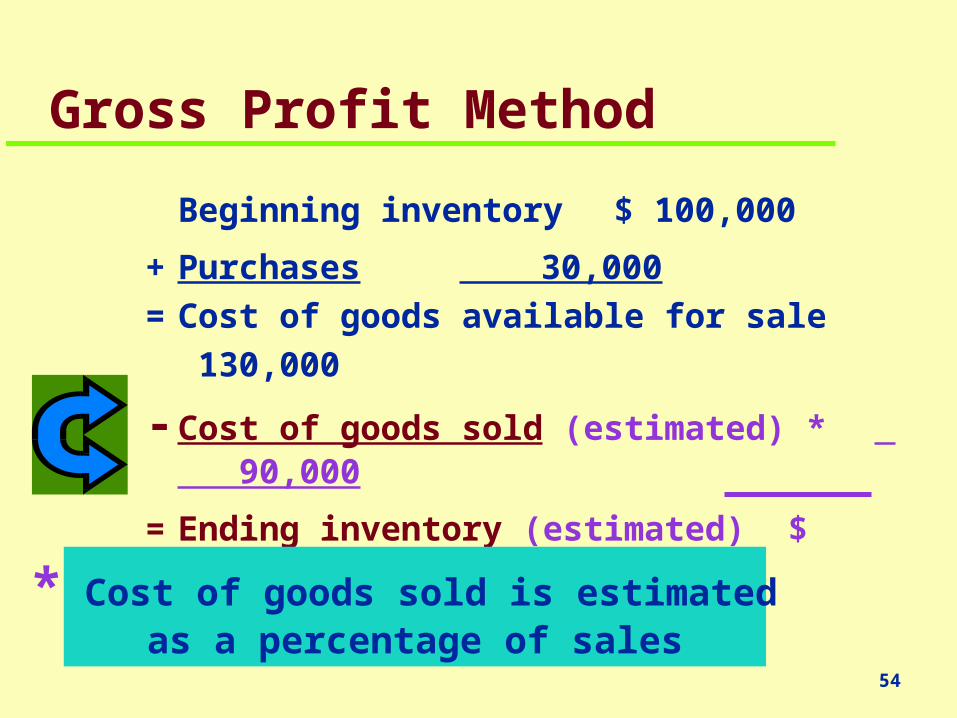
Gross Profit Method
Beginning inventory $ 100,000
+ Purchases 30,000
= Cost of goods available for sale 130,000
- Cost of goods sold (estimated) * 90,000
= Ending inventory (estimated) $ 40,000
* Cost of goods sold is estimated as a percentage of sales

55
Cost of Goods SoldAverage Inventory
Inventory Turnover Ratio
The number of times per period inventory is turned over (i.e., sold)

56
Circuit City 5.8 times per yearSafeway 9.2 times per year
Inventory Turnover Ratios
Example:
Can you compare the two ratios?

57
Number of Days’ Sales in Inventory
The average # of days inventory is on handbefore it is sold.
# of Days in PeriodInventory Turnover
Ratio
1 2 3
4 5 6 7 8 9 10
11 12 13 14 15 16 17
18 19 20 21 22 23 24
25 26 28 29 30 3127
58
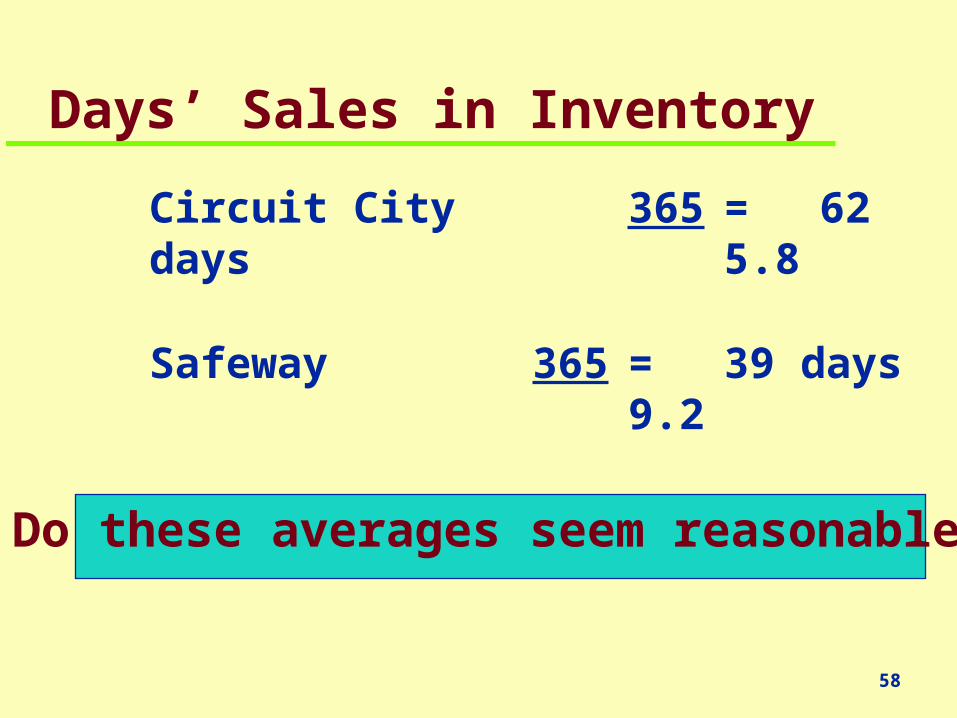
Days’ Sales in Inventory
Circuit City 365 = 62 days5.8
Safeway 365 = 39 days9.2
Do these averages seem reasonable?

59
Statement of Cash FlowsCash Flows from Operating Activities: Net income $ xxx Increase in inventory – Decrease in inventory + Increase in accts. payable + Decrease in accts. payable –
- OR -
Cash paid for inventory purchases –
IndirectMethod
DirectMethod

60
Appendix
Accounting Tools:
Inventory Costing Methods with the Use of a Perpetual Inventory System

61
FIFO Costing With a Perpetual System
FIFO applied
at time of
sale
Same FIFO inventory total under periodic and perpetual systems

62
LIFO Costing With a Perpetual System
LIFO applied
at time of
sale
Different LIFO inventory total under periodic and perpetual systems because of pricing gap

63
Moving Average With a Perpetual System
Different inventory total under weighted average (periodic) and moving average (perpetual)
New weighted average
cost is computed for
each purchase

64
End of Chapter 7