Chapter 6 The Human Population and Its...
56
Chapter 6 The Human Population and Its Impact The problems to be faced are vast and complex, but come down to this: 6.9 billion people are breeding exponentially. The process of fulfilling their wants and needs is stripping earth of its biotic capacity to support life; a climatic burst of consumption by a single species is overwhelming the skies, earth, waters, and fauna. - Paul Hawken
Transcript of Chapter 6 The Human Population and Its...

Chapter 6 The Human Population and Its Impact The problems to be faced are vast and complex, but come down to this: 6.9 billion people are breeding exponentially. The process of fulfilling their wants and needs is stripping earth of its biotic capacity to support life; a climatic burst of consumption by a single species is overwhelming the skies, earth, waters, and fauna. - Paul Hawken

6-1 How Many People Can the Earth Support?
• Concept 6-1 We do not know how long we can continue increasing the earth’s carrying capacity for humans without seriously degrading the life-support system that keeps us and many other species alive.

Core Case Study: Slowing Population
Growth in China: A Success Story • 1.3 billion people: most populous country
• Promotes one-child families
• Contraception, abortion, sterilization
• Fast-growing economy
• Serious resource and environmental problems

Crowded Street in China
Fig. 6-1, p. 125
Presenter
Presentation Notes
Figure 6.1: Hundreds of people crowd a street in China. Almost one of every five persons on the planet lives in China, and the country’s resource use per person is projected to grow rapidly as China becomes more modernized and wealthy.

Human Population Growth Continues but It Is Unevenly Distributed
• Reasons for human population increase • Movement into new habitats and climate zones • Early and modern agriculture methods • Control of infectious diseases through
• Sanitation systems • Antibiotics • Vaccines • Health care
• Most population growth over last 100 years due to
drop in death rates

Human Population Growth Continues but It Is Unevenly Distributed
• Population growth in developing countries is increasing 9 times faster than developed countries
• 2050 • 95% of growth in developing countries • 7.8-10.8 billion people
• Should the optimum sustainable population be
based on cultural carrying capacity?

Human Population Growth
Fig. 1-18, p. 21
Presenter
Presentation Notes
Figure 1.18: Exponential growth: The J-shaped curve represents past exponential world population growth, with projections to 2100 showing possible population stabilization as the J-shaped curve of growth changes to an S-shaped curve. (This figure is not to scale.) (Data from the World Bank and United Nations, 2008; photo L. Yong/UNEP/Peter Arnold, Inc.)

Population Time Line: 10,000 BC - 2042
Figure 3, Supplement 9

Annual Growth Rate of World Population, 1950-2010
Fig. 6-2, p. 127
POPULATION: http://www.census.gov/main/www/popclock.html
Presenter
Presentation Notes
6-2

Where Population Growth Occurred, 1950-2010
Fig. 6-3, p. 127
Presenter
Presentation Notes
Figure 6.3: Most of the world’s population growth between 1950 and 2010 took place in the world’s less-developed countries. This gap is projected to increase between 2010 and 2050. (Data from United Nations Population Division, The 2008 Revision and Population Reference Bureau, 2010 World Population Data Sheet)

Five Most Populous Countries, 2010 and 2050
Fig. 6-4, p. 127
Presenter
Presentation Notes
Figure 6.4: This chart shows the populations of the world’s five most populous countries in 2010 and 2050 (projected). In 2010, more than one of every three persons on the earth lived in China (with 19% of the world’s population) or India (with 17%). (Data from United Nations Population Division)

Science Focus: Projecting Population Change
• Why range of 7.8-10.8 billion for 2050?
• Demographers must: 1. Determine reliability of current estimates 2. Make assumptions about fertility trends 3. Deal with different databases and sets of
assumptions

World Population Projections to 2050
Fig. 6-A, p. 128
Presenter
Presentation Notes
Figure 6.A: This graph shows world population projections to 2050 from three different organizations: the UN, the U.S. Census Bureau, and IIASA. Note that the upper-most, middle, and lower-most curves of these five projections are all from the UN, each assuming a different level of fertility.

Science Focus: How Long Can The Human Population Keep Growing?
• Thomas Malthus and population growth: 1798
• Overpopulation and overconsumption
• Will technology increase human carrying capacity?
• Can the human population grow indefinitely?

Natural Capital Degradation: Altering Nature to Meet Our Needs
Fig. 6-B, p. 129
Presenter
Presentation Notes
Figure 6.B: This list describes eight major ways in which we humans have altered natural systems to meet our growing population’s resource needs and wants (Concept 6-1). See an animation based on this figure at CengageNOW. Questions: Which three of these impacts do you believe have been the most harmful? Explain. How does your lifestyle contribute directly or indirectly to each of these harmful impacts?

6-2 What Factors Influence the Size of the Human Population?
• Concept 6-2A Population size increases because of births and immigration, and decreases through deaths and emigration.
• Concept 6-2B The average number of children born
to women in a population (total fertility rate) is the key factor that determines population size.

The Human Population Can Grow, Decline, or Remain Fairly Stable
• Population change • Births: fertility • Deaths: mortality • Migration
• Population change = (births + immigration) – (deaths + emigration)
• Crude birth rate: # live births/1000/year
• Crude death rate: # deaths/1000/year

Women Having Fewer Babies but Not Few Enough to Stabilize the World’s Population
• Fertility rate • number of children born to a woman during her
lifetime • Replacement-level fertility rate
• Average number of children a couple must have to replace themselves
• 2.1 in developed countries • Up to 2.5 in developing countries
• Total fertility rate (TFR) • Average number of children born to women in a
population

Total fertility rate, 1955-2010
Fig. 6-5, p. 130
Presenter
Presentation Notes
Figure 6.5: This graph tracks the total fertility rate for both the more-developed and less-developed regions of the world, 1955–2010, with projections to 2050 (based on medium population projections). Although the world’s average TFR has dropped to 2.5, it will have to drop to around 2.1 to eventually halt the world’s population growth. (Data from United Nations Population Division)

2010 Rate of Population Increase
Figure 11, Supplement 8

Case Study: The U.S. Population Is Growing Rapidly
• Population still growing and not leveling off • 76 million in 1900 • 310 million in 2010
• Drop in TFR in U.S.
• Rate of population growth has slowed
• Changes in lifestyle in the U.S. during the 20th century

U.S. TFRs and birth rates 1917-2010
Fig. 6-6, p. 131
Presenter
Presentation Notes
Figure 6.6: The top graph shows the total fertility rates for the United States between 1917 and 2010 and the bottom graph shows the country’s birth rate between 1917 and 2010. Question: The U.S. fertility rate has declined and remained at or below replacement levels since 1972. So why is the population of the United States still increasing? (Data from Population Reference Bureau and U.S. Census Bureau)

Fig. 6-7, p. 132
20th Century Lifestyle Changes in the U.S.
Presenter
Presentation Notes
Figure 6.7: This chart lists some major changes that took place in the United States between 1900 and 2000. Question: Which two of these changes do you think were the most important? (Data from U.S. Census Bureau and Department of Commerce)
Several Factors Affect Birth Rates and Fertility Rates
• Children as part of the labor force • Cost of raising and educating
children
• Availability of private and public pension
• Urbanization
• Educational and employment opportunities for women

Several Factors Affect Birth Rates and Fertility Rates (2)
• Average age of a woman at birth of first child
• Availability of legal abortions
• Availability of reliable birth control methods
• Religious beliefs, traditions, and cultural norms

Fig. 6-8, p. 132
Girl Carrying Well Water in India
Presenter
Presentation Notes
Figure 6.8: This girl is carrying well water across parched earth that has dried out and cracked during a severe drought in India.

Fig. 6-9, p. 133
Child Laborers in India
Presenter
Presentation Notes
Figure 6.9: These young girls are child laborers in the state of Rajasthan in India. They are weaving wool on looms to make carpets for export, and receive very little money for their work.

Several Factors Affect Death Rates • Life expectancy • Infant mortality rate
• Number of live births that die in first year
• Why are people living longer?
• Increased food supply and distribution
• Better nutrition • Medical advances • Improved sanitation

United States: Death Rates • U.S. is 54th in world for infant mortality rate
• U.S. infant mortality rate high due to
• Inadequate health care for poor women during pregnancy and their infants
• Drug addiction among pregnant women • High birth rate among teenagers

Fig. 6-10, p. 134
Infant Mortality Rates, 1950-2010
Presenter
Presentation Notes
Figure 6.10: This graph tracks the infant mortality rates for the world’s more-developed countries and less-developed countries, 1950–2010, with projections to 2050 based on medium population projections. (Data from United Nations Population Division)

Figure 13, Supplement 8
Infant Mortality Rates in 2010

Migration Affects an Area’s Population Size
• Economic improvement
• Religious freedom
• Political freedom
• Wars • Environmental refugees

Case Study: The United States: A Nation of Immigrants
• Historical role of immigration in the U.S. • Legal immigration • Illegal immigration
• Controversy over immigration policy


Fig. 6-11, p. 135
Legal Immigration to the U.S. between 1820 and 2006
Presenter
Presentation Notes
Figure 6.11: This graph shows legal immigration to the United States, 1820–2006 (the last year for which data are available). The large increase in immigration since 1989 resulted mostly from the Immigration Reform and Control Act of 1986, which granted legal status to certain illegal immigrants who could show they had been living in the country prior to January 1, 1982. (Data from U.S. Immigration and Naturalization Service and the Pew Hispanic Center)

6-3 How Does a Population’s Age Structure Affect Its Growth or Decline?
• Concept 6-3 The numbers of males and females in young, middle, and older age groups determine how fast a population grows or declines.

A Population’s Age Structure Helps Us Make Projections
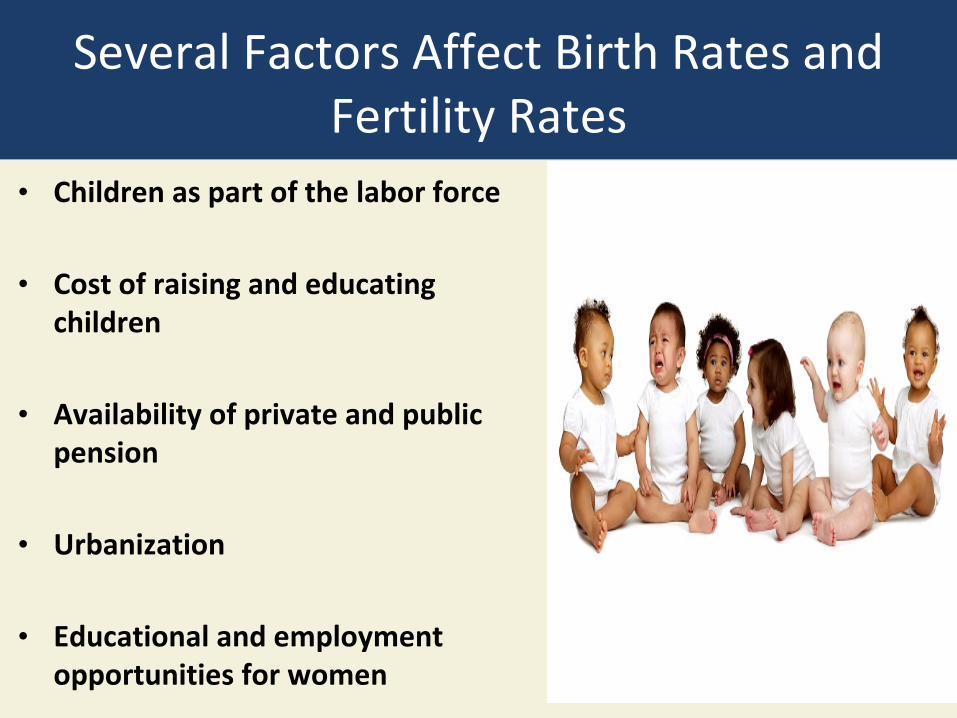
• Age structure categories • Prereproductive ages (0-14) • Reproductive ages (15-44) • Postreproductive ages (45 and older)
• Seniors are the fastest-growing age group
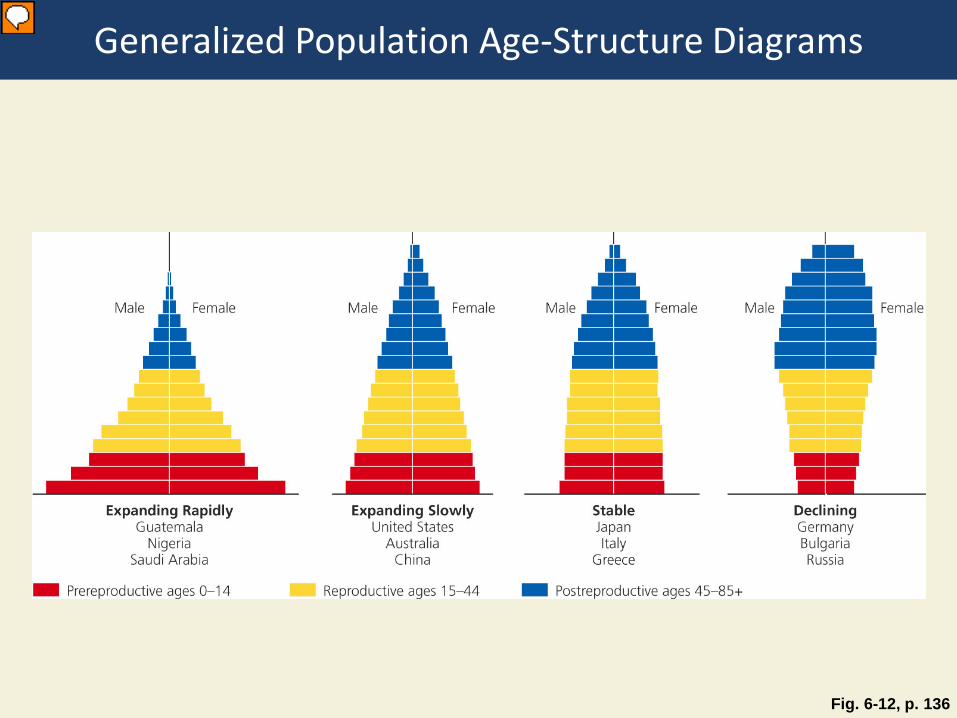
Fig. 6-12, p. 136
Generalized Population Age-Structure Diagrams
Presenter
Presentation Notes
Figure 6.12: This chart represents the generalized population age-structure diagrams for countries with rapid (1.5–3%), slow (0.3–1.4%), zero (0–0.2%), and negative (declining) population growth rates. A population with a large proportion of its people in the prereproductive age group (far left) has a significant potential for rapid population growth. See an animation based on this figure at CengageNOW. Question: Which of these diagrams best represents the country where you live? (Data from Population Reference Bureau)

Fig. 6-13, p. 136
Population Structure by Age and Sex in Developing and Developed Countries
Presenter
Presentation Notes
Figure 6.13: Global outlook: These charts illustrate population structure by age and sex in less-developed countries and more-developed countries for 2010. Question: If all girls under 15 were to have only one child during their lifetimes, how do you think these structures would change over time? (Data from United Nations Population Division and Population Reference Bureau)

Case Study: The American Baby Boom
• 79 million people, 36% of adults
• Affect politics and economics
• Now becoming senior citizens • Graying of America

Fig. 6-14, p. 137
Tracking the Baby-Boom Generation in the United States
Presenter
Presentation Notes
Figure 6.14: These charts track the baby-boom generation in the United States, showing the U.S. population by age and sex for 1955, 1985, 2015 (projected), and 2035 (projected). See an animation based on this figure at CengageNOW. (Data from U.S. Census Bureau)

Populations Made Up of Mostly Older People Can Decline Rapidly
• Slow decline • Manageable
• Rapid decline
• Severe economic problems • How pay for services for elderly • Proportionally fewer young people working • Labor shortages
• Severe social problems

Fig. 6-15, p. 138
Some Problems with Rapid Population Decline
Presenter
Presentation Notes
Figure 6.15: Rapid population decline can cause several problems. Question: Which three of these problems do you think are the most important?

Populations Can Decline from a Rising Death Rate: The AIDS Tragedy
• 27 million killed: 1981-2009
• Many young adults die: loss of most productive workers
• Sharp drop in life expectancy
• International community • Reduce the spread of HIV through
education and health care • Financial assistance and volunteers

Fig. 6-16, p. 139
Botswana Age Structure, With and Without AIDS
Presenter
Presentation Notes
Figure 6.16: Global outlook: Worldwide, AIDS is the leading cause of death for people ages 15–49. This loss of productive working adults can affect the age structure of a population. In Botswana, more than 24% of this age group was infected with HIV in 2008 and about 148,000 people died. This figure shows two projected age structures for Botswana’s population in 2020—one including the possible effects of the AIDS epidemic (red bars), and the other not including those effects (yellow bars). See the Data Analysis Exercise at the end of this chapter for further analysis of this problem. (Data from the U.S. Census Bureau) Question: How might this affect Botswana’s economic development?

6-4 How Can We Slow Human Population Growth?
• Concept 6-4 We can slow human population growth by reducing poverty, elevating the status of women, and encouraging family planning.

As Countries Develop, Their Populations Tend to Grow More Slowly
• Demographic transition • First death rates decline • Then birth rates decline
• Four stages
1. Preindustrial 2.Transitional 3. Industrial 4.Postindustrial

Fig. 6-17, p. 140
Four Stages of the Demographic Transition
Presenter
Presentation Notes
Figure 6.17: The demographic transition, which a country can experience as it becomes industrialized and more economically developed, can take place in four stages. See an animation based on this figure at CengageNOW. Question: At what stage is the country where you live?

Fig. 6-18, p. 140
TFR in Bangladesh and U.S., 1800-2010
Presenter
Presentation Notes
Figure 6.18: This graph tracks demographic transition in terms of the average lifetime number of births per woman (TFR) in Bangladesh and in the United States, 1800–2010. Question: What role do you think economic development has played in the different paths that these two countries have taken toward making a demographic transition? (Data from Population Reference Bureau, World Population Data Sheet 2009 and 2010; Bangladesh: United Nations Demographic and Heath Surveys; United States: Ansley Coale and Melvin Zeinik and National Center for Health Statistics)

Fig. 6-19, p. 141
Slum in India
Presenter
Presentation Notes
Figure 6.19: More than 200,000 people are packed into this huge slum in India. Residents tend to have a large number of children as a survival mechanism. Economic development that provides jobs and more economic security would help to reduce the average number of children per woman and slow population growth.

Empowering Women Can Slow Population Growth
• Factors that decrease total fertility rates: • Education • Paying jobs • Ability to control fertility
• Women
• Do most of the domestic work and child care • Provide unpaid health care • 2/3 of all work for 10% of world’s income • Discriminated against legally and culturally

Fig. 6-20, p. 141
Burkina Faso Women Hauling Fuelwood
Presenter
Presentation Notes
Figure 6.20: These women from a village in the West African country of Burkina Faso are bringing home fuelwood. Typically, they spend two hours a day, two or three times a week, searching for and hauling fuelwood.

Promote Family Planning • Family planning in less-developed countries
• Responsible for a 55% drop in TFRs • Financial benefits: money spent on family planning
saves far more in health, education costs
• Two problems 1.42% pregnancies unplanned, 26% end with abortion 2.Many couples do not have access to family planning

Case Study: Slowing Population Growth in India
• 1.2 billion people, most populous country in 2015 • Problems
• Poverty • Malnutrition • Environmental degradation
• Bias toward having male children • Poor couples want many children • Only 48% of couples use family planning

Fig. 6-21, p. 143
Homeless Woman and Child in India
Presenter
Presentation Notes
Figure 6.21: About three of every four (76%) of the people in India, like this homeless mother and her child, struggle to live on the equivalent of less than $2.25 per day. In China, the percentage of the population living in extreme poverty is about 36% of the population.

Three Big Ideas
1. The human population is increasing rapidly and may soon bump up against environmental limits.
2. Even if population growth were not a serious problem, the increasing use of resources per person is expanding the overall human ecological footprint and putting a strain on the earth’s resources.
3. We can slow population growth by reducing poverty through economic development, elevating the status of women, and encouraging family planning.