Chapter 6: Research findings - UPSpace Home · Chapter 6: Research findings 6.1 Introduction The...
76
Research Findings 173 Chapter 6: Research findings 6.1 Introduction The purpose of this chapter is to present the empirical research results. The literature review revealed the need for the SME owner to have a set of competencies to be successful in business. The review also highlighted the importance of related relevant training programmes that can help SMEs raise their skills. The key motivation behind this study is to investigate any notable differences or similarities between the successful and the less successful SMEs in terms of competencies, and to find out whether these competencies are related to the training received. This chapter provides a summary of the data analysis and interpretation of the research findings based on the responses from the respondents who completed the quantitative research questionnaires. The first section of this chapter reports on the demographic profile of the respondents (570 manufacturing SMEs), comparing the 197 successful and the 373 less successful SMEs. The second section focuses on the business demographics of the respondents and examines all essential business information. Both section one and two use descriptive statistics to analyse the data characteristics in terms of shape, skewness and spread. The third section gives the results of factor analysis giving factors on which the successful and less successful samples will be compared. The factor analysis illustrated the reliability and validity of the data and the measuring instruments that were used in this study. The fourth section focuses on the significant differences between successful and less successful SMEs with the t-tests, chi-square tests and one way analysis of Variance (ANOVA) are presented. In order to find out the sources of differences within the different aspects of a factor, more detailed tests are done using the Scheffe’s multiple comparison procedure. The fifth section comprises the correlation analysis used to test the strength of the relationship between competence and training received. The final section of this chapter provides general comments on open ended questions from the respondents regarding the usefulness of training in SME success.
Transcript of Chapter 6: Research findings - UPSpace Home · Chapter 6: Research findings 6.1 Introduction The...
Research Findings 173
Chapter 6: Research findings
6.1 Introduction
The purpose of this chapter is to present the empirical research results. The literature
review revealed the need for the SME owner to have a set of competencies to be successful
in business. The review also highlighted the importance of related relevant training
programmes that can help SMEs raise their skills. The key motivation behind this study is to
investigate any notable differences or similarities between the successful and the less
successful SMEs in terms of competencies, and to find out whether these competencies are
related to the training received. This chapter provides a summary of the data analysis and
interpretation of the research findings based on the responses from the respondents who
completed the quantitative research questionnaires.
The first section of this chapter reports on the demographic profile of the respondents (570
manufacturing SMEs), comparing the 197 successful and the 373 less successful SMEs.
The second section focuses on the business demographics of the respondents and
examines all essential business information. Both section one and two use descriptive
statistics to analyse the data characteristics in terms of shape, skewness and spread. The
third section gives the results of factor analysis giving factors on which the successful and
less successful samples will be compared. The factor analysis illustrated the reliability and
validity of the data and the measuring instruments that were used in this study.
The fourth section focuses on the significant differences between successful and less
successful SMEs with the t-tests, chi-square tests and one way analysis of Variance
(ANOVA) are presented. In order to find out the sources of differences within the different
aspects of a factor, more detailed tests are done using the Scheffe’s multiple comparison
procedure. The fifth section comprises the correlation analysis used to test the strength of
the relationship between competence and training received. The final section of this chapter
provides general comments on open ended questions from the respondents regarding the
usefulness of training in SME success.

Research Findings 174
6.2 Response rate
Of the targeted sample of 700 SMEs of 350 per sub-sample, 600 were collected and
acceptable yielding an 85% response rate. Two purposive samples were derived from the
division of the responses elicited, based on the success criteria defined in chapter 1. Only
those surveys in which all items were completed were used for statistical analysis. 30
questionnaires were excluded as they had too many missing entries or incorrect entries. 197
SMEs had more than 5 employees and earned more than R150 000 and were in existence
as businesses for more than three years. 373 SMEs were considered as less successful
SMEs as they had either less than 5 employees or had annual turnover of less than
R150 000 or were less than 3 years in existence as a business.
6.3 Personal demographics
The personal demographics variables for which information was obtained included gender,
age, level of education, ethnic groups, language and work experience. The personal
demographics of the two respondent samples are presented in the tables and figures that
follow:
6.3.1 Gender
The gender composition of the respondents is indicated in table 6.1
Table 6.1: Gender composition
Successful Less successful Total Gender frequency percent frequency percent frequency percent
male 82 41.62% 102 27.35% 197 34.56%
female 115 58.38% 271 72.65% 373 65.44%
total 197 100.00% 373 100.00% 570 100.00%
It is found that this sector is female dominated as both samples had majority (over 50%) as
females. However there were more females (72.65%) in the less successful than the

Research Findings 175
successful sample (58.38%). There are more males (41.62%) in the successful sample than
males in the less successful sample (27.35%).
Figure 6.1: Gender composition of the successful and less successful SMEs
successful gender distribution
42%
58%
male
female
less successful gender distribution
27%
73%
male
female
It could be stated that successful SMEs are led by mainly male managers while less
successful SMEs are mainly female.
6.3.2 Average age of respondents
Descriptive statistics was generated using SAS v8.2 statistical software to find frequencies
and percentages for the “age” variable. This is given in a summary statistic for the mean
factor scores. The average age of the respondents is indicated in Table 6.2:
Research Findings 176
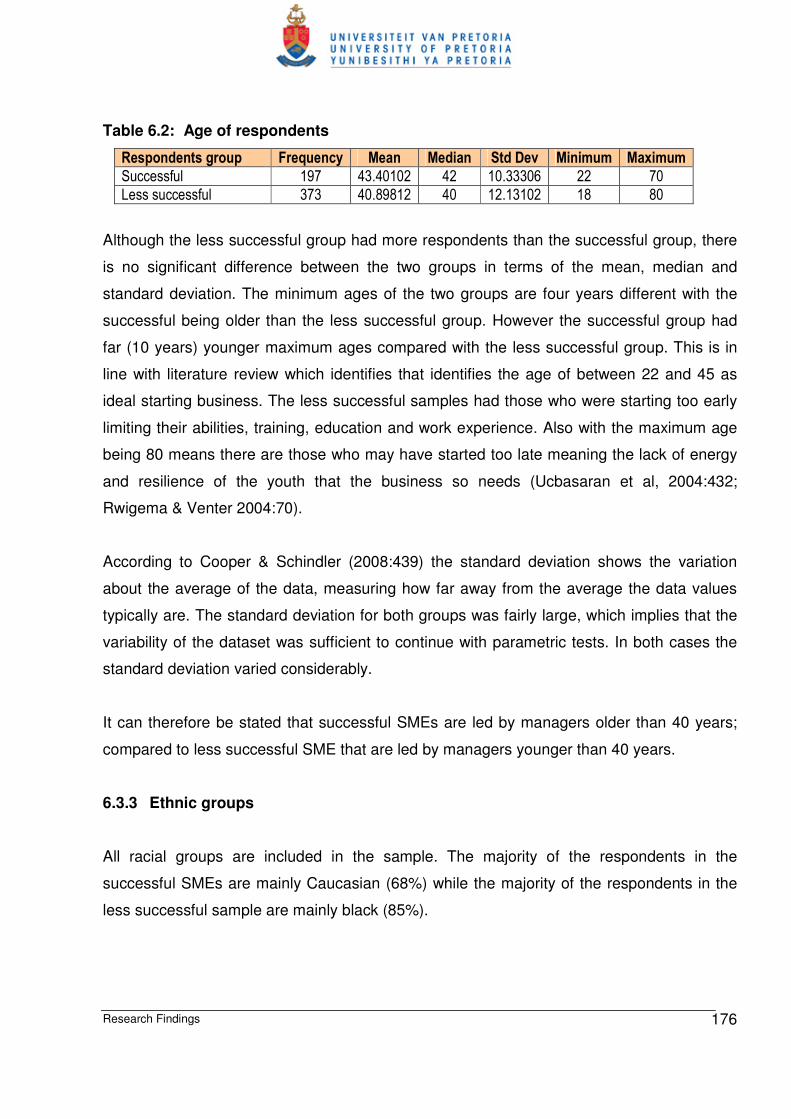
Table 6.2: Age of respondents
Respondents group Frequency Mean Median Std Dev Minimum Maximum
Successful 197 43.40102 42 10.33306 22 70
Less successful 373 40.89812 40 12.13102 18 80
Although the less successful group had more respondents than the successful group, there
is no significant difference between the two groups in terms of the mean, median and
standard deviation. The minimum ages of the two groups are four years different with the
successful being older than the less successful group. However the successful group had
far (10 years) younger maximum ages compared with the less successful group. This is in
line with literature review which identifies that identifies the age of between 22 and 45 as
ideal starting business. The less successful samples had those who were starting too early
limiting their abilities, training, education and work experience. Also with the maximum age
being 80 means there are those who may have started too late meaning the lack of energy
and resilience of the youth that the business so needs (Ucbasaran et al, 2004:432;
Rwigema & Venter 2004:70).
According to Cooper & Schindler (2008:439) the standard deviation shows the variation
about the average of the data, measuring how far away from the average the data values
typically are. The standard deviation for both groups was fairly large, which implies that the
variability of the dataset was sufficient to continue with parametric tests. In both cases the
standard deviation varied considerably.
It can therefore be stated that successful SMEs are led by managers older than 40 years;
compared to less successful SME that are led by managers younger than 40 years.
6.3.3 Ethnic groups
All racial groups are included in the sample. The majority of the respondents in the
successful SMEs are mainly Caucasian (68%) while the majority of the respondents in the
less successful sample are mainly black (85%).

Research Findings 177
Figure 6.2: Ethnic groups of the two samples
It can be stated that successful SMEs are led by mainly white managers while less
successful SMEs are mainly black.
6.3.4 Language
The home language of the groups is provided below in Table 6.3
racial distribution of less successful SMEs
black
85%
white
10% coloured
1%
indian
4%
racial distribution of successful SMEs
black
9%
coloured
7%
indian
16%
white
68%
Research Findings 178
Table 6.3: The home language of the respondents
Language Successful Less successful
variable frequency percent frequency percent
Afrikaans 19 9.64% 8 2.14%
English 161 81.73% 68 18.23%
Ndebele 1 0.51% 1 0.27%
Pedi 4 2.03% 21 5.63%
Sotho 2 1.02% 32 8.58%
Swazi 0 0.00% 8 2.14%
Tsonga 0 0.00% 14 3.75%
Tswana 2 1.02% 36 9.65%
Venda 1 0.51% 7 1.88%
Xhosa 3 1.52% 26 6.97%
Zulu 2 1.02% 150 40.21%
Other 2 1.02% 2 0.54%
total 197 100.00% 373 100.00%
The respondents in the successful sample were mostly English and Afrikaans speaking
while the majority of the less successful SMEs were speaking the African languages
dominated by Zulu. The other was excluded from any analysis as they were, even
combined, too small to facilitate stable statistics.
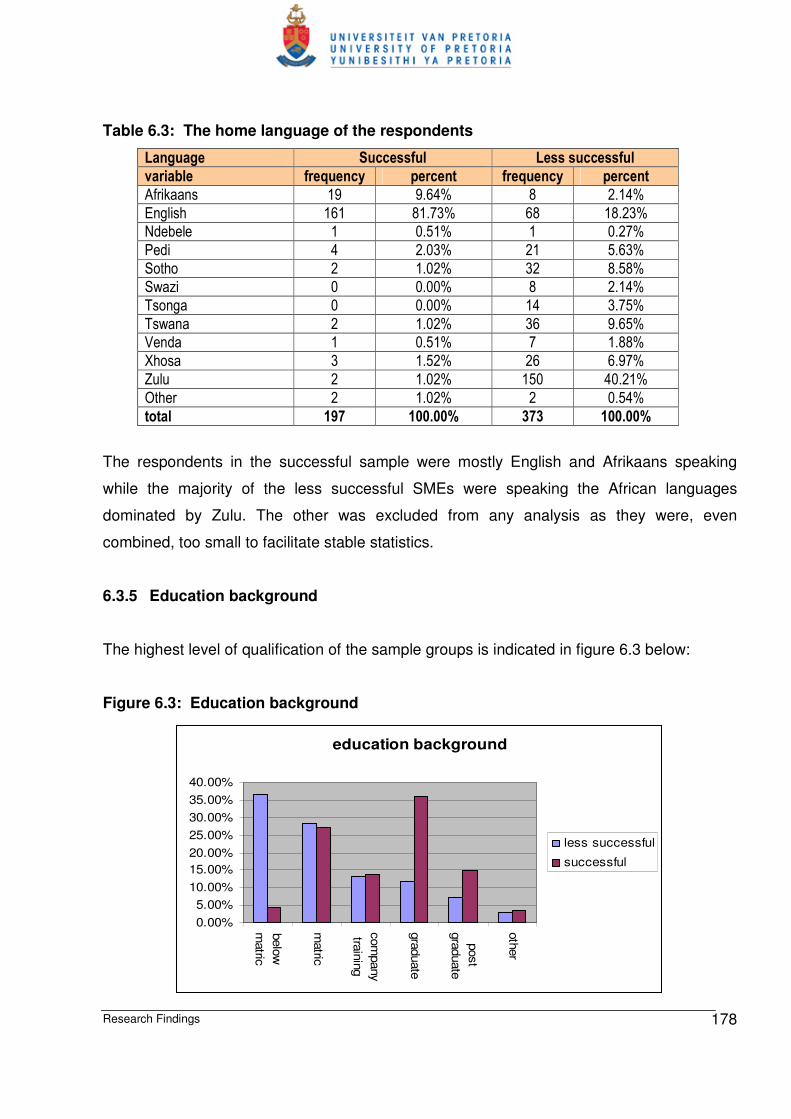
6.3.5 Education background
The highest level of qualification of the sample groups is indicated in figure 6.3 below:
Figure 6.3: Education background
education background
0.00%
5.00%
10.00%
15.00%
20.00%
25.00%
30.00%
35.00%
40.00%
belo
w
matric
matric
com
pany
train
ing
gra
duate
post
gra
duate
oth
er
less successful
successful

Research Findings 179
The majority of the successful group were on average more educated that the less
successful group whose large majority (64.88%) have only matric and below. More than
54.31% of the successful SME respondents were graduates and or had other tertiary
qualification. Both the successful and less successful SMEs had similar in terms of company
training.
It can be stated that successful SMEs are led by managers with education levels above
matric while less successful SME have education levels at matric or lower. This supports
GEM (2005b:8) that states that South African adults who do not have tertiary education are
less likely to sustain new ventures.
6.3.6 Work experience
More of the successful groups (51.27%) had on average worked more than 6 years prior to
starting their own businesses as compared to the less successful group whose majority
(43.97%) indicated they had two or less years of experience, as indicated in Figure 6.4
below.
Figure 6.4: Work experience of the respondents in the two samples
work experience
0.00%
10.00%
20.00%
30.00%
40.00%
50.00%
60.00%
0 to 2 yrs 2 to 4 yrs 4 to 6 yrs > 6 yrs
less successful
successful
It can be stated that successful SMEs are led by mainly managers with more than 4 years of
work experience while less successful SMEs have less than 4 years experience.

Research Findings 180
6.4 Business demographics
Business demographics report information about the respondents businesses. Both the
successful and the less successful samples had to have similar business biographical
characteristics (as far as possible) to be able to compare the samples against each other.
The business demographics variables for which information was obtained included the
number of years in business, the number of employees, income, the business sector, the
regions, the location, the product focus and the form of business.
The first three variables were used as business performance indicators to categorise
whether the SME fell into the successful or less successful sample. These three indicators
were the number of years in business, annual turnover and number of employees in the
SMEs.
6.4.1 Number of years in business
The number of years in business existence was three years or more for the successful SME
sample. This questionnaire, divided the years of existence into less than three years and
three and more being one of the three main factors used as business performance
indicators.
Figure 6.5: Years in business
successful
< 3 years
3 or more
less successful
< 3 years
3 or more

Research Findings 181
It was noted that there were other respondents whose age was more than three years but
they were categorised as less successful due to less than 5 employees and or less than or
equal to R150,000 annual turnover.
6.4.2 Number of employees
Descriptive statistics was generated using SAS v8.2 statistical software to find frequencies
and percentages for categorical variables. This was given in a summary statistic for mean
factor scores as shown in Table 6.4 below.
Table 6.4: Number of employees
Average number of people employed by successful SMEs was 41 while those employed by
less successful employees was 4.
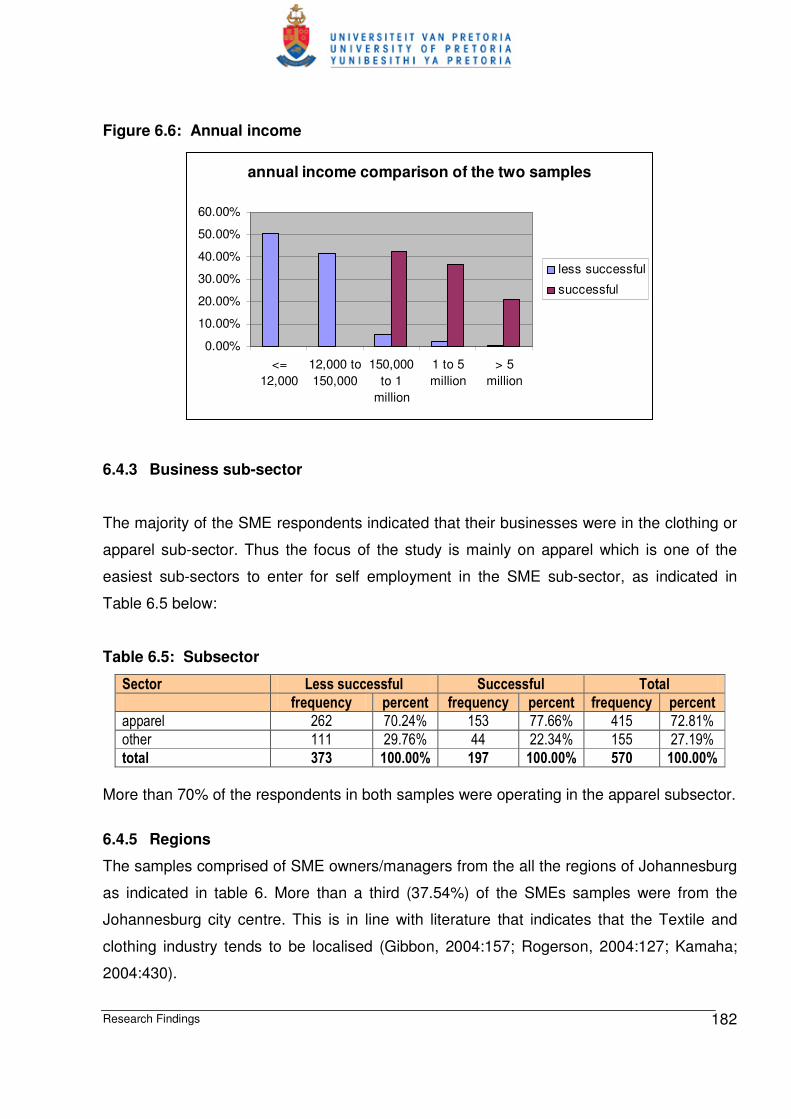
6.4.3 Income
The majority of the respondents in the successful sample indicated that their annual
turnover was more than R150,000. In contrast most of the less successful SMEs were under
R150,000 with the majority earning less than R12,000. There was a normal distribution
between all the intervals.
Number of Employees Mean Median Std Deviation Minimum Maximum
Successful 41.38579 23 62.05234 6 520
Less successful 4.281501 2 7.600835 1 105
Research Findings 182
Figure 6.6: Annual income
annual income comparison of the two samples
0.00%
10.00%
20.00%
30.00%
40.00%
50.00%
60.00%
<=
12,000
12,000 to
150,000
150,000
to 1
million
1 to 5
million
> 5
million
less successful
successful
6.4.3 Business sub-sector
The majority of the SME respondents indicated that their businesses were in the clothing or
apparel sub-sector. Thus the focus of the study is mainly on apparel which is one of the
easiest sub-sectors to enter for self employment in the SME sub-sector, as indicated in
Table 6.5 below:
Table 6.5: Subsector
Sector Less successful Successful Total
frequency percent frequency percent frequency percent
apparel 262 70.24% 153 77.66% 415 72.81%
other 111 29.76% 44 22.34% 155 27.19%
total 373 100.00% 197 100.00% 570 100.00%
More than 70% of the respondents in both samples were operating in the apparel subsector.
6.4.5 Regions
The samples comprised of SME owners/managers from the all the regions of Johannesburg
as indicated in table 6. More than a third (37.54%) of the SMEs samples were from the
Johannesburg city centre. This is in line with literature that indicates that the Textile and
clothing industry tends to be localised (Gibbon, 2004:157; Rogerson, 2004:127; Kamaha;
2004:430).

Research Findings 183
Table 6.6: The regions where the business operates
Less successful SMEs Successful SMEs Total Region frequency percent frequency percent frequency percent
midrand 14 3.75% 19 9.64% 33 5.79%
diepsloot 7 1.88% 0 0.00% 7 1.23%
sandton 38 10.19% 30 15.23% 68 11.93%
northcliff 6 1.61% 18 9.14% 24 4.21%
roodepoort 7 1.88% 25 12.69% 32 5.61%
soweto 54 14.48% 3 1.52% 57 10.00%
alexandra 5 1.34% 3 1.52% 8 1.40%
central 161 43.16% 53 26.90% 214 37.54%
south 22 5.90% 28 14.21% 50 8.77%
diepkloof 45 12.06% 2 1.02% 47 8.25%
orange farm 2 0.54% 4 2.03% 6 1.05%
other 12 3.22% 12 6.09% 24 4.21%
total 373 100% 197 100.00% 570 100.00%
The majority of the less successful SMEs were operating in the down town regions of
Johannesburg like Diepsloot, Soweto, Alexandra, Central, Diepkloof, Orange farm – all
labelled as downtown; while in contrast the more successful SMEs operated in up town
regions like Midrand, Sandton, Northcliff, Roodepoort and Joburg South which are labelled
as uptown. This is illustrated in Figure 6.7 below.
Figure 6.7: Regions of operations per sample
region
0.00%
10.00%
20.00%
30.00%
40.00%
50.00%
60.00%
70.00%
80.00%
less successful successful
uptown
downtown
It can therefore be stated that successful SMEs operate mainly in upmarket regions while
less successful SMEs operate in poorer regions.
Research Findings 184
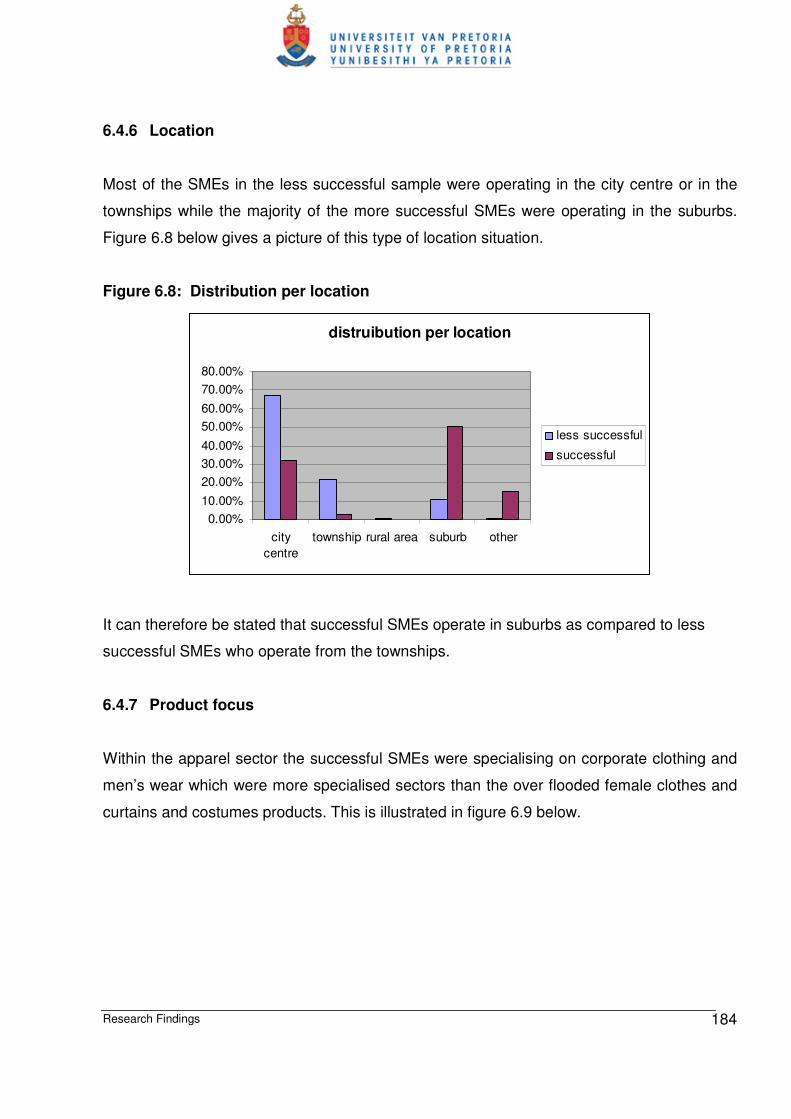
6.4.6 Location
Most of the SMEs in the less successful sample were operating in the city centre or in the
townships while the majority of the more successful SMEs were operating in the suburbs.
Figure 6.8 below gives a picture of this type of location situation.
Figure 6.8: Distribution per location
distruibution per location
0.00%
10.00%
20.00%
30.00%
40.00%
50.00%
60.00%
70.00%
80.00%
city
centre
township rural area suburb other
less successful
successful
It can therefore be stated that successful SMEs operate in suburbs as compared to less
successful SMEs who operate from the townships.
6.4.7 Product focus
Within the apparel sector the successful SMEs were specialising on corporate clothing and
men’s wear which were more specialised sectors than the over flooded female clothes and
curtains and costumes products. This is illustrated in figure 6.9 below.

Research Findings 185
Figure 6.9: Product focus per sample
product focus per sample
0.00%5.00%
10.00%15.00%20.00%25.00%30.00%35.00%40.00%
schools
fem
ale
clo
thes
beddin
g
costu
mes
finis
hin
g
male
clo
thes
child
rens c
loth
es
corp
ora
te u
nifo
rms
art a
nd c
raft
less successful
successful
It can therefore be stated that most of the products of successful SMEs are niche textile
products compared with the less successful SMEs that produce clothing that is flooding the
market.
6.4.8 Form of business
The majority of the respondents in the successful SME sample had all formally registered
their businesses with most registered as close corporations and companies (91.38%).
Figure 6.10: Forms of business per sample
form of business of the two samples
0.00%
10.00%
20.00%
30.00%
40.00%
50.00%
60.00%
not
regis
tere
d
sole
prio
prie
tor
partn
ers
hip
clo
se
corp
ora
tion
com
pany
oth
er
less successful
successful

Research Findings 186
In contrast most of the less successful SMEs (51.47%) were not formally registered and
most of those registered were registered as close corporations (32.44%).
6.5 Descriptive statistical structure
The descriptive statistical analysis findings show that the shape and spread of the data was
normal and therefore acceptable. This finding is consistent across the data set. Data
reliability and validity were further tested through factorial designs.
6.6 Validity and reliability
To confirm the validity and reliability of the measuring instruments, factor analysis was
executed. Factor analysis was carried out to further understand the data whose
characteristics were found to be normal through descriptive analysis. In addition to being
tested for normality the data was tested for reliability and validity using factorial design.
Factor analysis is used primarily for data reduction, construct development and the
investigation of variable relationships. As a narrowing device it allows the selections of
salient variables from large groups, providing simplification of dominant variables and
replacing them with isolated smaller numbers of hypothetical variants.
Factor analysis was used in this study for same reasons for data reduction, for easy usage
of data plus structure validation and reliability checks. It also assisted in classifying the
variables, developing/refining questions and ensuring meaningful results. Factorial design
was used because a number of factors are involved. The method allowed for the analysis of
independent variables and the dependant variables in this study. This helped to save
money, time and resources. This study is multidimensional and so it is reasonable to study
the several dimensions and their relationships simultaneously, instead of studying one
variable at a time. The factorial design was used to measure whether there was any
significant difference between successful and less successful businesses in terms of
competency in their skills and whether they considered the same skills important for their
business success.

Research Findings 187
Factor analysis was done on variables from the two main investigation questions namely
question 15 and 16. The variables were sorted and rotated to illustrate the different factors.
The values were presented from the highest to the lowest as evident in the tables below.
Factor analysis was done using BMDP Statistical Software on the items in Questions 15 and
16 for all of the respondents combined.
6.6.1 Procedure for determining factor structure
The two component instruments used in the study (namely importance of skills and
competence in skills) were both revalidated in order to determine structure and reliability.
The factor analysis procedure used included the following:
• Eigen values > 1.00 were identified. An eignenvalue is a measure of the explanation
power of factor.
• The differentiation of possible factors was identified through clear breaks in the screen
tests between eigenvalues > 1.00.
• The variables were subjected to exploratory data analysis (EDA). Where variables
loaded were found to be <0.300, they were removed and another round of exploratory
analysis carried out. EDA simplifies the goal of learning about data as much as is
possible. It provides a perspective and set tools for searching for clues and patterns.
• Rotated, unrotated and sorted factor analysis was carried out for the factors. Item
analysis was then carried out for all the factors also.
• The procedure was repeated until two stable structures emerged, namely functional
skills and enterprising skills.
• Cronbach alpha tests how well variables measure a single uni-dimensional latent
construct. The critical values of alpha coefficients range from 0 to 1 and are used to
describe the reliability (accuracy) of the factors extracted from dichotomous and or multi-
point formatted questionnaires. Content analyses typically report a minimum reliability
co-efficient of around 0.6. (Cooper & Schindler, 2008:293). The higher the alpha the
more reliable the test. Cronbach alpha was used because it has the most utility for multi-
item scales at interval level measurement.

Research Findings 188
6.6.2 Factor analysis – on the importance of skills
The rotated factor analysis of the respondents’ views of the importance of various skills set
are illustrated in Table 6.7 below:
Table 6.7: Rotated factor analysis - perception on the importance of skills
Loadings Description of the variables
Factor 1: functional skills Factor 2: enterprising skills
Business systems, 0.783 -0.173
Business linkages 0.675 0.051
Communication 0.629 0.197
Computer literacy 0.776 -0.131
Opportunity alertness 0.172 0.396
Financial 0.730 -0.079
Human Resource 0.616 0.313
Legal 0.741 -0.110
Life skills 0.466 0.178
Literacy 0.515 -0.090
Operations 0.545 0.050
Role Models -0.161 0.563
Resources 0.515 0.022
Motivation 0.045 0.300
Planning 0.640 0.222
Value chain 0.786 -0.169
Technical 0.567 0.193
Percentage variance 35.91% 5.03%
Cronbach’s alpha 0.9028 0.4308
Eigenvalue 6.63691 1.55465
The three variables marketing, risk taking and research & development were omitted since
they had high double loadings and thus were not included in the statistical tests that analyse
the factors.

Research Findings 189
Factors on importance
There were two factors which were given the following labels:
• Factor 1 was labelled “functional skills”. This includes business systems, business
linkages, communication, computer literacy, financial management, human resources,
legal, life skills, literacy, operations, securing resources, planning, value chain and
technical abilities.
• Factor 2 was labelled “enterprising skills”. This includes creativity, innovation, opportunity
identification, role models and motivation.
These factors are in line with the basis of a theoretical framework.
Eigenvalues
The eigenvalues of 6.63691 for functional skills and 1.55465 for the enterprising skills are
greater than 1.00 which shows that both factors are relevant, good and reliable and should
therefore be analysed.
Cronbach alphas
The Cronbach Alpha coefficient - using SAS was determined for the items in each factor.
Cronbach’s Alpha is regarded as one of the most important reliability estimates. It measures
internal consistency and the degree to which instrument items are homogeneous and reflect
the same underlying construct(s). The acceptable threshold of Cronbach alphas ranges
from 0.600 to 0.999 and indicates reliability (Athadye, 2003:10; Cooper & Schindler
2001:216-217). The Cronbach Alpha value of 0.8854 was obtained for all the variables used
with individual Cronbach alphas as follows:
Table 6.8: Cronbach alpha results - importance of skills
Factor Description Cronbach Alpha value
factor 1 functional skills 0.9103
factor 2 enterprising skills 0.4308
The Cronbach Alpha for factor 1 was acceptable at 0.9103 which indicated that the
instrument actually measured the concepts aimed to be measured and signified
Research Findings 190
consistence. On the other hand the Cronbach Alpha for factor 2 was not acceptable as it
was very low at 0.4308. Low Cronbach alphas and eigenvalue < 1 indicate low validity and
reliability of the factor. Normally such a factor would be excluded in a research study.
The researcher decided to include the second factor and accepted the low Cronbach alpha
because the second factor items were similar to the enterprising skills category that was
identified in the literature review. The inclusion of the second factor is in line with Davis
(2000:484) who argues that the researcher should have some idea of underlying patterns in
the data before analysis begins and use the factors that come out closely as the researcher
envisages. In the literature review the researcher identified three main skills constructs,
namely:
• Technical abilities. These abilities ensure that the product and or service is differentiated
and produced at acceptable quality.
• Functional capabilities. These abilities assist the entrepreneur balances between
opportunity, resources and the entrepreneurial team. This included all the skills in
business management categories.
• Enterprising abilities. These abilities are linked with entrepreneurial competencies
responsible for the booster/energizer/enterprising functions. This included motivation
and skills in the entrepreneurial competencies identified.
As in the Nieman & van Vuuren (1999) model, the technical skills are included in the
business skills construct that the study calls the functional skills. So it is acceptable to this
study that instead of three factors, the results gave us only two with the technical skills being
in the functional construct.
Furthermore, as factors are created by obtaining the mean scores over all the questions in
the item; this low score may be due to the small number of variables (Kim & Mueller
1987:78). Factor 2 has only 3 variables as opposed to 16 variables in factor 1. This may
also have been an error due to the categorising of innovation, opportunity identification and
creativity into one skill category instead of three.
Research Findings 191
It may also be because there is low consistency in the understanding of the meaning of the
constructs of the enterprising skills. Visser (2002:195) points out that the alphas are low if
the respondents don’t see the skills constructs in the same way or the questions don’t
measure the same thing for the different respondents. Thus the respondents don’t give
consistent answers.
Furthermore the nature of the variables could have contributed to this low alpha result.
People’s perception of all the skills in the list is very close and may be difficult to differentiate
between the constructs thus leading to low factor scores.
Also it was noted that the second factor had all the variables that are not normally labelled
as business skills. These correspond to variables such as motivation, creativity, innovation
and opportunity identification to which most respondents are not exposed and whose level
of competency is not being developed whether they had gone through the training or not.
The researcher decided to go ahead with the analysis of the data collected because the
purpose of this study is aimed at dissecting the skills construct into two or more skills
constructs to identify the differences in terms of competence in the various skills categories.
Thus in essence this study is attempting to separate something that is essentially the same
thing. It is therefore acceptable to continue with the analysis especially in lieu of the fact that
the factors were consistent with the constructs identified in theory. It is acknowledged that
there may be problems in tests that are dependant on the factor reliability therefore a chi
squared analysis will also be done on each of the items in the factors.
Factor correlations for rotated factors
The correlation between the two factors was investigated. Factor correlations for rotated
factors are reported in table 6.9 below.
Research Findings 192
Table 6.9: Factor correlation for rotated factors on importance
Factor Factor 1 Factor 2
1 – functional skills 1.000
2 – enterprising skills 0.211 1.000
The correlation between factors one and two are not high so the structure is stable enough
for them to be used as separate factors.
Factor score covariance
Table 6.10: Factor score covariance on importance
Factor Factor 1 Factor 2
1 – functional skills 0.924
2 – enterprising skills 0.208 0.606
These factors were created along the basis of a theoretical framework. Each factor was
subjected to an item analysis as part of establishing internal reliability.
Item analysis
Item analysis was done with Cronbach alphas calculated for each factor, to establish the
internal reliability. Each item’s contribution to that alpha is shown indicating what the alpha
of the factor will be if that question is left out of the factor. If the alpha increases by a large
margin, when leaving out the question, to the discretion of the researcher, it is decided to
leave that question out of further analysis.
Item analysis for factor 1 is illustrated in table 6.16 below (total 13 items):
Table 6.11: Item analysis for factor 1 on importance
Skills variables Alpha if item is deleted
Business systems 0.9011
Business linkages 0.9028
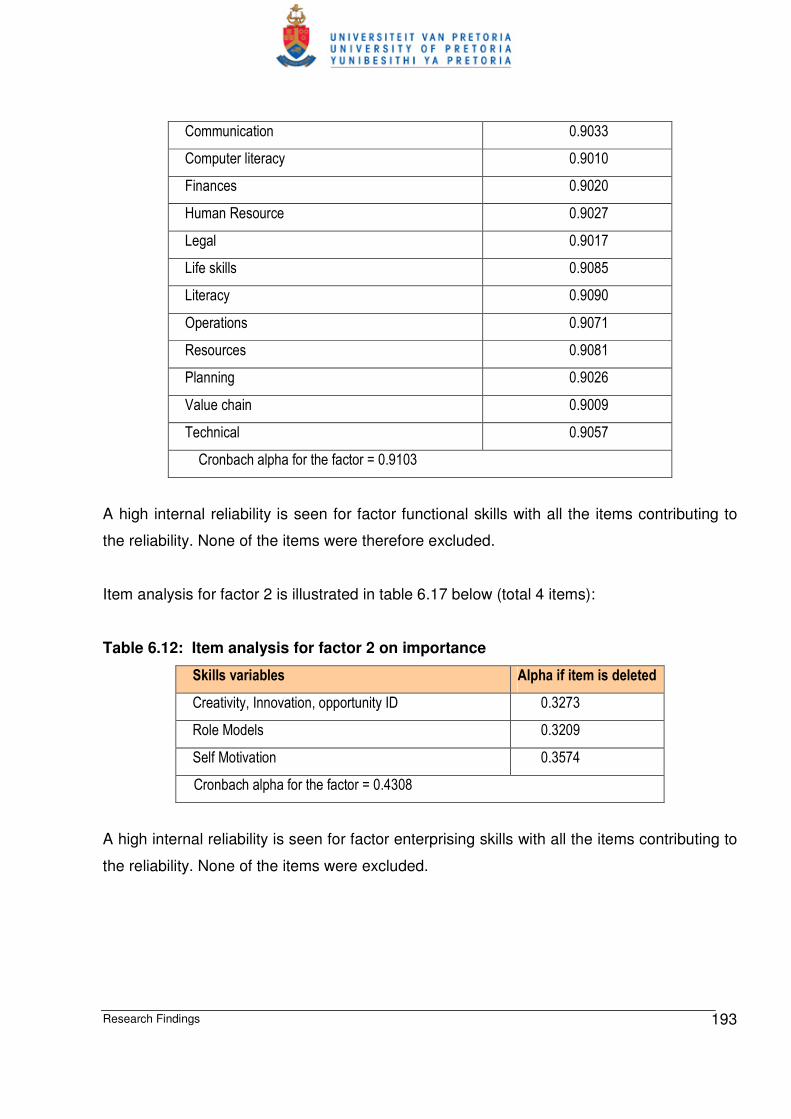
Research Findings 193
Communication 0.9033
Computer literacy 0.9010
Finances 0.9020
Human Resource 0.9027
Legal 0.9017
Life skills 0.9085
Literacy 0.9090
Operations 0.9071
Resources 0.9081
Planning 0.9026
Value chain 0.9009
Technical 0.9057
Cronbach alpha for the factor = 0.9103
A high internal reliability is seen for factor functional skills with all the items contributing to
the reliability. None of the items were therefore excluded.
Item analysis for factor 2 is illustrated in table 6.17 below (total 4 items):
Table 6.12: Item analysis for factor 2 on importance
Skills variables Alpha if item is deleted
Creativity, Innovation, opportunity ID 0.3273
Role Models 0.3209
Self Motivation 0.3574
Cronbach alpha for the factor = 0.4308
A high internal reliability is seen for factor enterprising skills with all the items contributing to
the reliability. None of the items were excluded.

Research Findings 194
6.6.3 Factor analysis – on competence in these skills
The rotated factor analysis of the respondents views of their competence in various skills set
are as follows:
Table 6.13: Rotated factor analysis - respondents rating their competence
Skills variables Factor 1: functional skills Factor 2: enterprising skills
Business systems 0.885 -0.201
Business linkages 0.749 -0.021
Communication 0.742 0.067
Computer literacy 0.549 0.272
Opportunity alertness 0.111 0.341
Financial 0.822 -0.172
Human Resource 0.648 0.296
Legal 0.643 0.093
Life skills 0.540 -0.034
Literacy 0.514 -0.034
Operations 0.668 -0.030
Role Models -0.136 0.513
Resources -0.078 0.675
Motivation, 0.101 0.301
Planning 0.639 0.303
Value chain 0.747 -0.104
Technical 0.502 0.386
Percentage variance 37.06% 7.37%
Cronbach’s alpha 0.8909 0.6011
Eigenvalue 6.78645 1.92688
Factors on competence
There are two factors which were given the following labels:
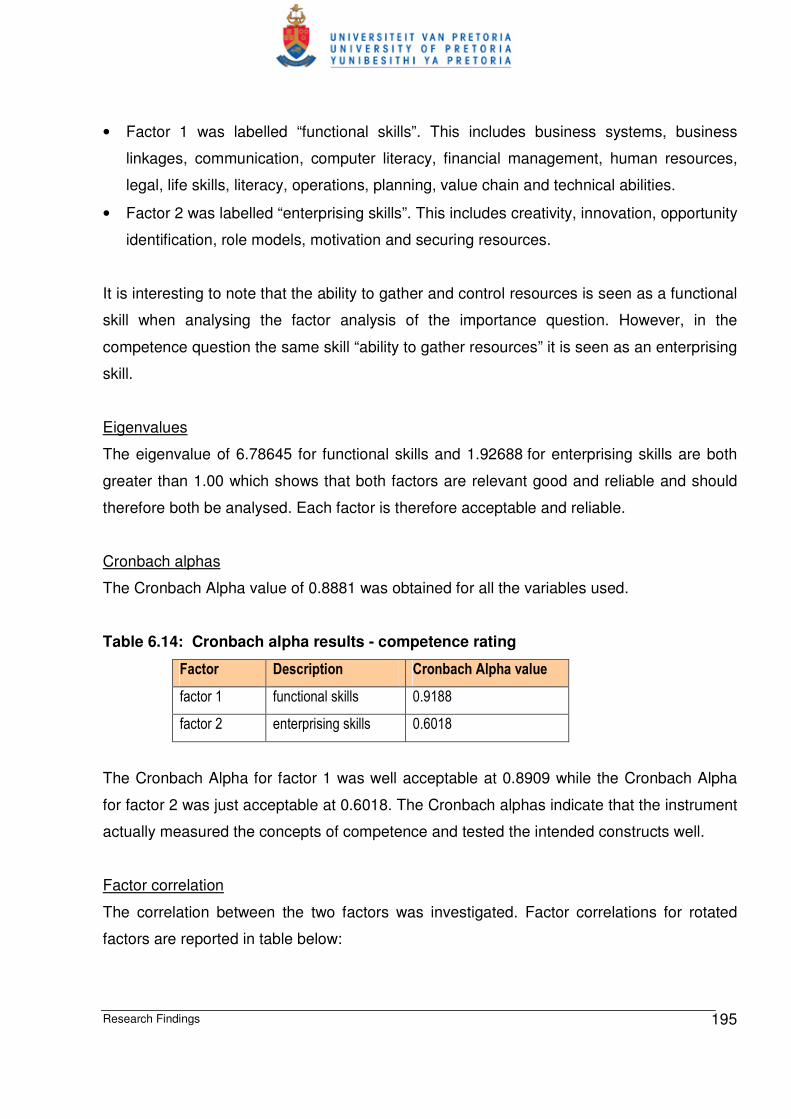
Research Findings 195
• Factor 1 was labelled “functional skills”. This includes business systems, business
linkages, communication, computer literacy, financial management, human resources,
legal, life skills, literacy, operations, planning, value chain and technical abilities.
• Factor 2 was labelled “enterprising skills”. This includes creativity, innovation, opportunity
identification, role models, motivation and securing resources.
It is interesting to note that the ability to gather and control resources is seen as a functional
skill when analysing the factor analysis of the importance question. However, in the
competence question the same skill “ability to gather resources” it is seen as an enterprising
skill.
Eigenvalues
The eigenvalue of 6.78645 for functional skills and 1.92688 for enterprising skills are both
greater than 1.00 which shows that both factors are relevant good and reliable and should
therefore both be analysed. Each factor is therefore acceptable and reliable.
Cronbach alphas
The Cronbach Alpha value of 0.8881 was obtained for all the variables used.
Table 6.14: Cronbach alpha results - competence rating
Factor Description Cronbach Alpha value
factor 1 functional skills 0.9188
factor 2 enterprising skills 0.6018
The Cronbach Alpha for factor 1 was well acceptable at 0.8909 while the Cronbach Alpha
for factor 2 was just acceptable at 0.6018. The Cronbach alphas indicate that the instrument
actually measured the concepts of competence and tested the intended constructs well.
Factor correlation
The correlation between the two factors was investigated. Factor correlations for rotated
factors are reported in table below:

Research Findings 196
Table 6.15: Factor correlation for rotated factors on competence
Factor Factor 1 Factor 2
1 – functional skills 1.000
2 – enterprising skills 0.253 1.000
The correlation between factors one and two are not high so the structure is stable enough
for them to be used as separate factors.
Factor score covariance
Table 6.16: Factor score covariance on competence
Factor Factor 1 Factor 2
1 – functional skills 0.934
2 – enterprising skills 0.256 0.724
Item analysis
Item analysis was done with Cronbach alpha calculated for each factor to establish the
internal reliability. Each items contribution to that alpha is shown in Table 6.17 indicating
what the alpha of the factor will be if that question is left out of the factor. If the alpha
increases by a large margin when leaving out the question, to the discretion of the
researcher, it implies leaving that question out of further analysis.
Item analysis for factor 1 is illustrated below (total 13 items):
Table 6.17: Item analysis for factor 1 on competence
Skills variables Alpha if item is deleted
Business systems 0.9081
Business linkages 0.9112
Communication 0.9100
Computer literacy 0.9145
Financial Management 0.9099
Human Resource 0.9099

Research Findings 197
Legal 0.9128
Life skills 0.9178
Literacy and Numeracy 0.9189
Operations 0.9132
Strategy & planning 0.9109
Value chain skills 0.9113
Technical/vocational ability 0.9145
Cronbach alpha for the factor = 0.9188
A high internal reliability is seen for factor functional skills with all the items contributing to
the reliability. So none of the items were excluded.
Item analysis for factor 2 is illustrated below (total 4 items):
Table 6.18: Item analysis for factor 2 on competence
Skills variables Alpha if item is deleted
Opportunity alertness 0.5282
Role Models 0.5161
Securing resources 0.5350
Motivation 0.5037
Cronbach alpha for the factor = 0.6018
Internal reliability is seen for factor enterprising skills with all the items contributing to the
reliability. So none of the items were excluded as they all contribute well to the overall alpha.
6.6.4 Testing the statistical and substantive significance
Since any sample will almost certainly vary somewhat from its population, it must be judged
whether these differences are statistically significant or insignificant (Cooper & Schindler,
2001:486).

Research Findings 198
Various statistical tests were employed in the analysis between the dependant variable,
success and the independent variables linked with functional and enterprising skills. The
following measures were conducted to compare successful and less successful SMEs in
terms of how they rated the importance of certain skills set to their business success; how
they rated themselves in terms of competence in that skills and; if they had been trained in
that particular skill.
First chi-square tests were computed using SAS for association with the "success" variable.
Secondly the t-tests for independent samples were carried out using all the factors that were
identified in the factor analysis. Student's t-test was used to compare mean factor scores for
successful and less successful groups as well as for comparing courses attended for
successful and less successful groups. The BMDP statistical software (BMDP3D – T-tests)
was used in performing the multivariate statistical tests.
Third, one-way ANOVA tests were conducted using SAS to compare the mean factor scores
of demographic groups for the successful and less successful respondents separately.
Finally a Scheffe’s multiple comparison procedure was conducted.
6.6.5 The chi-square test
The chi-square test for association was performed to indicate the significant differences
between the successful and the less successful groups concerning their opinions about the
importance of certain business skills towards success, their competence in those skills and
the training. The test used the 95% confidence level meaning that the p value must be lower
than 0.05.
The chi-square test is a non parametric test of significance used for nominal measurements.
The chi-square is presented to indicate the nominal variables with significant differences.
Any appropriately performed test of statistical significance indicates the degree of
confidence one can have in accepting or rejecting a proposition. Typically the propositions
tested with chi-square was whether or not two different samples were different enough in

Research Findings 199
some characteristic or aspect of their behaviour to allow for the generalisation that the
population from which the sample was drawn was also different in behaviour and
characteristic. The chi-square is a rough estimate of confidence; it accepts weaker, less
accurate data as input than parametric tests and therefore has less status in the pantheon
of statistical tests. Because it is more forgiving it can be used in a wide variety of research
contexts.
a) Importance
There were significant differences between the successful and less successful SMEs in
terms of how they consider the importance of the skills with p < 0.05 for all the skills
categories as illustrated below:
Table 6.19: Significant differences between the SMEs on importance
Successful group Less successful group
Skills variables Not
NB
Just
NB
Very
NB Not NB
Just
NB Very NB
Chi-square
value P value
Business
systems 3.05 44.67 52.28
24.13 34.32 41.55 40.9482 <0.0001
Business
linkages 8.63 44.16 47.21
32.71 42.36 24.93 50.3438 <0.0001
Communication 3.05 48.22 48.73 23.59 49.06 27.35 49.9923 <0.0001
Computer literacy 9.14 30.46 60.41 31.64 30.56 37.80 41.79 <0.0001
Opportunity ID 4.06 48.73 47.21 10.72 39.95 49.33 9.2301 0.0099
Finances 4.06 30.96 64.97 17.43 29.49 53.08 21.2617 <0.0001
Human Resource 11.17 65.48 23.35 52.82 34.32 12.87 94.5579 <0.0001
Legal 11.17 37.06 51.78 11.53 32.71 55.76 24.2332 <0.0001
Life skills 5.58 68.02 26.40 21.98 53.98 24.13 25.8986 <0.0001
Literacy 1.02 46.70 52.28 28.42 31.37 40.21 25.0563 <0.0001
Marketing 3.05 39.59 57.36 11.26 35.66 53.08 11.3016 0.0035
Operations 4.06 31.47 64.47 11.53 34.05 54.42 10.538 0.0051
Research 27.92 52.28 19.80 59.79 26.54 13.67 54.0098 <0.0001
Risk Taking 47.72 43.15 9.14 39.41 41.29 19.30 10.6474 0.0049

Research Findings 200
Role Models 41.12 46.70 12.18 42.36 29.76 27.88 24.586 <0.0001
Resources 4.06 28.43 67.51 13.67 30.63 55.50 14.876 0.0006
Motivation 2.54 26.9 70.56 5.9 34.58 59.52 7.9358 0.0189
Planning 12.18 45.18 42.64 35.12 37.80 27.08 36.3002 <0.0001
Value chain skills 6.6 43.65 49.75 23.59 30.03 46.38 28.2093 <0.0001
Technical 21.32 52.28 26.40 44.50 28.69 26.81 38.4822 <0.0001
Confidence interval: 95% α= 0.05
Proposition 3.1: Successful SMEs are not likely to consider technical skills to be more
important than less successful SMEs. Proposition 3.1 is therefore rejected.
Proposition 4.1 to 4.4: Successful SMEs are not likely to consider the following personal
skills to be more important than less successful SMEs:
• Proposition 4.1: Motivation skills – rejected.
• Proposition 4.2: Life skills - rejected.
• Proposition 4.3: Literacy skills – rejected.
• Proposition 4.4: Communication – rejected.
Proposition 10.1 to 10.4: Successful SMEs are not likely to consider the following
entrepreneurial skills to be more important than less successful SMEs:
• Proposition 10.1: Opportunity identification, creativity and innovation – rejected.
• Proposition 10.2: Risk taking – rejected.
• Proposition 10.3: Role models – rejected.
• Proposition 10.4: Securing and controlling resources – rejected.
Proposition 7.1 to 7.11: Successful SMEs are not likely to consider the following business
skills to be more important for business success that less successful SMEs:
• Proposition 7.1: Business systems – rejected.
• Proposition 7.2: Business linkages – rejected.
• Proposition 7.3: Computer literacy – rejected.
• Proposition 7.4: Financial – rejected.
• Proposition 7.5: Human resource – rejected.

Research Findings 201
• Proposition 7.6: Legal – rejected.
• Proposition 7.7: Marketing – rejected.
• Proposition 7.8: Operations – rejected.
• Proposition 7.9: Research – rejected.
• Proposition 7.10: Planning – rejected.
• Proposition 7.11: Supplier management – rejected.
The majority (between 47.21% and 67.51%) of the successful SMEs considered 9 of the 20
skills categories to be extremely important (marked blue). The 9 categories considered
extremely important to successful SMEs are business systems, business linkages,
communication, computer literacy, financial management, legal, literacy, value chain and
securing resources. In contrast the majority (larger than 50%) of the less successful SMEs
considered only 6 of the 9 skills to be extremely important namely business systems,
computer literacy, legal, securing resources, value chain skills and financial management,
while another large number (between 39.95% and 53.98%) considered the other two skills
namely communication and business linkages to be just important.
The large number of the successful SMEs (between 45.18% and 68.02%) considered
another 6 skills to be just important (marked in green). These are planning, technical,
human resource, life skills, research and role models. In contrast a large majority of the less
successful SMEs considered 4 of these 6 skills not important. These four are technical,
human resource, research and role models. The other two namely planning and life skills
are also considered to be just important by the less successful SMEs.
There was less indication of significant differences between the two groups in terms of the 5
remaining skills categories namely opportunity alertness, marketing, operations, risk taking
and self motivation. Most successful SMEs (48.73%) considered opportunity alertness skills
to be just important while more of the less successful SMEs (49.33%) considered
opportunity alertness to be very important but there was some significant difference as p <
0.05. Most of both successful and less successful SMEs considered risk taking to be just
important for business success. Most of both successful and less successful SMEs
considered marketing and operations skills to be just important for business success.

Research Findings 202
This result does imply that more successful SMEs are likely to consider skills more
important that the less successful SMEs consider them. This finding is expected,
considering that for a business to succeed the SMEs requires certain competencies to
function in all areas related to the entrepreneurial trade (Nieman et al, 2003:7).
Competence
There was significant difference (p < 0.0001) between how the successful SMEs and those
that are less successful rate themselves in terms of competence in all 19 categories of skills
except the risk management where p = 0.1807 which is > 0.05 as illustrated below:
Table 6.20: Significant differences between the SMEs on competence
Successful group Less successful group Skills variables
not just very not just very
Chi-square
value P value
Business systems 2.03 62.44 35.53 41.94 37.90 20.16 101.5864 <0.0001
Business linkages 9.64 70.05 20.30 51.61 37.10 11.29 97.2709 <0.0001
Communication 5.58 73.60 20.81 43.01 43.01 13.98 86.2005 <0.0001
Computer literacy 8.63 47.21 44.16 71.51 15.05 13.44 203.7124 <0.0001
Opportunity ID 4.06 64.97 30.96 20.43 46.51 33.06 31.8574 <0.0001
Financial 3.05 46.70 50.25 42.20 32.80 25.00 99.9041 <0.0001
Human Resource 10.66 78.68 10.66 66.94 26.88 6.18 166.405 <0.0001
Legal 20.81 28.07 51.12 61.29 22.04 16.67 87.2649 <0.0001
Life skills 8.12 65.99 25.89 27.96 57.80 14.25 35.0022 <0.0001
Literacy 2.54 50.76 46.70 13.71 48.66 37.63 19.0444 <0.0001
Marketing 3.05 45.69 51.27 22.85 40.59 36.56 39.0636 <0.0001
Operations 1.52 39.59 58.88 23.12 39.52 37.37 51.7076 <0.0001
Research 42.13 47.72 10.15 73.39 20.43 6.18 54.8892 <0.0001
Risk Taking 55.33 38.58 6.09 50.27 39.25 10.48 3.4214 0.1807
Role Models 40.10 50.76 9.14 47.58 30.38 22.04 28.1051 <0.0001
Resources 40.10 24.87 35.03 55.91 29.84 14.25 33.4473 <0.0001
Motivation 2.03 26.9 71.07 8.06 43.55 48.39 29.0701 <0.0001
Planning 15.23 48.73 36.04 47.58 39.78 12.37 75.0038 <0.0001
Research Findings 203
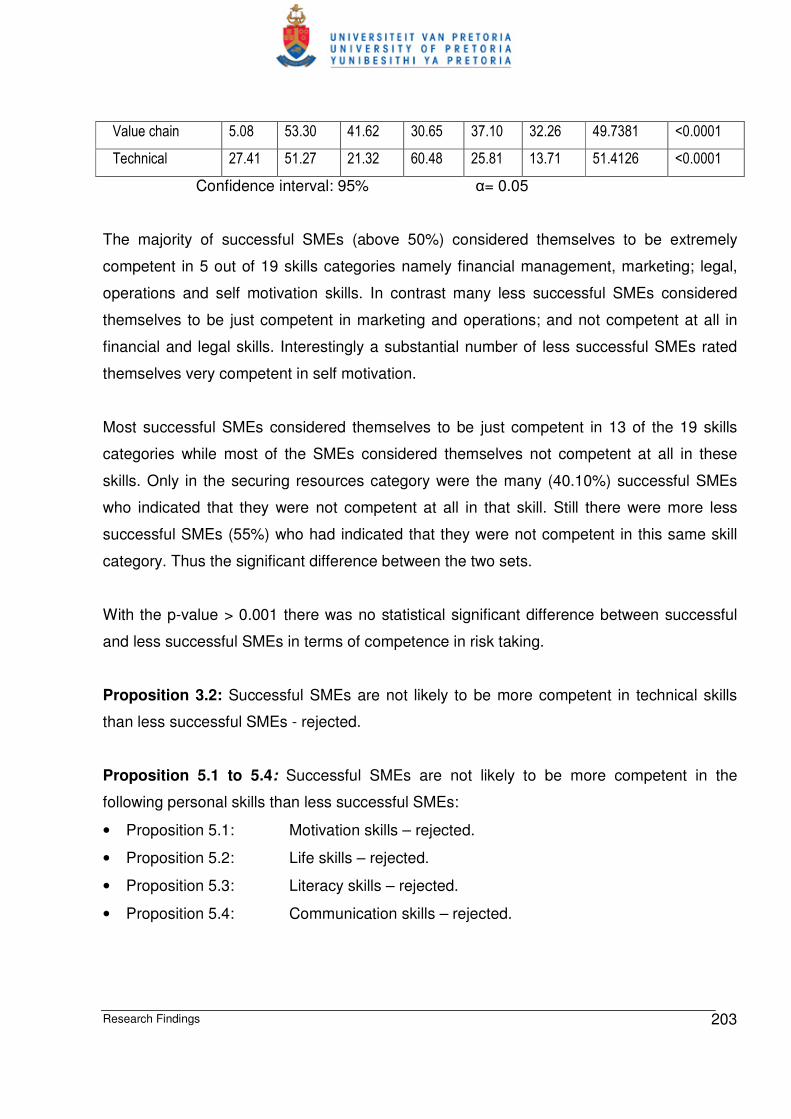
Value chain 5.08 53.30 41.62 30.65 37.10 32.26 49.7381 <0.0001
Technical 27.41 51.27 21.32 60.48 25.81 13.71 51.4126 <0.0001
Confidence interval: 95% α= 0.05
The majority of successful SMEs (above 50%) considered themselves to be extremely
competent in 5 out of 19 skills categories namely financial management, marketing; legal,
operations and self motivation skills. In contrast many less successful SMEs considered
themselves to be just competent in marketing and operations; and not competent at all in
financial and legal skills. Interestingly a substantial number of less successful SMEs rated
themselves very competent in self motivation.
Most successful SMEs considered themselves to be just competent in 13 of the 19 skills
categories while most of the SMEs considered themselves not competent at all in these
skills. Only in the securing resources category were the many (40.10%) successful SMEs
who indicated that they were not competent at all in that skill. Still there were more less
successful SMEs (55%) who had indicated that they were not competent in this same skill
category. Thus the significant difference between the two sets.
With the p-value > 0.001 there was no statistical significant difference between successful
and less successful SMEs in terms of competence in risk taking.
Proposition 3.2: Successful SMEs are not likely to be more competent in technical skills
than less successful SMEs - rejected.
Proposition 5.1 to 5.4: Successful SMEs are not likely to be more competent in the
following personal skills than less successful SMEs:
• Proposition 5.1: Motivation skills – rejected.
• Proposition 5.2: Life skills – rejected.
• Proposition 5.3: Literacy skills – rejected.
• Proposition 5.4: Communication skills – rejected.
Research Findings 204
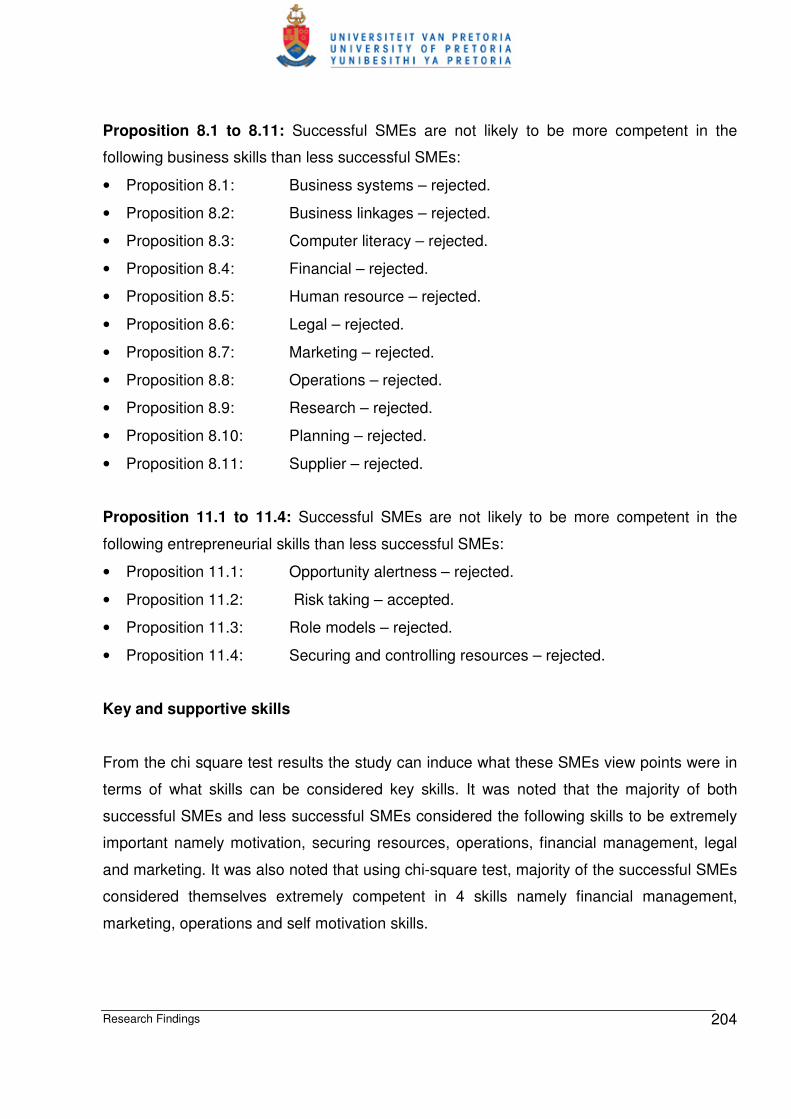
Proposition 8.1 to 8.11: Successful SMEs are not likely to be more competent in the
following business skills than less successful SMEs:
• Proposition 8.1: Business systems – rejected.
• Proposition 8.2: Business linkages – rejected.
• Proposition 8.3: Computer literacy – rejected.
• Proposition 8.4: Financial – rejected.
• Proposition 8.5: Human resource – rejected.
• Proposition 8.6: Legal – rejected.
• Proposition 8.7: Marketing – rejected.
• Proposition 8.8: Operations – rejected.
• Proposition 8.9: Research – rejected.
• Proposition 8.10: Planning – rejected.
• Proposition 8.11: Supplier – rejected.
Proposition 11.1 to 11.4: Successful SMEs are not likely to be more competent in the
following entrepreneurial skills than less successful SMEs:
• Proposition 11.1: Opportunity alertness – rejected.
• Proposition 11.2: Risk taking – accepted.
• Proposition 11.3: Role models – rejected.
• Proposition 11.4: Securing and controlling resources – rejected.
Key and supportive skills
From the chi square test results the study can induce what these SMEs view points were in
terms of what skills can be considered key skills. It was noted that the majority of both
successful SMEs and less successful SMEs considered the following skills to be extremely
important namely motivation, securing resources, operations, financial management, legal
and marketing. It was also noted that using chi-square test, majority of the successful SMEs
considered themselves extremely competent in 4 skills namely financial management,
marketing, operations and self motivation skills.

Research Findings 205
This means that be the study can acceptance or reject the propositions on key skills and
supporting skills. In terms of importance 4 (finance, marketing, self motivation and securing
resources) of the 7 propositions skills were indicated as key, while in terms of competence 3
(finance, marketing and self motivation) of the seven proposed key skills were identified.
This implies that while human resources, opportunity identification and technical skills were
not extremely important and so could be said to be important supporting skills. This finding
also implies that operations and legal skills were wrongly identified as supporting but should
be categorised as key or extremely important. Interestingly, only few of the successful SMEs
considered themselves to be extremely competent in the securing of resources skill
category that was considered by both groups as extremely important.
Propositions 1: The following skills are not likely to be considered to be key skills:
• Proposition 1.1 Marketing – rejected.
• Proposition 1.2 Finance – rejected.
• Proposition 1.3 Human resource – accepted.
• Proposition 1.4 Motivation – rejected.
• Proposition 1.5 Gathering of resources – rejected.
• Proposition 1.6 Opportunity identification – accepted.
• Proposition 1.7 Technical – accepted.
Propositions 2: The following skills are not likely to be considered to be supportive skills:
• Proposition 2.1 Life skills – rejected.
• Proposition 2.2 Literacy skills – rejected.
• Proposition 2.3 Communication – rejected.
• Proposition 2.4 Business systems – rejected.
• Proposition 2.5 Business linkages – rejected.
• Proposition 2.6 Computer literacy – rejected.
• Proposition 2.7 Legal – accepted.
• Proposition 2.8 Operations management – accepted.
• Proposition 2.9 Research and development – rejected.
• Proposition 2.10 Strategy and business planning – rejected.
Research Findings 206
• Proposition 2.11 Supplier management – rejected.
• Proposition 2.12 Risk taking – rejected.
• Proposition 2.13 Role models – rejected.
Training
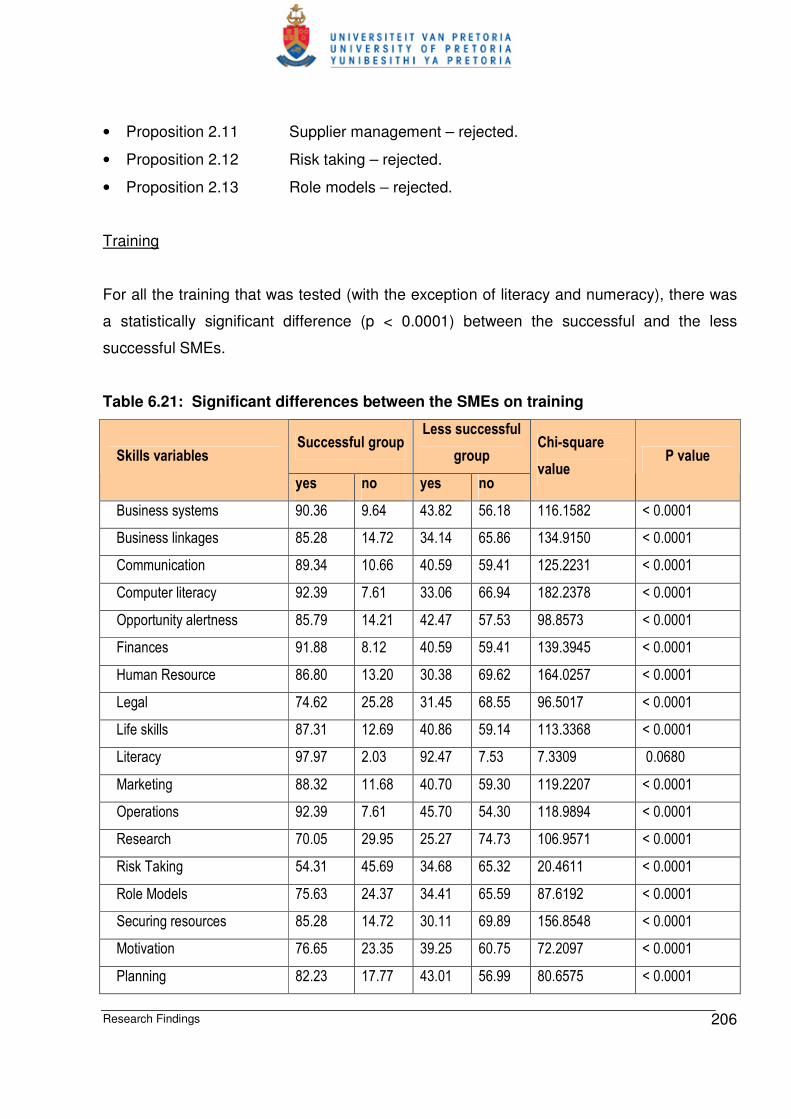
For all the training that was tested (with the exception of literacy and numeracy), there was
a statistically significant difference (p < 0.0001) between the successful and the less
successful SMEs.
Table 6.21: Significant differences between the SMEs on training
Successful group Less successful
group Skills variables
yes no yes no
Chi-square
value P value
Business systems 90.36 9.64 43.82 56.18 116.1582 < 0.0001
Business linkages 85.28 14.72 34.14 65.86 134.9150 < 0.0001
Communication 89.34 10.66 40.59 59.41 125.2231 < 0.0001
Computer literacy 92.39 7.61 33.06 66.94 182.2378 < 0.0001
Opportunity alertness 85.79 14.21 42.47 57.53 98.8573 < 0.0001
Finances 91.88 8.12 40.59 59.41 139.3945 < 0.0001
Human Resource 86.80 13.20 30.38 69.62 164.0257 < 0.0001
Legal 74.62 25.28 31.45 68.55 96.5017 < 0.0001
Life skills 87.31 12.69 40.86 59.14 113.3368 < 0.0001
Literacy 97.97 2.03 92.47 7.53 7.3309 0.0680
Marketing 88.32 11.68 40.70 59.30 119.2207 < 0.0001
Operations 92.39 7.61 45.70 54.30 118.9894 < 0.0001
Research 70.05 29.95 25.27 74.73 106.9571 < 0.0001
Risk Taking 54.31 45.69 34.68 65.32 20.4611 < 0.0001
Role Models 75.63 24.37 34.41 65.59 87.6192 < 0.0001
Securing resources 85.28 14.72 30.11 69.89 156.8548 < 0.0001
Motivation 76.65 23.35 39.25 60.75 72.2097 < 0.0001
Planning 82.23 17.77 43.01 56.99 80.6575 < 0.0001
Research Findings 207
Value chain skills 89.23 10.66 36.56 63.44 144.8733 < 0.0001
Technical 81.73 18.27 39.52 60.48 92.4179 < 0.0001
Confidence interval: 95% α= 0.05
Therefore the study can accept the proposition that successful SMEs are more likely to have
received training than less successful SMEs.
Proposition 3.3: Successful SMEs are less likely to have been trained in technical skills
than less successful SMEs – rejected.
Proposition 6.1 to 6.4: Successful SMEs are less likely to have been trained in the
following personal skills than less successful SMEs:
• Proposition 6.1: Motivation skills – rejected.
• Proposition 6.2: Life skills – rejected.
• Proposition 6.3: Literacy – accepted.
• Proposition 6.4: Communication – rejected.
Proposition 9.1 to 9.11: Successful SMEs are less likely to have been trained in the
following business skills than less successful SMEs:
• Proposition 9.1: Business systems – rejected.
• Proposition 9.2: Business linkages – rejected.
• Proposition 9.3: Computer literacy – rejected.
• Proposition 9.4: Financial management – rejected.
• Proposition 9.5: Human resource management – rejected.
• Proposition 9.6: Legal – rejected.
• Proposition 9.7: Marketing – rejected.
• Proposition 9.8: Operations management – rejected.
• Proposition 9.9: Research and development – rejected.
• Proposition 9.10: Strategy and business planning – rejected.
• Proposition 9.11: Supplier management – rejected.

Research Findings 208
Proposition 12.1 to 12.4: Successful SMEs are less likely to have been trained in the
following entrepreneurial skills than less successful SMEs:
• Proposition 12.1: Opportunity identification, creativity and innovation – rejected.
• Proposition 12.2: Risk taking – rejected.
• Proposition 12.3: Role models – rejected.
• Proposition 12.4: Securing and controlling resources – rejected.
In each skills category, at least 70.05% to 97.97% of the respondents in the successful
sample indicated that they had been trained in that skill category. This is in contrast with the
figures of between 34 and 45% of the less successful respondents who had been trained in
the said skills categories (meaning between 56% and 74% of the respondents in the less
successful sample indicating that they have not been trained in those skills categories). Risk
was the only one skill set where only 54% of the successful respondents had indicated
being trained in this category.
There was no significant difference between the two samples in respect of training in literacy
and numeracy. Data shows that both the successful and the less successful SMEs were
both trained in this skill factor.
These results imply that more successful SMEs have received training in more skills
categories than the less successful SMEs. This finding is expected, as skills that help an
SME run its business towards success are trainable. This implies that successful SMEs
prepare well for their enterprise endeavours by continually improving their human resource
skills. What was a surprising result is that the successful SMEs were as trained as less
successful SMEs in enterprising skills.
This is contrary to many studies that show that while most SMEs are exposed to business
and technical skills training, the majority of these SMEs are not exposed to entrepreneurial
and personal skills training. On closer observation, though it seems that the average of the
respondents who indicated that they had been trained in technical and business skills is
above 80% (except for legal and research which are around 70%) while for the
Research Findings 209
entrepreneurial skills it is between 50 and 79%, with the exception of creativity which
reflects more than 80%.
These results necessitated other tests to probe further these initial results from the chi-
square.
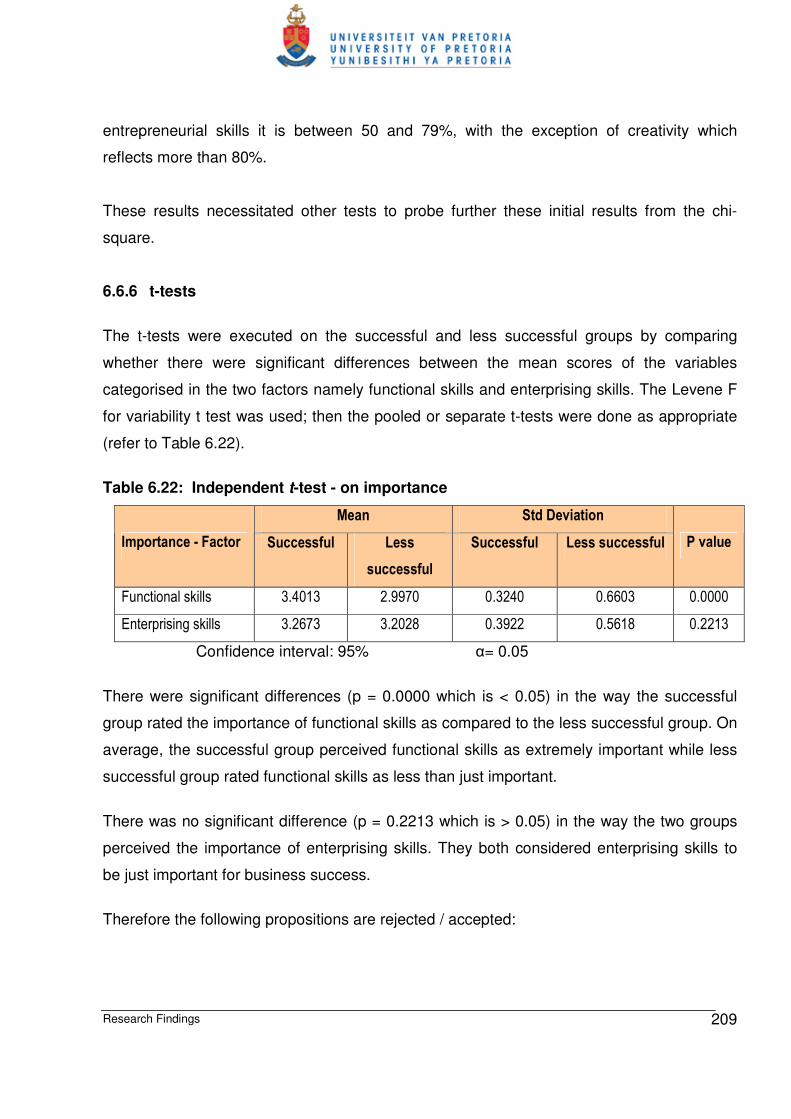
6.6.6 t-tests
The t-tests were executed on the successful and less successful groups by comparing
whether there were significant differences between the mean scores of the variables
categorised in the two factors namely functional skills and enterprising skills. The Levene F
for variability t test was used; then the pooled or separate t-tests were done as appropriate
(refer to Table 6.22).
Table 6.22: Independent t-test - on importance
Mean Std Deviation
Importance - Factor Successful Less
successful
Successful Less successful P value
Functional skills 3.4013 2.9970 0.3240 0.6603 0.0000
Enterprising skills 3.2673 3.2028 0.3922 0.5618 0.2213
Confidence interval: 95% α= 0.05
There were significant differences (p = 0.0000 which is < 0.05) in the way the successful
group rated the importance of functional skills as compared to the less successful group. On
average, the successful group perceived functional skills as extremely important while less
successful group rated functional skills as less than just important.
There was no significant difference (p = 0.2213 which is > 0.05) in the way the two groups
perceived the importance of enterprising skills. They both considered enterprising skills to
be just important for business success.
Therefore the following propositions are rejected / accepted:

Research Findings 210
Proposition 3: Successful SMEs are not likely to consider technical skills to be more
important for business than less successful SMEs - rejected.
Proposition 4.1 to 4.4: Successful SMEs are not likely to consider the following personal
skills to be more important for business than less successful SMEs:
• Proposition 4.1: Motivation skills – accepted.
• Proposition 4.2: Life skills – rejected.
• Proposition 4.3: Literacy – rejected.
• Proposition 4.4: Communication – rejected.
Proposition 7.1 to 7.11: Successful SMEs are not likely to consider the following business
skills to be more important for business success than less successful SMEs:
• Proposition 7.1: Business systems – rejected.
• Proposition 7.2: Business linkages – rejected.
• Proposition 7.3: Computer literacy – rejected.
• Proposition 7.4: Financial management – rejected.
• Proposition 7.5: Human resource management – rejected.
• Proposition 7.6: Legal – rejected.
• Proposition 7.8: Operations management – rejected.
• Proposition 7.10: Strategy and business planning – rejected.
• Proposition 7.11: Supplier management – rejected.
Proposition 10.1 to 10.4: Successful SMEs are not likely to consider the following
entrepreneurial skills to be more important for business success than less successful SMEs:
• Proposition 10.1: Opportunity alertness – accepted.
• Proposition 10.3: Role models – accepted.
• Proposition 10.4: Securing and controlling resources – rejected.
Table 6.23: Independent t-test - on competence
Mean Std Deviation Competence Factor Successful Less
successful Successful Less
successful
P value
Functional skills 3.2475 2.5243 0.3153 0.6705 0.0000
Enterprising skills 3.1154 2.8185 0.4632 0.5985 0.0000
Confidence interval: 95%; α= 0.05

Research Findings 211
There was a significant difference (p=0.0000 which is < 0.05) in the way the successful
group perceived themselves to be competent in skills in factor 1 and factor 2 (functional and
enterprising skills). The successful group considered themselves very competent in both the
functional and enterprising skills while the less successful group considered themselves not
very competent or just competent in both skills categories. Interesting enough the
successful group considered themselves to be more competent on functional skills while the
less successful group considered themselves to be more competent in enterprising skills.
All propositions on competence are rejected as follows.
Proposition 3.2: Successful SMEs are not likely to be more competent in technical skills
than less successful SMEs. - rejected
Proposition 5.1 to 5.4: Successful SMEs are not likely to be more competent in the
following personal skills than less successful SMEs:
• Proposition 5.1: Motivation skills – rejected.
• Proposition 5.2: Life skills – rejected.
• Proposition 5.3: Literacy – rejected.
• Proposition 5.4: Communication skills – rejected.
Proposition 8.1 to 8.11: Successful SMEs are not likely to be more competent in the
following business skills than less successful SMEs:
• Proposition 8.1: Business systems – rejected.
• Proposition 8.2: Business linkages – rejected.
• Proposition 8.3: Computer literacy – rejected.
• Proposition 8.4: Financial management – rejected.
• Proposition 8.5: Human resource management – rejected.
• Proposition 8.6: Legal – rejected.
• Proposition 8.7: Marketing – rejected.
• Proposition 8.8: Operations management – rejected.
• Proposition 8.9: Research and development – rejected.
• Proposition 8.10: Strategy and business planning – rejected.
• Proposition 8.11: Supplier management – rejected.

Research Findings 212
Proposition 11.1 to 11.4: Successful SMEs are not likely to be more competent in the
following entrepreneurial skills than less successful SMEs:
• Proposition 11.1: Opportunity identification, creativity and innovation – rejected.
• Proposition 11.2: Risk taking – rejected.
• Proposition 11.3: Role models – rejected.
• Proposition 11.4: Securing and controlling resources – rejected.
This confirms the chi-square tests above.
t-tests were also executed on the successful and less successful groups by comparing the
number of different areas trained by the two groups. The Levene F for variability t test was
used; then the pooled or separate t-tests were done as appropriate.
Table 6.24: Independent t-test – on the number of courses attended
Mean Std Deviation
Successful Less
successful Successful
Less
successful
P value
16.7762 7.9677 4.4229 6.6112 0.0000
Confidence interval: 95%; α= 0.05
The variability between the samples is not equal and there is significant difference between
the samples in terms of number of areas trained. On average the successful group were
trained in at least 16 courses of the identified 20 skill categories; while the less successful
group had been trained in less than 8 of the identified 20 skills categories. This was
confirmed by the frequencies as illustrated in figure 6.11 below:
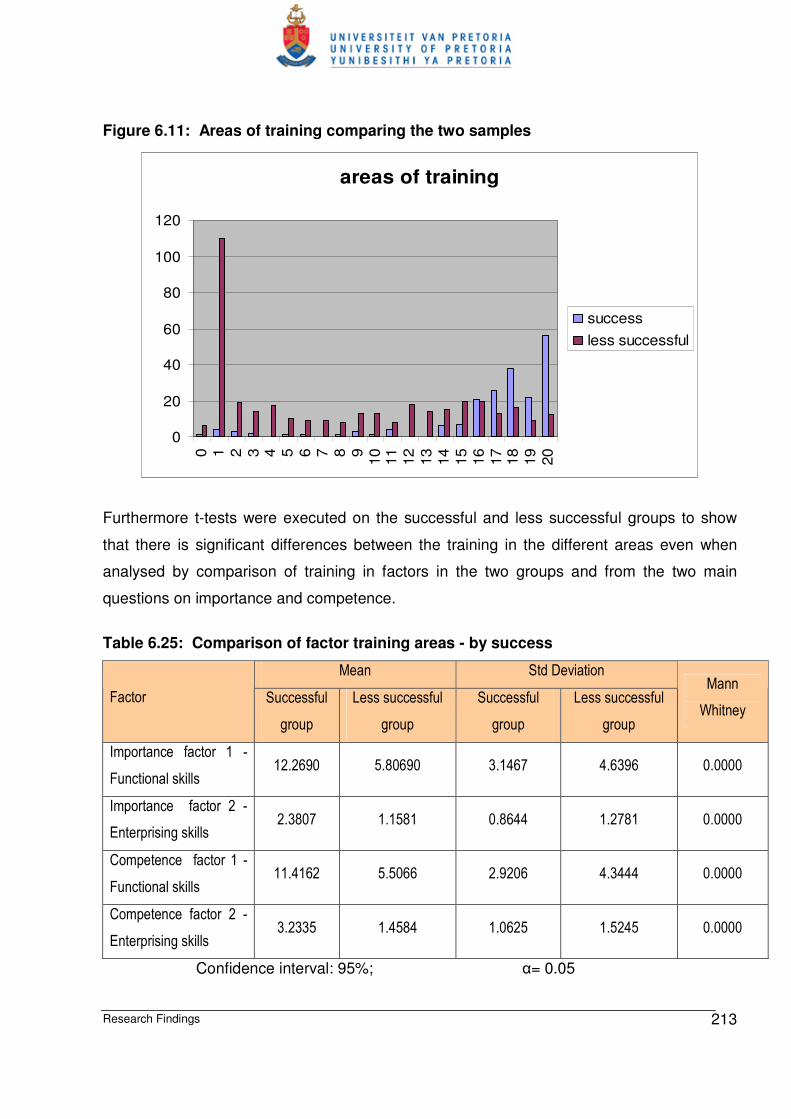
Research Findings 213
Figure 6.11: Areas of training comparing the two samples
areas of training
0
20
40
60
80
100
120
0 1 2 3 4 5 6 7 8 910
11
12
13
14
15
16
17
18
19
20
success
less successful
Furthermore t-tests were executed on the successful and less successful groups to show
that there is significant differences between the training in the different areas even when
analysed by comparison of training in factors in the two groups and from the two main
questions on importance and competence.
Table 6.25: Comparison of factor training areas - by success
Mean Std Deviation
Factor Successful
group
Less successful
group
Successful
group
Less successful
group
Mann
Whitney
Importance factor 1 -
Functional skills 12.2690 5.80690 3.1467 4.6396 0.0000
Importance factor 2 -
Enterprising skills 2.3807 1.1581 0.8644 1.2781 0.0000
Competence factor 1 -
Functional skills 11.4162 5.5066 2.9206 4.3444 0.0000
Competence factor 2 -
Enterprising skills 3.2335 1.4584 1.0625 1.5245 0.0000
Confidence interval: 95%; α= 0.05
Research Findings 214
This confirmed the frequencies and the chi square results. After analyzing the chi-square
and the t-tests, it became scientifically prudent to find out the differences between the same
groups of variables and factors. This is done through the Analysis of Variance (ANOVA)
method.
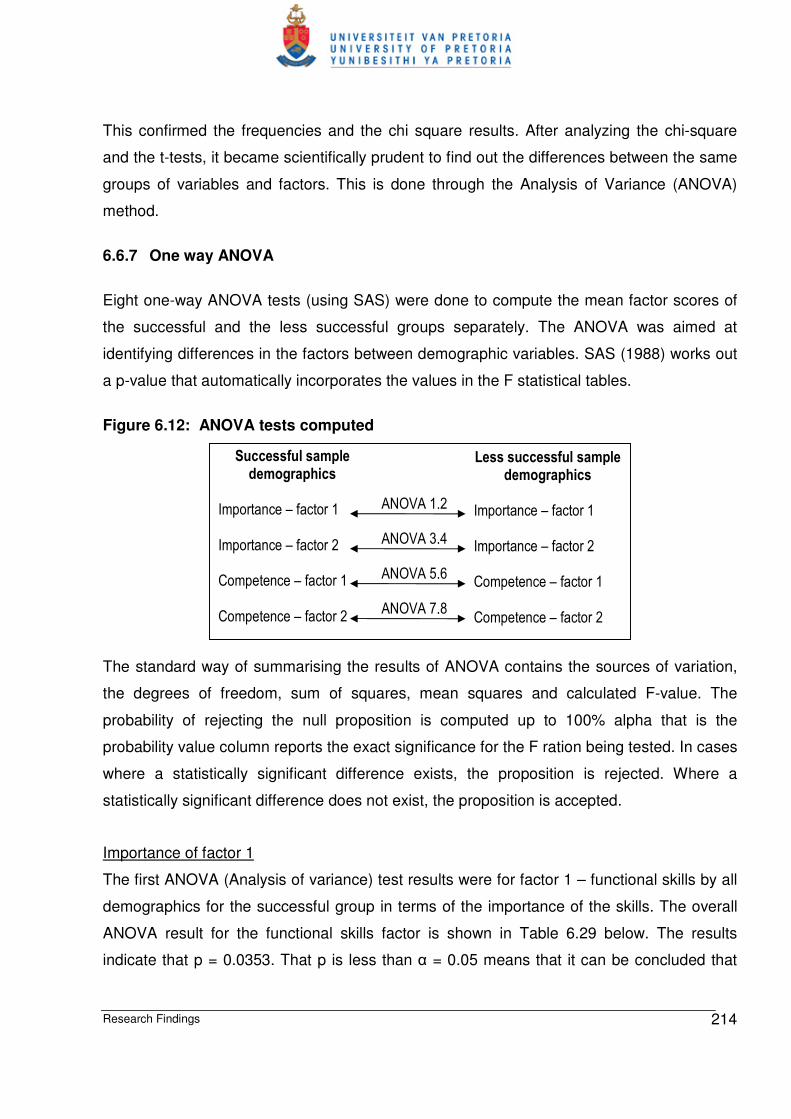
6.6.7 One way ANOVA
Eight one-way ANOVA tests (using SAS) were done to compute the mean factor scores of
the successful and the less successful groups separately. The ANOVA was aimed at
identifying differences in the factors between demographic variables. SAS (1988) works out
a p-value that automatically incorporates the values in the F statistical tables.
Figure 6.12: ANOVA tests computed
The standard way of summarising the results of ANOVA contains the sources of variation,
the degrees of freedom, sum of squares, mean squares and calculated F-value. The
probability of rejecting the null proposition is computed up to 100% alpha that is the
probability value column reports the exact significance for the F ration being tested. In cases
where a statistically significant difference exists, the proposition is rejected. Where a
statistically significant difference does not exist, the proposition is accepted.
Importance of factor 1
The first ANOVA (Analysis of variance) test results were for factor 1 – functional skills by all
demographics for the successful group in terms of the importance of the skills. The overall
ANOVA result for the functional skills factor is shown in Table 6.29 below. The results
indicate that p = 0.0353. That p is less than α = 0.05 means that it can be concluded that
ANOVA 7,8
ANOVA 5,6
ANOVA 3,4
ANOVA 1,2
Less successful sample demographics
Importance – factor 1 Importance – factor 2 Competence – factor 1 Competence – factor 2
Successful sample demographics
Importance – factor 1 Importance – factor 2 Competence – factor 1 Competence – factor 2

Research Findings 215
there was statistically significant differences in the successful group demographics (one or
more variables) in terms of the importance of functional skills.
Table 6.26: ANOVA 1 results - importance of factor 1 - successful
Source DF Sum of
squares
Mean
square
F
Value P value
Model 10 1.99918194 0.19991819 2.00 0.0353
Error 186 18.57452572 0.099856304
Corrected total 196 20.57370766
*** indicates a statistical significant variance at α= 0.05, confidence interval: 95%
Proposition 13 stated that statistically significant variance does not exist between how
successful SMEs view importance of functional skills regarding the demographics.
Therefore the proposition is rejected. However the results in table 6.29 does not indicate
which individual mean or means are different from the consensus value and in what
direction they deviate. A more detailed ANOVA checked for any differences in each of the
demographic variables in terms of the importance of factor1 - functional skills; to establish
which demographic variables of the successful group show these significant differences:
Table 6.27: Detailed ANOVA 1 results
Independent variable DF Sum of
squares
Mean square F
Value
P value
Age 1 0.90620998 0.90620998 9.07 0.0030***
Education 1 0.51865004 0.51865004 5.19 0.0238***
Ethnic group 1 0.27292975 0.27292975 2.73 0.1000
Forms of business 1 0.41498751 0.41498751 4.16 0.0429***
Gender 1 0.27357581 0.27357581 2.74 0.0996
Location 1 0.038827378 0.03882738 0.39 0.5337
Region 2 0.06675435 0.03337718 0.33 0.7163
Sector 1 0.08705373 0.08705373 0.87 0.3517
Work experience 1 0.01132146 0.01132146 0.11 0.7367
*** indicates a statistical significant variance at α= 0.05, confidence interval: 95%

Research Findings 216
At a significant level of 5% (α= 0.05) there is significant differences between three variables
namely age (p-value = 0.0030 < α= 0.05), education (p-value = 0.0238 < α= 0.05) and forms
of business (p-value = 0.0429 < α= 0.05). It is also found that there is not statistically
significant differences for the rest of the variables whose p value > α= 0.05.
Proposition 13.1 to 13.9 stated that a statistically significant variance does not exist between
how successful SMEs view importance of functional skills in the following demographic
variables age (P13.1); education (P13.2); ethnic group (P13.3); gender (P13.4); work
experience (P13.5); region (P13.6); subsector (P13.7); form of business (P13.8) and place
where business is operated (P13.9). Applying the acceptance rule that the proposition is
acceptable if and only if the p-value is > than α = 0.05, else it must be rejected; the results
are summarised below:
• Proposition 13.1: rejected.
• Proposition 13.2: rejected.
• Proposition 13.3: accepted.
• Proposition 13.4: accepted.
• Proposition 13.5: accepted.
• Proposition 13.6: accepted.
• Proposition 13.7: accepted.
• Proposition 13.8: rejected.
• Proposition 13.9: accepted.
The demographic variables that had a p-value of < 0.05 are examined for the differences
between each pair of means and table 6.31 below indicated the significantly different
stratification group means at a specified level as follows:
Table 6.28: Variables that show significant differences from ANOVA 1
Variable N Mean Std Deviation
AGE
< 40 76 3.32142857 0.35254179
>= 40 121 3.45159386 0.29525944
EDUCATION LEVEL
Research Findings 217
Matric or below 63 3.359341043 0.26384265
Above matric and other 134 3.42110874 0.34786760
FORM OF BUSINESS
Close corporation 111 3.36293436 0.34715049
Other forms of business 86 3.45099668 0.28576924
*** indicates a statistical significant variance at α= 0.05, confidence interval: 95%
The results show that there is statistical difference between the age group of successful
SMEs that are older than 40 years who consider functional skills to be more important and
those who are less than 40 years. This result implies that age does affect how successful
SMEs view the importance of functional skills. This supports the assertion that increasing
age of the entrepreneur/SME owner manager is positive correlated with successful SMEs
(Rwigema & Venter 2004:70; Ucbasaran et al, 2004:432).
The SME owners with educational level more than matric were found to consider functional
skills to be more important that those who have matric or less. This result implies that
education levels do affect how successful SMEs view the importance of functional skills.
This supports the assertion that increasing education levels is positively correlated with
successfully developing skills key for entrepreneurship (Markman & Baron, 2003:287;
Guzman & Santos, 2001:217).
Those successful SMEs whose business form is not close corporation consider functional
skills to be more important that those whose business form is close corporation. This implies
that the form of business does affect how successful SMEs view the importance of
functional skills. The results indicate that the proposition was not erroneously rejected.
The second ANOVA (Analysis of variance) test results were for factor 1 - functional skills by
all demographics for the less successful group in terms of the importance. The ANOVA
result is shown in Table 6.32 below. That the p-value = 0.0003 is also less than 0.05.
Therefore it can be concluded that there was statistically significant differences in the less
successful group demographics (one or more variables) in terms of how they view the
importance of functional skills.
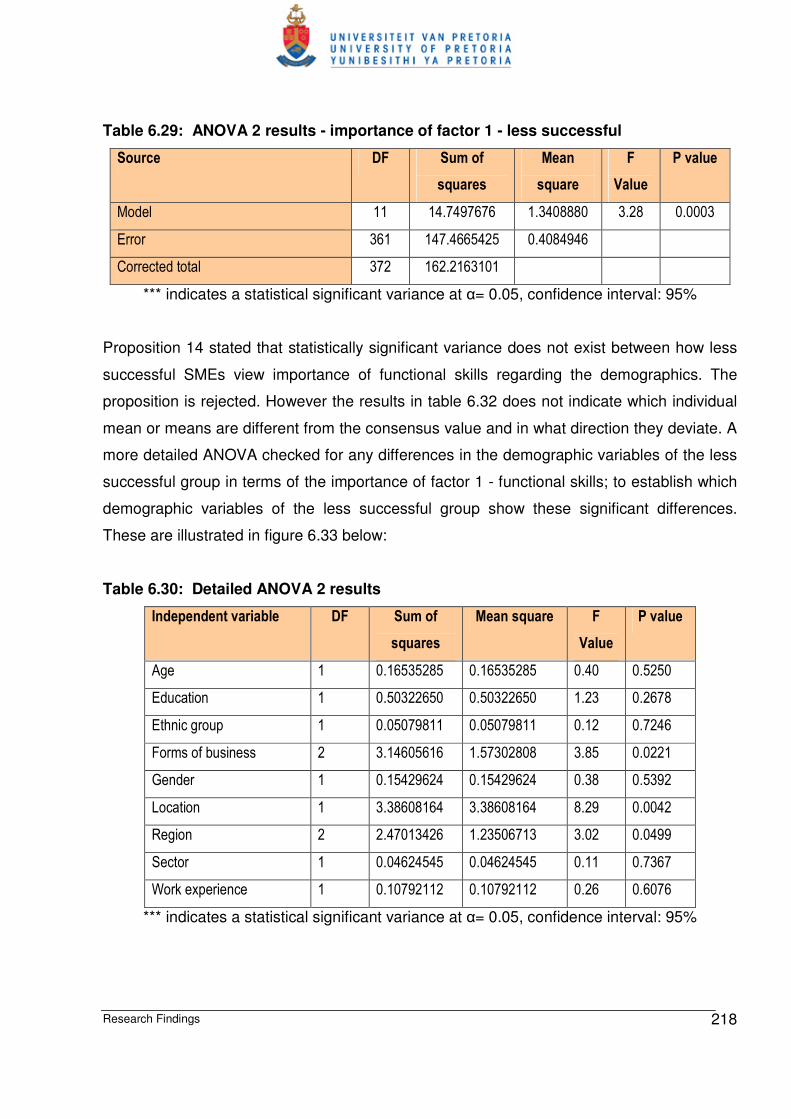
Research Findings 218
Table 6.29: ANOVA 2 results - importance of factor 1 - less successful
Source DF Sum of
squares
Mean
square
F
Value
P value
Model 11 14.7497676 1.3408880 3.28 0.0003
Error 361 147.4665425 0.4084946
Corrected total 372 162.2163101
*** indicates a statistical significant variance at α= 0.05, confidence interval: 95%
Proposition 14 stated that statistically significant variance does not exist between how less
successful SMEs view importance of functional skills regarding the demographics. The
proposition is rejected. However the results in table 6.32 does not indicate which individual
mean or means are different from the consensus value and in what direction they deviate. A
more detailed ANOVA checked for any differences in the demographic variables of the less
successful group in terms of the importance of factor 1 - functional skills; to establish which
demographic variables of the less successful group show these significant differences.
These are illustrated in figure 6.33 below:
Table 6.30: Detailed ANOVA 2 results
Independent variable DF Sum of
squares
Mean square F
Value
P value
Age 1 0.16535285 0.16535285 0.40 0.5250
Education 1 0.50322650 0.50322650 1.23 0.2678
Ethnic group 1 0.05079811 0.05079811 0.12 0.7246
Forms of business 2 3.14605616 1.57302808 3.85 0.0221
Gender 1 0.15429624 0.15429624 0.38 0.5392
Location 1 3.38608164 3.38608164 8.29 0.0042
Region 2 2.47013426 1.23506713 3.02 0.0499
Sector 1 0.04624545 0.04624545 0.11 0.7367
Work experience 1 0.10792112 0.10792112 0.26 0.6076
*** indicates a statistical significant variance at α= 0.05, confidence interval: 95%

Research Findings 219
At a significant level of 5% (α = 0.05) there is significant differences between three variables
namely forms of business (p-value = 0.0221 < α = 0.05); location (p-value = 0.0042 < α =
0.05) and region (p-value = 0.0499 < α= 0.05). It is also found that there is not statistically
significant differences for the rest of the variables whose p value > α= 0.05.
Proposition 14.1 to 14.9 stated that a statistically significant variance does not exist between
how less successful SMEs view importance of functional skills in the following demographic
variables age (P14.1); education (P14.2); ethnic group (P14.3); gender (P14.4); work
experience (P14.5); region (P14.6); subsector (P14.7); form of business (P14.8) and place
where business is operated (P14.9). Applying the acceptance rule that the proposition is
acceptable if and only if the p value is > than α= 0.05; else it must be rejected; the results
are summarised below:
• Proposition 14.1: accepted.
• Proposition 14.2: accepted.
• Proposition 14.4: accepted.
• Proposition 14.4: accepted.
• Proposition 14.5: accepted.
• Proposition 14.6: rejected.
• Proposition 14.7: accepted.
• Proposition 14.8: rejected.
• Proposition 14.9: rejected.
The demographic variables that had a p-value of < 0.05 are examined for the differences
between each pair of means and table 6.34 below indicated the significantly different
stratification group means at a specified level as follows:
Table 6.31: Variables that show significant differences from ANOVA 2
Variable N Mean Std Deviation
FORMS OF BUSINESS
Close corporation 121 3.08264463 0.59647549
Not registered 192 2.87388393 0.70707756
Other registered forms 60 3.21904762 0.54109352
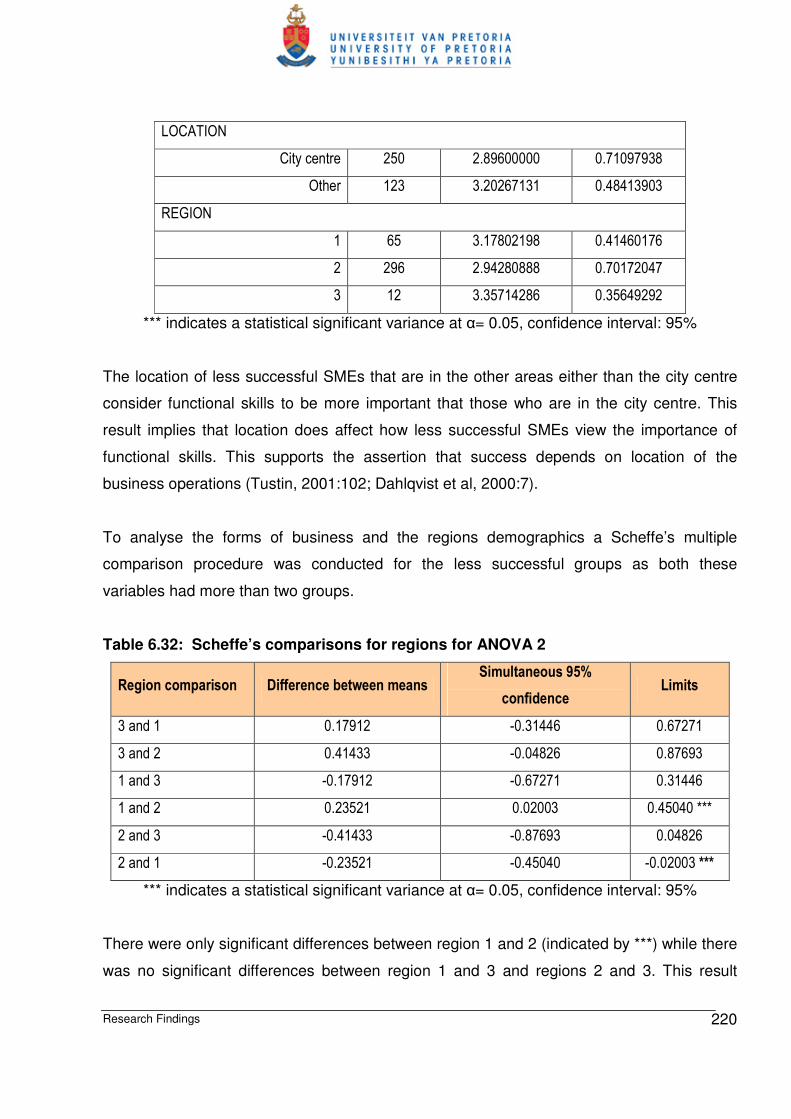
Research Findings 220
LOCATION
City centre 250 2.89600000 0.71097938
Other 123 3.20267131 0.48413903
REGION
1 65 3.17802198 0.41460176
2 296 2.94280888 0.70172047
3 12 3.35714286 0.35649292
*** indicates a statistical significant variance at α= 0.05, confidence interval: 95%
The location of less successful SMEs that are in the other areas either than the city centre
consider functional skills to be more important that those who are in the city centre. This
result implies that location does affect how less successful SMEs view the importance of
functional skills. This supports the assertion that success depends on location of the
business operations (Tustin, 2001:102; Dahlqvist et al, 2000:7).
To analyse the forms of business and the regions demographics a Scheffe’s multiple
comparison procedure was conducted for the less successful groups as both these
variables had more than two groups.
Table 6.32: Scheffe’s comparisons for regions for ANOVA 2
Region comparison Difference between means Simultaneous 95%
confidence Limits
3 and 1 0.17912 -0.31446 0.67271
3 and 2 0.41433 -0.04826 0.87693
1 and 3 -0.17912 -0.67271 0.31446
1 and 2 0.23521 0.02003 0.45040 ***
2 and 3 -0.41433 -0.87693 0.04826
2 and 1 -0.23521 -0.45040 -0.02003 ***
*** indicates a statistical significant variance at α= 0.05, confidence interval: 95%
There were only significant differences between region 1 and 2 (indicated by ***) while there
was no significant differences between region 1 and 3 and regions 2 and 3. This result

Research Findings 221
implies that less successful SMEs in region 1 and 3 considered functional skills to be more
important than those in region 2. This result supports the location result above that implies
that regions do affect how less successful SMEs view the importance of functional skills.
There were significant differences between less successful SMEs that were not registered
and those who were registered either as close corporation or other registrations (indicated
by *** in table 6.33 below). SMEs that were registered as close corporation and other
registration considered functional skills to be more important than those not registered.
Table 6.33: Scheffe’s comparisons for form of company for ANOVA 2
Region comparison Difference between
means
Simultaneous
95% confidence Limits
Other and close corporation 0.13640 -0.11164 0.38445
Other and not registered 0.34516 0.11282 0.57751 ***
Close corporation and other -0.13640 -0.38445 0.11164
Close corporation and not registered 0.20876 0.02642 0.39111 ***
Not registered and other -0.34516 -0.57751 -0.11282 ***
Not registered and close corporation -0.20876 -0.39111 -0.02642 ***
*** indicates a statistical significant variance at α= 0.05, confidence interval: 95%
This result implies that the form of a company does affect how less successful SMEs view
the importance of functional skills. This supports the assertion that increasing age of the
entrepreneur/SME owner manager is positive correlated with successful SMEs
(Kangasharju, 2000:38).
b) Importance of factor 2
The third ANOVA (Analysis of variance) test results were for factor 2 - enterprising skills.
The ANOVA result is shown in Table 6.34 below. The p-value = 0.0023 which is less than
α= 0.05. Therefore it can be concluded that there was statistically significant differences in
the successful group demographics (one or more variables) in terms of the importance of
enterprising skills.
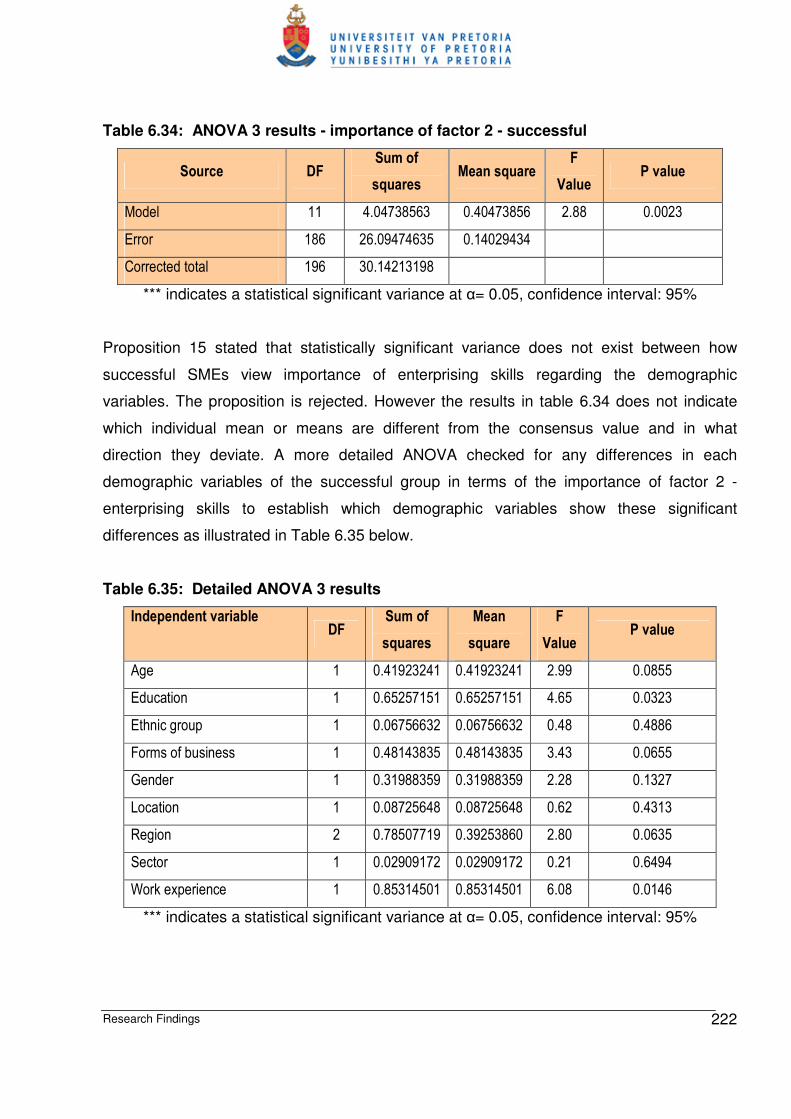
Research Findings 222
Table 6.34: ANOVA 3 results - importance of factor 2 - successful
Source DF Sum of
squares Mean square
F
Value P value
Model 11 4.04738563 0.40473856 2.88 0.0023
Error 186 26.09474635 0.14029434
Corrected total 196 30.14213198
*** indicates a statistical significant variance at α= 0.05, confidence interval: 95%
Proposition 15 stated that statistically significant variance does not exist between how
successful SMEs view importance of enterprising skills regarding the demographic
variables. The proposition is rejected. However the results in table 6.34 does not indicate
which individual mean or means are different from the consensus value and in what
direction they deviate. A more detailed ANOVA checked for any differences in each
demographic variables of the successful group in terms of the importance of factor 2 -
enterprising skills to establish which demographic variables show these significant
differences as illustrated in Table 6.35 below.
Table 6.35: Detailed ANOVA 3 results
Independent variable DF
Sum of
squares
Mean
square
F
Value P value
Age 1 0.41923241 0.41923241 2.99 0.0855
Education 1 0.65257151 0.65257151 4.65 0.0323
Ethnic group 1 0.06756632 0.06756632 0.48 0.4886
Forms of business 1 0.48143835 0.48143835 3.43 0.0655
Gender 1 0.31988359 0.31988359 2.28 0.1327
Location 1 0.08725648 0.08725648 0.62 0.4313
Region 2 0.78507719 0.39253860 2.80 0.0635
Sector 1 0.02909172 0.02909172 0.21 0.6494
Work experience 1 0.85314501 0.85314501 6.08 0.0146
*** indicates a statistical significant variance at α= 0.05, confidence interval: 95%

Research Findings 223
At a significance level of 5% (α = 0.05) there are significant differences between two
variables namely education (p-value = 0.0323 < α = 0.05) and work experience (p-value =
0.0146 < α = 0.05). It is also found that there is not statistically significant differences for the
rest of the variables whose p value > α= 0.05.
Proposition 15.1 to 15.9 stated that a statistically significant variance does not exist between
how successful SMEs view importance of enterprising skills in the following demographic
variables age (P15.1); education (P15.2); ethnic group (P15.3); gender (P15.4); work
experience (P15.5); region (P15.6); subsector (P15.7); form of business (P15.8) and place
where business is operated (P15.9). Applying the acceptance rule that the proposition is
acceptable if and only if the p value is > than α= 0.05, else it must be rejected; the results
are summarised below:
• Proposition 15.1: accepted.
• Proposition 15.2: rejected.
• Proposition 15.3: accepted.
• Proposition 15.4: accepted.
• Proposition 15.5: rejected.
• Proposition 15.6: accepted.
• Proposition 15.7: accepted.
• Proposition 15.8: accepted.
• Proposition 15.9: accepted.
The demographic variables that had a p-value of < 0.05 are examined for the differences
between each pair of means and table 6.36 below indicated the significantly different
stratification group means at a specified level as follows:
Table 6.36: Variables that show significant differences from ANOVA 3
Variable N Mean Std Deviation
EDUCATION LEVEL
Matric or below 63 3.20634921 0.34614400
Above matric and other 134 3.29601990 0.41010716
WORK EXPERIENCE

Research Findings 224
0 to 4 years 69 3.13526570 0.39323877
4 + years 128 3.33854167 0.37410582
*** indicates a statistical significant variance at α= 0.05, confidence interval: 95%
The successful SMEs with educational level more than matric consider enterprising skills to
be more important than those who have matric or less. This result implies that education
levels do affect how successful SMEs view the importance of enterprising skills. This also
supports the assertion that increasing education levels are positively correlated with
successful development of key entrepreneurship skills.
The group of successful SMEs that have more that 4 years working experience consider
enterprising skills to be more important that those who have less than 4 years experience.
This result implies that working experience does affect how successful SMEs view the
importance of enterprising skills. This supports the assertion that work experience is
positively correlated with successful development of key entrepreneurship skills and
improves their capacity in performing various tasks (Guzman & Santos, 2001:217; Markman
& Baron, 2003:287).
The fourth ANOVA (Analysis of variance) test results were for analysing the importance of
factor 2 - enterprising skills by all demographics for the less successful group. The ANOVA
result is shown in Table 6.37 below. The p-value = 0.0043 which is less than α= 0.05
therefore the less successful group, it can be concluded that there was statistically
significant differences in the less successful group demographics in terms of the importance
of enterprising skills.
Table 6.37: ANOVA 4 results - importance of factor 2 - less successful
Source DF Sum of
squares
Mean
square
F
Value P value
Model 11 8.4257396 0.7659763 2.54 0.0043
Error 361 109.0023212 0.3019455
Corrected total 372 117.4280608
*** indicates a statistical significant variance at α= 0.05, confidence interval: 95%

Research Findings 225
Proposition 16 stated that statistically significant variance does not exist between how less
successful SMEs view importance of enterprising skills regarding the demographics. The
proposition is rejected. However the results in table 6.37 does not indicate which individual
mean or means are different from the consensus value and in what direction they deviate. A
more detailed ANOVA (see Table 6.38) checked for any differences in each demographic
variables in terms of the importance of factor 2 - enterprising skills to establish which
demographic variables of the less successful group show these significant differences.
Location, education and region are the demographics with significant differences as
illustrated below:
Table 6.38: Detailed ANOVA 4 results
Independent variable DF Sum of
squares
Mean
square
F
Value P value
Age 1 0.00216462 0.00216462 0.01 0.9326
Education 1 2.37931022 2.37931022 1.23 0.0053
Ethnic group 1 0.00648624 0.00648624 7.88 0.8836
Forms of business 2 0.15154640 0.07577320 0.25 0.7782
Gender 1 0.33408361 0.33408361 1.11 0.2936
Location 1 1.26127061 1.26127061 4.18 0.0417
Region 2 2.28738747 1.14369373 3.79 0.0236
Sector 1 0.26627713 0.26627713 0.88 0.3483
Work experience 1 0.37380426 0.37380426 1.24 0.2666
*** indicates a statistical significant variance at α= 0.05, confidence interval: 95%
At a significant level of 5% (α = 0.05) there is significant differences between three variables
namely location (p-value = 0.0417 < α = 0.05), region (p-value = 0.0236 < α= 0.05) and
education (p-value = 0.0053 < α = 0.05). It is also found that there is not statistically
significant differences for the rest of the variables whose p value > α= 0.05.
Proposition 16.1 to 16.9 stated that a statistically significant variance does not exist between
how less successful SMEs view the importance of enterprising skills in the following
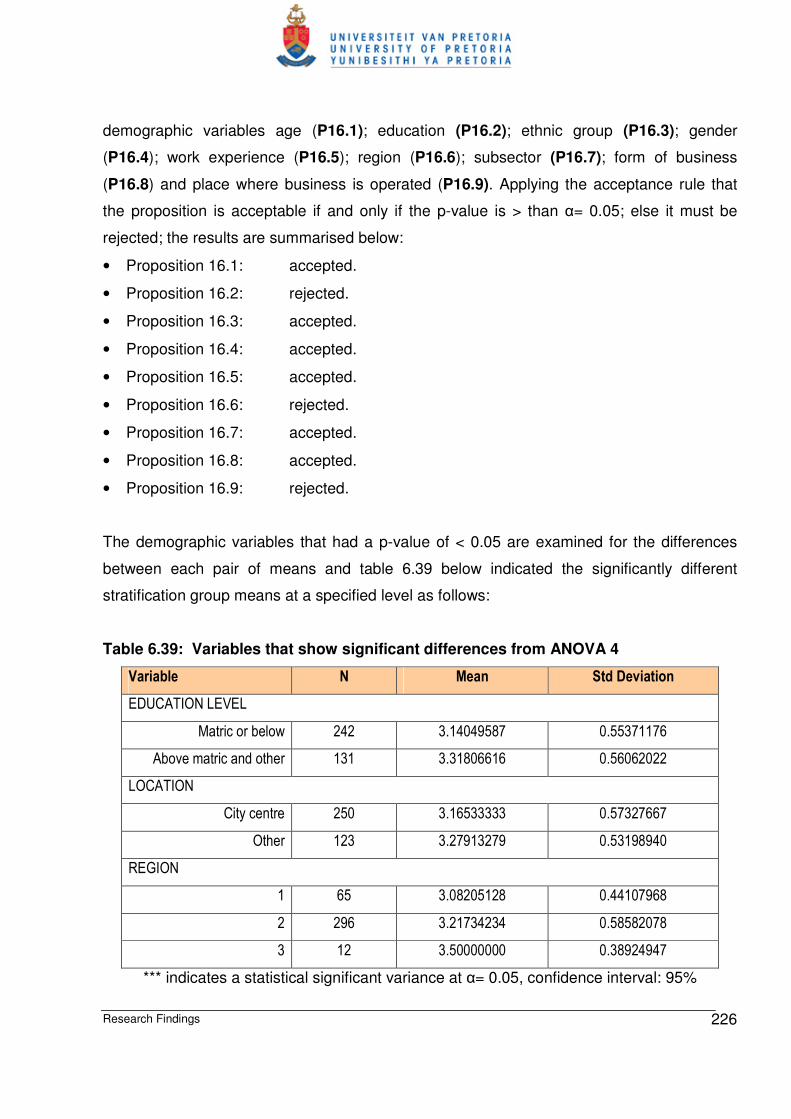
Research Findings 226
demographic variables age (P16.1); education (P16.2); ethnic group (P16.3); gender
(P16.4); work experience (P16.5); region (P16.6); subsector (P16.7); form of business
(P16.8) and place where business is operated (P16.9). Applying the acceptance rule that
the proposition is acceptable if and only if the p-value is > than α= 0.05; else it must be
rejected; the results are summarised below:
• Proposition 16.1: accepted.
• Proposition 16.2: rejected.
• Proposition 16.3: accepted.
• Proposition 16.4: accepted.
• Proposition 16.5: accepted.
• Proposition 16.6: rejected.
• Proposition 16.7: accepted.
• Proposition 16.8: accepted.
• Proposition 16.9: rejected.
The demographic variables that had a p-value of < 0.05 are examined for the differences
between each pair of means and table 6.39 below indicated the significantly different
stratification group means at a specified level as follows:
Table 6.39: Variables that show significant differences from ANOVA 4
Variable N Mean Std Deviation
EDUCATION LEVEL
Matric or below 242 3.14049587 0.55371176
Above matric and other 131 3.31806616 0.56062022
LOCATION
City centre 250 3.16533333 0.57327667
Other 123 3.27913279 0.53198940
REGION
1 65 3.08205128 0.44107968
2 296 3.21734234 0.58582078
3 12 3.50000000 0.38924947
*** indicates a statistical significant variance at α= 0.05, confidence interval: 95%

Research Findings 227
The location demographics of less successful SMEs that are in areas other than the city
centre consider enterprising skills to be more important that those who are in the city centre.
This result implies that location does affect how less successful SMEs view the importance
of skills. This supports the assertion that success depends on location of the business
operations.
As with the successful SMEs above, the less successful SMEs with educational level more
than matric consider enterprising skills to be more important that those who have matric or
less. This supports the theory that education levels do affect how even less successful
SMEs view the importance of enterprising skills. This also supports the assertion that
increasing education levels is positively correlated with successful development of key
entrepreneurship skills.
To analyse the regions demographics a Scheffe’s multiple comparison procedure was
conducted for the less successful groups as this variable has more than two groups.
Table 6.40: Scheffe’s comparisons for regions for ANOVA 4
Region comparison Difference between means Simultaneous 95% confidence Limits
3 and 2 0.28266 -0.11506 0.68037
3 and 1 0.41795 -0.00641 0.84231
2 and 3 -0.28266 -0.68037 0.11506
2 and 1 0.13529 -0.04972 0.32030
1 and 3 -0.41795 -0.84231 0.00641
1 and 2 -0.13529 -0.32030 0.04972
The Scheffe’s procedure shows that there are no significant differences between the three
regions. This type of result was expected due to that the factor 2 is not reliable, so the
results are not predictable. It is possible that a true proposition may have been wrongly
rejected.

Research Findings 228
c) Competence factor 1
The fifth ANOVA (Analysis of variance) test results was for analysing if there are difference
in how the successful group rates their competence in factor 1 - functional skills by all
demographics. The ANOVA result is shown in Table 6.41 below. The p-value is = 0.0074 is
smaller than α=0.05, therefore it can be concluded that there was statistically significant
differences in the successful group demographics in terms of their competence in functional
skills.
Table 6.41: ANOVA 5 results - competence in factor 1 - successful
Source DF Sum of
squares Mean square
F
Value P value
Model 10 2.31988537 0.23198854 2.51 0.0074
Error 186 17.16895613 0.09230622
Corrected total 196 19.48884150
*** indicates a statistical significant variance at α= 0.05, confidence interval: 95%
Proposition 17 stated that statistically significant variance does not exist between how
successful SMEs rate their competence in functional skills regarding the demographics. The
proposition is rejected. However the results in table 6.41 does not indicate which individual
mean or means are different from the consensus value and in what direction they deviate. A
more detailed ANOVA (see table 6.42) checked for any differences in each demographic
variables in terms of the competence of factor1 – functional skills; to establish which
demographic variables of the successful group show these significant differences:
Table 6.42: Detailed ANOVA 5 results
Independent variable DF Sum of
squares
Mean
square
F
Value P value
Age 1 0.60072687 0.60072687 6.51 0.0115
Education 1 0.23807828 0.23807828 2.58 0.1100
Ethnic group 1 0.04885484 0.04885484 0.53 0.4678
Forms of business 1 0.94676269 0.94676269 10.26 0.0016

Research Findings 229
Gender 1 0.00035618 0.00035618 0.00 0.9505
Location 1 0.20169366 0.20169366 2.19 0.1410
Region 2 0.35778841 0.17889420 1.94 0.1469
Sector 1 0.02897522 0.02897522 0.31 0.5760
Work experience 1 0.01808876 0.01808876 0.20 0.6585
*** indicates a statistical significant variance at α= 0.05, confidence interval: 95%
At a significant level of 5% (α = 0.05) there is significant differences between two variables
namely age (p-value = 0.0115 < α = 0.05) and forms of business (p-value = 0.0016 < α =
0.05). It is also found that there are no statistically significant differences for the rest of the
variables whose p value > α= 0.05.
Proposition 17.1 to 17.9 stated that a statistically significant variance does not exist between
how successful SMEs rate their competence in functional skills in the following demographic
variables age (P17.1); education (P17.2); ethnic group (P17.3); gender (P17.4); work
experience (P17.5); region (P17.6); subsector (P17.7); form of business (P17.8) and place
where business is operated (P17.9). Applying the acceptance rule that the proposition is
acceptable if and only if the p-value is > than α= 0.05; else it must be rejected; the results
are summarised below:
• Proposition 17.1: rejected.
• Proposition 17.2: accepted.
• Proposition 17.3: accepted.
• Proposition 17.4: accepted.
• Proposition 17.5: accepted.
• Proposition 17.6: accepted.
• Proposition 17.7: accepted.
• Proposition 17.8: rejected.
• Proposition 17.9: accepted.
The demographic variables that had a p-value of < 0.05 are examined for the differences
between each pair of means and table 6.43 below indicated the significantly different
stratification group means at a specified level as follows:

Research Findings 230
Table 6.43: Variables that show significant differences from ANOVA 5
Variable N Mean Std Deviation
AGE
< 40 76 3.18016194 0.31216054
>= 40 121 3.28989193 0.31116000
FORM OF BUSINESS
Close corporation 111 3.18572419 0.28071768
Other forms of business 86 3.32737030 0.34038655
*** indicates a statistical significant variance at α= 0.05, confidence interval: 95%
The age group of the successful entrepreneurs that are older than 40 years consider
themselves to be more competent in functional skills than those who are less than 40 years.
This result implies that age does affect the competence of successful SMEs in functional
skills. This supports the assertion that increasing age of the entrepreneur/SME owner
manager is positive correlated with fostering the development of skills (Aldrich, 1999:397).
There was a significant difference between successful SMEs whose business form is not
close corporation and those registered as close corporation. Those successful SMEs whose
business form is not close corporation consider themselves to be more competent in
functional skills than those whose are registered as close corporation.
The sixth ANOVA (Analysis of variance) test results were for analysing if there are
differences in how the less successful group rates their competence in terms of factor 1 -
functional skills by all demographics. The ANOVA result is shown in Table 6.44 below. For
the less successful group the p-value (< 0.0001) is also than 0.05 therefore it can be
concluded that there was statistically significant differences in the less successful group
demographics in terms of their competence in functional skills.
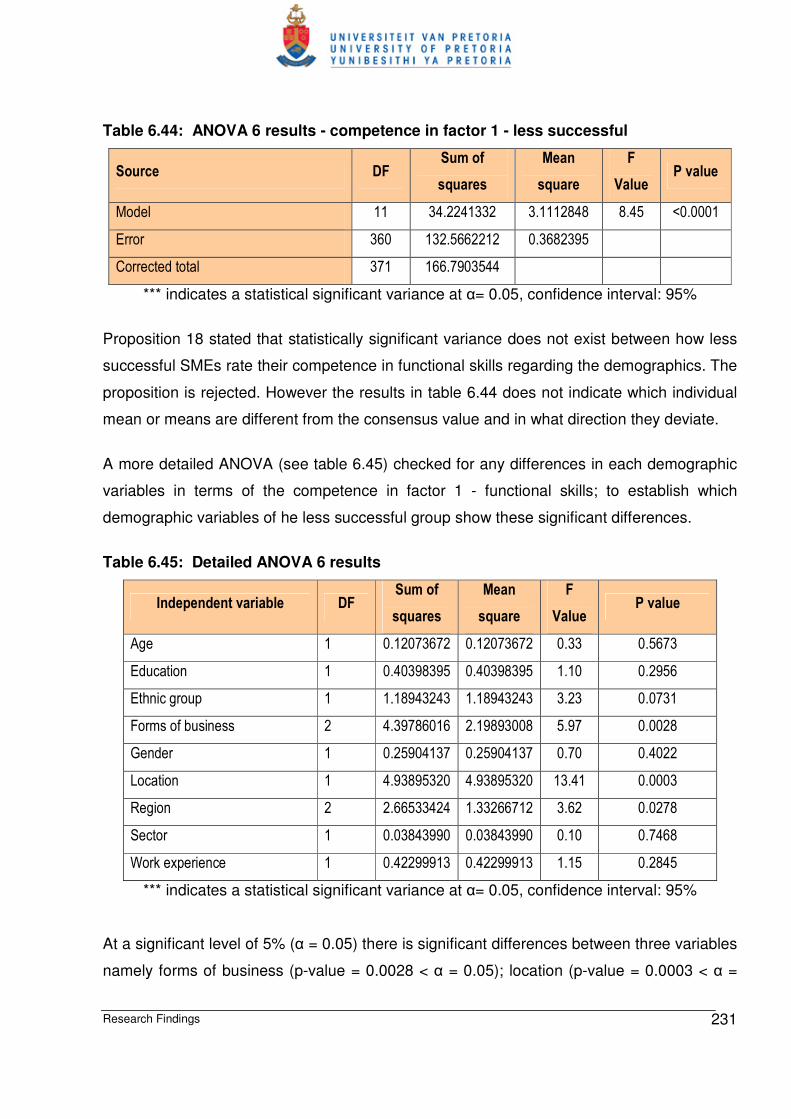
Research Findings 231
Table 6.44: ANOVA 6 results - competence in factor 1 - less successful
Source DF Sum of
squares
Mean
square
F
Value P value
Model 11 34.2241332 3.1112848 8.45 <0.0001
Error 360 132.5662212 0.3682395
Corrected total 371 166.7903544
*** indicates a statistical significant variance at α= 0.05, confidence interval: 95%
Proposition 18 stated that statistically significant variance does not exist between how less
successful SMEs rate their competence in functional skills regarding the demographics. The
proposition is rejected. However the results in table 6.44 does not indicate which individual
mean or means are different from the consensus value and in what direction they deviate.
A more detailed ANOVA (see table 6.45) checked for any differences in each demographic
variables in terms of the competence in factor 1 - functional skills; to establish which
demographic variables of he less successful group show these significant differences.
Table 6.45: Detailed ANOVA 6 results
Independent variable DF Sum of
squares
Mean
square
F
Value P value
Age 1 0.12073672 0.12073672 0.33 0.5673
Education 1 0.40398395 0.40398395 1.10 0.2956
Ethnic group 1 1.18943243 1.18943243 3.23 0.0731
Forms of business 2 4.39786016 2.19893008 5.97 0.0028
Gender 1 0.25904137 0.25904137 0.70 0.4022
Location 1 4.93895320 4.93895320 13.41 0.0003
Region 2 2.66533424 1.33266712 3.62 0.0278
Sector 1 0.03843990 0.03843990 0.10 0.7468
Work experience 1 0.42299913 0.42299913 1.15 0.2845
*** indicates a statistical significant variance at α= 0.05, confidence interval: 95%
At a significant level of 5% (α = 0.05) there is significant differences between three variables
namely forms of business (p-value = 0.0028 < α = 0.05); location (p-value = 0.0003 < α =

Research Findings 232
0.05) and region (p-value = 0.0278 < α= 0.05). It is also found that there is not statistically
significant differences for the rest of the variables whose p value > α= 0.05.
Proposition 18.1 to 18.9 stated that a statistically significant variance does not exist between
how less successful SMEs rate their competence in functional skills in the following
demographic variables age (P18.1); education (P18.2); ethnic group (P18.3); gender
(P18.4); work experience (P18.5); region (P18.6); sub sector (P18.7); form of business
(P18.8) and place where business is operated (P18.9). Applying the acceptance rule that
the proposition is acceptable if and only if the p value is > than α= 0.05; else it must be
rejected; the results are summarised below:
• Proposition 18.1: accepted.
• Proposition 18.2: accepted.
• Proposition 18.3: accepted.
• Proposition 18.4: accepted.
• Proposition 18.5: accepted.
• Proposition 18.6: rejected.
• Proposition 18.7: accepted.
• Proposition 18.8: rejected.
• Proposition 18.9: rejected.
The demographic variables that had a p-value of < 0.05 are examined for the differences
between each pair of means and table 6.48 below indicated the significantly different
stratification group means at a specified level as follows:
Table 6.46: Variables that show significant differences from ANOVA 6
Variable N Mean Std Deviation
FORMS OF BUSINESS
Close corporation 121 2.69675779 0.65469760
Not registered 191 2.31574708 0.65571074
Other registered forms 60 2.84102564 0.51647546
LOCATION
City centre 250 2.38584615 0.69847485
Research Findings 233
Other 122 2.80832282 0.50352039
REGION
1 65 2.88402367 0.46911314
2 296 2.43285528 0.68003221
3 12 2.82692308 0.65855973
*** indicates a statistical significant variance at α= 0.05, confidence interval: 95%
The location of less successful SMEs that are in the other areas either than the city centre
consider themselves to be more competent in functional skills than those who are in the city
centre. This result implies that location does affect the competence of less successful SMEs
in functional skills.
To analyse the forms of business and the regions demographics a Scheffe’s multiple
comparison procedure was conducted for the less successful groups as both these
variables had more than two groups.
Table 6.47: Scheffe’s comparisons for regions for ANOVA 6
Region comparison Difference between
means
Simultaneous 95%
confidence
Limits
1 and 3 0.05710 -0.41154 0.52574
1 and 2 0.45117 0.24679 0.65554 ***
3 and 1 -0.05710 -0.52574 0.41154
3 and 2 0.39407 -0.04518 0.83331
2 and 1 -0.45117 -0.65554 -0.24679 ***
2 and 3 -0.39407 -0.83331 -0.04518
*** indicates a statistical significant variance at α= 0.05, confidence interval: 95%
There were only significant differences between region 1 and 2 (indicated by ***) while there
were no significant differences between region 1 and 3 and regions 2 and 3. SMEs in region
1 and 3 considered themselves to be more competent in functional skills than those in
region 2.

Research Findings 234
Table 6.48: Scheffe’s comparisons for form of company for ANOVA 6
Form comparison Difference between
means
Simultaneous
95% confidence
Limits
Other and close corporation 0.14427 -0.09124 0.37978
Other and not registered 0.52528 0.30454 0.74602 ***
Close corporation and other -0.14427 -0.37978 0.09124
Close corporation and not registered 0.38101 0.20771 0.55431 ***
Not registered and other -0.52528 -0.74602 -0.30454 ***
Not registered and close corporation -0.38101 -0.55431 -0.20771 ***
*** indicates a statistical significant variance at α= 0.05, confidence interval: 95%
There were significant differences between less successful SMEs that were not registered
and those who were registered either as close corporation or other registrations (indicated
by ***). SMEs that were registered as close corporation and other forms of registration
considered themselves to be more competent in functional skills than those not registered.
d) Competence factor 2
The seventh ANOVA (Analysis of variance) test results was for analysing if there are
difference in how the successful group rates their competence in terms of factor 2 -
enterprising skills by all demographics. The ANOVA result is shown in Table 6.51 below.
The p-value is <0.0001 which is less than 0.05 therefore it can be concluded that there was
statistically significant differences in the successful group demographics in terms of how
they rate their competence in enterprising skills.
Table 6.49: ANOVA 7 results - competence in factor 2 - successful
Source DF Sum of
squares
Mean
square
F
Value P value
Model 10 10.67102578 1.06710258 6.32 <0.0001
Error 186 31.38925341 0.16875943
Corrected total 196 42.06027919
*** indicates a statistical significant variance at α= 0.05, confidence interval: 95%
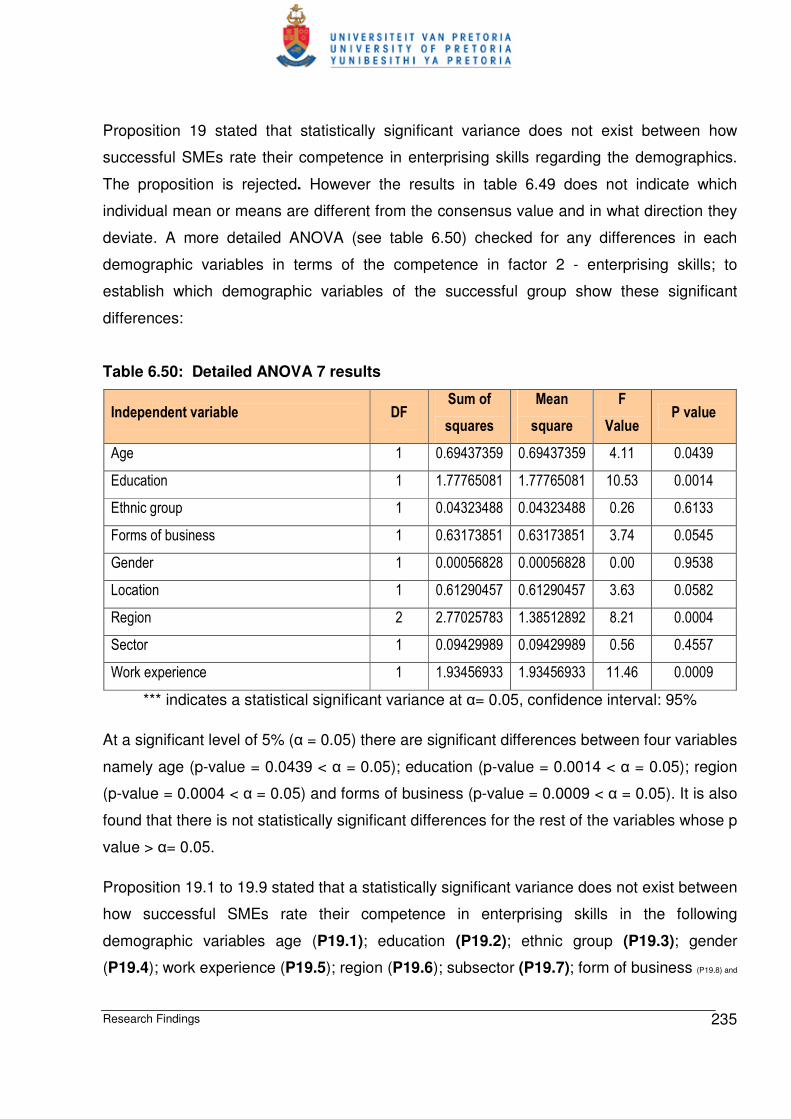
Research Findings 235
Proposition 19 stated that statistically significant variance does not exist between how
successful SMEs rate their competence in enterprising skills regarding the demographics.
The proposition is rejected. However the results in table 6.49 does not indicate which
individual mean or means are different from the consensus value and in what direction they
deviate. A more detailed ANOVA (see table 6.50) checked for any differences in each
demographic variables in terms of the competence in factor 2 - enterprising skills; to
establish which demographic variables of the successful group show these significant
differences:
Table 6.50: Detailed ANOVA 7 results
Independent variable DF Sum of
squares
Mean
square
F
Value P value
Age 1 0.69437359 0.69437359 4.11 0.0439
Education 1 1.77765081 1.77765081 10.53 0.0014
Ethnic group 1 0.04323488 0.04323488 0.26 0.6133
Forms of business 1 0.63173851 0.63173851 3.74 0.0545
Gender 1 0.00056828 0.00056828 0.00 0.9538
Location 1 0.61290457 0.61290457 3.63 0.0582
Region 2 2.77025783 1.38512892 8.21 0.0004
Sector 1 0.09429989 0.09429989 0.56 0.4557
Work experience 1 1.93456933 1.93456933 11.46 0.0009
*** indicates a statistical significant variance at α= 0.05, confidence interval: 95%
At a significant level of 5% (α = 0.05) there are significant differences between four variables
namely age (p-value = 0.0439 < α = 0.05); education (p-value = 0.0014 < α = 0.05); region
(p-value = 0.0004 < α = 0.05) and forms of business (p-value = 0.0009 < α = 0.05). It is also
found that there is not statistically significant differences for the rest of the variables whose p
value > α= 0.05.
Proposition 19.1 to 19.9 stated that a statistically significant variance does not exist between
how successful SMEs rate their competence in enterprising skills in the following
demographic variables age (P19.1); education (P19.2); ethnic group (P19.3); gender
(P19.4); work experience (P19.5); region (P19.6); subsector (P19.7); form of business (P19.8) and

Research Findings 236
place where business is operated (P19.9). Applying the acceptance rule that the proposition
is acceptable if and only if the p value is > than α= 0.05; else it must be rejected; the results
are summarised below:
• Proposition 19.1: rejected.
• Proposition 19.2: rejected.
• Proposition 19.3: accepted.
• Proposition 19.4: accepted.
• Proposition 19.5: rejected.
• Proposition 19.6: rejected.
• Proposition 19.7: accepted.
• Proposition 19.8: accepted.
• Proposition 19.9: accepted.
The demographic variables that had a p-value of < 0.05 are examined for the differences
between each pair of means and table 6.51 below indicated the significantly different
stratification group means at a specified level as follows:
Table 6.51: Variables that show significant differences from ANOVA 7
Variable N Mean Std Deviation
AGE
< 40 76 2.99671053 0.41531799
> = 40 121 3.19008264 0.47765136
EDUCATION LEVEL
Matric or below 63 2.96825397 0.40033268
Above matric and other 134 3.18470149 0.47585410
WORK EXPERIENCE
0 to 4 years 69 2.91304348 0.42837348
4 + years 128 3.22460938 0.44571433
REGION
1 92 3.20108696 0.44972386
2 93 2.99193548 0.43839442
3 12 3.41666667 0.50377364
*** indicates a statistical significant variance at α= 0.05, confidence interval: 95%

Research Findings 237
The group of successful entrepreneurs that are older than 40 years consider themselves to
be more competent in enterprising skills than those who are less than 40 years. This result
implies that age does affect the competence of successful SMEs in enterprising skills. This
also supports the assertion that increasing age of the entrepreneur/SME owner manager is
positive correlated with fostering the development of skills.
The group of successful SMEs that have more that 4 years working experience consider
themselves to be more competent in enterprising skills than those who have less than 4
years work experience. This result implies that working experience does affect the
competence of successful SMEs in enterprising skills. This supports the assertion that work
experience is positively correlated with higher their entrepreneurial quality skills (Barreira,
2004:43; Tustin, 2001:88).
The successful SMEs with educational level more than matric consider themselves to be
more competent in enterprising skills than those who have matric or less. This result implies
that education levels do affect the competence of successful SMEs in terms of enterprising
skills. This also supports the assertion that increasing education levels are positively
correlated with how successful SMEs develop skills that are key for entrepreneurship.
To analyse the region demographics a Scheffe’s multiple comparison procedure was
conducted as both these variables had more than two groups. There was significant
differences between region 1 and 2 plus region 3 and 2 (indicated by ***) while there was no
significant differences between region 1 and 3. SMEs in region 1 and 3 considered
themselves to be more competent in enterprising skills than those in region 2.
Table 6.52: Scheffe’s comparisons for regions for ANOVA 7
Region comparison Difference between
means
Simultaneous 95%
confidence Limits
3 and 1 0.21558 -0.09555 0.52671
3 and 2 0.42473 0.11380 0.73567 ***
1 and 3 -0.21558 -0.52671 0.09555
1 and 2 0.20915 0.06009 0.35821 ***
2 and 3 -0.42473 -0.73567 -0.11380 ***
2 and 1 -0.20915 -0.35821 -0.06009 ***
*** indicates a statistical significant variance at α= 0.05, confidence interval: 95%
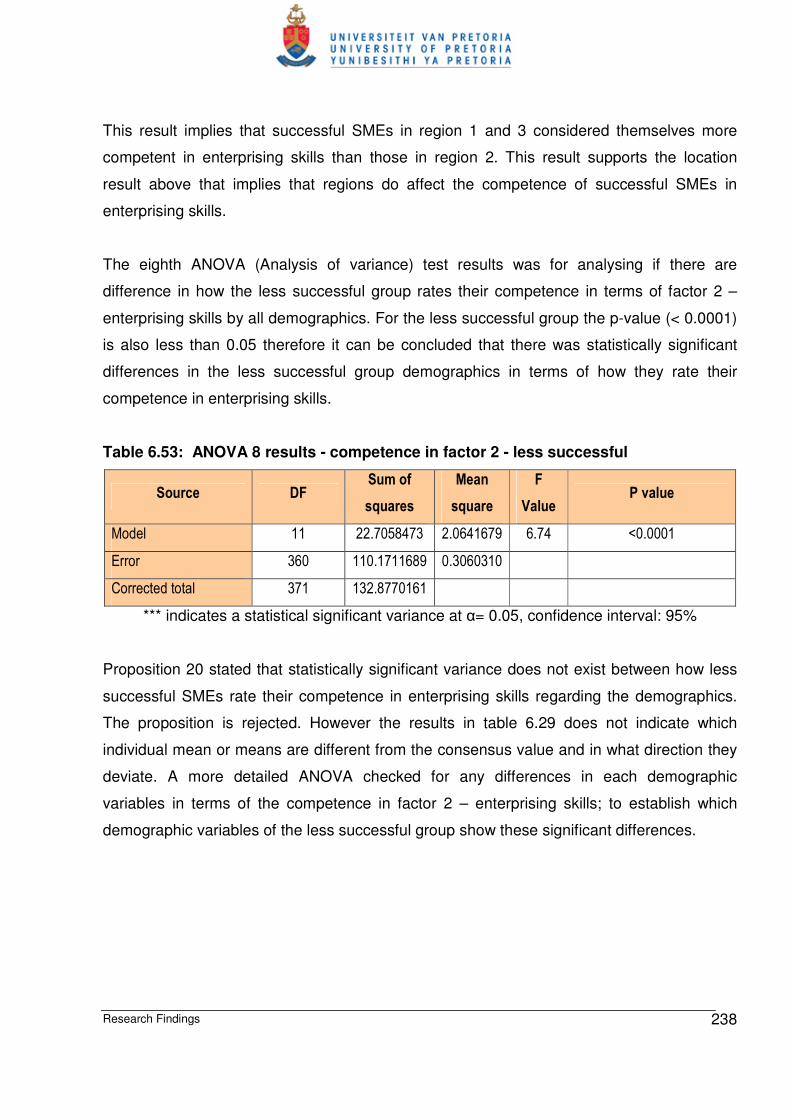
Research Findings 238
This result implies that successful SMEs in region 1 and 3 considered themselves more
competent in enterprising skills than those in region 2. This result supports the location
result above that implies that regions do affect the competence of successful SMEs in
enterprising skills.
The eighth ANOVA (Analysis of variance) test results was for analysing if there are
difference in how the less successful group rates their competence in terms of factor 2 –
enterprising skills by all demographics. For the less successful group the p-value (< 0.0001)
is also less than 0.05 therefore it can be concluded that there was statistically significant
differences in the less successful group demographics in terms of how they rate their
competence in enterprising skills.
Table 6.53: ANOVA 8 results - competence in factor 2 - less successful
Source DF Sum of
squares
Mean
square
F
Value P value
Model 11 22.7058473 2.0641679 6.74 <0.0001
Error 360 110.1711689 0.3060310
Corrected total 371 132.8770161
*** indicates a statistical significant variance at α= 0.05, confidence interval: 95%
Proposition 20 stated that statistically significant variance does not exist between how less
successful SMEs rate their competence in enterprising skills regarding the demographics.
The proposition is rejected. However the results in table 6.29 does not indicate which
individual mean or means are different from the consensus value and in what direction they
deviate. A more detailed ANOVA checked for any differences in each demographic
variables in terms of the competence in factor 2 – enterprising skills; to establish which
demographic variables of the less successful group show these significant differences.

Research Findings 239
Table 6.54: Detailed ANOVA 8 results
Independent variable DF Sum of
squares
Mean
square
F
Value P value
Age 1 1.80931493 1.80931493 5.91 0.0155
Education 1 11.25457764 11.25457764 36.78 <0.0001
Ethnic group 1 0.01892188 0.01892188 0.06 0.8038
Forms of business 2 0.01779436 0.00889718 0.03 0.9713
Gender 1 0.00128541 0.00128541 0.00 0.9484
Location 1 3.16322595 3.16322595 10.34 0.0014
Region 2 2.78859366 1.39429683 4.56 0.0111
Sector 1 0.28626335 0.28626335 0.94 0.3341
Work experience 1 0.34659170 0.34659170 1.13 0.2879
*** indicates a statistical significant variance at α= 0.05, confidence interval: 95%
At a significant level of 5% (α = 0.05) there is significant differences between four variables
namely age (p-value = 0.0155 < α = 0.05); education (p-value = 0.0001 < α= 0.05); location
(p-value = 0.0014 < α = 0.05) and region (p-value = 0.0499 < α= 0.0111). It is also found
that there are no statistically significant differences for the rest of the variables whose p
value > α= 0.05.
Proposition 20.1 to 20.9 stated that a statistically significant variance does not exist between
how successful SMEs rate their competence in enterprising skills in the following
demographic variables age (P20.1); education (P20.2); ethnic group (P20.3); gender
(P20.4); work experience (P20.5); region (P20.6); subsector (P20.7); form of business
(P20.8) and place where business is operated (P20.9). Applying the acceptance rule that
the proposition is acceptable if and only if the p value is > than α= 0.05; else it must be
rejected; the results are summarised below:
• Proposition 20.1: rejected.
• Proposition 20.2: rejected.
• Proposition 20.3: accepted.
• Proposition 20.4: accepted.
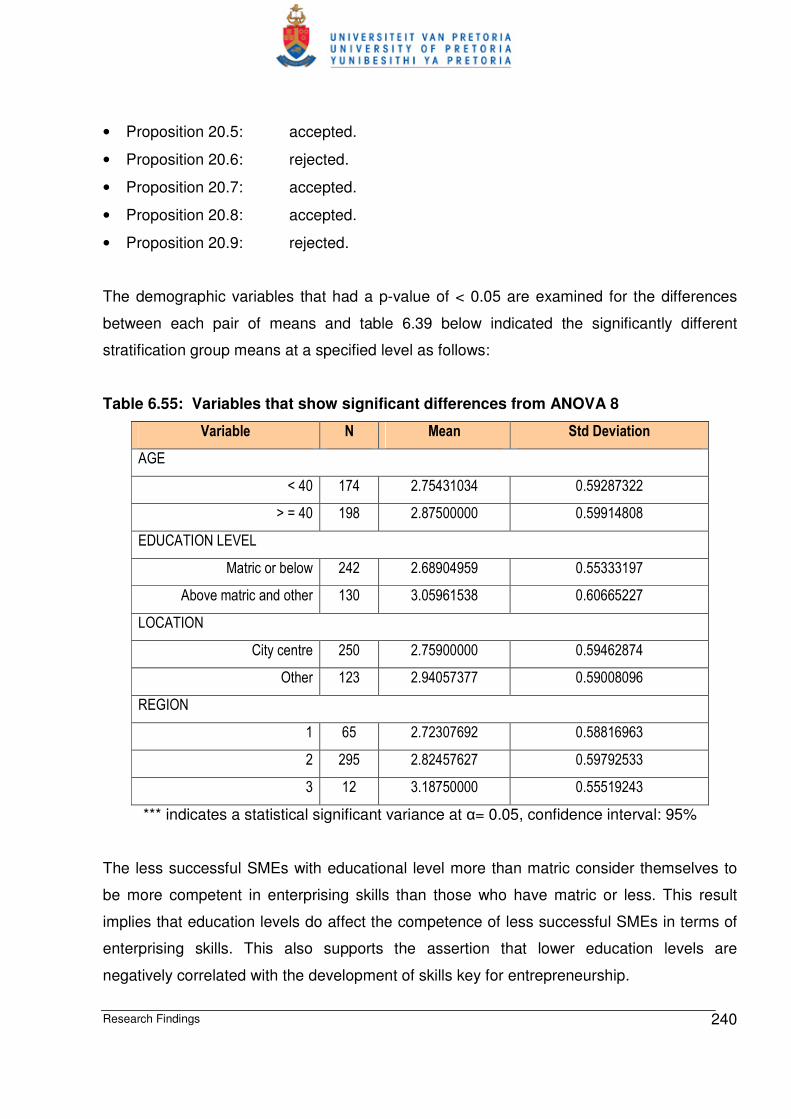
Research Findings 240
• Proposition 20.5: accepted.
• Proposition 20.6: rejected.
• Proposition 20.7: accepted.
• Proposition 20.8: accepted.
• Proposition 20.9: rejected.
The demographic variables that had a p-value of < 0.05 are examined for the differences
between each pair of means and table 6.39 below indicated the significantly different
stratification group means at a specified level as follows:
Table 6.55: Variables that show significant differences from ANOVA 8
Variable N Mean Std Deviation
AGE
< 40 174 2.75431034 0.59287322
> = 40 198 2.87500000 0.59914808
EDUCATION LEVEL
Matric or below 242 2.68904959 0.55333197
Above matric and other 130 3.05961538 0.60665227
LOCATION
City centre 250 2.75900000 0.59462874
Other 123 2.94057377 0.59008096
REGION
1 65 2.72307692 0.58816963
2 295 2.82457627 0.59792533
3 12 3.18750000 0.55519243
*** indicates a statistical significant variance at α= 0.05, confidence interval: 95%
The less successful SMEs with educational level more than matric consider themselves to
be more competent in enterprising skills than those who have matric or less. This result
implies that education levels do affect the competence of less successful SMEs in terms of
enterprising skills. This also supports the assertion that lower education levels are
negatively correlated with the development of skills key for entrepreneurship.

Research Findings 241
The age group of less successful entrepreneurs that are older than 40 years consider
themselves to be more competent in enterprising skills than those who are less than 40
years. This result implies that age does affect the competence of less successful SMEs in
enterprising skills. This also supports the assertion that increasing age of the
entrepreneur/SME owner manager is positively correlated with fostering the development of
skills.
The less successful SMEs that are located in the areas either than the city centre consider
themselves to be more competent in enterprising skills than those who are in the city centre.
This result implies that location does affect how less successful SMEs view the importance
of skills. This supports the assertion that success depends on location of the business
operations.
To analyse the regions demographics a Scheffe’s multiple comparison procedure was
conducted for the less successful groups as this variable has more than two groups.
Table 6.56: Scheffe’s comparisons for region for ANOVA 8
Region comparison Difference between means Simultaneous 95%
confidence Limits
3 and 2 0.36292 -0.03751 0.76335
3 and 1 0.46442 0.03720 0.89165 ***
2 and 3 -0.36292 -0.76335 0.03751
2 and 1 0.10150 -0.08481 0.28781
1 and 3 -0.46442 -0.89165 -0.03720 ***
1 and 2 -0.10150 -0.28781 0.08481
*** indicates a statistical significant variance at α= 0.05, confidence interval: 95%
There were significant differences between region 1 and 3 (indicated by ***) while there was
no significant differences between region 1 and 2 or regions 3 and 2. SMEs in region 3 and
2 considered themselves to be more competent in enterprising skills than those in region 1.
This result implies that successful SMEs in region 1 and 3 considered themselves more

Research Findings 242
competent in enterprising skills than those in region 2. This result supports the location
result above that implies that regions do affect the competence of successful SMEs in
enterprising skills.
In summary there are significant differences in the two groups in terms of demographics
with the following standing out namely age, education which is linked and work experience,
form of business and location which is linked with region
The successful group had variances more in personal demographics (age and education)
while the less successful group had more variances in company demographics (location,
region and form)
.
There were no significant differences in both groups of SMEs in terms of the following
demographics: Ethnic groups, language, gender, sub-sector and product type.
Furthermore the ANOVA outputs and significance of source tested for factor 1 and factor 2
comparing the successful and less successful SMEs in terms of their views of the
importance of the skills in the two factors. This showed differences between the two groups
namely the successful and the less successful SMEs.
Table 6.57: ANOVA of the difference between the SMEs on importance
Mean Coeff Var R square
Factor Successful
group
Less
successful
group
Successful
group
Less
successful
group
Successful
group
Less
successful
group
Factor 1 3.401378 2.997128 9.290680 21.32495 0.097172 0.090927
Factor 2 3.267343 3.202860 11.46371 17.15641 0.134277 0.071752
R square cannot exceed 1
A graphical plot of the mean scores on each of the factors gives an indication of the
difference between the groups in terms of how they view the importance of the skills in each
factor.
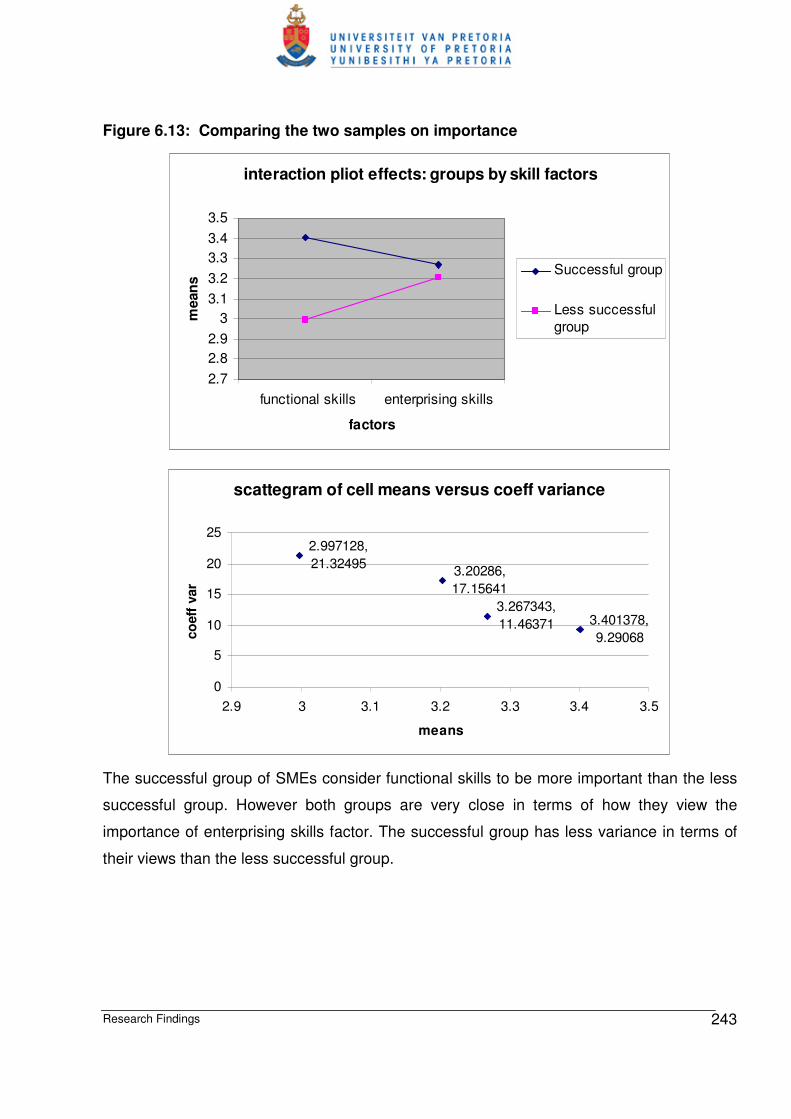
Research Findings 243
Figure 6.13: Comparing the two samples on importance
interaction pliot effects: groups by skill factors
2.7
2.8
2.9
3
3.1
3.2
3.3
3.4
3.5
functional skills enterprising skills
factors
mean
s
Successful group
Less successful
group
scattegram of cell means versus coeff variance
3.401378,
9.29068
2.997128,
21.32495
3.267343,
11.46371
3.20286,
17.15641
0
5
10
15
20
25
2.9 3 3.1 3.2 3.3 3.4 3.5
means
co
eff
var
The successful group of SMEs consider functional skills to be more important than the less
successful group. However both groups are very close in terms of how they view the
importance of enterprising skills factor. The successful group has less variance in terms of
their views than the less successful group.
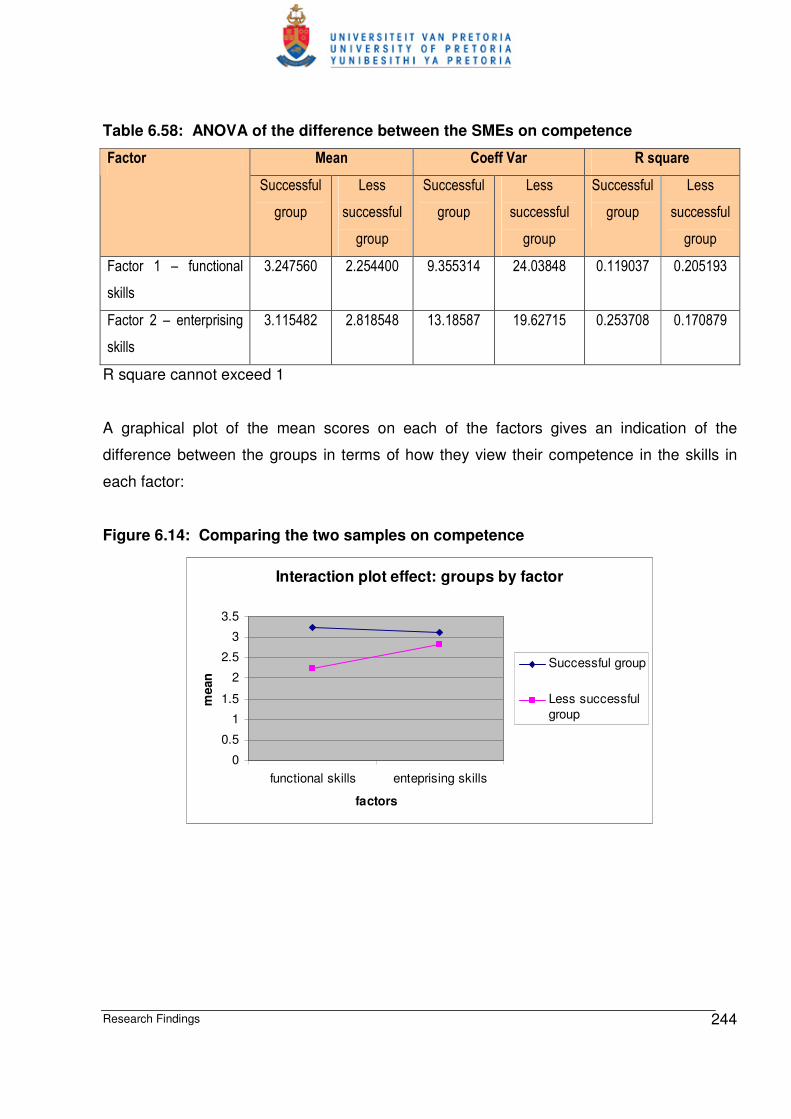
Research Findings 244
Table 6.58: ANOVA of the difference between the SMEs on competence
Mean Coeff Var R square Factor
Successful
group
Less
successful
group
Successful
group
Less
successful
group
Successful
group
Less
successful
group
Factor 1 – functional
skills
3.247560 2.254400 9.355314 24.03848 0.119037 0.205193
Factor 2 – enterprising
skills
3.115482 2.818548 13.18587 19.62715 0.253708 0.170879
R square cannot exceed 1
A graphical plot of the mean scores on each of the factors gives an indication of the
difference between the groups in terms of how they view their competence in the skills in
each factor:
Figure 6.14: Comparing the two samples on competence
Interaction plot effect: groups by factor
0
0.5
1
1.5
2
2.5
3
3.5
functional skills enteprising skills
factors
mean
Successful group
Less successful
group

Research Findings 245
scattergram of cell means vs coeff var
competence
3.24756,
9.355314
2.2544,
24.03848 2.818548,
19.62715
3.115482,
13.18587
0
5
10
15
20
25
30
0 0.5 1 1.5 2 2.5 3 3.5
means
co
ef
var
The successful group of SMEs consider themselves to be more competent in functional
skills than the less successful group. Although the ANOVA results show that both groups
are close in terms of how they rate their competence in the enterprising skills factor, the
successful group of SMEs consider themselves to be more competent in enterprising skills
than the less successful group. The successful group has less variance in terms of how they
rated themselves than the less successful group.
6.6.8 Impact
More of the successful group (average 90.78%) found the training they attended much more
helpful in terms of performance indicators than the less successful group (average 53.17%).
Table 6.59: Impact of training as perceived by the two groups
Successful group Less successful group Variable
Agree/strongly
agree
Don’t
know
Disagree/strongly
disagree
Agree/strongly
agree
Don’t
know
Disagree/strongly
disagree
Product quality 93.91 5.08 1.02 56.84 36.46 6.7
Productivity 89.85 5.58 4.57 54.96 38.34 6.71
Sales 78.68 16.75 4.57 49.86 39.95 10.19
Operations 92.38 7.61 0 55.49 35.92 8.58
Skills 94.92 4.57 0.51 43.44 47.99 8.58
Motivation 94.93 5.08 0 58.45 33.78 7.77

Research Findings 246
Whereas more of the less successful group didn’t know whether the training received was
useful or not.
Correlation between factors and training
Correlation procedure indicated that the competence is related to the increase in the
number of training for functional skills. Pearson correlation coefficients = 0.65859 with p <
0.0001.
Figure 6.15: Correlation between training and factor 1 - competence
However, the correlation procedure also fails to show clear correlation between competence
and the increase in the number of training for enterprising skills. Pearson correlation
0 3 6 9 12 15
Number of F1 courses attended
0.0
0.5
1.0
1.5
2.0
2.5
3.0
3.5
4.0
4.5
F1
me
an
com
pe
ten
ce
score
r = 0.6586, p = 0.0000
Number of F1 courses attended
F1
me
an c
om
pe
tency s
core
Survive
0 3 6 9 12 150.0
0.5
1.0
1.5
2.0
2.5
3.0
3.5
4.0
4.5
Success
0 3 6 9 12 15
Survive r = 0.5448, p = 0.0000 Success r = 0.3597, p = 0.00000

Research Findings 247
coefficients = 0.31509 with p < 0.0001; is weak and thus there is no correlation between
number of training areas and competency in enterprising skills.
Figure 6.16: Correlation between training and factor 2 – competence
6.7 Conclusion
This chapter presented the main findings of the empirical study. During the course of this
chapter, relevant information was obtained and explained by means of descriptive and
inferential statistics. Relevant data was captured and provided in tabular and figure format.
The various statistical techniques and methods as discussed within the scope of chapter 5
(research design and methodology of the study) were practically applied within chapter 6.
The personal demographic information of the respondents (successful and less successful
SMEs) showed normal distribution. The descriptive statistics for the demographics data
0 1 2 3 4
Number of F2 courses attended
0.0
0.5
1.0
1.5
2.0
2.5
3.0
3.5
4.0
4.5
F2
me
an
co
mp
ete
ncy s
co
re
r = 0.3151, p = 0.0000
Number of F2 courses attended
Fa
cto
r2 m
ea
n c
om
pe
ten
cy s
co
re
Survival
0 1 2 3 40.0
0.5
1.0
1.5
2.0
2.5
3.0
3.5
4.0
4.5
Success
0 1 2 3 4
Survival r = 0.2680, p = 0.00000 Success r = 0.0771, p = 0.2815
Research Findings 248
showed normal distribution. Based on the demographic data, the SMEs population appears
to be made up of informal, micro, small and very small business with no evidence of
medium enterprises participating in the survey. The data also that over 70% of the
respondents have at least matric and that they are mainly black SA and mainly female.
The business demographic information also showed normal distribution. These factor
analyses confirmed two main factors namely functional and enterprising skills. Except for
one of the four factors, the factor analysis indicated relatively high construct validity of the
measuring instruments as evidenced by the high Cronbach alphas. Item analysis showed
scale mean score that were higher that the midpoint of all factors indicating that all items
were contributing to the two factors.
The chi-square test, the t-test, Mann-Whitney tests and the one way ANOVA tests were
executed to present the statistical differences between the successful and less successful
groups. ANOVA showed some significant differences among the successful and less
successful groups. For functional skills, there were significant differences for age,
educational level, ethnicity and size of business. For enterprising skills, there were
significant differences for experience, region and type of business. Significant different
factors identified by the ANOVA were investigated further by comparing the scale means for
demographic variables through the Scheffe’s multiple comparison procedure. This showed
varying degrees of significant differences some of which call for further investigation through
separate research.
The next chapter revisits the objectives, discusses the findings, makes final conclusions,
provides recommendations for policy makers and makes suggestions on areas for further
research.