Chapter 6 Investment Decision Rules - Columbia...
60
Copyright © 2011 Pearson Prentice Hall. All rights reserved. Chapter 6 Investment Decision Rules
Transcript of Chapter 6 Investment Decision Rules - Columbia...
Copyright © 2011 Pearson Prentice Hall. All rights reserved.
Chapter 6
Investment Decision Rules
Copyright © 2011 Pearson Prentice Hall. All rights reserved. 6-2
Chapter Outline
6.1 NPV and Stand-Alone Projects
6.2 The Internal Rate of Return Rule
6.3 The Payback Rule
6.4 Choosing Between Projects
6.5 Project Selection with Resource Constraints
Copyright © 2011 Pearson Prentice Hall. All rights reserved. 6-3
Learning Objectives
1. Define net present value, payback period, internal rate of return, profitability index, and incremental IRR.
2. Describe decision rules for each of the tools in objective 1, for both stand-alone and mutually exclusive projects.
3. Given cash flows, compute the NPV, payback period, internal rate of return, and profitability index for a given project, and the incremental IRR for a pair of projects.
Copyright © 2011 Pearson Prentice Hall. All rights reserved. 6-4
Learning Objectives
4. Compare each of the capital budgeting tools above, and tell why NPV always gives the correct decision.
5. Discuss the reasons IRR can give a flawed decision.
6. Describe situations in which profitability index cannot be used to make a decision.
Copyright © 2011 Pearson Prentice Hall. All rights reserved. 6-5
6.1 NPV and Stand-Alone Projects
• Consider a take-it-or-leave-it investment decision involving a single, stand-alone project for Fredrick’s Feed and Farm (FFF).
– The project costs $250 million and is expected to generate cash flows of $35 million per year, starting at the end of the first year and lasting forever.
Copyright © 2011 Pearson Prentice Hall. All rights reserved. 6-6
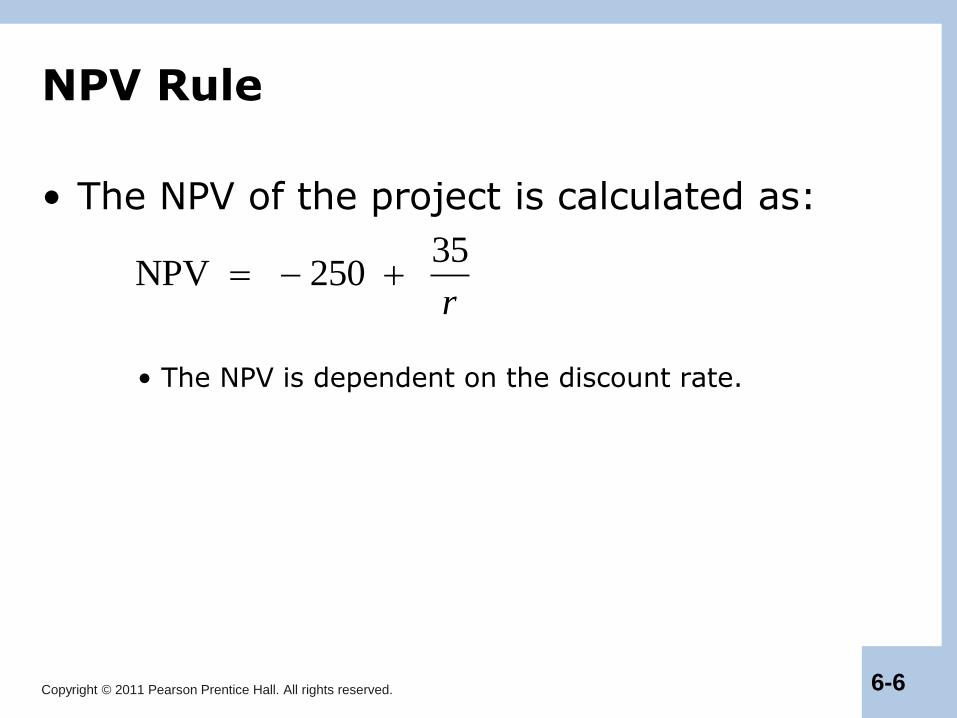
NPV Rule
• The NPV of the project is calculated as:
• The NPV is dependent on the discount rate.
35NPV 250
r
Copyright © 2011 Pearson Prentice Hall. All rights reserved. 6-7
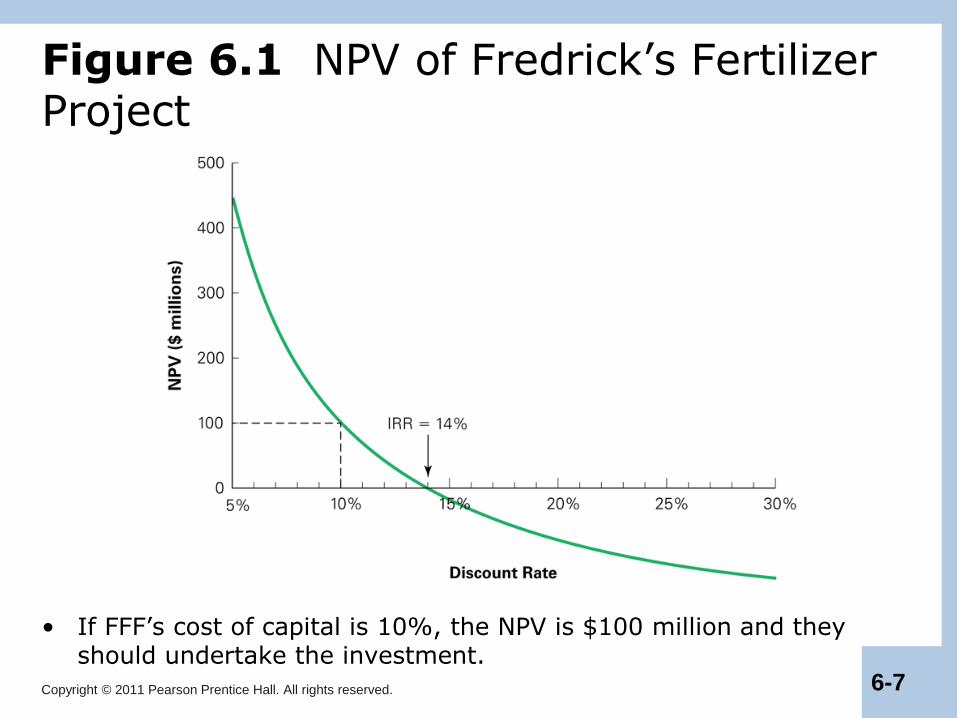
Figure 6.1 NPV of Fredrick’s Fertilizer Project
• If FFF’s cost of capital is 10%, the NPV is $100 million and they should undertake the investment.
Copyright © 2011 Pearson Prentice Hall. All rights reserved. 6-8
Alternative Rules Versus the NPV Rule
• Sometimes alternative investment rules may give the same answer as the NPV rule, but at other times they may disagree.
– When the rules conflict, the NPV decision rule should be followed.
Copyright © 2011 Pearson Prentice Hall. All rights reserved. 6-9
6.2 The Internal Rate of Return Rule
• Internal Rate of Return (IRR) Investment Rule
– Take any investment where the IRR exceeds the cost of capital. Turn down any investment whose IRR is less than the cost of capital.
Copyright © 2011 Pearson Prentice Hall. All rights reserved. 6-10
The Internal Rate of Return Rule (cont'd)
• The IRR Investment Rule will give the same answer as the NPV rule in many, but not all, situations.
• In general, the IRR rule works for a stand-alone project if all of the project’s negative cash flows precede its positive cash flows.
– In Figure 6.1, whenever the cost of capital is below the IRR of 14%, the project has a positive NPV and you should undertake the investment.
Copyright © 2011 Pearson Prentice Hall. All rights reserved. 6-11
Applying The IRR Rule
• In other cases, the IRR rule may disagree with the NPV rule and thus be incorrect.
– Situations where the IRR rule and NPV rule may be in conflict:
• Delayed Investments
• Nonexistent IRR
• Multiple IRRs
Copyright © 2011 Pearson Prentice Hall. All rights reserved. 6-12
Applying The IRR Rule (cont'd)
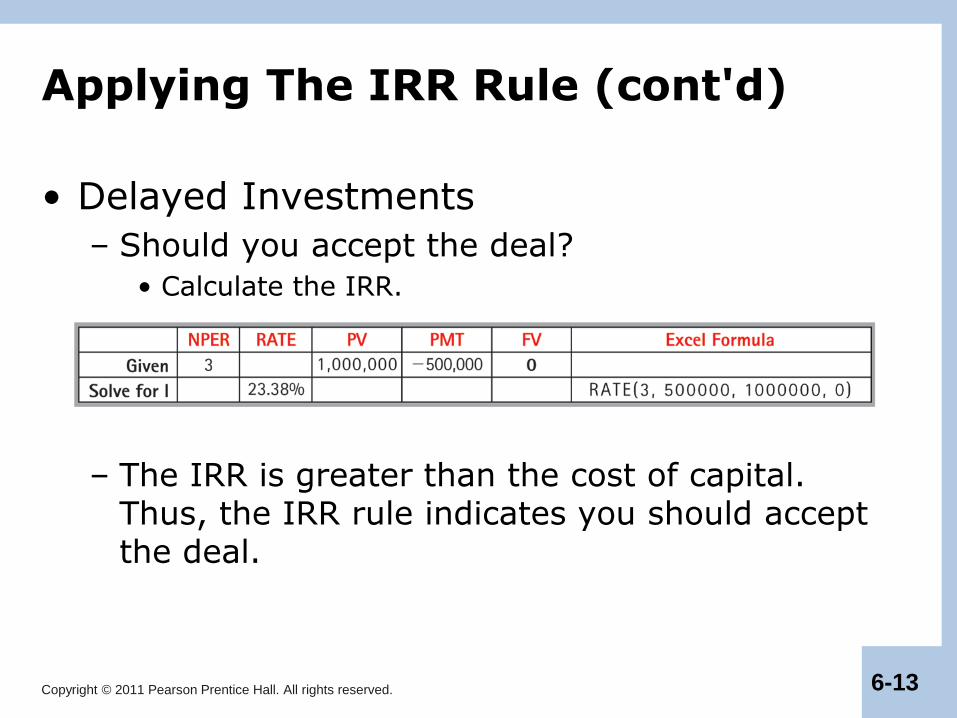
• Delayed Investments
– Assume you have just retired as the CEO of a successful company. A major publisher has offered you a book deal. The publisher will pay you $1 million upfront if you agree to write a book about your experiences. You estimate that it will take three years to write the book. The time you spend writing will cause you to give up speaking engagements amounting to $500,000 per year. You estimate your opportunity cost to be 10%.
Copyright © 2011 Pearson Prentice Hall. All rights reserved. 6-13
Applying The IRR Rule (cont'd)
• Delayed Investments
– Should you accept the deal?
• Calculate the IRR.
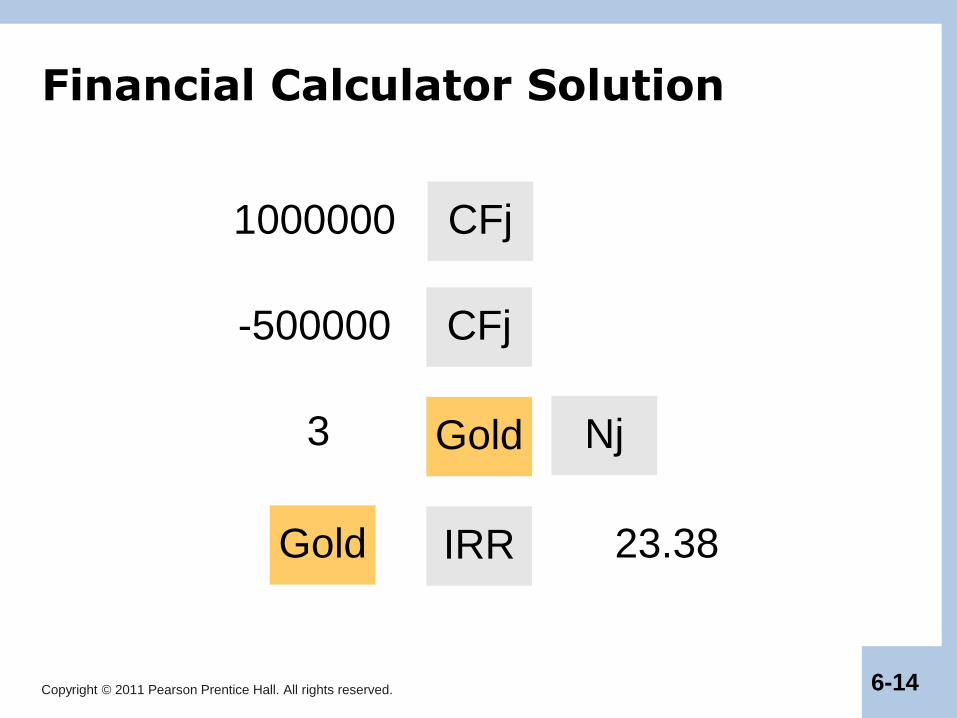
– The IRR is greater than the cost of capital. Thus, the IRR rule indicates you should accept the deal.
Copyright © 2011 Pearson Prentice Hall. All rights reserved. 6-14
CFj1000000
Gold
-500000 CFj
3
IRRGold 23.38
Nj
Financial Calculator Solution
Copyright © 2011 Pearson Prentice Hall. All rights reserved. 6-15
Applying The IRR Rule (cont'd)
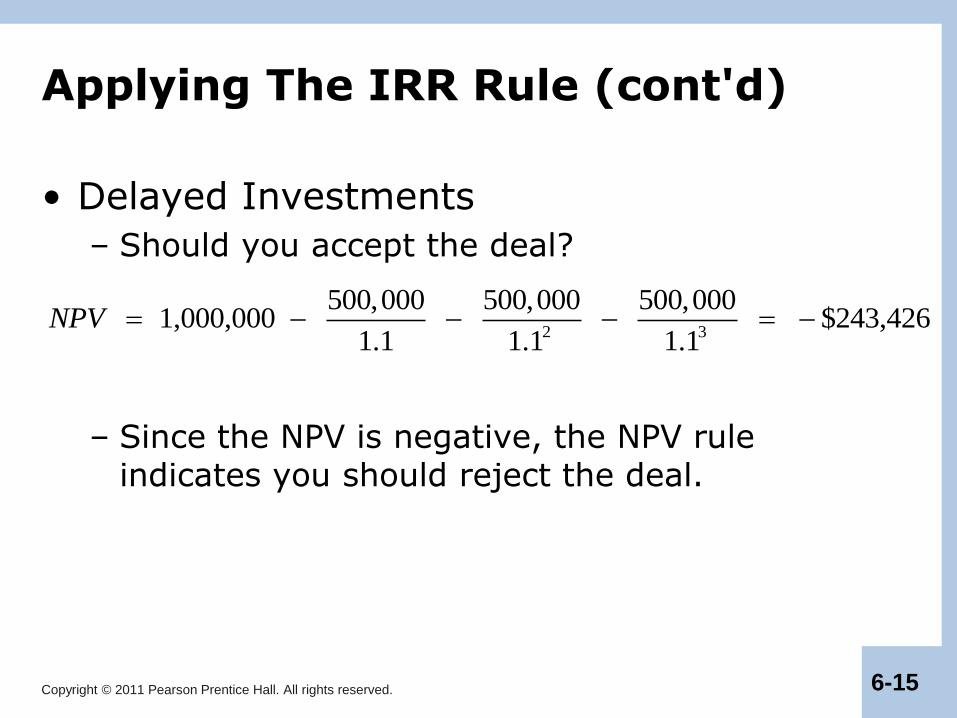
• Delayed Investments
– Should you accept the deal?
– Since the NPV is negative, the NPV rule indicates you should reject the deal.
2 3
500,000 500,000 500,000 1,000,000 $243,426
1.1 1.1 1.1 NPV
Copyright © 2011 Pearson Prentice Hall. All rights reserved. 6-16
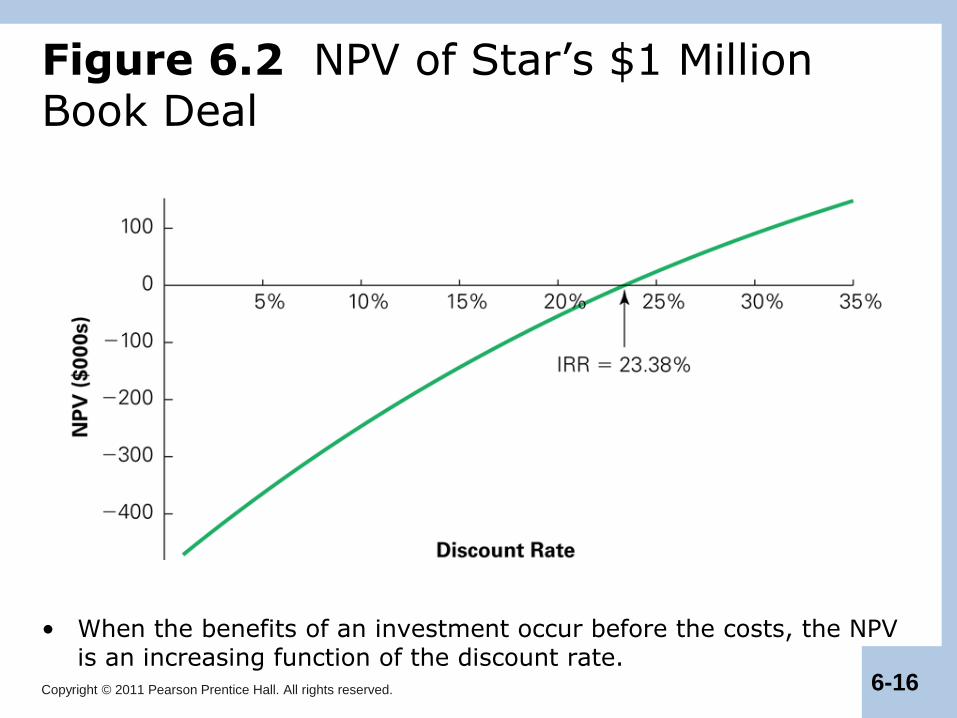
Figure 6.2 NPV of Star’s $1 Million Book Deal
• When the benefits of an investment occur before the costs, the NPV is an increasing function of the discount rate.
Copyright © 2011 Pearson Prentice Hall. All rights reserved. 6-17
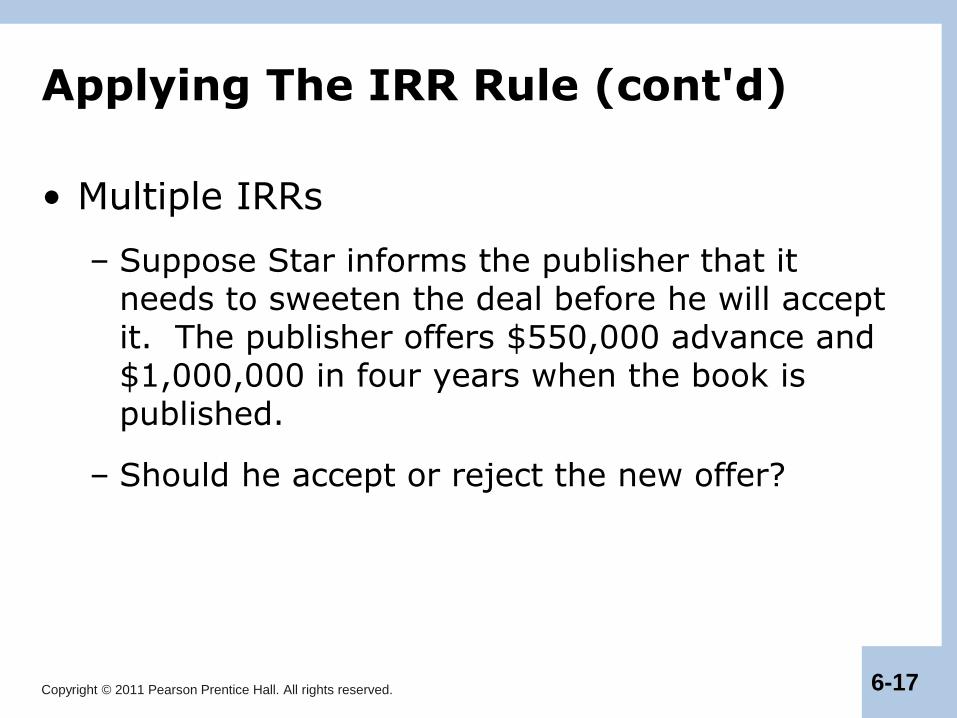
Applying The IRR Rule (cont'd)
• Multiple IRRs
– Suppose Star informs the publisher that it needs to sweeten the deal before he will accept it. The publisher offers $550,000 advance and $1,000,000 in four years when the book is published.
– Should he accept or reject the new offer?
Copyright © 2011 Pearson Prentice Hall. All rights reserved. 6-18
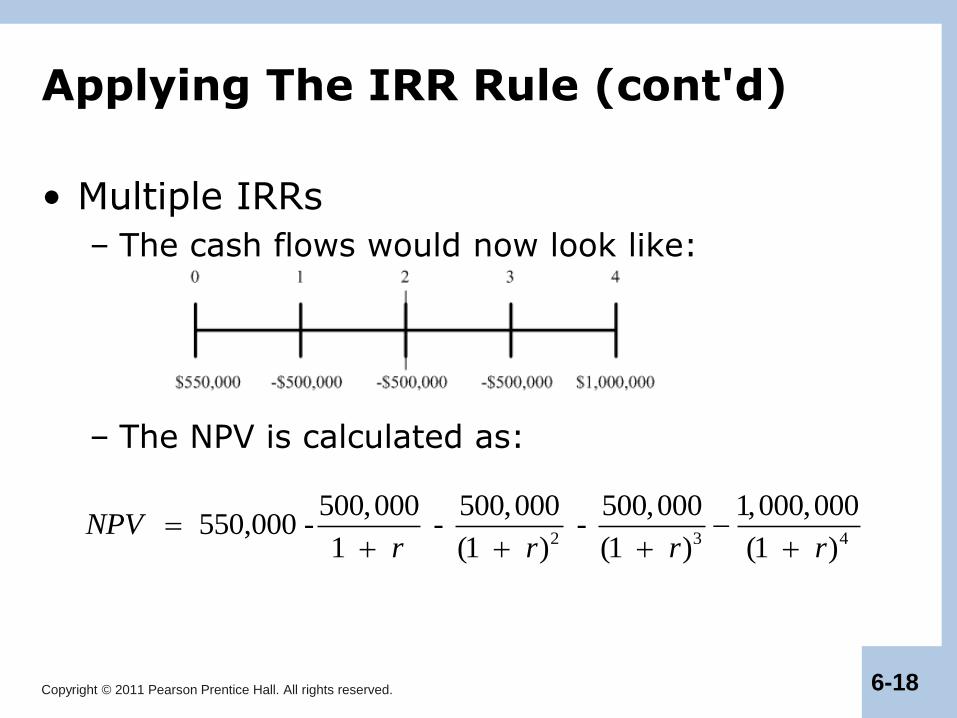
Applying The IRR Rule (cont'd)
• Multiple IRRs
– The cash flows would now look like:
– The NPV is calculated as:
2 3 4
500,000 500,000 500,000 1,000,000 550,000 - - -
1 (1 ) (1 ) (1 )NPV
r r r r
Copyright © 2011 Pearson Prentice Hall. All rights reserved. 6-19
Applying The IRR Rule (cont'd)
• Multiple IRRs
– By setting the NPV equal to zero and solving for r, we find the IRR. In this case, there are two IRRs: 7.164% and 33.673%. Because there is more than one IRR, the IRR rule cannot be applied.
Copyright © 2011 Pearson Prentice Hall. All rights reserved. 6-20
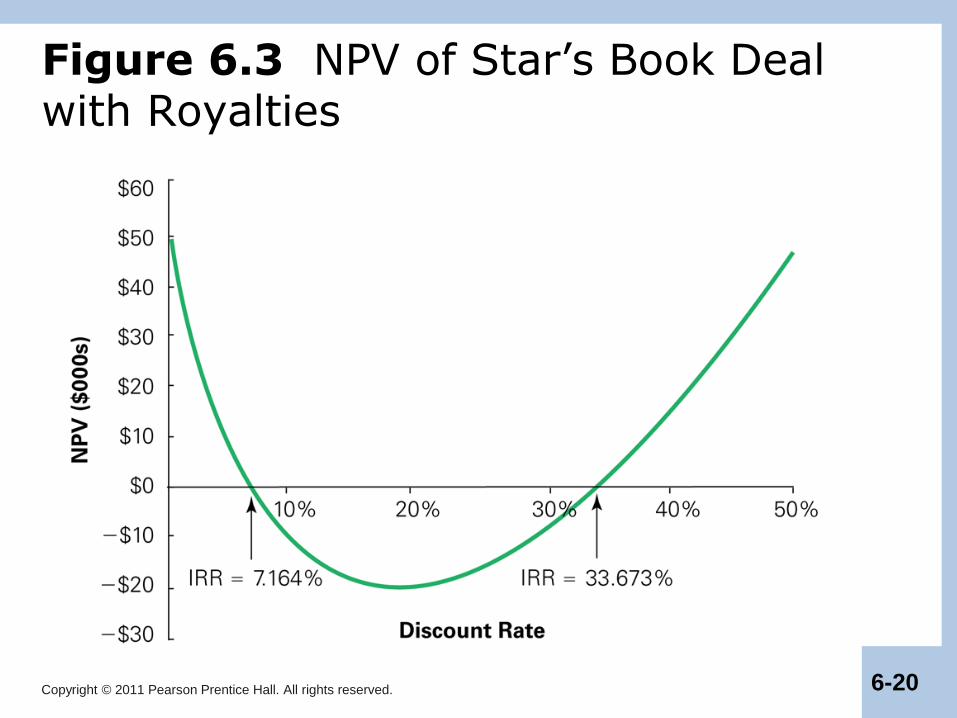
Figure 6.3 NPV of Star’s Book Deal with Royalties
Copyright © 2011 Pearson Prentice Hall. All rights reserved. 6-21
Applying The IRR Rule (cont'd)
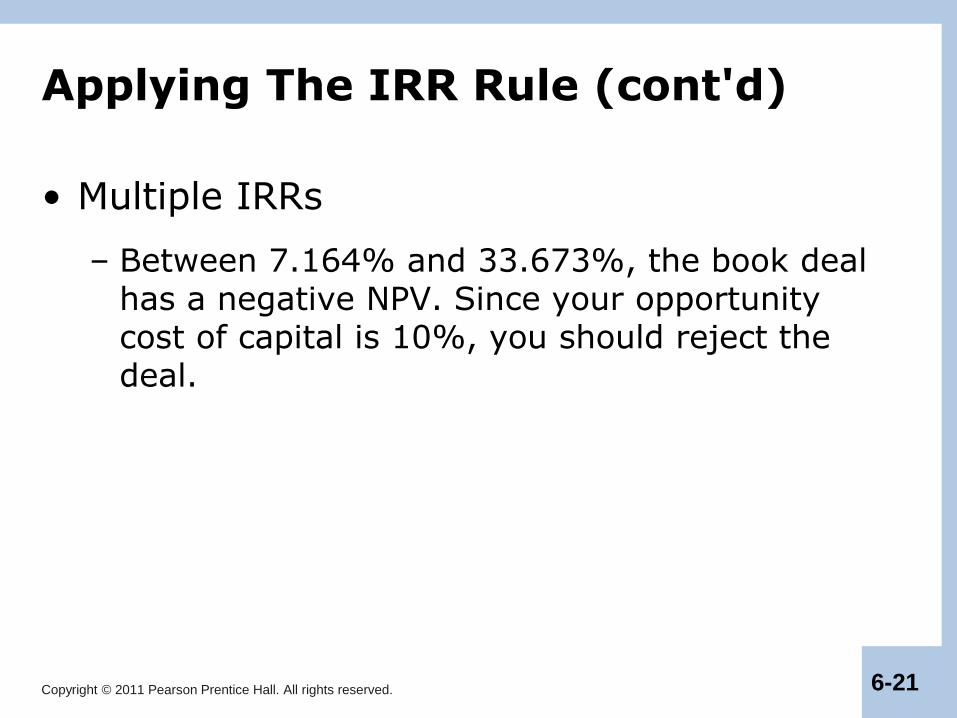
• Multiple IRRs
– Between 7.164% and 33.673%, the book deal has a negative NPV. Since your opportunity cost of capital is 10%, you should reject the deal.
Copyright © 2011 Pearson Prentice Hall. All rights reserved. 6-22
Applying The IRR Rule (cont'd)
• Nonexistent IRR
– Finally, Star is able to get the publisher to increase his advance to $750,000, in addition to the $1 million when the book is published in four years. With these cash flows, no IRR exists; there is no discount rate that makes NPV equal to zero.
Copyright © 2011 Pearson Prentice Hall. All rights reserved. 6-23
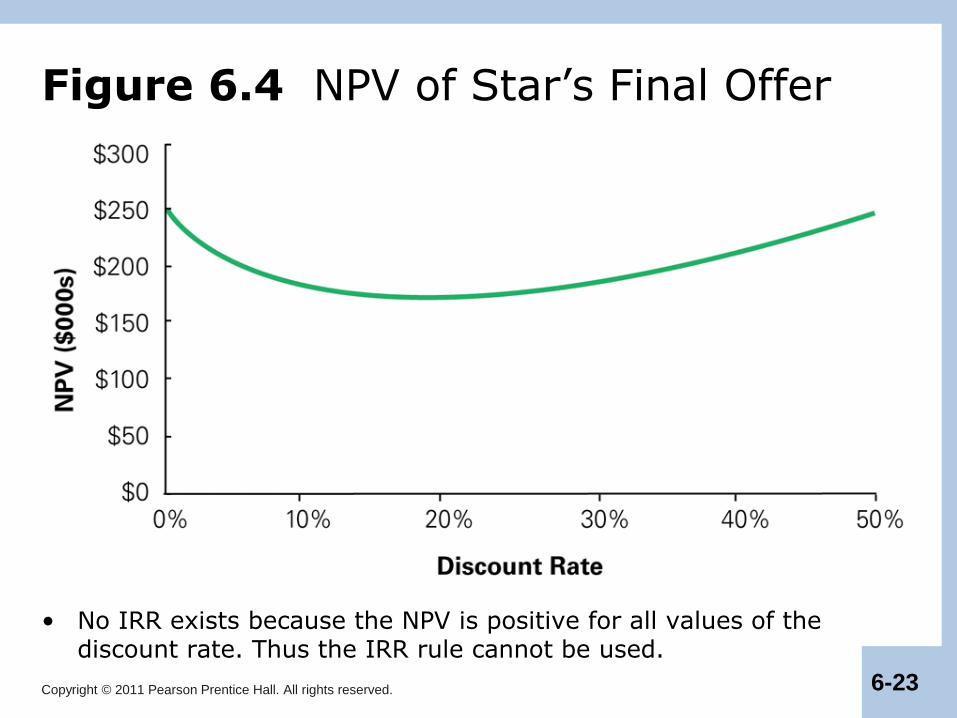
Figure 6.4 NPV of Star’s Final Offer
• No IRR exists because the NPV is positive for all values of the discount rate. Thus the IRR rule cannot be used.
Copyright © 2011 Pearson Prentice Hall. All rights reserved. 6-24
Applying The IRR Rule (cont'd)
• IRR Versus the IRR Rule
– While the IRR rule has shortcomings for making investment decisions, the IRR itself remains useful. IRR measures the average return of the investment and the sensitivity of the NPV to any estimation error in the cost of capital.
Copyright © 2011 Pearson Prentice Hall. All rights reserved. 6-25
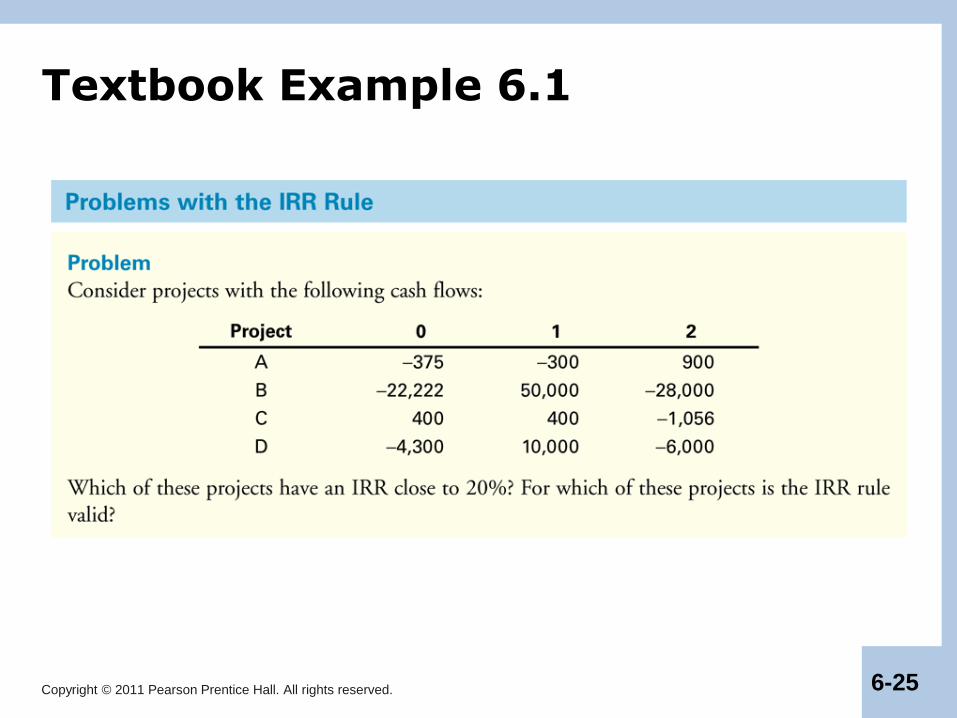
Textbook Example 6.1
Copyright © 2011 Pearson Prentice Hall. All rights reserved. 6-26
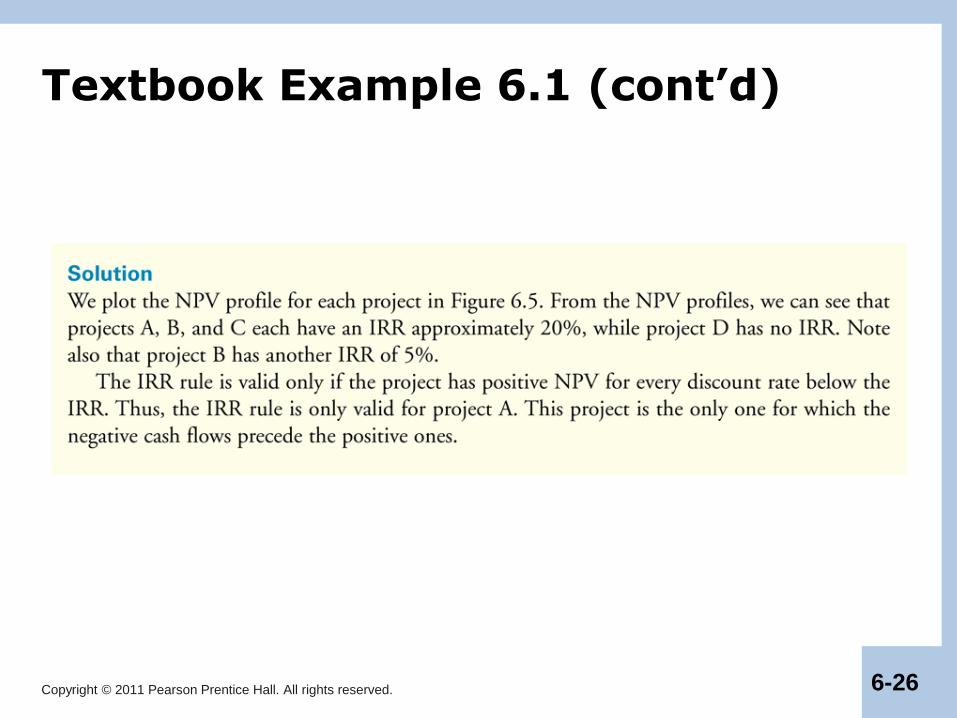
Textbook Example 6.1 (cont’d)
Copyright © 2011 Pearson Prentice Hall. All rights reserved. 6-27
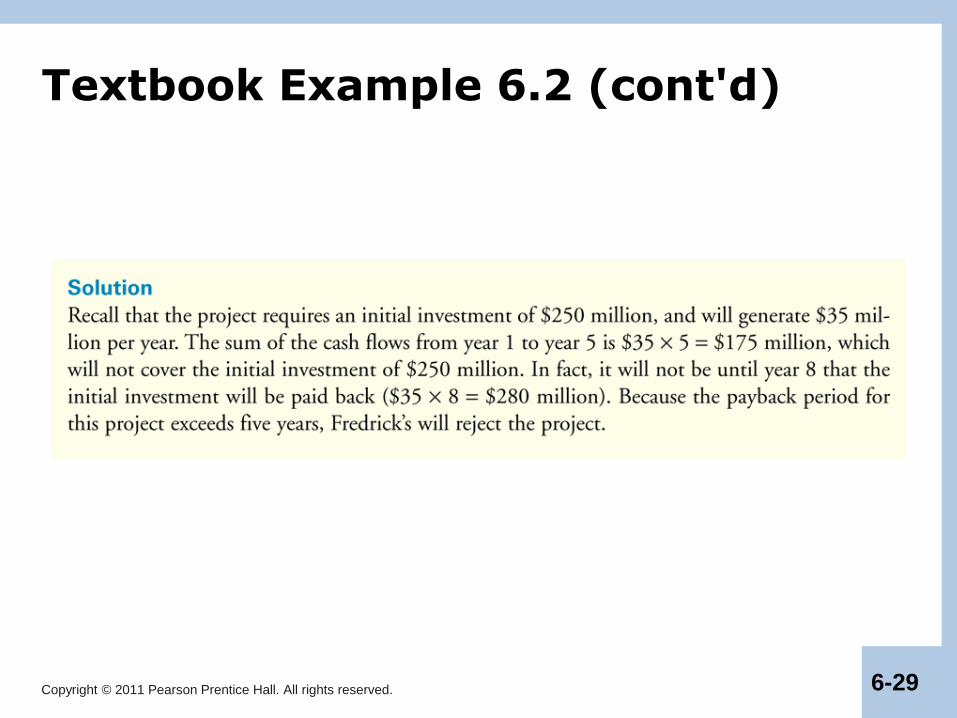
6.3 The Payback Rule
• The payback period is amount of time it takes to recover or pay back the initial investment. If the payback period is less than a pre-specified length of time, you accept the project. Otherwise, you reject the project.
– The payback rule is used by many companies because of its simplicity.
Copyright © 2011 Pearson Prentice Hall. All rights reserved. 6-28
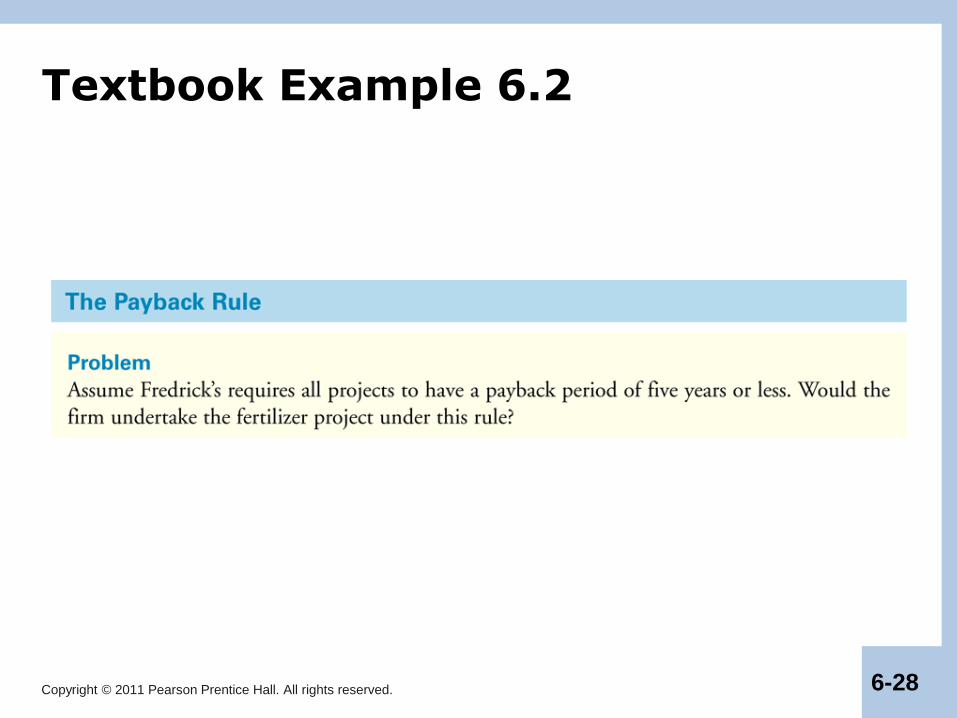
Textbook Example 6.2
Copyright © 2011 Pearson Prentice Hall. All rights reserved. 6-29
Textbook Example 6.2 (cont'd)
Copyright © 2011 Pearson Prentice Hall. All rights reserved. 6-30
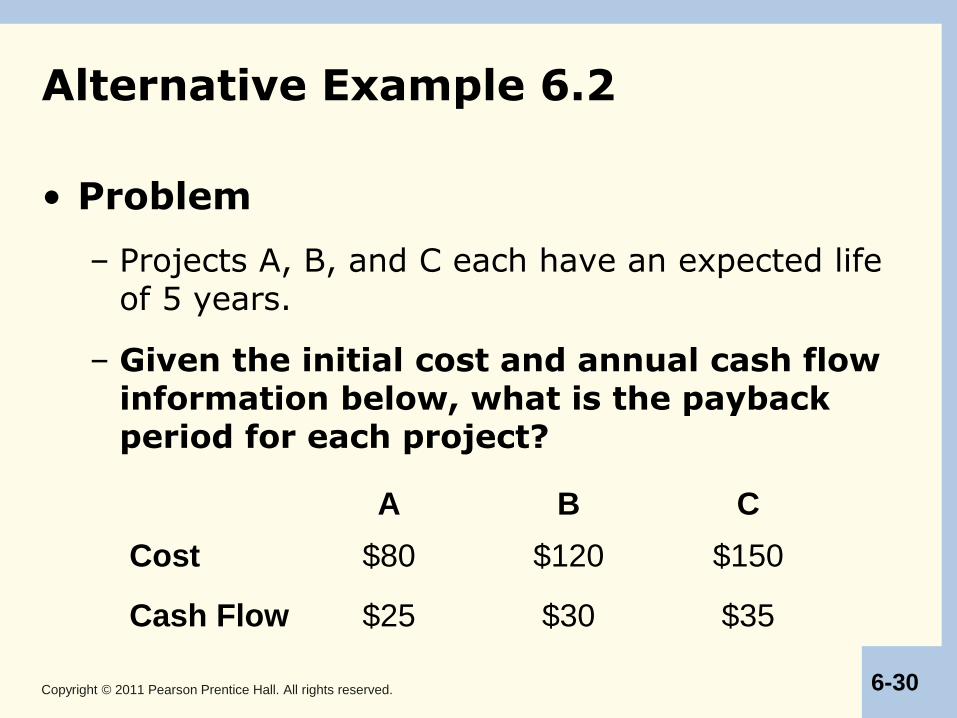
Alternative Example 6.2
• Problem
– Projects A, B, and C each have an expected life of 5 years.
– Given the initial cost and annual cash flow information below, what is the payback period for each project?
A B C
Cost $80 $120 $150
Cash Flow $25 $30 $35
Copyright © 2011 Pearson Prentice Hall. All rights reserved. 6-31
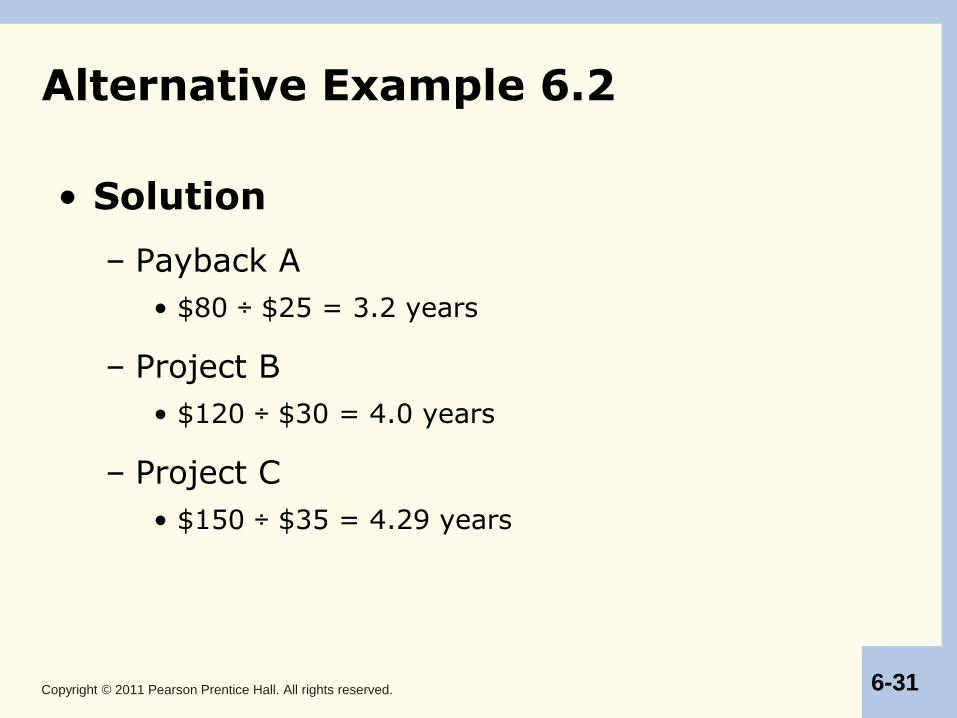
Alternative Example 6.2
• Solution
– Payback A
• $80 ÷ $25 = 3.2 years
– Project B
• $120 ÷ $30 = 4.0 years
– Project C
• $150 ÷ $35 = 4.29 years
Copyright © 2011 Pearson Prentice Hall. All rights reserved. 6-32
The Payback Rule (cont’d)
• Pitfalls:
– Ignores the project’s cost of capital and time value of money.
– Ignores cash flows after the payback period.
– Relies on an ad hoc decision criterion.
Copyright © 2011 Pearson Prentice Hall. All rights reserved. 6-33
6.4 Choosing Between Projects
• Mutually Exclusive Projects
– When you must choose only one project among several possible projects, the choice is mutually exclusive.
– NPV Rule
• Select the project with the highest NPV.
– IRR Rule
• Selecting the project with the highest IRR may lead to mistakes.
Copyright © 2011 Pearson Prentice Hall. All rights reserved. 6-34
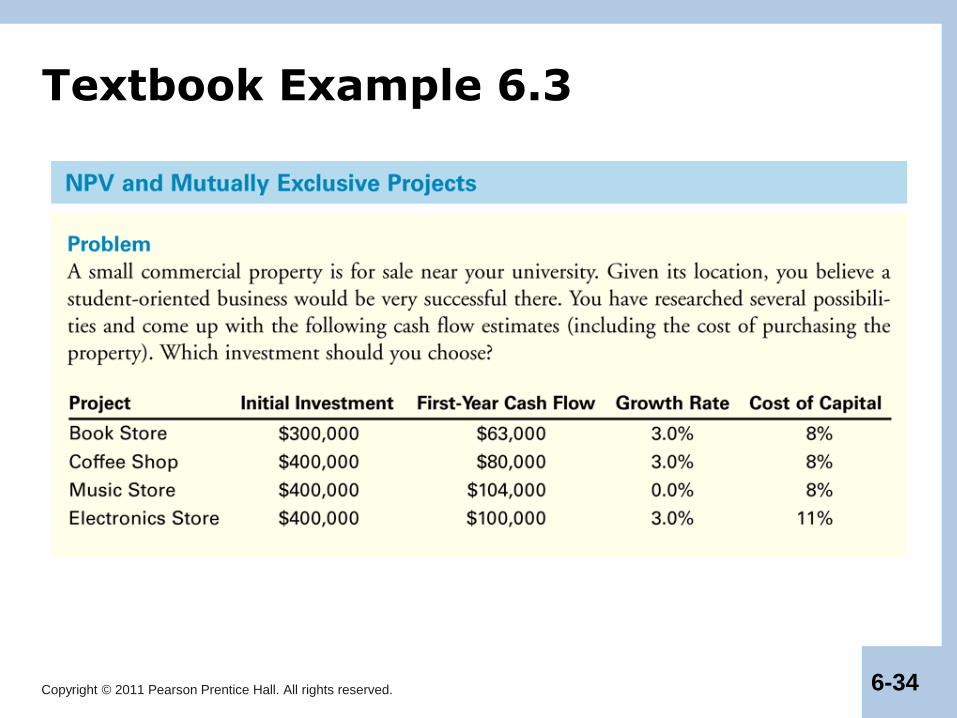
Textbook Example 6.3
Copyright © 2011 Pearson Prentice Hall. All rights reserved. 6-35
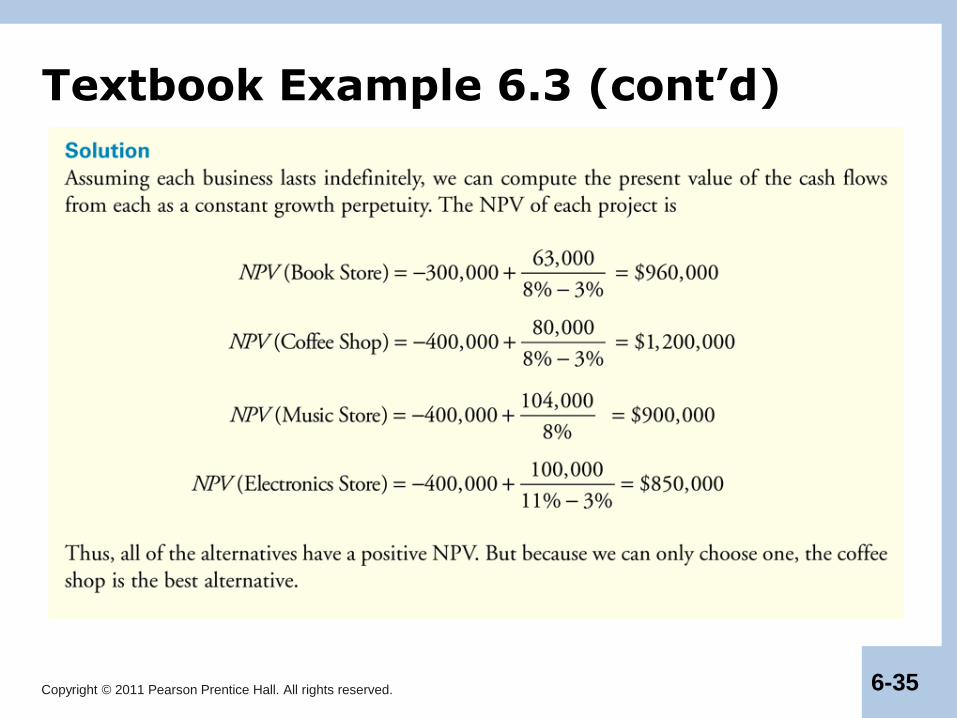
Textbook Example 6.3 (cont’d)
Copyright © 2011 Pearson Prentice Hall. All rights reserved. 6-36
IRR Rule and Mutually Exclusive Investments: Differences in Scale
• If a project’s size is doubled, its NPV will double. This is not the case with IRR. Thus, the IRR rule cannot be used to compare projects of different scales.
Copyright © 2011 Pearson Prentice Hall. All rights reserved. 6-37
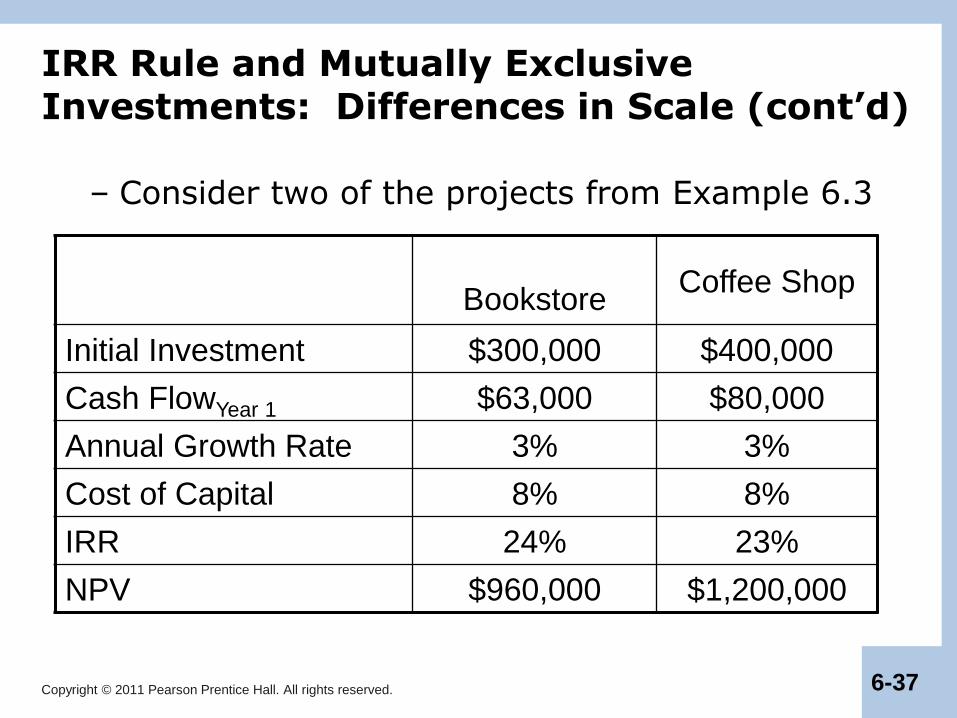
IRR Rule and Mutually Exclusive Investments: Differences in Scale (cont’d)
– Consider two of the projects from Example 6.3
Bookstore Coffee Shop
Initial Investment $300,000 $400,000
Cash FlowYear 1 $63,000 $80,000
Annual Growth Rate 3% 3%
Cost of Capital 8% 8%
IRR 24% 23%
NPV $960,000 $1,200,000
Copyright © 2011 Pearson Prentice Hall. All rights reserved. 6-38
IRR Rule and Mutually Exclusive Investments: Timing of Cash Flows
• Another problem with the IRR is that it can be affected by changing the timing of the cash flows, even when the scale is the same.
– IRR is a return, but the dollar value of earning a given return depends on how long the return is earned.
• Consider again the coffee shop and the music store investment in Example 6.3. Both have the same initial scale and the same horizon. The coffee shop has a lower IRR, but a higher NPV because of its higher growth rate.
Copyright © 2011 Pearson Prentice Hall. All rights reserved. 6-39
IRR Rule and Mutually Exclusive Investments: Differences in Risk
• An IRR that is attractive for a safe project need not be attractive for a riskier project.
• Consider the investment in the electronics store from Example 6.3. The IRR is higher than those of the other investment opportunities, yet the NPV is the lowest.
• The higher cost of capital means a higher IRR is necessary to make the project attractive.
Copyright © 2011 Pearson Prentice Hall. All rights reserved. 6-40
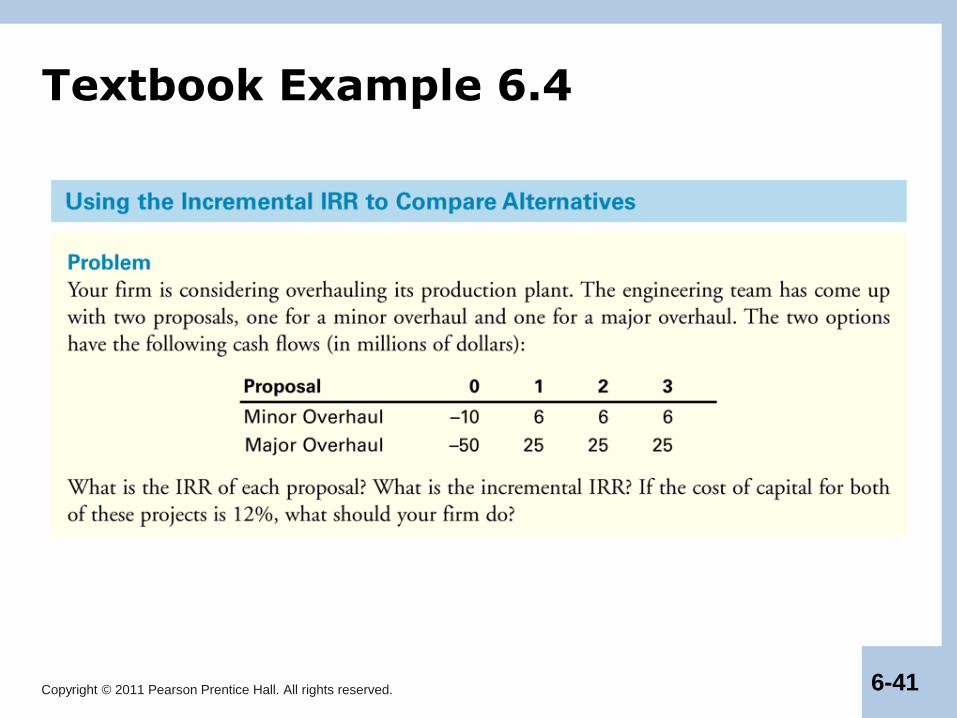
The Incremental IRR Rule
• Incremental IRR Investment Rule
– Apply the IRR rule to the difference between the cash flows of the two mutually exclusive alternatives (the increment to the cash flows of one investment over the other).
Copyright © 2011 Pearson Prentice Hall. All rights reserved. 6-41
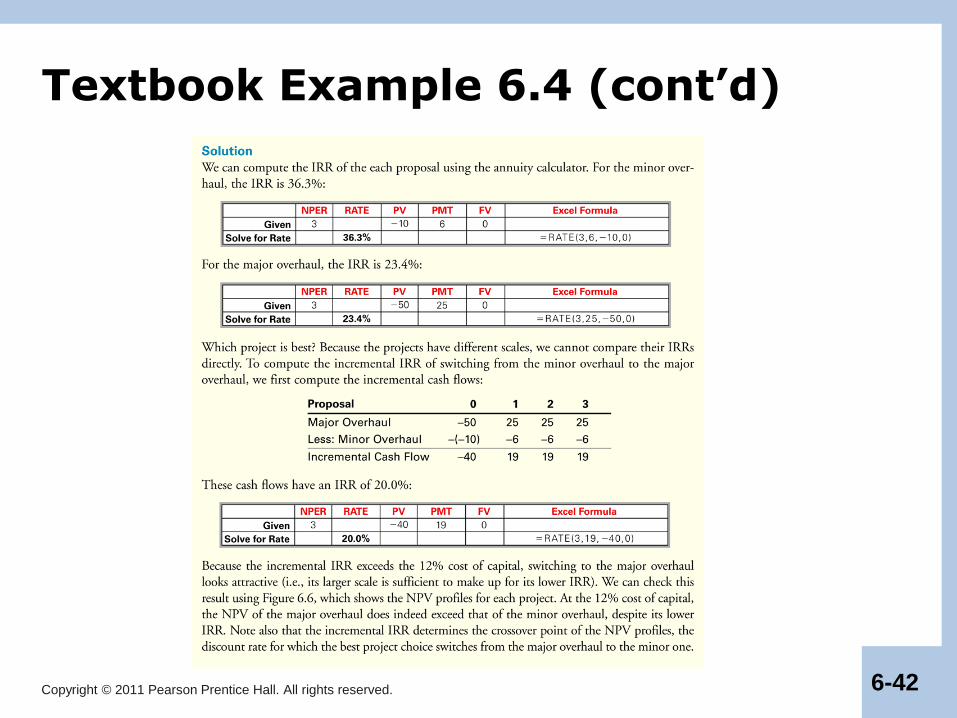
Textbook Example 6.4
Copyright © 2011 Pearson Prentice Hall. All rights reserved. 6-42
Textbook Example 6.4 (cont’d)

Copyright © 2011 Pearson Prentice Hall. All rights reserved. 6-43
Comparison of Minor and Major Overhauls
Figure 6.5 NPV Profiles for Example 6.1
Copyright © 2011 Pearson Prentice Hall. All rights reserved. 6-44
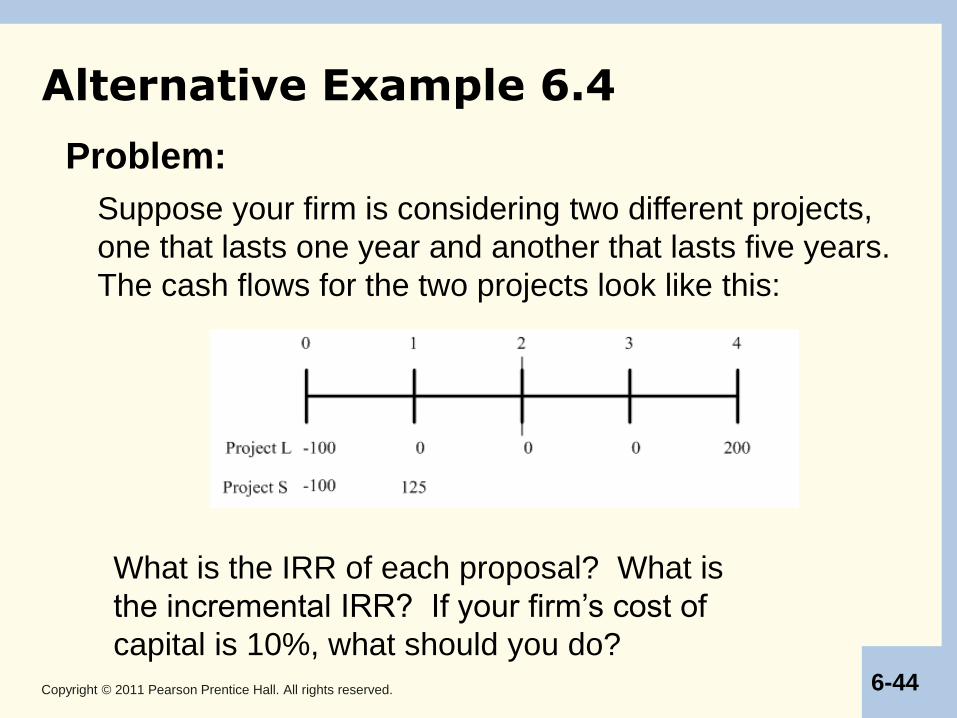
Alternative Example 6.4
Suppose your firm is considering two different projects,
one that lasts one year and another that lasts five years.
The cash flows for the two projects look like this:
What is the IRR of each proposal? What is
the incremental IRR? If your firm’s cost of
capital is 10%, what should you do?
Problem:
Copyright © 2011 Pearson Prentice Hall. All rights reserved. 6-45
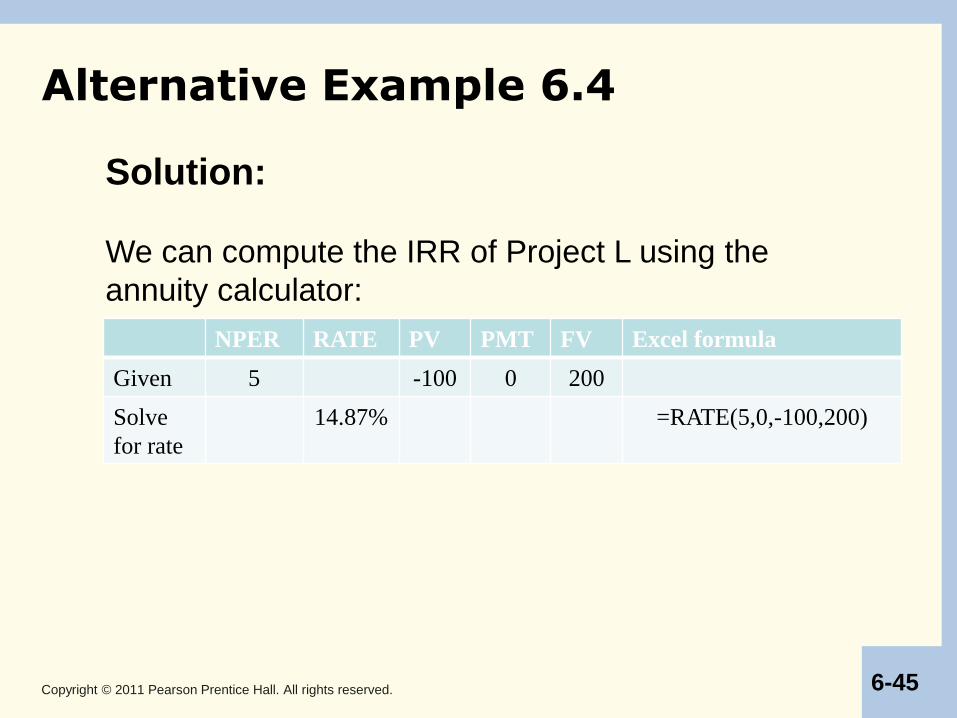
Alternative Example 6.4
Solution:
We can compute the IRR of Project L using the
annuity calculator:
NPER RATE PV PMT FV Excel formula
Given 5 -100 0 200
Solve
for rate
14.87% =RATE(5,0,-100,200)
Copyright © 2011 Pearson Prentice Hall. All rights reserved. 6-46
Alternative Example 6.4 (cont’d)
Solution (cont’d):
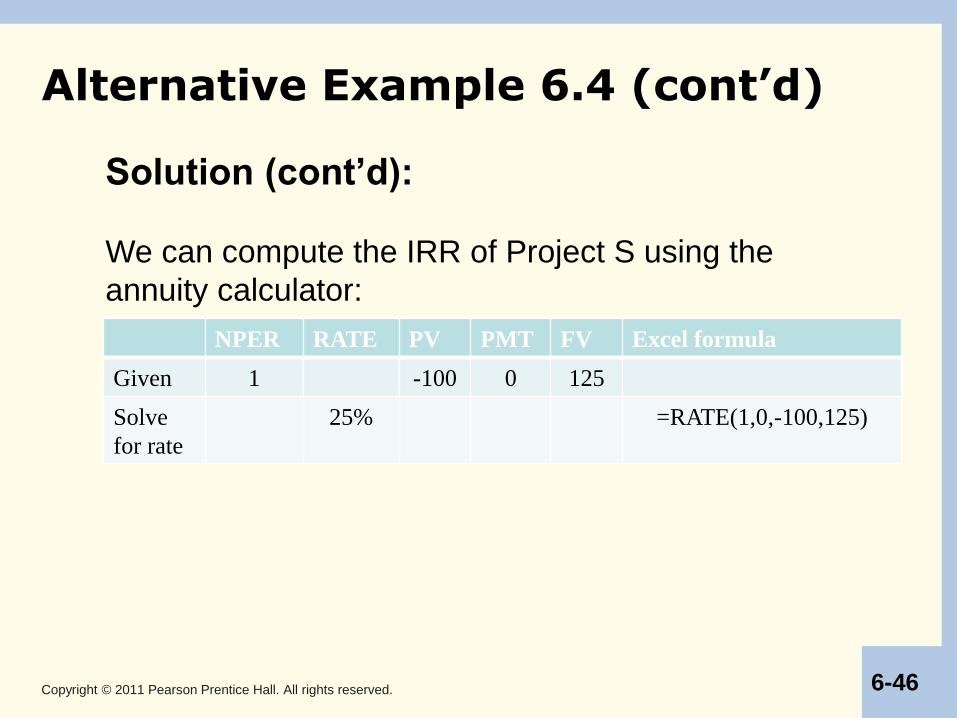
We can compute the IRR of Project S using the
annuity calculator:
NPER RATE PV PMT FV Excel formula
Given 1 -100 0 125
Solve
for rate
25% =RATE(1,0,-100,125)
Copyright © 2011 Pearson Prentice Hall. All rights reserved. 6-47
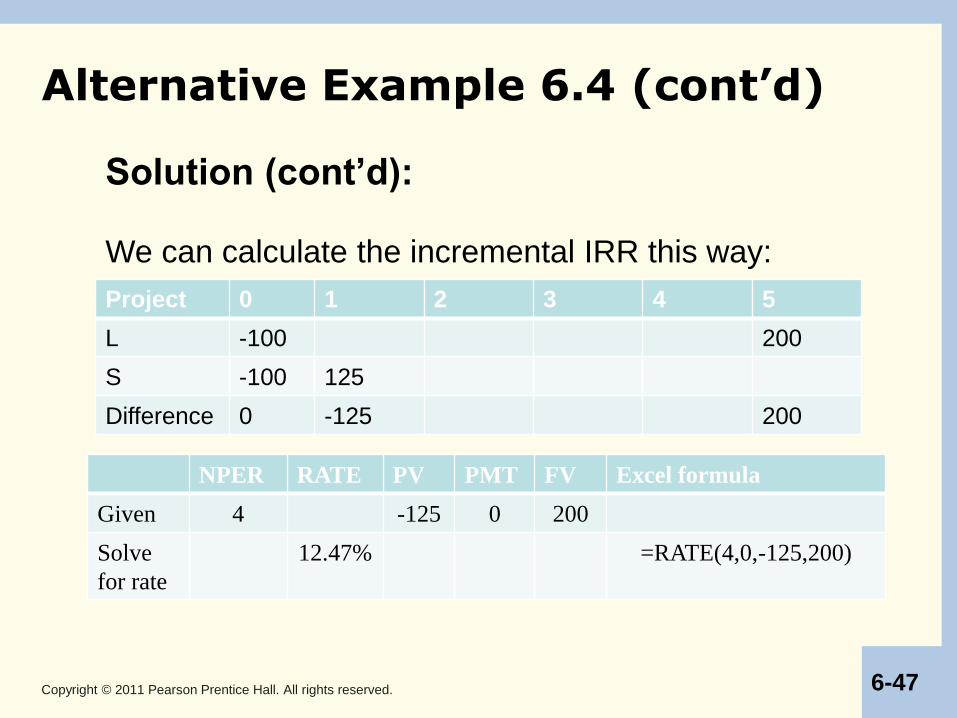
Alternative Example 6.4 (cont’d)
Solution (cont’d):
We can calculate the incremental IRR this way:
NPER RATE PV PMT FV Excel formula
Given 4 -125 0 200
Solve
for rate
12.47% =RATE(4,0,-125,200)
Project 0 1 2 3 4 5
L -100 200
S -100 125
Difference 0 -125 200
Copyright © 2011 Pearson Prentice Hall. All rights reserved. 6-48
Alternative Example 6.4 (cont’d)
Solution (cont’d)
Because the 12.47% incremental IRR is bigger
than the cost of capital of 10%, the long-term
project is better than the short-term project, even
though the short-term project has a higher IRR.
Copyright © 2011 Pearson Prentice Hall. All rights reserved. 6-49
The Incremental IRR Rule (cont'd)
• Shortcomings of the Incremental IRR Rule
– The incremental IRR may not exist.
– Multiple incremental IRRs could exist.
– The fact that the IRR exceeds the cost of capital for both projects does not imply that either project has a positive NPV.
– When individual projects have different costs of capital, it is not obvious which cost of capital the incremental IRR should be compared to.
Copyright © 2011 Pearson Prentice Hall. All rights reserved. 6-50
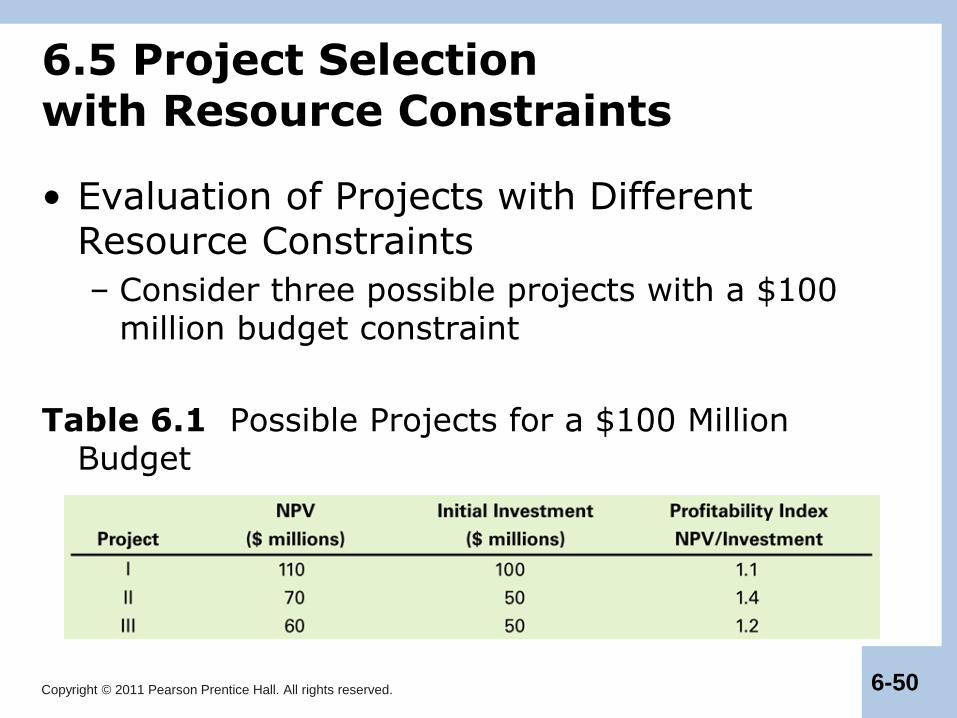
6.5 Project Selection with Resource Constraints
• Evaluation of Projects with Different Resource Constraints
– Consider three possible projects with a $100 million budget constraint
Table 6.1 Possible Projects for a $100 Million Budget
Copyright © 2011 Pearson Prentice Hall. All rights reserved. 6-51
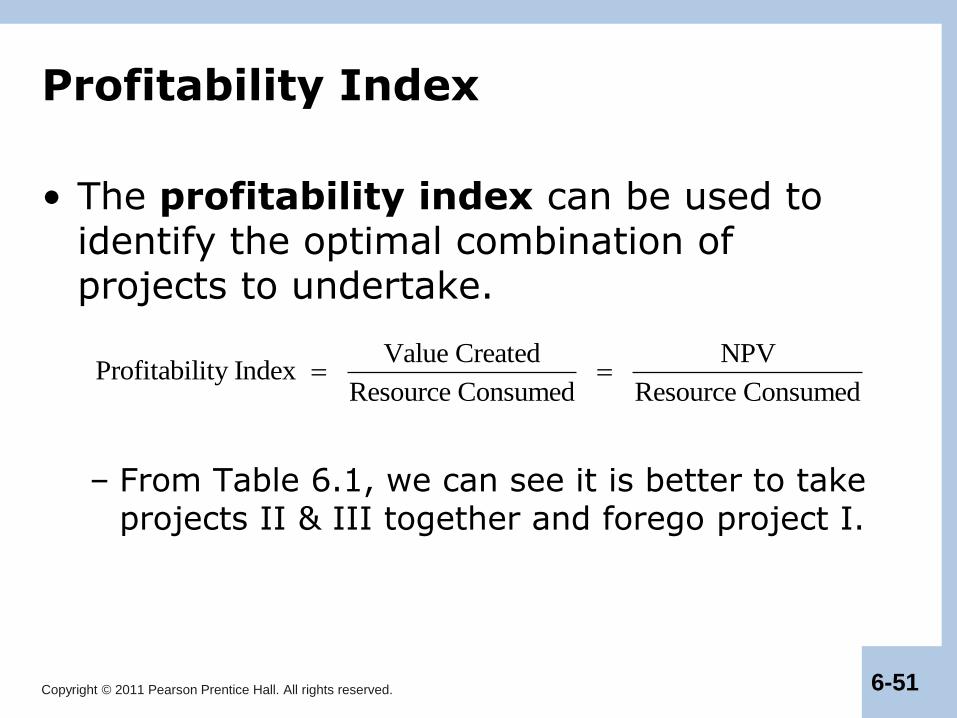
Profitability Index
• The profitability index can be used to identify the optimal combination of projects to undertake.
– From Table 6.1, we can see it is better to take projects II & III together and forego project I.
Value Created NPVProfitability Index
Resource Consumed Resource Consumed
Copyright © 2011 Pearson Prentice Hall. All rights reserved. 6-52
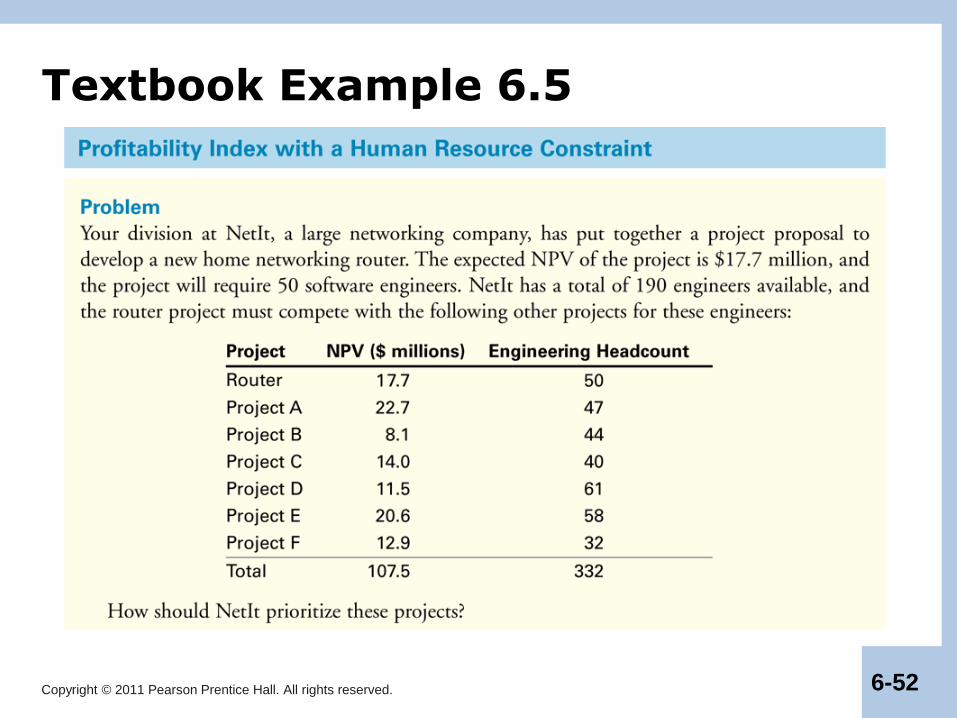
Textbook Example 6.5
Copyright © 2011 Pearson Prentice Hall. All rights reserved. 6-53
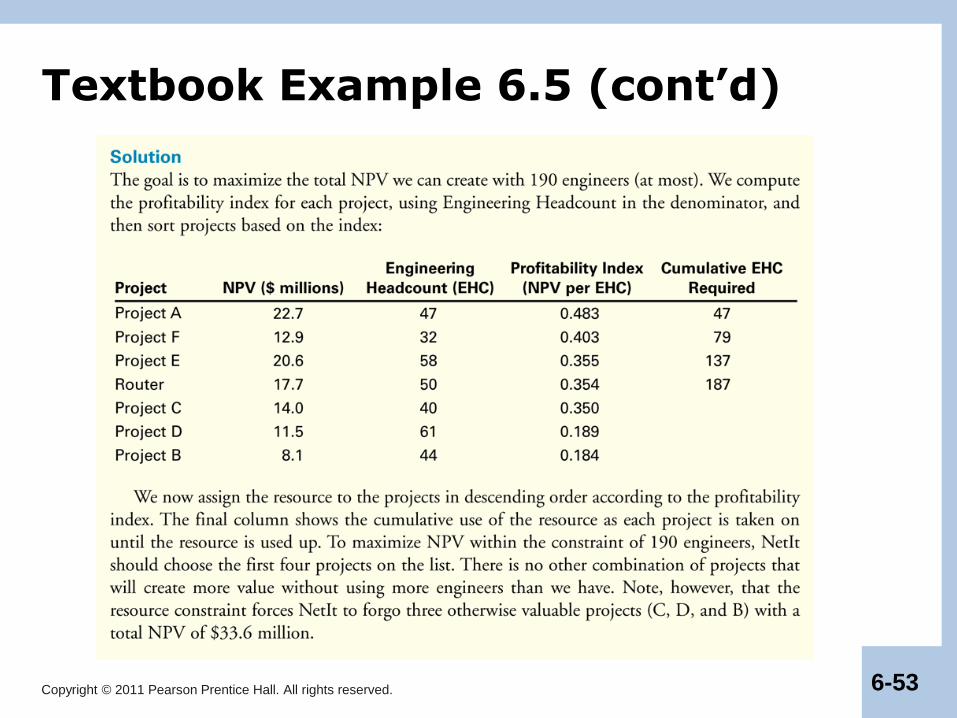
Textbook Example 6.5 (cont’d)
Copyright © 2011 Pearson Prentice Hall. All rights reserved. 6-54
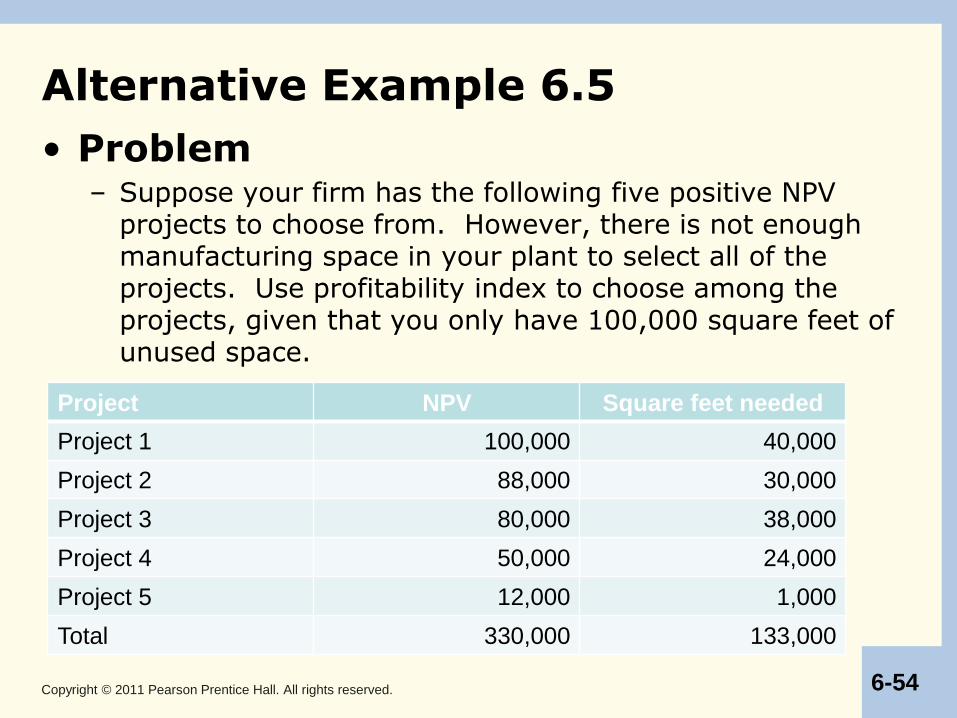
Alternative Example 6.5
• Problem – Suppose your firm has the following five positive NPV
projects to choose from. However, there is not enough manufacturing space in your plant to select all of the projects. Use profitability index to choose among the projects, given that you only have 100,000 square feet of unused space.
Project NPV Square feet needed
Project 1 100,000 40,000
Project 2 88,000 30,000
Project 3 80,000 38,000
Project 4 50,000 24,000
Project 5 12,000 1,000
Total 330,000 133,000
Copyright © 2011 Pearson Prentice Hall. All rights reserved. 6-55
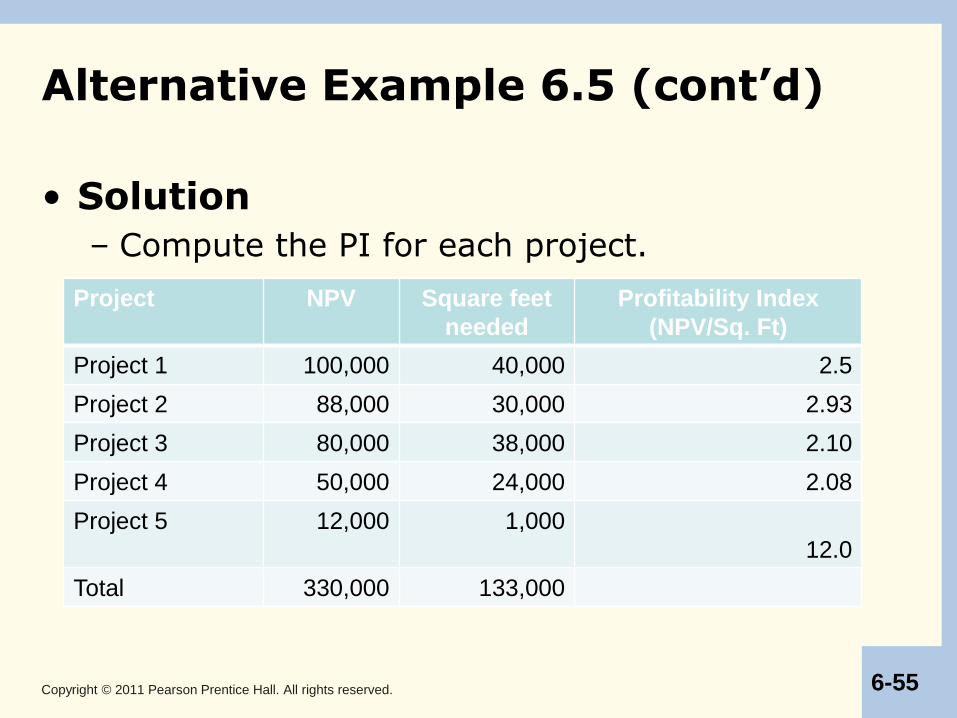
Alternative Example 6.5 (cont’d)
• Solution
– Compute the PI for each project.
Project NPV Square feet
needed
Profitability Index
(NPV/Sq. Ft)
Project 1 100,000 40,000 2.5
Project 2 88,000 30,000 2.93
Project 3 80,000 38,000 2.10
Project 4 50,000 24,000 2.08
Project 5 12,000 1,000
12.0
Total 330,000 133,000
Copyright © 2011 Pearson Prentice Hall. All rights reserved. 6-56
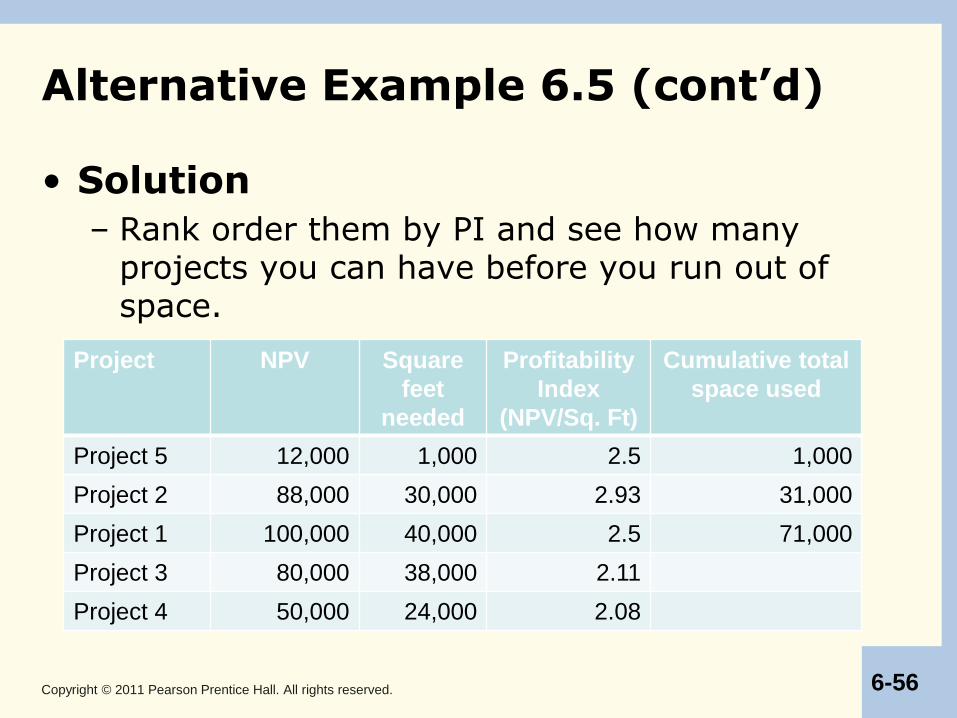
Alternative Example 6.5 (cont’d)
• Solution
– Rank order them by PI and see how many projects you can have before you run out of space.
Project NPV Square
feet
needed
Profitability
Index
(NPV/Sq. Ft)
Cumulative total
space used
Project 5 12,000 1,000 2.5 1,000
Project 2 88,000 30,000 2.93 31,000
Project 1 100,000 40,000 2.5 71,000
Project 3 80,000 38,000 2.11
Project 4 50,000 24,000 2.08
Copyright © 2011 Pearson Prentice Hall. All rights reserved. 6-57
Shortcomings of the Profitability Index
• In some situations the profitability Index does not give an accurate answer.
– Suppose in Example 6.4 that NetIt has an additional small project with a NPV of only $120,000 that requires 3 engineers. The profitability index in this case is 0.1 2/ 3 = 0.04, so this project would appear at the bottom of the ranking. However, 3 of the 190 employees are not being used after the first four projects are selected. As a result, it would make sense to take on this project even though it would be ranked last.
Copyright © 2011 Pearson Prentice Hall. All rights reserved. 6-58
Shortcomings of the Profitability Index (cont'd)
• With multiple resource constraints, the profitability index can break down completely.
Copyright © 2011 Pearson Prentice Hall. All rights reserved. 6-59
Discussion of Data Case Key Topic
• On February 9, 2006, XM Satellite announced a three-year, $55 million deal with Oprah Winfrey. The announcement stated that “Oprah & Friends,” a new channel on XM, would begin broadcasting in September 2006. What was the change in XM’s market value from January 30, 2006 through February 10, 2006? Does the $55 million investment appear to have been a good idea?
– http://www.msnbc.msn.com/id/11252743/
Copyright © 2011 Pearson Prentice Hall. All rights reserved. 6-60
Chapter Quiz
1. Explain the NPV rule for stand-alone projects.
2. If the IRR rule and the NPV rule lead to different
decisions for a stand-alone project, which should you
follow? Why?
3. For mutually exclusive projects, explain why picking
one project over another because it has a larger IRR
can lead to mistakes.
4. Explain why ranking projects according to their NPV
might not be optimal when you evaluate projects with
different resource requirements.
5. How can the profitability index be used to identify
attractive projects when there are resource
constraints?