
CHAPTER 6 EXPERIMENTAL...
17
59 CHAPTER 6 EXPERIMENTAL INVESTIGATION 6.1 GENERAL The compression engine basically works by the intake of air during the intake stroke. At part load condition, the fuel admitted inside the combustion chamber consumes a limited quantity of air and some quantity is left behind. But when the load is increased, the combustion process requires more and more quantity of air which is not readily available through the intake stroke. During this stage, the injected fuel is not fully oxidized resulting in low efficiency with the production of smoke to a large extent. During this period, the increased blend of algal oil methyl ester releases oxygen which takes part in the combustion process which is readily available within the blended fuel. The main objective of this research is to experimentally investigate the technical feasibility of AOME blends to be used in compression ignition engine. The AOME is blended with diesel at 5%, 10%, 15% and 20% ratios and ASTM methods were used to analyze the results of the investigation in detail. 6.2 DETAILS OF INVESTIGATION The AOME-Diesel are blended at 5%, 10%, 15% and 20% ratios to balance the content of oxygen present in AOME (5% to 9% of O 2 ) which leads to better combustion efficiency and lower emission formation. The ester
Transcript of CHAPTER 6 EXPERIMENTAL...

59
CHAPTER 6
EXPERIMENTAL INVESTIGATION
6.1 GENERAL
The compression engine basically works by the intake of air during
the intake stroke. At part load condition, the fuel admitted inside the
combustion chamber consumes a limited quantity of air and some quantity is
left behind. But when the load is increased, the combustion process requires
more and more quantity of air which is not readily available through the
intake stroke. During this stage, the injected fuel is not fully oxidized
resulting in low efficiency with the production of smoke to a large extent.
During this period, the increased blend of algal oil methyl ester releases
oxygen which takes part in the combustion process which is readily available
within the blended fuel. The main objective of this research is to
experimentally investigate the technical feasibility of AOME blends to be
used in compression ignition engine. The AOME is blended with diesel at
5%, 10%, 15% and 20% ratios and ASTM methods were used to analyze the
results of the investigation in detail.
6.2 DETAILS OF INVESTIGATION
The AOME-Diesel are blended at 5%, 10%, 15% and 20% ratios to
balance the content of oxygen present in AOME (5% to 9% of O2) which
leads to better combustion efficiency and lower emission formation. The ester

60
of AOME was identified as Hexadecanoic acid-methyl ester (Palmitic acid),
6,9,12,15 Docosatetraenoic acid Methyl ester (Linoleic acid), 16 Octadecenoic
acid methyl ester (Oleic acid), Heptadecanoic acid 16 methyl methyl (Stearic
acid) ester using spectral studies and confirmed using Infrared analysis.
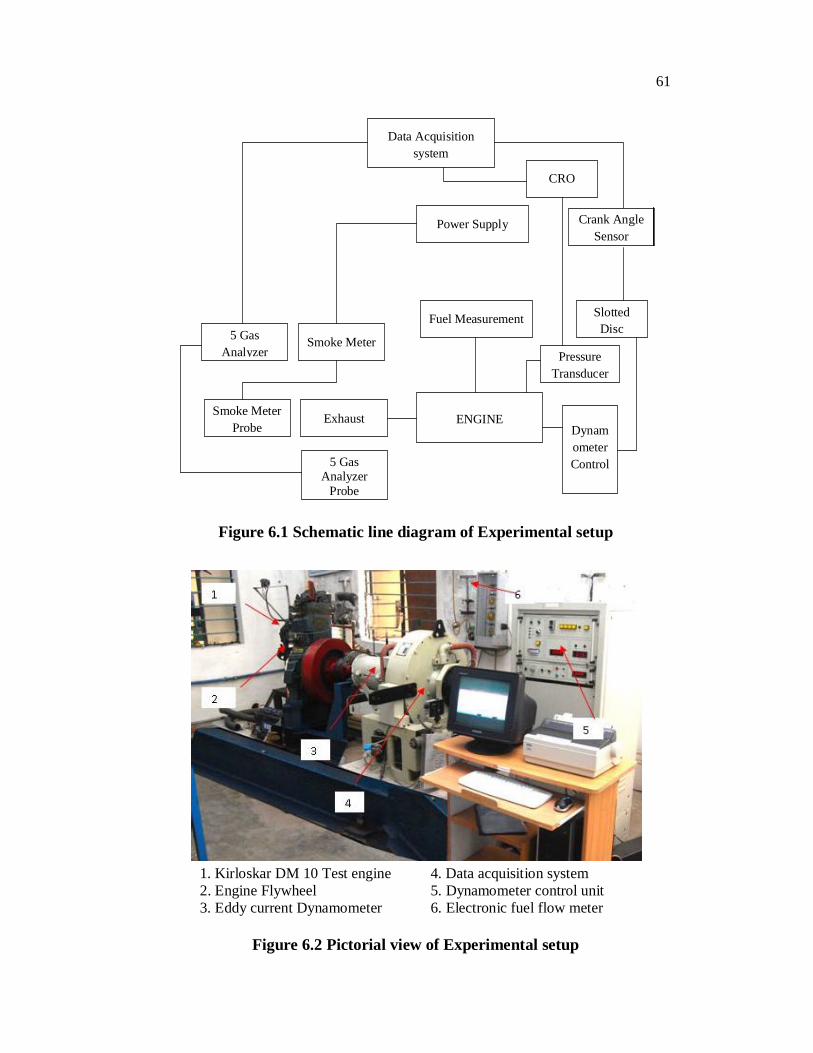
6.3 EXPERIMENTAL SETUP
A schematic layout of the experimental setup is shown in
Figure 6.1. The Figure 6.2 shows the photographic views of experimental
setup and sensors used for measurements. The specification of the engine is
tabulated in Table 6.1.
Table 6.1 Specification of engine
Name Description
Make and Model Kirloskar DM 10
Bore and Stroke 102 mm X 116 mm
Compression Ratio 17.5 : 1
Rated Speed 1500 rpm
Cubic Capacity 0.948 liters
Power 7.4 kW at 1500 rpm
Injection timing 26o bTDC
Injector opening pressure 210 bar
Valve timing
Inlet valve opening ( bTDC) 4.5 o
Inlet valve closing ( aTDC) 35.5 o
Exhaust valve opening (bTDC) 35.5 o
Exhaust valve closing (aTDC) 4.5 o
61
Figure 6.1 Schematic line diagram of Experimental setup
1. Kirloskar DM 10 Test engine 4. Data acquisition system 2. Engine Flywheel 5. Dynamometer control unit 3. Eddy current Dynamometer 6. Electronic fuel flow meter
Figure 6.2 Pictorial view of Experimental setup
ENGINE Exhaust
5 Gas Analyzer
Probe
Smoke Meter Probe
5 Gas Analyzer
Smoke Meter
Data Acquisition system
Fuel Measurement
Power Supply
PressureTransducer
DynamometerControl
Slotted Disc
CRO
Crank Angle Sensor

62
6.4 TEST INSTRUMENTS FOR MEASUREMENTS
The following instruments were used for the measurements during
the investigation
1. Electronic flow meter for measuring fuel consumption
2. Air flow measurement system for measuring intake air
3. Eddy current dynamometer for applying torque
4. Pressure transducer for measuring In-Cylinder pressure
5. Bosch smoke meter for measuring smoke intensity
6. Gas analyzer for detecting and measuring CO, CO2, HC and
NOx with GB 1.OX
6.4.1 Instruments for Performance Analysis
The performance analysis and quality control techniques need
continuous improvements because of advancement in engine design,
construction and compactness. An eddy current dynamometer is used for this
purpose. The eddy current dynamometer is designed based on application
parameters like power, torque, speed and moment of inertia. The eddy current
dynamometer is a dry gap rotor machine which operates in an air gap and
capable of bi-directional operations. It consists of steel rotor with thin spokes
and houses the field coil and a heat exchanger. Upon excitation, current is
generated in the field coil producing a magnetic flux. An equal and opposite
magnetic field is produced by the heat exchanger wall facing the rotor inside
the casing. The field thus produced is directed as a pulsating wave by the
arrangement of spokes in the rotor. This changing field produces eddy current
in the heat exchanger walls and opposes the excitation field. This causes the
retarding act to the rotor. Water is allowed to pass through the water jackets in
the heat exchanger to remove excess heat. The pressure variation of the water
63
will not affect the system; hence the loading control purely depends upon the
level of excitation.
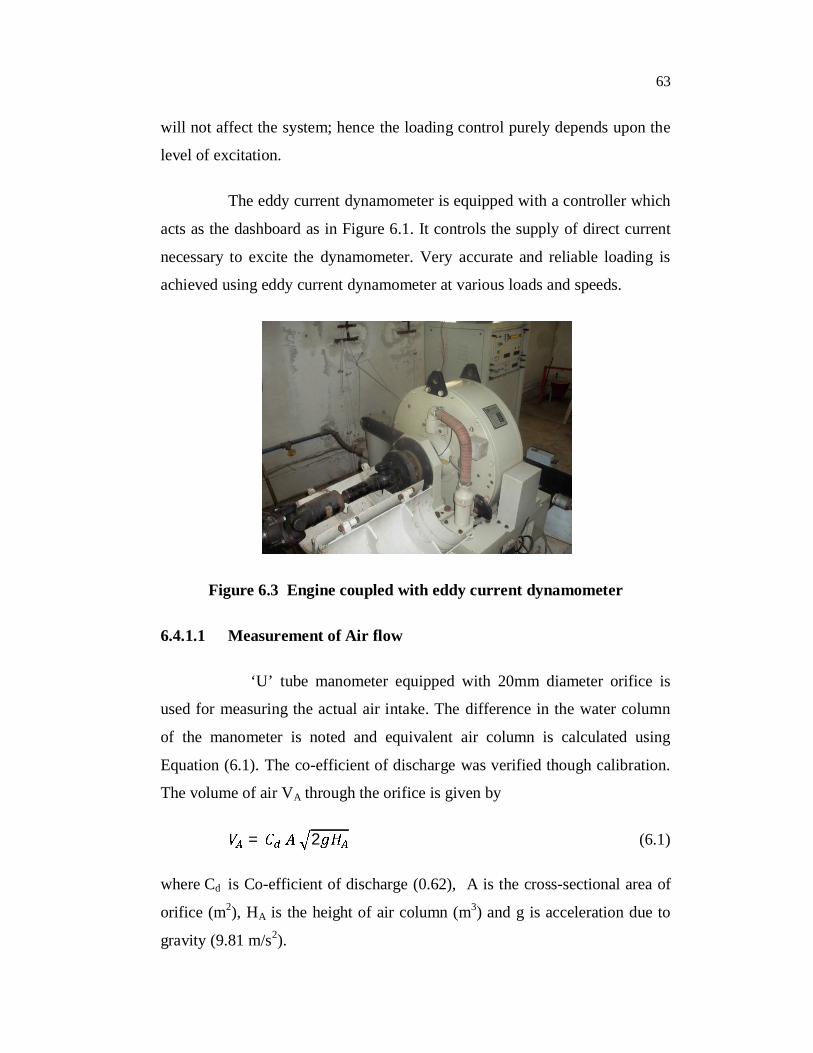
The eddy current dynamometer is equipped with a controller which
acts as the dashboard as in Figure 6.1. It controls the supply of direct current
necessary to excite the dynamometer. Very accurate and reliable loading is
achieved using eddy current dynamometer at various loads and speeds.
Figure 6.3 Engine coupled with eddy current dynamometer
6.4.1.1 Measurement of Air flow
‘U’ tube manometer equipped with 20mm diameter orifice is
used for measuring the actual air intake. The difference in the water column
of the manometer is noted and equivalent air column is calculated using
Equation (6.1). The co-efficient of discharge was verified though calibration.
The volume of air VA through the orifice is given by
= 2 (6.1)
where Cd is Co-efficient of discharge (0.62), A is the cross-sectional area of
orifice (m2), HA is the height of air column (m3) and g is acceleration due to
gravity (9.81 m/s2).

64
6.4.1.2 Measurement of Fuel flow
Electronic fuel flow meter is employed for measuring the quantity
of fuel intake during testing of AOME in compression ignition engine as
shown in Figure 6.4. The electronic fuel flow meter was attached with eddy
current dynamometer and its controls are integral part of dynamometer
controller. A toggle switch in the panel can be set to record 100 cc, 200 cc and
300 cc of fuel consumed. The switch can be also set in auto mode and the
timers automatically records the starting and stopping time of fuel flow into
the test engine. The time taken for total fuel consumption is noted for
calculation purpose.
Figure 6.4 Electronic fuel flow meter
6.4.1.3 Measurement of Exhaust and Coolant Temperature
The temperature sensors are employed for measuring the coolant
and exhaust temperature. Exhaust gas temperature is measured by placing the
sensors at the start of the exhaust manifold and coolant temperature is
measured by placing the sensor at water inlet point.

65
6.4.2 Instrument for Pressure Measurement
A Kistler 701 A type pressure transducer is used for measuring In-
cylinder pressure as shown in Figure 6.5 and technical details given in
Table 6.2 . It is very precise and robust in construction with a built in charge
amplifier. It works at a power supply between 7V to 32V direct current with a
range of 1 to 100 bar pressure and 5s time constant. The quartz element is
placed in a high sensitive chamber welded hermetically to the body. The
pressure measured through the steel diaphragm on the measuring element and
transforms the pressure into electrostatic charges. It converts the electrostatic
charge into proportional voltage. It has a stable temperature input stage and a
differential input together provides better condition for operations. Latest
hybrid techniques are incorporated to make it safe, reliable and vibration
proof. At every one degree crank angle, it measures the cylinder pressure for
all strokes. The pressure values are acquired and analyzed on computer with
the help of combustion analysis software and interface. The pressure
transducer was mounted on the cylinder head with a adopter whose signal
cable is connected to the charge amplifier through a high temperature VITON
cable for cylinder pressure measurement.
Figure 6.5 Kistler Pressure transducer
66
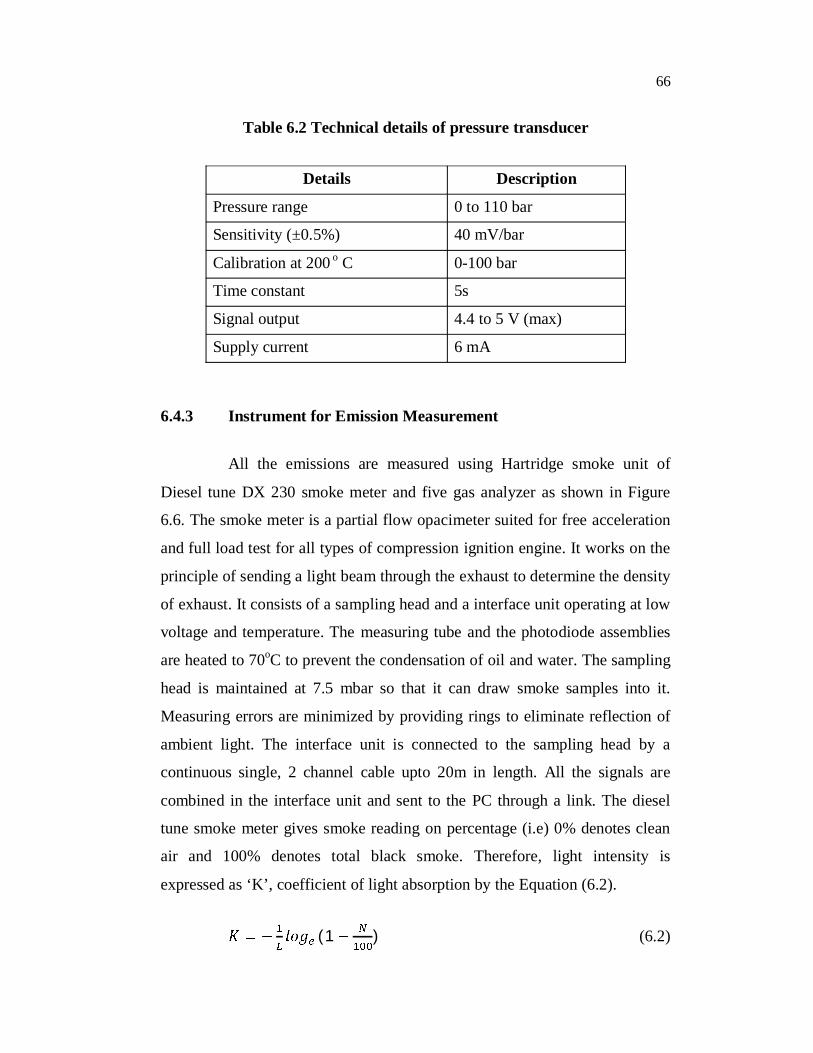
Table 6.2 Technical details of pressure transducer
Details Description
Pressure range 0 to 110 bar
Sensitivity (±0.5%) 40 mV/bar
Calibration at 200 o C 0-100 bar
Time constant 5s
Signal output 4.4 to 5 V (max)
Supply current 6 mA
6.4.3 Instrument for Emission Measurement
All the emissions are measured using Hartridge smoke unit of
Diesel tune DX 230 smoke meter and five gas analyzer as shown in Figure
6.6. The smoke meter is a partial flow opacimeter suited for free acceleration
and full load test for all types of compression ignition engine. It works on the
principle of sending a light beam through the exhaust to determine the density
of exhaust. It consists of a sampling head and a interface unit operating at low
voltage and temperature. The measuring tube and the photodiode assemblies
are heated to 70oC to prevent the condensation of oil and water. The sampling
head is maintained at 7.5 mbar so that it can draw smoke samples into it.
Measuring errors are minimized by providing rings to eliminate reflection of
ambient light. The interface unit is connected to the sampling head by a
continuous single, 2 channel cable upto 20m in length. All the signals are
combined in the interface unit and sent to the PC through a link. The diesel
tune smoke meter gives smoke reading on percentage (i.e) 0% denotes clean
air and 100% denotes total black smoke. Therefore, light intensity is
expressed as ‘K’, coefficient of light absorption by the Equation (6.2).
(1 ) (6.2)

67
where L is the path of light (m) and N is percentage of light obscuration (%)
Before starting the measurement, the initial settings are made as 0%
by sensing clean air and 100% by sensing at no light rays. The smoke meter
automatically calibrates itself at the start of each test and the tolerance on
midpoint calibration between 34% to 40%. The conversion chart
(ULX900HSU manual) is used to determine the level of particulates in the
exhaust which includes compensation for the temperature of smoke. The other
emissions like HC, NOx, CO and CO2 were obtained directly from five gas
analyzer.
Figure 6.6 Emission measuring device
6.5 TEST PROCEDURE FOR PERFORMANCE AND
EMISSION PARAMETERS
Before starting the experiment, the test engine is started and
allowed to warm up for 20 mins. The base reading from eddy current
dynamometer, time taken for 100 cc of fuel consumption, pressure-crank
angle value from PC based data acquisition system and emission reading from

68
diesel tune smoke meter for straight diesel are recorded. The experiment was
repeated thrice to minimize the errors in the analysis.
The experiment is initiated by starting the engine and allowing a
warm up time for 20 mins. The loading is done by eddy current dynamometer.
The time taken for 100 cc fuel consumption is noted using electronic fuel
flow meter. The eddy current dynamometer is set to constant mode so that
when the engine speed is fixed, the load or torque can be varied by increasing
or decreasing the throttle. An input signal from the transducer is given to the
controller. The indicator display is calibrated with standard weight to indicate
torque in desired units (Nm or Kgm).
When the field coil is excited, load is given to the engine to stop
and as a result equal and opposite excitation is exerted by the dynamometer
stator assembly and gives a torque value. This results in reduction of engine
speed which is recorded and the corresponding power developed is calculated.
This procedure was repeated by changing the load from no load to full load
(BMEP) and the performance characteristics are recorded. The various
performance parameters like indicated power, brake power, brake specific
fuel consumption, brake specific energy consumption and torque are
calculated. Graphs are plotted between BSEC, BTE and BMEP to study the
variation of performance and emission parameters using various blends of
algal oil. The pressure readings are taken from the signal obtained from
pressure transducer through the data acquisition system. The computer plots
the pressure and crank angle to a minimum scale of 1 bar and 1 degree
respectively. The rate of heat release is then calculated based on the pressure-
crank angle data. The above entire test procedure is performed using straight
diesel as base reading and repeated for AOME 5%, 10%, 15% and 20%
blends to evaluate the effect of AOME addition.
69
Smoke reading is obtained from bosch smoke unit of diesel tune
smoke meter interfaced with PC. The smoke meter is capable of measuring
particulates derived from smoke in mg/m3. The other emission like HC, NOx,
CO and CO2 are measured using 5 gas analyzer interfaced with computer
which is a self calibrating type. CO and CO2 are measured in % by volume
while HC and NOx. Five sets of readings are taken at each stage to ensure
accuracy. This procedure is repeated from No load to Full load condition.
6.6 TEST PROCEDURE FOR CYLINDER PRESSURE AND
HEAT RELEASE ANALYSIS
The period between inlet valve closing and exhaust valve opening
plays a very significant role in analyzing the combustion characteristics;
hence maximum power is developed during this period. The pressure inside
the closed system (i.e) the cylinder changes because of change in cylinder
volume, combustion rate, flow of air and fuel around the crevice region, heat
transfer to cylinder walls and leakage past the piston and valves. The effect of
pressure on combustion cannot be accurately calculated because nearly 70%
to 92% of fuel is in vapor state during start of injection. After 1 ms, the
vaporization rate reaches 95%, since only 25% to 35% of vapourized fuel is
burnt within the flammability limits.
The rate of change in pressure rise is directly proportional to the
amount of heat energy released. The rate if heat release is formulated based
on first law of thermodynamics incorporating the leakage of gases past the
cylinder, effect of heat transfer because they affect the change in pressure
during combustion. A suitable mathematical model is used to formulate the
above data.
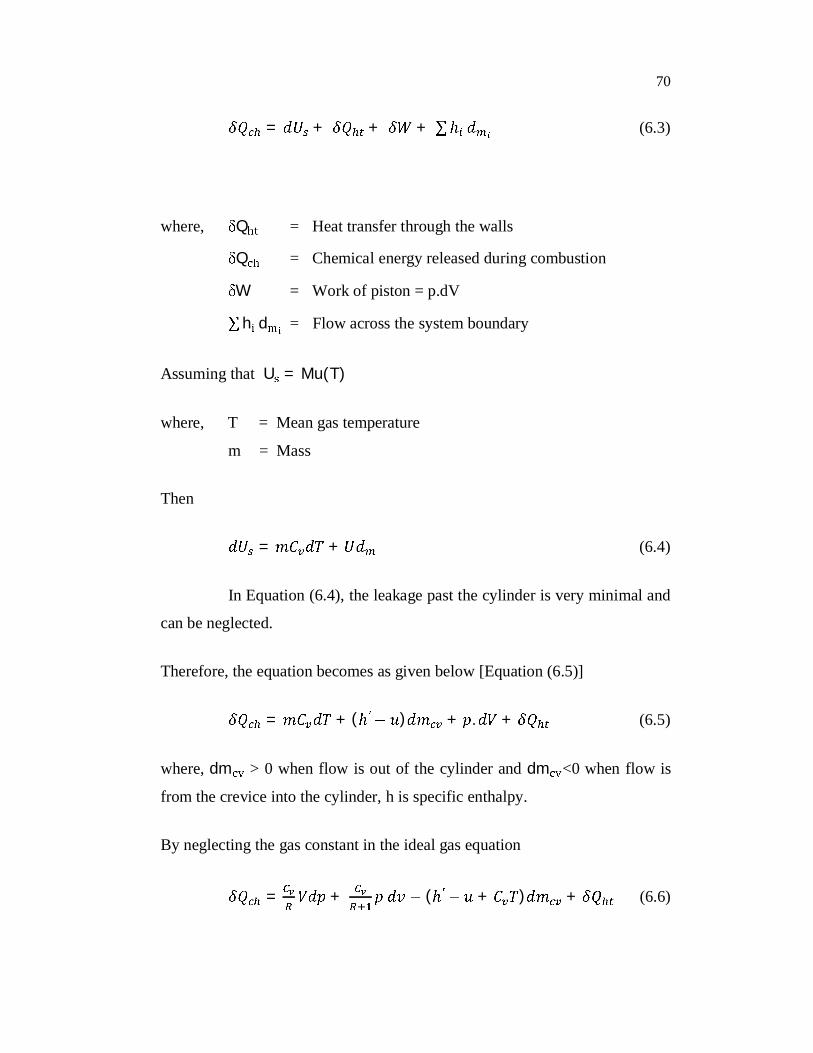
Based on first law of thermodynamics as given in Equation (6.3)
70
= + + + (6.3)
where, Q = Heat transfer through the walls
Q = Chemical energy released during combustion
W = Work of piston = p.dV
h d = Flow across the system boundary
Assuming that U = Mu(T)
where, T = Mean gas temperature
m = Mass
Then
= + (6.4)
In Equation (6.4), the leakage past the cylinder is very minimal and
can be neglected.
Therefore, the equation becomes as given below [Equation (6.5)]
= + ( ) + . + (6.5)
where, dm > 0 when flow is out of the cylinder and dm <0 when flow is
from the crevice into the cylinder, h is specific enthalpy.
By neglecting the gas constant in the ideal gas equation
= + ( + ) + (6.6)

71
and the heat transfer rate considering the gas temperature and wall
temperature becomes as given in Equation (6.7)
= ( ) (6.7)
where T = Mean gas temperature (Kelvin)
T = Mean wall temperature (Kelvin)
h = Instantaneous co-efficient of convective heat transfer
A = Surface area of chamber (m2)
T and T are calculated using ideal gas equation (pV=mRT) and averaging
the gas and coolant temperature respectively.
In the present combustion study, considering the engine
dimensions, pressure and piston speed, Woschni correlation of heat transfer
was found to be more suitable.
= 3.26 . . . (6.8)
The above Equation (6.8) of instantaneous heat transfer is derived
from relationship between Nusselt, Reynolds and Prandtl number below as
given in Equation (6.9)
= ( ) ( ) (6.9)
where Nu = Nusselt number
Re = Reynolds number
Pr = Prandtl number
a, m and n are proportionality constants.
72
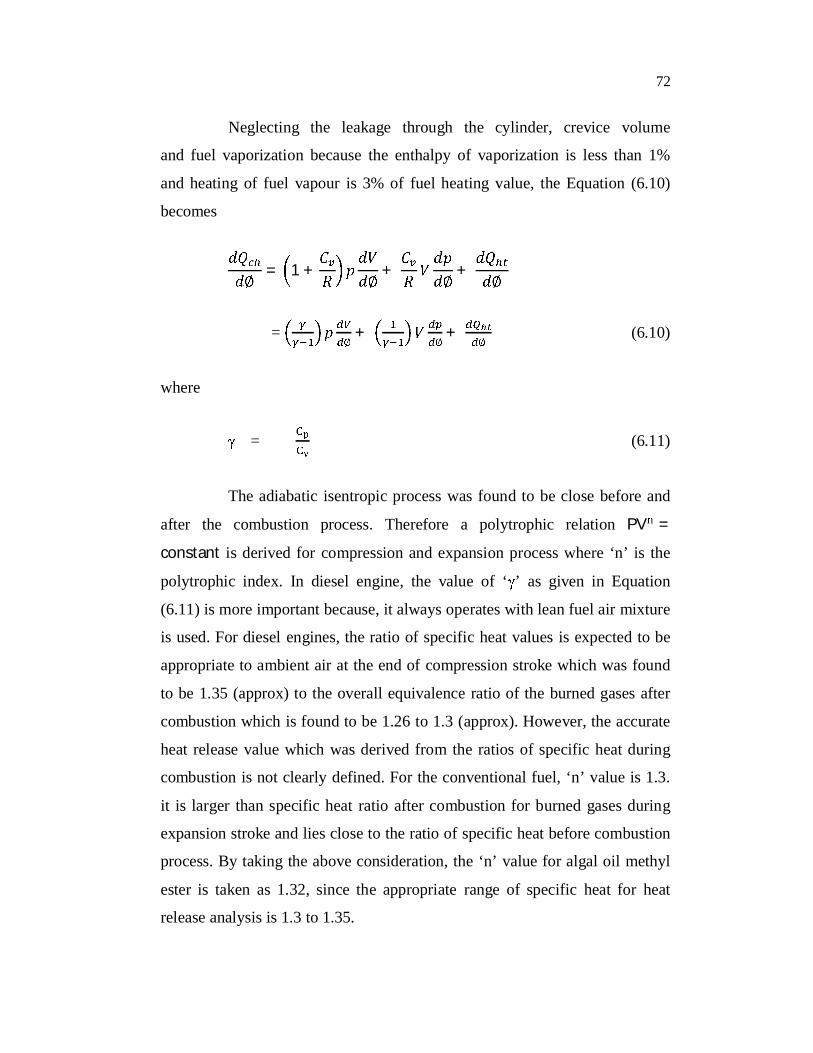
Neglecting the leakage through the cylinder, crevice volume
and fuel vaporization because the enthalpy of vaporization is less than 1%
and heating of fuel vapour is 3% of fuel heating value, the Equation (6.10)
becomes
= 1 + + +
= + + (6.10)
where
= (6.11)
The adiabatic isentropic process was found to be close before and
after the combustion process. Therefore a polytrophic relation PV =
constant is derived for compression and expansion process where ‘n’ is the
polytrophic index. In diesel engine, the value of ‘ ’ as given in Equation
(6.11) is more important because, it always operates with lean fuel air mixture
is used. For diesel engines, the ratio of specific heat values is expected to be
appropriate to ambient air at the end of compression stroke which was found
to be 1.35 (approx) to the overall equivalence ratio of the burned gases after
combustion which is found to be 1.26 to 1.3 (approx). However, the accurate
heat release value which was derived from the ratios of specific heat during
combustion is not clearly defined. For the conventional fuel, ‘n’ value is 1.3.
it is larger than specific heat ratio after combustion for burned gases during
expansion stroke and lies close to the ratio of specific heat before combustion
process. By taking the above consideration, the ‘n’ value for algal oil methyl
ester is taken as 1.32, since the appropriate range of specific heat for heat
release analysis is 1.3 to 1.35.
73
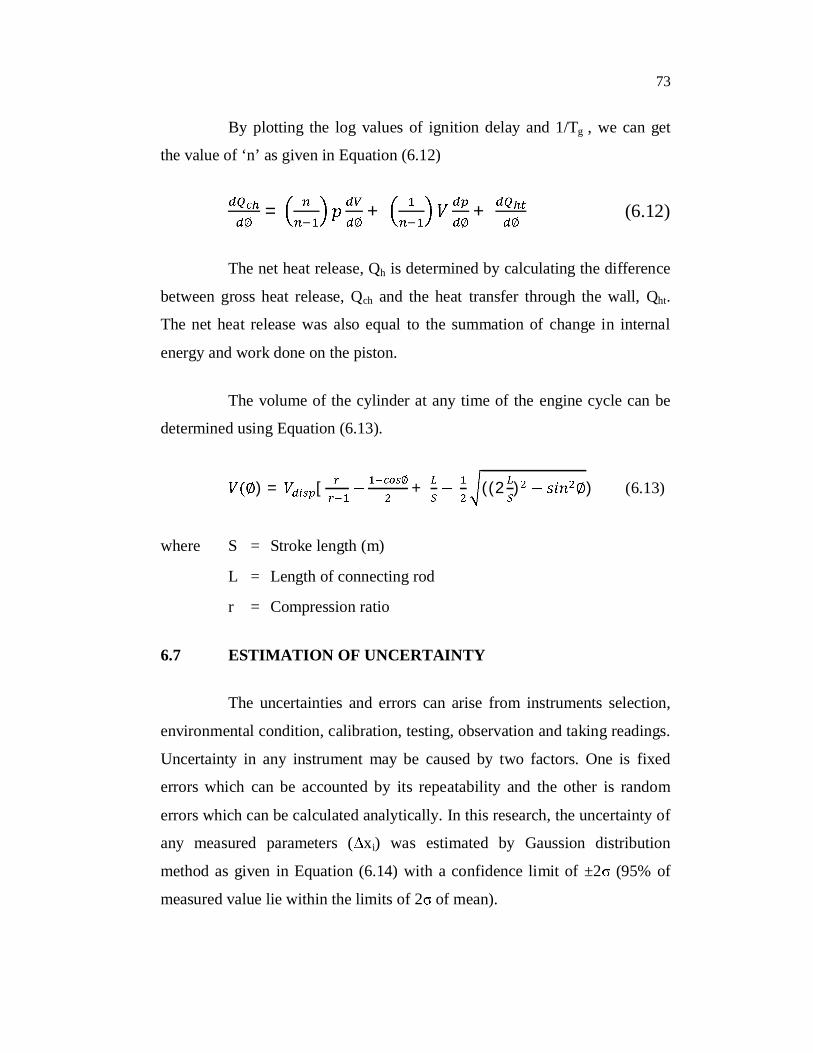
By plotting the log values of ignition delay and 1/Tg , we can get
the value of ‘n’ as given in Equation (6.12)
= + + (6.12)
The net heat release, Qh is determined by calculating the difference
between gross heat release, Qch and the heat transfer through the wall, Qht.
The net heat release was also equal to the summation of change in internal
energy and work done on the piston.
The volume of the cylinder at any time of the engine cycle can be
determined using Equation (6.13).
) = [ + ((2 ) ) (6.13)
where S = Stroke length (m)
L = Length of connecting rod
r = Compression ratio
6.7 ESTIMATION OF UNCERTAINTY
The uncertainties and errors can arise from instruments selection,
environmental condition, calibration, testing, observation and taking readings.
Uncertainty in any instrument may be caused by two factors. One is fixed
errors which can be accounted by its repeatability and the other is random
errors which can be calculated analytically. In this research, the uncertainty of
any measured parameters ( xi) was estimated by Gaussion distribution
method as given in Equation (6.14) with a confidence limit of ±2 (95% of
measured value lie within the limits of 2 of mean).
74
= 100 (6.14)
where is the number of reading, is standard deviation and is
experimental values. The experiment was conducted with commercial diesel
and five sets of readings were taken for speed, load, torque, temperature,
pressure and exhaust emissions. The uncertainties of computed parameters
were evaluated using the below expression as given in Equation (6.15).
R = f(X , X , X … … X )
where R is the function of X , X , X … … X
R = X + X X (6.15)
The uncertainties of measuring instruments are given in Table 6.3. Tiegang
et al. (2009), Senatore et al. (2000) suggested the root mean square technique
to get the magnitude of uncertainties and errors as given in Equation (6.15)
which is used to estimate the uncertainty in brake power, brake thermal
efficiency, fuel flow, speed, load and voltage as in Table 6.4.

75
Table 6.3 Uncertainties of instruments
S.No Instruments Range Accuracy % of
uncertainties
1 Pressure transducer 0-110 bar ±0.1 bar 0.1
2 Manometer - ±1mm 1.0
3 Speed Measurement 0-10000 rpm ±10 rpm 0.1
4 Smoke meter BSU 0-10 ±0.1 1.0
5 Exhaust temperature 0-900oC ±1oC 0.12
6 Stop watch - ±0.5 Sec 0.2
Table 6.4 Uncertainties of measured parameters
S.No Measured parameters Uncertainties %
1 Brake Power ±0.24
2 Brake thermal efficiency ±0.25
3 Flow rate of air ±0.60
4 Flow rate of Diesel ±0.72
5 Speed ±0.10
6 Load ±0.45
7 Oxides of nitrogen ±1.20
8 Hydrocarbons ±0.01
9 Carbon Monoxide ±0.60
10 Smoke ±2.00


![CHAPTER II LITERATURE SURVEY AND SCOPE OF THE PRESENT INVESTIGATIONshodhganga.inflibnet.ac.in/bitstream/10603/56512/7/07_chapter 2.pdf · 39 Gu et al [13] deposited ZnO films on tin](https://static.fdocuments.in/doc/165x107/5b62a12e7f8b9a4f488dc637/chapter-ii-literature-survey-and-scope-of-the-present-inv-2pdf-39-gu-et-al.jpg)

