CHAPTER 6 DELIMITATION OF CROP DIVERSIFICATION REGIONS...
51
295 CHAPTER 6 DELIMITATION OF CROP DIVERSIFICATION REGIONS AND CHANGES THEREIN Concept of crop diversification means competition among various grown crops for space in a given region. It also means raising a variety of crops involving intensity of competition amongst field crops for arable land: the keener the competition, the higher the magnitude of crop diversification. It is a concept which is opposite to crop specialization. It is an indicator of multiplication of crops which obviously involves intensive competition among the growing crops. (Singh J, 1976). Crop diversification also provides relationship between the relative areal strength of the crops grown in a region. The magnitude of crop diversification shows the impact of physical, socio- economic and technological influence on cropping pattern of an area (Hussain M, 1986). In the face of shrinking natural resources with increase large demand for food and agricultural production arising due to high population and income growth, crop diversification is the main course of future growth of agriculture. With changing rainfall pattern over years, ground water depletion, hike in labour wages, the present cropping pattern may be economically viable. It is a time to critically redesign alternative cropping pattern based on agro climatic zone. The earlier cropping pattern (pre green revolution) in the study region was greatly diverse comprising wheat, rice, fodder, cotton, maize, pulses, bajra, oilseeds, sugarcane etc. The dominance of the wheat paddy system has led to serious economic, social and ecological problems
Transcript of CHAPTER 6 DELIMITATION OF CROP DIVERSIFICATION REGIONS...

295
CHAPTER 6
DELIMITATION OF CROP DIVERSIFICATION REGIONS AND CHANGES THEREIN
Concept of crop diversification means competition among various
grown crops for space in a given region. It also means raising a variety of
crops involving intensity of competition amongst field crops for arable land:
the keener the competition, the higher the magnitude of crop diversification. It
is a concept which is opposite to crop specialization. It is an indicator of
multiplication of crops which obviously involves intensive competition among
the growing crops. (Singh J, 1976). Crop diversification also provides
relationship between the relative areal strength of the crops grown in a region.
The magnitude of crop diversification shows the impact of physical, socio-
economic and technological influence on cropping pattern of an area (Hussain
M, 1986). In the face of shrinking natural resources with increase large
demand for food and agricultural production arising due to high population
and income growth, crop diversification is the main course of future growth of
agriculture. With changing rainfall pattern over years, ground water depletion,
hike in labour wages, the present cropping pattern may be economically
viable. It is a time to critically redesign alternative cropping pattern based on
agro climatic zone. The earlier cropping pattern (pre green revolution) in the
study region was greatly diverse comprising wheat, rice, fodder, cotton,
maize, pulses, bajra, oilseeds, sugarcane etc. The dominance of the wheat
paddy system has led to serious economic, social and ecological problems

296
such as deceleration in productivity of ground water resources and decline in
soil fertility (Sidhu and Johl 2002). The crop diversification is largely depends
on the socio-economic conditions and technological development of the
region but stronger are the physical environment. It means the crop
diversification is the product of action, reaction interaction among the physical
and non-physical environment (Sohal, 2003). Crop diversification is intended
to give a wider choice in the production of a variety of crops in a given area so
to expand production related activities of various crops and also to lessen the
risk. Crop diversification is generally viewed as a shift from traditionally grown
less remunerative crops to more remunerative crops. e.g. growing of rice in
high water table areas replacing oilseeds, pulses and cotton with the advent
of modern agricultural technology especially during the period of green
revolution because rice give maximum economic returns. Government
policies, market, infrastructure, price, and transport facilities etc. are also
responsible for crop diversification. Crop diversification also taken place in the
areas facing distinct soil problems Crop diversification also gives more
employment opportunities for the small farmers as well as for agricultural
labourers throughout the year. There is a continuous surge for diversified
agricultural in terms of crops primarily on economic consideration. The crop
diversification however is the outcome of the interactive effect of many
factors. Thus it is recognized that the study of spatial patterns of crop
diversification is of vital importance and almost indispensable to understand
the competition that goes among different crops.
Several studies have been made in detail about the crop diversification.
Many scholars from geography, economics and allied disciplines have

297
developed techniques for measurement of crop diversification. Among them
Gibbs and Martin, Bhatia and Singh are prominent. In 1962 Gibbs & Martin
gave the formula for calculation the index of diversification
1. Gibbs and Martin’s Technique Here x is the percentage of total cropped area occupies by an
individual crop. According to this method crop diversification varies between
0.1 to 0.9. This method is directly related to magnitude of diversification. Here
higher the index higher the diversification and lower the index lower the
magnitude of diversification.
2. Bhatia’s technique
In 1965-66 Bhatia developed a formula to calculate the degree of crop
diversification. The formula is:
Index of crop diversification =Sum Percent of Cropped Area under X Crops Number of X crops Where x crops are those crops that individually occupy 10 per cent or
more than 10 per cent of the total cropped area in the study region. This
formula is inversely related with the magnitude of diversification. Here higher
the index lower is the diversification and vice versa.
3. Singh’s technique
Singh (1976) developed the formula for calculating the degree of crop
diversification. According to this method, the index of crop diversification is
obtained by summing up the harvested area of those crops which are having
5.0 per cent or more than 5.0 per cent area to the total harvested area. Thus,
this formula is also inversely related with the magnitude of crop diversification.
x2
x)2 ∑X2
(∑X) 21 —

298
Higher the index, lower the magnitude of crop diversification and lower the
index higher the magnitude of crop diversification. The formula is:
Index of crop diversification= Percent of total harvested area under N crops Number of N crops
Where N crops are those crops which individually occupy 5 per cent or
more than 5 per cent of the total harvested area in the study region.
Thus for calculating the index of crop diversification in the study region
above mentioned three methods have been applied with the following heads.
(A) Patterns of crop diversification in 1965-66
(B) Patterns of crop diversification in 1985-86
(C) Patterns of crop diversification in 2005-06
(A) Patterns of Crop Diversification: 1965-66
To find out the degree of crop diversification in the study region, the
methods of Gibbs & Martin, Bhatia and Singh are taken into account. The
results obtained from these methods are mapped individually which are
discussed in detail. These are as follow:
I. Spatial Distribution of Crop Diversification after Gibbs and Martin’s
Technique (1965-66) (Fig. 6.1)
According to Gibbs and Martin’s formula, the overall index value of
crop diversification of the study region was 0.79 in 1965-66. It varied from
0.67 in Rewari and Mahendragarh district to 0.83 in Ambala and Hisar districts
of the study area. To show the spatial variations study region is divided into
following three categories. These categories are discussed in figure 6.1 and
table 6.1.

299
Table 6.1
Index of Crop Diversification in Punjab Haryana Plains: 1965-66
DISTRICT Gibbs & Matrin Bhatia Singh
Gurdaspur 0.77 21.31 18.35 Amritsar 0.79 23.90 18.72 Tarn Taran 0.80 22.81 18.21 Kapurthala 0.79 21.17 17.43 Jalandhar 0.81 20.10 17.92 Nawanshahr 0.81 21.95 15.49 Hoshiarpur 0.80 20.69 17.77 Rupnagar 0.82 19.71 15.50 S.A.S. Nagar 0.82 20.01 15.38 Ludhiana 0.81 19.64 15.31 Firozpur 0.80 19.82 17.58 Faridkot 0.79 21.75 18.01 Muktsar 0.78 22.09 18.09 Moga 0.79 22.04 19.04 Bathinda 0.78 23.99 18.55 Mansa 0.80 23.93 17.90 Sangrur 0.80 23.91 15.01 Patiala 0.81 19.82 17.33 Fatehgarh Sahib 0.82 21.60 15.20 Ambala 0.83 17.81 17.81 Panchkula 0.82 17.75 17.75 Yamunanagar 0.81 20.60 17.90 Kurukshetra 0.81 20.70 17.57 Kaithal 0.82 19.96 17.19 Karnal 0.82 20.54 17.64 Panipat 0.81 18.44 18.44 Sonipat 0.82 18.29 18.29 Rohtak 0.80 22.01 18.98 Jhajjar 0.80 22.86 18.78 Faridabad 0.81 21.24 18.23 Gurgaon 0.79 22.18 19.21 Rewari 0.67 28.22 23.36 Mahendragarh 0.67 24.31 23.31 Bhiwani 0.70 27.05 20.24 Jind 0.79 21.92 18.75 Hisar 0.83 17.07 15.85 Fatehabad 0.82 19.13 15.72 Sirsa 0.82 19.46 15.82 REGION 0.79 21.35 17.78 Source: Statistical Abstracts of Punjab & Haryana – 1966.

0 40
Kms
Fig. 6.1
(Gibbs & Martin's Technique)Crop Diversification Regions: 1965-66
PUNJAB-HARYANA PLAINS
Magnitude
> .80
.75-.80
< .75
Region's Average = .79
Source: Statistical Abstracts of Punjab and Haryana - 1966
Index Value
High
Medium
Low

300
(a) Areas with high crop diversification (>0.80)
This category covered the districts of Jalandhar, Ludhiana,
Nawanshahr, Rupnagar, Fatehgarh, S.A.S. Nagar, Patiala, Kaithal,
Kurukshetra, Ambala, Panchkula, Yamunanagar, Karnal, Panipat, Sonipat,
Faridabad, Sirsa, Fatehabad and Hisar. The districts of Nawanshahr,
Rupnagar, S.A.S. Nagar, Panchkula, Ambala and Yamunanagar lying in the
foothill zone of Shiwaliks and faced the problems of hilly and dissected
topography, soil erosion, low extent of irrigation, swift flowing seasonal
torrents during rainy season etc. which resulted in high magnitude of crop
diversification in these districts. While the districts of Sirsa, Fatehabad, Hisar
and Faridabad have sandy soil, less developed agricultural infrastructure, low
rainfall etc, were responsible for high crop diversification. But in case of
Jalandhar, Ludhiana, Patiala, Kaithal, Karnal, Panipat and Sonipat districts,
less developed irrigational facilities and fertile soil which enthuse the farmers
to grow more crops during rabi and kharif season. Due to the above
mentioned physical obstacles and less developed infrastructure, farmers had
grown number of crops from security point of view which resulted in high
magnitude of crop diversification in above mentioned districts.
(b). Areas with moderate magnitude of crop diversification (0.75 to 0.80
index value)
Gurdaspur, Amritsar, Tarn Taran, Kapurthala, Firozpur, Muktsar,
Faridkot, Moga, Bathinda, Sangrur, Mansa, Hoshiarpur, Jind, Rohtak, Jhajjar
and Gurgaon districts formed this category. In these districts the farmers
preferred to grow only those crops which respond well in the prevailing
physical conditions of these areas e.g. in Faridkot, Firozpur, Muktsar, Moga,
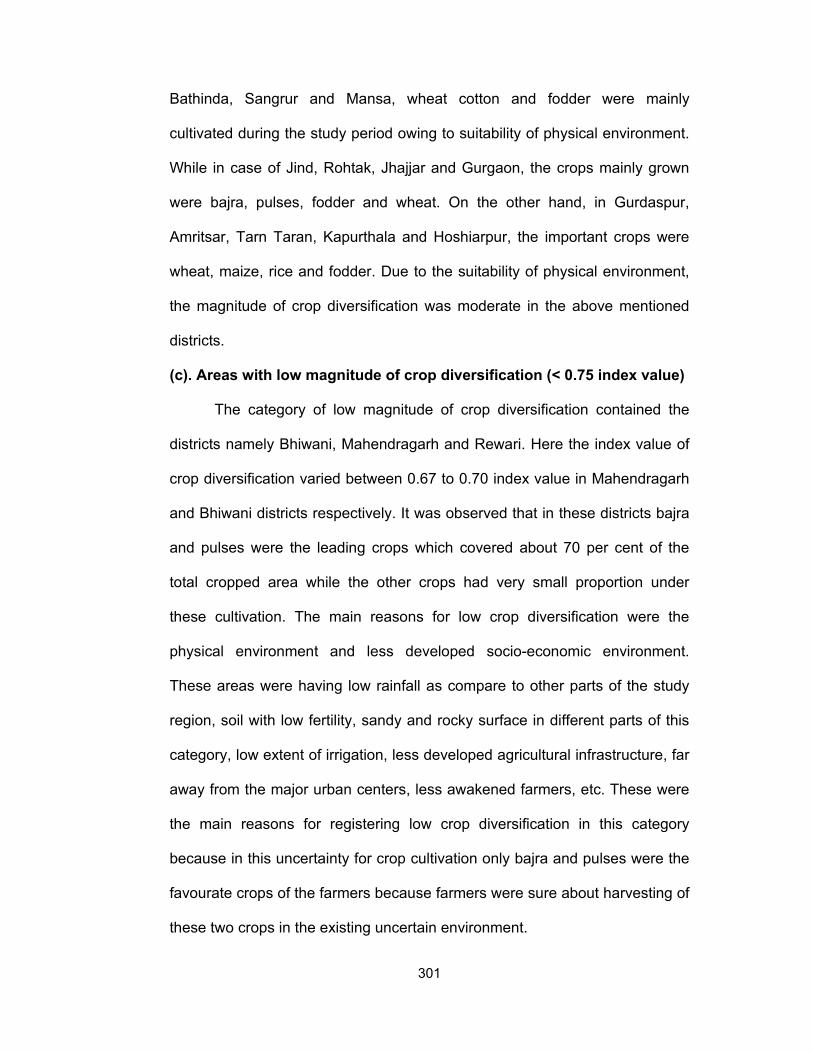
301
Bathinda, Sangrur and Mansa, wheat cotton and fodder were mainly
cultivated during the study period owing to suitability of physical environment.
While in case of Jind, Rohtak, Jhajjar and Gurgaon, the crops mainly grown
were bajra, pulses, fodder and wheat. On the other hand, in Gurdaspur,
Amritsar, Tarn Taran, Kapurthala and Hoshiarpur, the important crops were
wheat, maize, rice and fodder. Due to the suitability of physical environment,
the magnitude of crop diversification was moderate in the above mentioned
districts.
(c). Areas with low magnitude of crop diversification (< 0.75 index value)
The category of low magnitude of crop diversification contained the
districts namely Bhiwani, Mahendragarh and Rewari. Here the index value of
crop diversification varied between 0.67 to 0.70 index value in Mahendragarh
and Bhiwani districts respectively. It was observed that in these districts bajra
and pulses were the leading crops which covered about 70 per cent of the
total cropped area while the other crops had very small proportion under
these cultivation. The main reasons for low crop diversification were the
physical environment and less developed socio-economic environment.
These areas were having low rainfall as compare to other parts of the study
region, soil with low fertility, sandy and rocky surface in different parts of this
category, low extent of irrigation, less developed agricultural infrastructure, far
away from the major urban centers, less awakened farmers, etc. These were
the main reasons for registering low crop diversification in this category
because in this uncertainty for crop cultivation only bajra and pulses were the
favourate crops of the farmers because farmers were sure about harvesting of
these two crops in the existing uncertain environment.
302
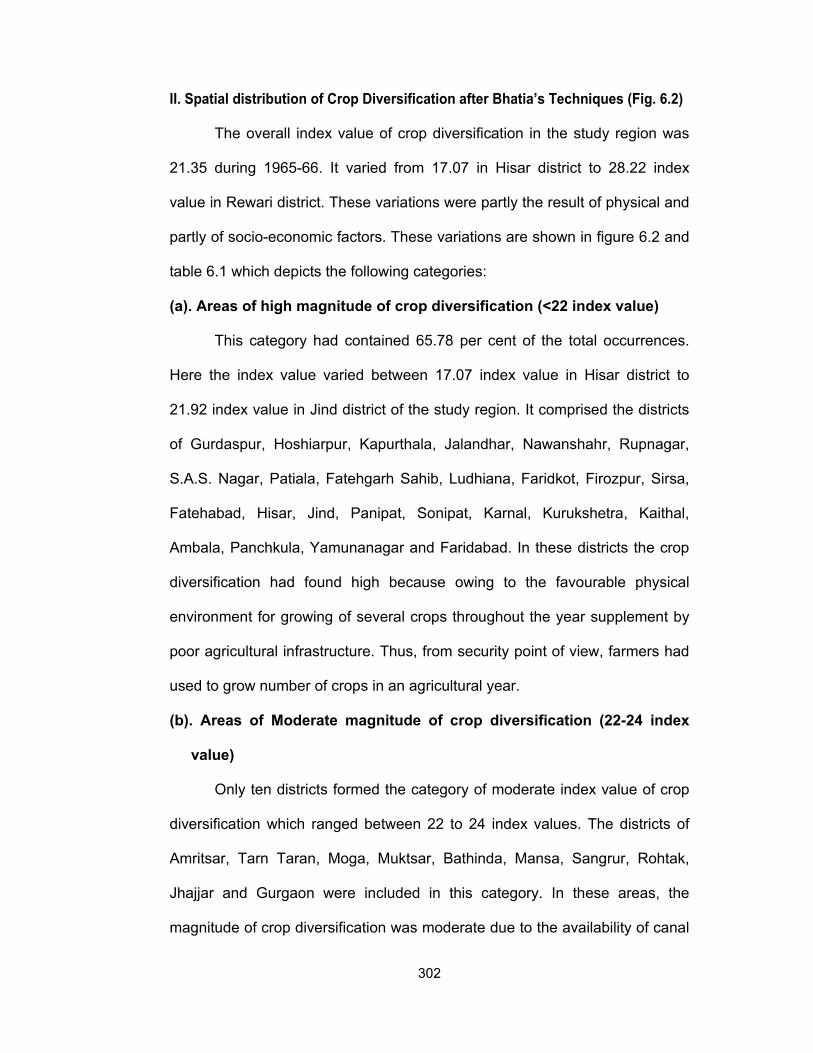
II. Spatial distribution of Crop Diversification after Bhatia’s Techniques (Fig. 6.2)
The overall index value of crop diversification in the study region was
21.35 during 1965-66. It varied from 17.07 in Hisar district to 28.22 index
value in Rewari district. These variations were partly the result of physical and
partly of socio-economic factors. These variations are shown in figure 6.2 and
table 6.1 which depicts the following categories:
(a). Areas of high magnitude of crop diversification (<22 index value)
This category had contained 65.78 per cent of the total occurrences.
Here the index value varied between 17.07 index value in Hisar district to
21.92 index value in Jind district of the study region. It comprised the districts
of Gurdaspur, Hoshiarpur, Kapurthala, Jalandhar, Nawanshahr, Rupnagar,
S.A.S. Nagar, Patiala, Fatehgarh Sahib, Ludhiana, Faridkot, Firozpur, Sirsa,
Fatehabad, Hisar, Jind, Panipat, Sonipat, Karnal, Kurukshetra, Kaithal,
Ambala, Panchkula, Yamunanagar and Faridabad. In these districts the crop
diversification had found high because owing to the favourable physical
environment for growing of several crops throughout the year supplement by
poor agricultural infrastructure. Thus, from security point of view, farmers had
used to grow number of crops in an agricultural year.
(b). Areas of Moderate magnitude of crop diversification (22-24 index
value)
Only ten districts formed the category of moderate index value of crop
diversification which ranged between 22 to 24 index values. The districts of
Amritsar, Tarn Taran, Moga, Muktsar, Bathinda, Mansa, Sangrur, Rohtak,
Jhajjar and Gurgaon were included in this category. In these areas, the
magnitude of crop diversification was moderate due to the availability of canal

0 40
Kms
Statistical Abstracts of Punjab and Haryana - 1966Source:
PUNJAB-HARYANA PLAINS
Crop Diversification Regions: 1965-66(Bhatia's Technique)
Fig. 6.2
Low
Medium
High
Index Value
> 24
22-24
< 22
Magnitude
Region's Average = 21.35

303
irrigation as well as tubewells and wells irrigation in Amritsar and Tarn Taran.
And as a result farmers had selected few crops for the cultivation from which
they can fetch higher economic returns. Whereas in case of Moga, Muktsar,
Bathinda, Sangrur and Mansa districts, the number of crops were also few
due to the hot dry climatic conditions as compare to northern and eastern
parts of the study region, more canal irrigation was also the major contributor
for moderate diversification. But in case of Rohtak, Jhajjar and Gurgaon, the
major factor was physical environment which allow only few crops further the
influence of Delhi metropolitan also affected the cropping pattern through the
demand of fodder. Owing to all these reasons, this category had witnessed
moderate magnitude of crop diversification.
(c) Areas of low magnitude of crop diversification (Above 24 index value)
This category was confined to southern tips of the study region and
covered three districts namely Bhiwani, Mahendragarh and Rewari. Here the
index value was found above 24. These were the most backward areas of
study region from infrastructural point of view. Moreover, these areas had low
annual rainfall, high summer temperature, poor sandy soils, low irrigational
facilities etc. As a result, farmers had grown few crops like pulses, oilseeds,
bajra, fodder wheat, etc. All this led to high index value which shows low
magnitude of crop diversification.
From the above discussion it is observed that major parts of the study
region had highly diversified. But there were certain areas in the southern
parts of the study region which were having low magnitude of crop
diversification, because in this belt physical environment did not allow to grow
more crops. But in areas where some irrigation facilities were available and

304
geo-climatic conditions were also favourable for growing of crops throughout
the year, had also recorded moderate magnitude of crop diversification.
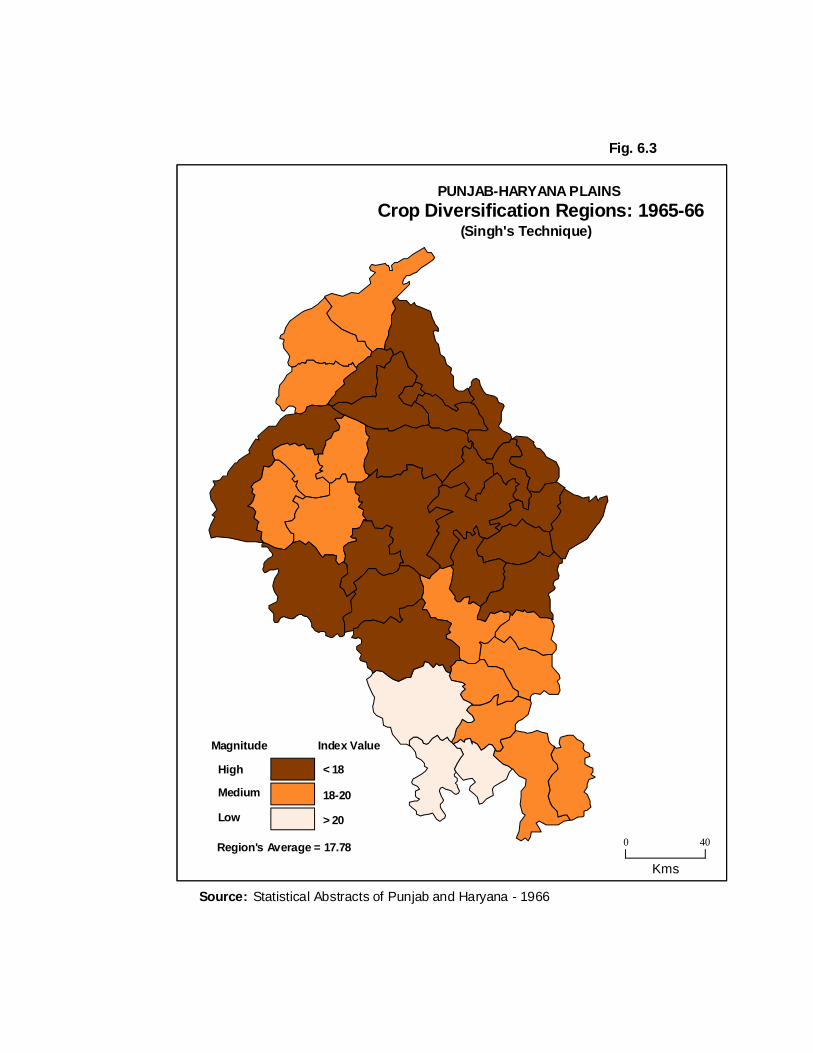
III. Spatial distribution of crop diversification after Singh’s Technique
(1965-66) (Fig. 6.3)
The index value of overall crop diversification after Singh’s technique
for the study region was of 17.78, but it ranged from 15.20 index value in
Fatehgarh Sahib to 23.36 in Rewari districts of the study region. These
variations are grouped into the following three categories which are shown in
table 6.1 and figure 6.3.
(a). Areas of high magnitude of crop diversification (<18 index value)
This category had twenty districts out of thirty eight and contained
52.63 per cent of the total occurrences. These districts were namely
Hoshiarpur, Rupnagar, Nawanshahr, S.A.S. Nagar, Fatehgarh Sahib, Patiala,
Sangrur, Ludhiana, Jalandhar, Kapurthala, Firozpur, Mansa, Sirsa,
Fatehabad, Hisar, Kaithal, Karnal, Kurukshetra, Ambala, Yamunanagar and
Panchkula. Here, the index value varied from 15.50 in Rupnagar district to
17.92 in Jalandhar district. The physical environment in these areas was
suitable for the cultivation of number of crops in an agricultural year, but at the
same time socio-economic conditions were not developed during 1965-66.
Thus the farmers had grown number of crops to lessen their risk by reaping at
least some crops in event of bad weather. Owing to all these reasons, the
magnitude of crop diversification was recorded high in the above mentioned
districts.
0 40
Kms
Low
Medium
High
Index Value
> 20
18-20
< 18
Magnitude
Region's Average = 17.78
Statistical Abstracts of Punjab and Haryana - 1966Source:
PUNJAB-HARYANA PLAINS
Crop Diversification Regions: 1965-66(Singh's Technique)
Fig. 6.3

305
(b). Areas of Moderate magnitude of crop diversification (18-20 index
value)
It was found in three different belts and one patch. The first belt
comprised the districts of Gurdaspur, Amritsar and Tarn Taran. The
magnitude of crop diversification was moderate owing to the cultivation of
sugarcane in Gurdaspur district and cotton cultivation in Amritsar and Tarn
Taran districts. Here farmers had preferred to cultivate only those crops which
fetched the high economic returns to them because the physical environment
of these districts was suitable for agriculture supplemented by canal and tube
well irrigation. Second belt was formed by the districts of Moga, Faridkot,
Muktsar and Bathinda. In this belt the magnitude of crop diversification was
moderate and index value ranging between 18 index value to 20 index value.
Firstly owing to frequent occurrences of sand dunes, low rainfall, etc. farmers
had grown crops like such as wheat, cotton, pulses etc. Secondly, some canal
irrigation was also available in these districts. Thus, these factors resulted into
moderate magnitude of crop diversification. The third belt was lying in
southern and. eastern parts and covered seven districts namely Jind, Panipat,
Sonipat, Gurgaon Jhajjar, Faridabad and Rohtak. Here both physical and the
socio-economic environment were not favourable. Owing to these factors this
belt had also experienced moderate magnitude of crop diversification.
(c). Areas of low magnitude of crop diversification (>20 index value)
This category was found in the southern parts of the study region and
included Bhiwani, Mahendragarh and Rewari districts. These were
agriculturally backward areas with low annual rainfall, high summer
temperature, sandy soils, low irrigational facilities, etc. In these conditions,
306
only few crops such as wheat, bajra, pulses and oilseeds had grown by the
farmers, because of assured economic returns from these crops. All this had
led to lower magnitude of crop diversification in this category.
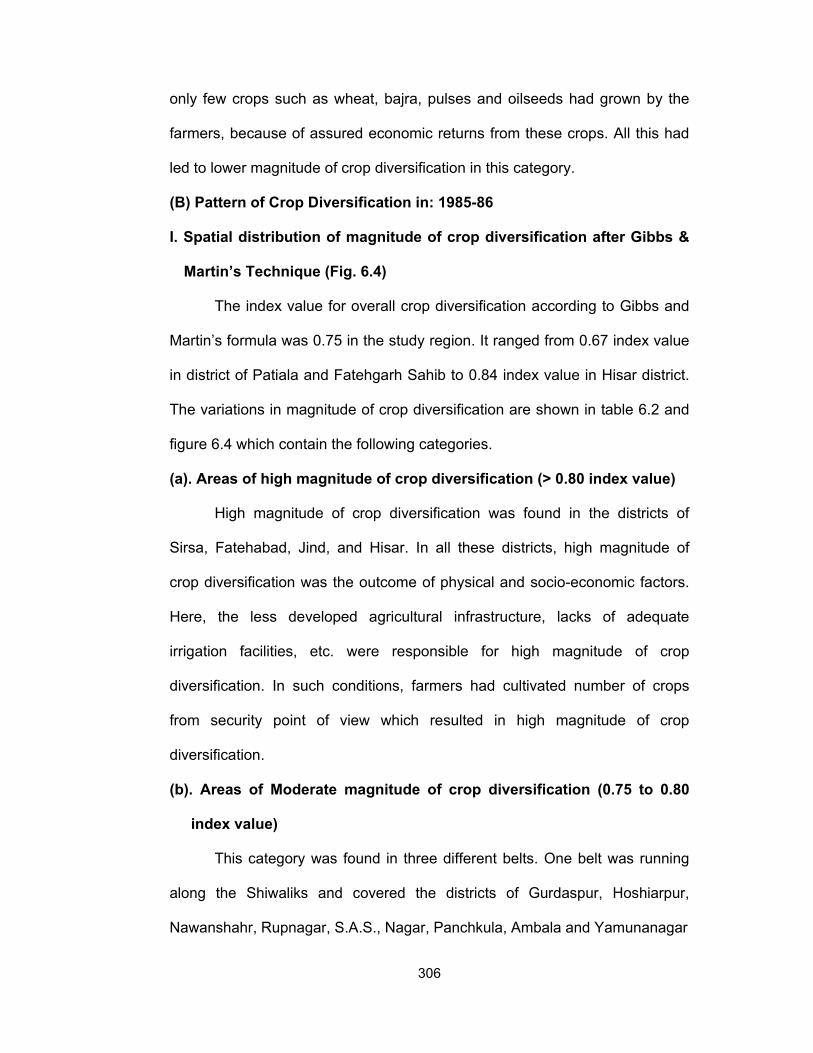
(B) Pattern of Crop Diversification in: 1985-86
I. Spatial distribution of magnitude of crop diversification after Gibbs &
Martin’s Technique (Fig. 6.4)
The index value for overall crop diversification according to Gibbs and
Martin’s formula was 0.75 in the study region. It ranged from 0.67 index value
in district of Patiala and Fatehgarh Sahib to 0.84 index value in Hisar district.
The variations in magnitude of crop diversification are shown in table 6.2 and
figure 6.4 which contain the following categories.
(a). Areas of high magnitude of crop diversification (> 0.80 index value)
High magnitude of crop diversification was found in the districts of
Sirsa, Fatehabad, Jind, and Hisar. In all these districts, high magnitude of
crop diversification was the outcome of physical and socio-economic factors.
Here, the less developed agricultural infrastructure, lacks of adequate
irrigation facilities, etc. were responsible for high magnitude of crop
diversification. In such conditions, farmers had cultivated number of crops
from security point of view which resulted in high magnitude of crop
diversification.
(b). Areas of Moderate magnitude of crop diversification (0.75 to 0.80
index value)
This category was found in three different belts. One belt was running
along the Shiwaliks and covered the districts of Gurdaspur, Hoshiarpur,
Nawanshahr, Rupnagar, S.A.S., Nagar, Panchkula, Ambala and Yamunanagar

307
Table 6.2
Index of Crop Diversification in Punjab Haryana Plains: 1985-86
DISTRICT Gibbs & Matrin Bhatia Singh
Gurdaspur 0.76 27.34 22.71 Amritsar 0.73 27.96 22.51 Tarn Taran 0.73 28.21 22.72 Kapurthala 0.73 27.49 22.65 Jalandhar 0.73 27.14 22.11 Nawanshahr 0.76 21.87 21.87 Hoshiarpur 0.76 25.08 18.31 Rupnagar 0.77 21.34 18.49 S.A.S. Nagar 0.77 24.93 17.94 Ludhiana 0.70 36.79 22.60 Firozpur 0.72 26.94 22.55 Faridkot 0.76 20.70 18.42 Muktsar 0.76 21.51 18.65 Moga 0.77 21.31 18.25 Bathinda 0.76 25.51 18.00 Mansa 0.76 25.13 18.13 Sangrur 0.73 27.47 22.26 Patiala 0.67 39.11 29.23 Fatehgarh Sahib 0.67 39.26 28.79 Ambala 0.78 23.98 17.60 Panchkula 0.79 23.33 16.99 Yamunanagar 0.80 23.50 17.19 Kurukshetra 0.68 29.60 29.60 Kaithal 0.68 29.86 29.86 Karnal 0.70 28.58 28.58 Panipat 0.73 26.56 22.09 Sonipat 0.73 25.47 18.24 Rohtak 0.76 21.45 18.36 Jhajjar 0.76 21.14 18.25 Faridabad 0.76 25.40 18.17 Gurgaon 0.79 20.10 19.13 Rewari 0.76 23.26 19.60 Mahendragarh 0.76 23.77 19.60 Bhiwani 0.75 25.94 19.50 Jind 0.82 16.92 15.78 Hisar 0.84 15.68 15.68 Fatehabad 0.83 18.23 15.39 Sirsa 0.82 19.54 15.80 REGION 0.75 25.17 20.65 Source: Statistical Abstracts of Punjab and Haryana - 1986

0 40
Kms
Low
Medium
High
Index Value
Statistical Abstracts of Punjab and Haryana - 1986Source:
Region's Average = .75
< .75
.75-.80
> .80
Magnitude
PUNJAB-HARYANA PLAINS
Crop Diversification Regions:1985-86(Gibbs & Martin's Technique)
Fig. 6.4

308
districts. With the ushering of Green Revolution Technology, development of
agricultural infrastructure, increase in irrigational facilities made these districts
to do cultivation of vegetables, sugarcane, wheat, rice, cotton, fodder and
pulses crops. All these reasons were responsible for moderate magnitude of
crop diversification. Second belt covered the district of Moga, Faridkot,
Muktsar, Bathinda and Mansa. In these district farmers had preferred to grow
wheat, cotton, pulses and fodder crops owing to the suitability of Physical
climate which resulted in moderate magnitude of crop diversification. The third
belt contained the districts of Bhiwani, Rohtak, Jhajjar, Mahendragarh,
Rewari, Gurgaon and Faridabad. In these districts, the harsh physical
environment and less developed socio-economic conditions had allowed the
farmers to cultivate only few crops. Thus, farmers were preferred to grow only
those crops which respond well in such geo-climatic conditions. Owing to all
these reasons, the magnitude of crop diversification was recorded moderate
in these districts.
(c). Areas of low magnitude of crop diversification (< 0.75 index value)
Fourteen out of thirty eight districts were covered by this category.
These were the districts of Amritsar, Tarn Taran, Firozpur, Kapurthala,
Jalandhar, Ludhiana, Sangrur, Fatehgarh Sahib, Patiala, Kurukshetra, Kaithal,
Karnal, Panipat and Sonipat. Firstly the favourable physical environment for
crop farming, secondly with the advent of Green Revolution Technology, and
the development of agricultural infrastructure had encouraged the farmers to
grow only those crops which give maximum economic-returns to them. Owing
to these reasons, farmers had preferred to grow wheat, rice and fodder crop
which resulted into low magnitude of crop diversification.
309
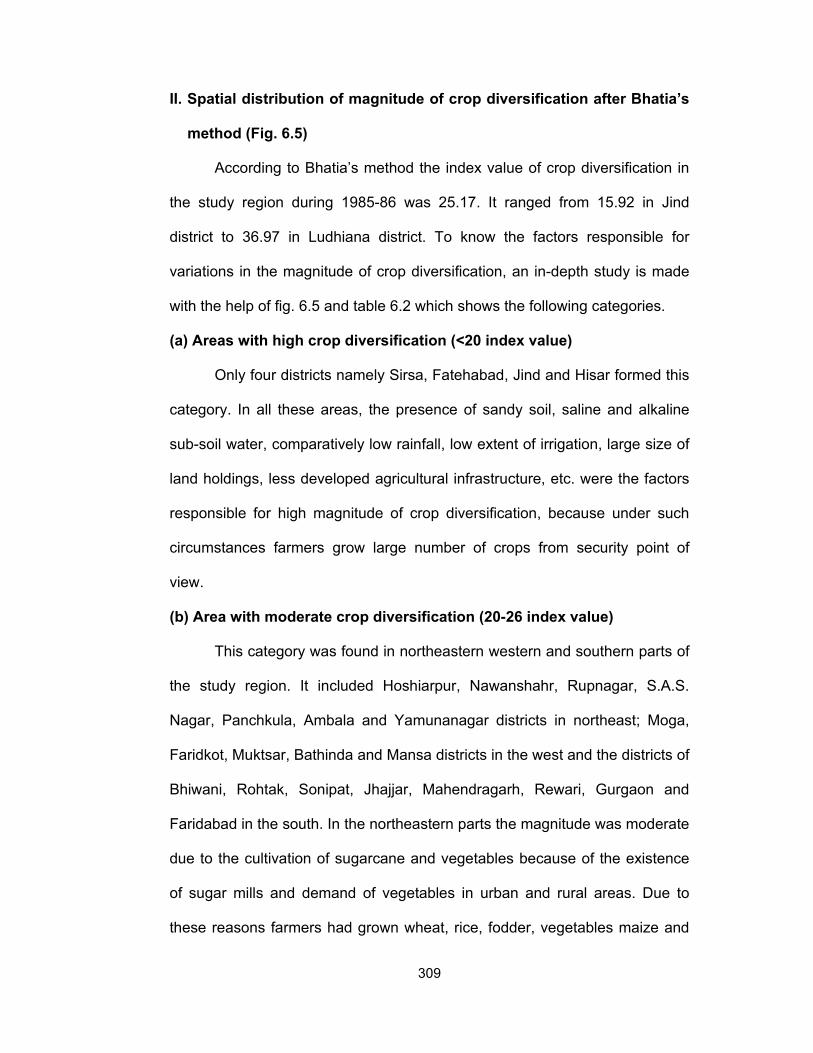
II. Spatial distribution of magnitude of crop diversification after Bhatia’s
method (Fig. 6.5)
According to Bhatia’s method the index value of crop diversification in
the study region during 1985-86 was 25.17. It ranged from 15.92 in Jind
district to 36.97 in Ludhiana district. To know the factors responsible for
variations in the magnitude of crop diversification, an in-depth study is made
with the help of fig. 6.5 and table 6.2 which shows the following categories.
(a) Areas with high crop diversification (<20 index value)
Only four districts namely Sirsa, Fatehabad, Jind and Hisar formed this
category. In all these areas, the presence of sandy soil, saline and alkaline
sub-soil water, comparatively low rainfall, low extent of irrigation, large size of
land holdings, less developed agricultural infrastructure, etc. were the factors
responsible for high magnitude of crop diversification, because under such
circumstances farmers grow large number of crops from security point of
view.
(b) Area with moderate crop diversification (20-26 index value)
This category was found in northeastern western and southern parts of
the study region. It included Hoshiarpur, Nawanshahr, Rupnagar, S.A.S.
Nagar, Panchkula, Ambala and Yamunanagar districts in northeast; Moga,
Faridkot, Muktsar, Bathinda and Mansa districts in the west and the districts of
Bhiwani, Rohtak, Sonipat, Jhajjar, Mahendragarh, Rewari, Gurgaon and
Faridabad in the south. In the northeastern parts the magnitude was moderate
due to the cultivation of sugarcane and vegetables because of the existence
of sugar mills and demand of vegetables in urban and rural areas. Due to
these reasons farmers had grown wheat, rice, fodder, vegetables maize and
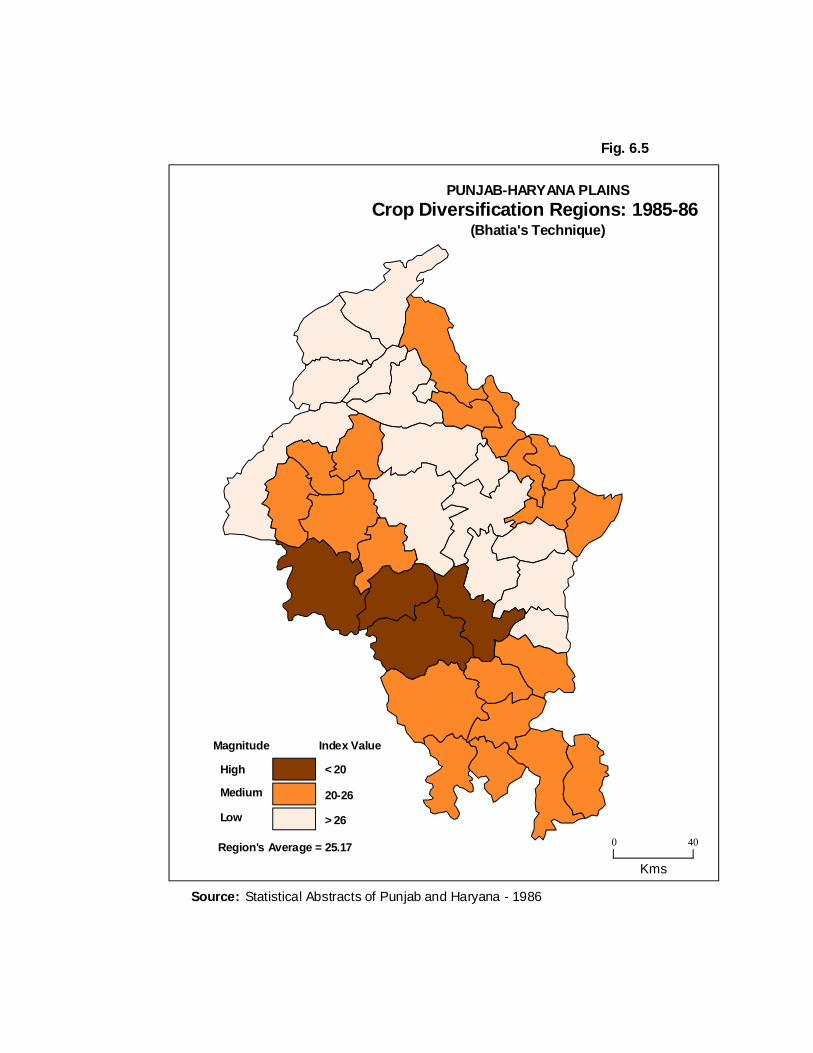
0 40
Kms
Low
Medium
High
Index Value
> 26
20-26
< 20
Magnitude
Region's Average = 25.17
Statistical Abstracts of Punjab and Haryana - 1986Source:
PUNJAB-HARYANA PLAINS
Crop Diversification Regions: 1985-86(Bhatia's Technique)
Fig. 6.5

310
sugarcane which resulted into moderate index value of crop diversification.
The districts of western and southern parts have sandy, low rainfall, high
temperature, adequate development of canal irrigation etc. All these factors
made viable the growing of crops like wheat, cotton, rice, fodder, pulses. Thus
a moderate magnitude of crop diversification was noted in these districts.
(c) Areas with low crop diversification (>26 index value)
This category covered the central parts of Study region and comprised
the districts of Gurdaspur, Amritsar, Tarn Taran, Firozpur, Kapurthala,
Jalandhar, Ludhiana, Sangrur, Fatehgarh Sahib, Patiala, Kurukshetra, Kaithal,
Karnal, and Panipat, In these areas, flat land, well developed agricultural
infrastructure, high extent of irrigation, fertile soil, etc. had encouraged the
farmers to grow only those crops which fetched higher & assured economic
returns to them. Owing to all these factors, the magnitude of crop
diversification was noted low in this category.
iii. Spatial distribution of magnitude of crop diversification after Singh's
method. (Fig. 6.6)
In 1985-86, the overall index value for the study region after Singh's
method was recorded 20.65. Though there was a great variation in the index
value spatially. It was recorded lowest of 15.39 in Fatehabad district and
highest of 29.86 in Kaithal district. It shows that the magnitude of crop
diversification was not uniform but it was highly varied in different districts of
the study region which was the result of partly the physical environment and
partly the socio economic environment. Thus for making detailed study in
variation of crop diversification and factors responsible for them, help is taken
from fig. 6.6 and table 6.2 which highlight the following 3 categories.

Low
Medium
High
Index Value
> 22
16-22
< 16
Magnitude
Region's Average = 20.65
Statistical Abstracts of Punjab and Haryana - 1986Source:
PUNJAB-HARYANA PLAINS
Crop Diversification Regions: 1985-86(Singh's Technique)
Fig. 6.6
0 40
Kms
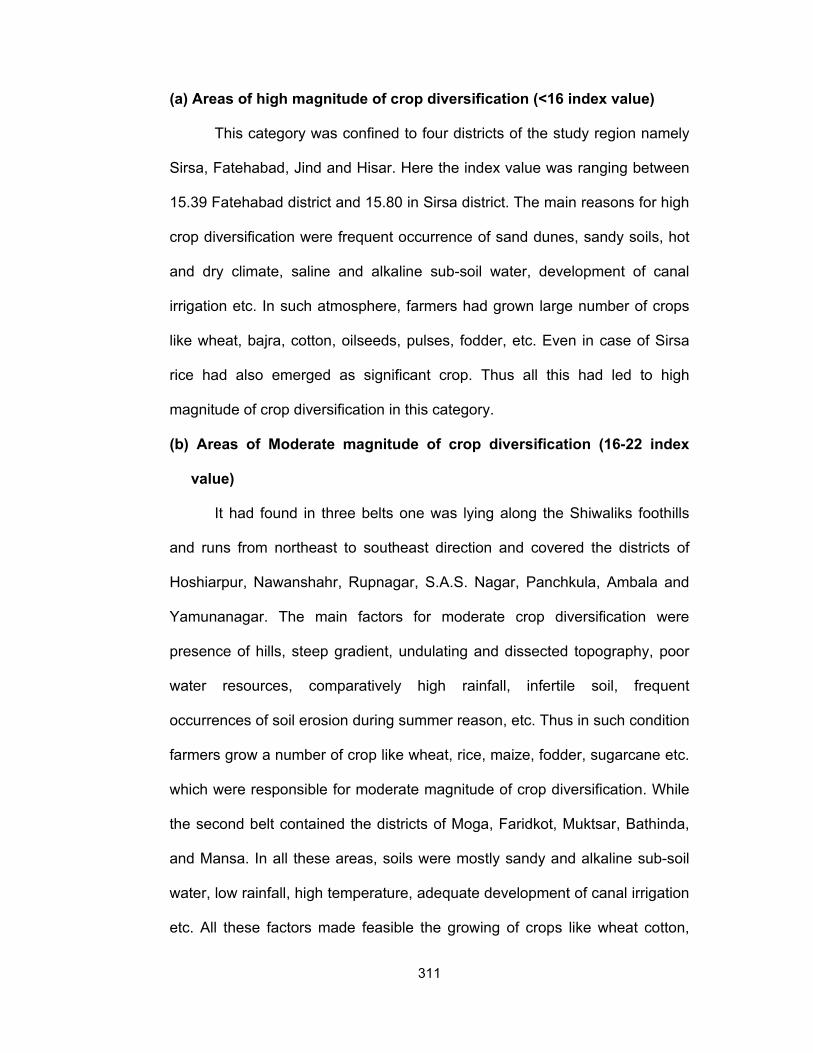
311
(a) Areas of high magnitude of crop diversification (<16 index value)
This category was confined to four districts of the study region namely
Sirsa, Fatehabad, Jind and Hisar. Here the index value was ranging between
15.39 Fatehabad district and 15.80 in Sirsa district. The main reasons for high
crop diversification were frequent occurrence of sand dunes, sandy soils, hot
and dry climate, saline and alkaline sub-soil water, development of canal
irrigation etc. In such atmosphere, farmers had grown large number of crops
like wheat, bajra, cotton, oilseeds, pulses, fodder, etc. Even in case of Sirsa
rice had also emerged as significant crop. Thus all this had led to high
magnitude of crop diversification in this category.
(b) Areas of Moderate magnitude of crop diversification (16-22 index
value)
It had found in three belts one was lying along the Shiwaliks foothills
and runs from northeast to southeast direction and covered the districts of
Hoshiarpur, Nawanshahr, Rupnagar, S.A.S. Nagar, Panchkula, Ambala and
Yamunanagar. The main factors for moderate crop diversification were
presence of hills, steep gradient, undulating and dissected topography, poor
water resources, comparatively high rainfall, infertile soil, frequent
occurrences of soil erosion during summer reason, etc. Thus in such condition
farmers grow a number of crop like wheat, rice, maize, fodder, sugarcane etc.
which were responsible for moderate magnitude of crop diversification. While
the second belt contained the districts of Moga, Faridkot, Muktsar, Bathinda,
and Mansa. In all these areas, soils were mostly sandy and alkaline sub-soil
water, low rainfall, high temperature, adequate development of canal irrigation
etc. All these factors made feasible the growing of crops like wheat cotton,

312
rice, fodder and pulses. Thus, moderate magnitude of crop diversification was
noted in this belt. The third belt was found in the southern districts of the study
region which had contained Sonipat, Rohtak, Bhiwani, Jhajjar, Mahendragarh,
Rewari, Gurgaon and Faridabad districts. These were problematic areas from
agricultural point of view because of the rugged relief poor irrigational
facilities, sand dunes, low rainfall, less developed agricultural infrastructure,
nearness to Delhi in case of Sonipat, Gurgaon and Faridabad districts. Owing
to all these reasons, the farmers of these districts had grown crop like Wheat,
Bajra, oilseeds, pulses and fodder. This had resulted in moderate magnitude
of crop diversification.
(c) Area of low magnitude of crop diversification (>22 index value)
Central Parts of study region formed this category. It was a continuous
compact belt and comprised the districts of Gurdaspur, Amritsar, Tarn Taran,
Firozpur, Kapurthala, Jalandhar, Ludhiana, Sangrur, Fatehgarh Sahib,
Patiala, Kurukshetra, Kaithal, Karnal, and Panipat. These areas were blessed
with flat land, fertile soils, fresh sub-soil water, which encouraged tubewells
irrigation, high extent of irrigation, high diffusion of Green Revolution
Technology, progressive farmers, well developed network of roads and
railways, existence of major urban centers of the study region, etc. These
factors became instrumental in the development of agriculture. In such
favourable physical environment and developed, socio-economic
environment, farmers had become choosy for cultivation of crops. They had
grown few crops namely wheat, rice and fodder and had left crops like
oilseeds, pulses, spices, maize, etc. Owing to all these reasons this category
has recorded low magnitude of crop diversification.

313
From the preceding discussion, the present researcher has found that
areas having favorable physical environment with highly developed
agricultural infrastructure had experienced low magnitude of crop
diversification. Whereas farmers struggling with either harsh physical
environment or less developed agricultural infrastructure or both had
experienced moderate to high magnitude of crop diversification.
(C) Patterns of Crop Diversification: 2005-06
I. Pattern of crop diversification after Gibbs & Martin's Technique
(2005-06)
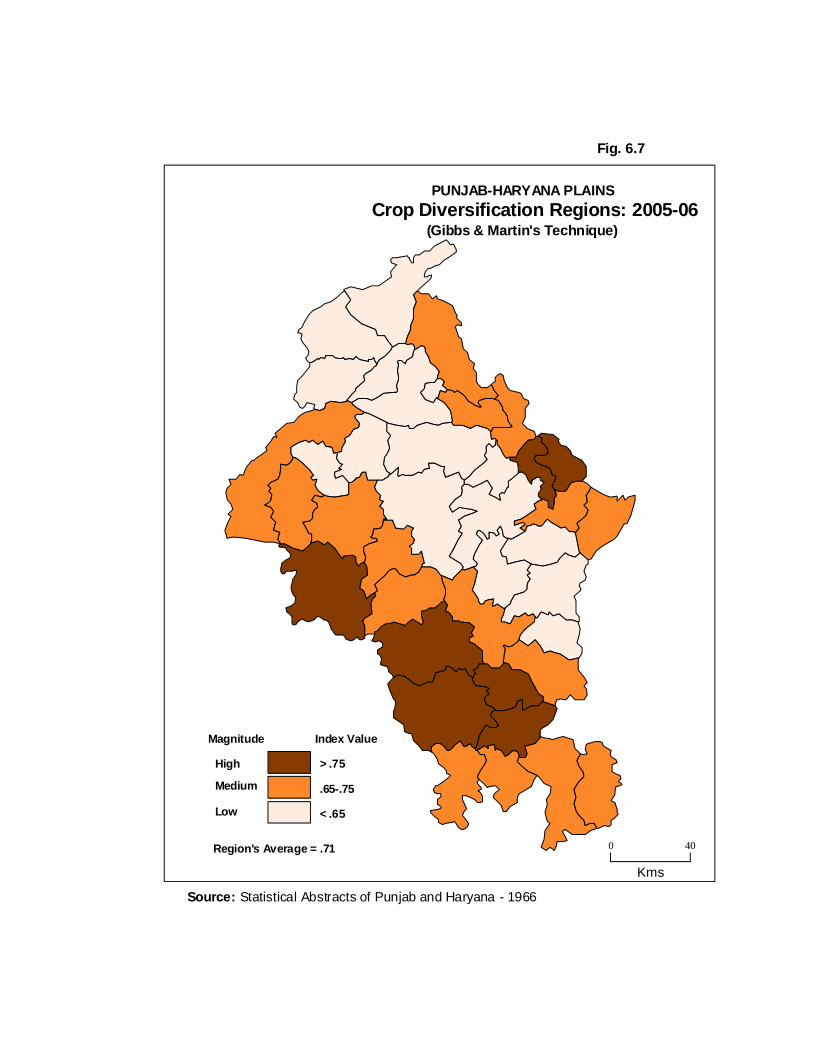
Overall index value of crop diversification after Gibbs & Martin
technique in Punjab-Haryana plains during 2005-06 is 0.71. But it ranges from
0.61 in Tarn Taran districts to 0.86 in Bhiwani district. These index value
shows that there is a great variation in the magnitude of crops diversification
in the study region. These variations in the magnitude of crop diversification
are the result of organizational factors, government policies, etc. and
variations in physical environment. To know the factors responsible for
variations in the magnitude of crop diversification, an in-depth study is made
with the help of fig.6.6 and table 6.3 which portrays the following three
categories.
(a). Areas of high crop diversification (>0.75)
This category is mainly confined to western parts of the study region
which covers the districts of Sirsa, Hisar, Bhiwani, Rohtak, and Jhajjar. These
are the sandy areas with low annual rainfall and poor agricultural
infrastructure. Thus farmers grow more crops which have resulted into high
magnitude of crop diversification. Leaving aside this major belt, a small patch

314
Table 6.3
Index of Crop Diversification in Punjab Haryana Plains: 2005-06
DISTRICT Gibbs & Matrin Bhatia Singh
Gurdaspur 0.64 41.87 30.37 Amritsar 0.63 42.72 32.01 Tarn Taran 0.61 44.00 31.91 Kapurthala 0.63 40.41 22.87 Jalandhar 0.64 42.60 22.80 Nawanshahr 0.74 25.00 22.48 Hoshiarpur 0.74 25.01 20.24 Rupnagar 0.73 25.61 21.61 S.A.S. Nagar 0.79 29.24 21.50 Ludhiana 0.64 42.15 31.22 Firozpur 0.74 30.10 23.72 Faridkot 0.64 30.04 24.58 Muktsar 0.69 31.00 24.19 Moga 0.61 44.01 31.51 Bathinda 0.70 30.11 23.63 Mansa 0.70 31.20 24.33 Sangrur 0.63 43.10 31.51 Patiala 0.62 43.57 32.04 Fatehgarh Sahib 0.63 43.09 31.79 Ambala 0.71 29.97 20.10 Panchkula 0.78 21.63 19.70 Yamunanagar 0.74 25.40 21.01 Kurukshetra 0.64 41.18 30.59 Kaithal 0.62 43.32 31.67 Karnal 0.62 43.41 30.82 Panipat 0.64 35.03 31.03 Sonipat 0.71 41.53 22.72 Rohtak 0.81 22.42 12.31 Jhajjar 0.80 21.83 18.65 Faridabad 0.74 29.19 24.19 Gurgaon 0.73 25.10 23.82 Rewari 0.70 30.21 23.76 Mahendragarh 0.69 30.39 24.15 Bhiwani 0.86 19.73 16.27 Jind 0.73 25.51 18.94 Hisar 0.81 17.88 17.88 Fatehabad 0.74 22.71 20.20 Sirsa 0.77 22.36 19.21 REGION 0.71 31.62 24.52 Source: Statistical Abstracts of Punjab and Haryana – 2006.
0 40
Kms
(Gibbs & Martin's Technique)Crop Diversification Regions: 2005-06
PUNJAB-HARYANA PLAINS
Low
Medium
High
Index Value
Statistical Abstracts of Punjab and Haryana - 1966Source:
Region's Average = .71
< .65
.65-.75
> .75
Magnitude
Fig. 6.7

315
of the category of high crop diversification is also found in the northeast
covering the districts of S.A.S. Nagar and Panchkula. These two districts are
the neighboring districts of the Chandigarh union Territory. Owing to nearness
of tricity of S.A.S. Nagar, Panchkula, and Chandigarh, these districts have to
fulfill the requirements of vegetables and fodder. Thus, farmers of these two
districts grow wheat, maize, vegetables, fodder, rice etc. which lead to high
magnitude of crop diversification in these districts.
(b). Areas of moderate crop diversification (0.65 to 0.75 index value)
Sixteen districts form the category of moderate crop diversification,
namely Hoshiarpur Nawanshahr, Rupnagar, Firozpur, Muktsar, Bathinda,
Mansa, Fatehabad, Jind, Sonipat, Mahendragarh, Rewari, Gurgaon,
Faridabad, Ambala and Yamunanagar. Fig 6.7 shows that this category is
found in three different belts. The first belt is lying along the shiwaliks which
runs from northwest to southeast direction along the Shiwalik foothills. But it is
interrupted by the districts of Panchkula and S.A.S. Nagar which belongs to
high category. The main reasons for moderate crop diversification are
presence of Shiwalik hills, Steep gradient, undulating and dissected
topography, comparatively high rainfall, poor soils, low extent of irrigation,
small size of landholding etc. All these factors have led to moderate crop
diversification in this belt except the district of Yamunanagar which is also
having bet areas along the river Yamuna where the soils are fertile which are
suitable for the growing of sugarcane, developed agricultural infrastructure,
etc. These factors are responsible for moderate crop diversification in
Yamunanagar. The second belt runs from Firozpur district in northwest to
Sonipat in southeast. This belt is lying between the category of low crop

316
diversification and high crop diversification. Mostly these districts are having
frequent occurrences of remnant of sand dunes because these are mostly
high levelled, low rainfall, developed canal irrigation, which allow the farmers
to grow wheat, rice, cotton, folder, pulses etc. which ultimately turn these
areas into moderate crop diversification. Third belt of this category is confined
to the southern parts of the study region covering the districts of Faridabad,
Gurgaon, Rewari and Mahendragarh. These are problematic areas from
physical environment point of view. Here either sandy soils or rocky surface
exist with high temperature and low rainfall, poor irrigational facilities,
economically and socially backwardness particularly in Mahendragarh and
Rewari districts. In case of Gurgaon and Faridabad districts nearness to the
National Capital Delhi which requires fodder for milch stock and vegetables
for human consumption on large scale. Thus the farmers of these southern
parts of this category grow mainly wheat, bajra, oilseeds, pulses, vegetables
and fodder crops which lead to moderate magnitude of crop diversification.
(c). Areas of low crop diversification (<0.65 index value)
It constitutes the central parts of the study region. And includes the
districts of Gurdaspur, Amritsar, Tarn Taran, Kapurthala, Jalandhar, Moga,
Faridkot, Ludhiana, Sangrur, Fatehgarh Sahib, Patiala Kurukshetra, Kaithal
Karnal and Panipat. In these districts, well developed network of transport,
high extent of irrigation, high degree of mechanization, diffusion of agricultural
innovations, fertile soils, availability of sub-soil water, high degree of crop
commercialization etc compel the farmers to grow wheat during rabi and rice
during kharif season which resulted in low magnitude of crop diversification.

317
II. Spatial distribution of Crop diversification after Bhatia's Method
(Fig. 6.8)
After Bhatia's method the overall index value of crop diversification in
the study region has noted 31.62 which ranges from 17.88 in Hisar district to
44.00 in Tarn Taran districts. The magnitude of crop diversification is not
uniform in spatial perspective. This great range of the index of crop
diversification is largely due to the variations in geo-climatic conditions. These
variations in the index value of moderate magnitude of crop diversification are
mapped in fig.6.8 and table 6.3 which yields the following categories.
(a) Areas of high crop diversification (<25 index value)
This category comprises the district of Panchkula in northeastern part
of the study region whereas Sirsa, Fatehabad, Hisar, Bhiwani, Rohtak and
Jhajjar districts found in southwestern parts of the study region. High
magnitude of crop diversification in Panchkula district of the study region is
due to the nearness to Chandigarh and the unfriendly terrain for cultivation,
high rainfall, etc. and as a result farmers grow wheat, maize, vegetables,
fodder, etc. which lead to high magnitude of crop diversification. While in the
southwestern parts, the physical environment is harsh to agriculture because
of low rainfall, high temperature, sandy soils, low extent of irrigation, etc.
followed by less developed agricultural infrastructure as compare to central
parts of the study region. Thus, all this resulted into growing of several crops
by farmers from security point of view which ultimately lead to high magnitude
of crop diversification.

0 40
Kms
Low
Medium
High
Index Value
> 35
25-35
< 25
Magnitude
Region's Average = 31.62
Statistical Abstracts of Punjab and Haryana - 2006Source:
PUNJAB-HARYANA PLAINS
Crop Diversification Regions: 2005-06(Bhatia's Technique)
Fig. 6.8

318
(b) Areas of moderate crop diversification (25-35 index value)
About 50 percent of the total occurrences fall in the category of
moderate magnitude of crop diversification. It is found in three different belts:
first belt covers the districts of Mahendragarh, Rewari, Gurgaon and
Faridabad in the southern parts of the study region. Here, existence of sandy
soil, remnants of rocks of the Aravali hills, deep sub soil water, low rainfall,
high temperature, poor agricultural infrastructure, etc. create such an
atmosphere in which farmers have to grow bajra, wheat, pulses, oilseed
crops, etc. and resulted into moderate magnitude of crop diversification. The
second belt of this category is lying between the category of low crop
diversification in the northeast and category of high diversification in the
western parts. It includes the districts of Firozpur, Faridkot, Muktsar, Bathinda,
Mansa and Jind. The reasons responsible for moderate crop diversification in
this belt are the presence of sandy soils, developed canal irrigation, saline
and alkaline aquifers of sub-soil water, comparatively low rainfall and
moderately developed agricultural infrastructure, traditionally cotton growing
areas, followed by the adoption of Green Revolution Technology, farmers
have left the cultivation of grams and bajra largely and presently are growing
wheat, cotton, rice and folder crops at large scale which resulted into
moderate magnitude of crop diversification. Third belt of this category is
covering the district of Panchkula along the Shiwalik foothills. The district was
traditionally maize growing areas. Here, owing to the presence of Shiwalik
and unfriendly terrain, deep sub-soil water, nearly absence of canal irrigation,
comparatively high rainfall and recently diffusion of agricultural innovations

319
have led to the farmers to grow wheat, maize, rice, fodder, sugarcane crops
which ultimately yield the moderate magnitude of crop diversification.
iii. Areas of low crop diversification (>35 index value)
36.8 percent of the total occurrences are covered by this category
which is found in a compact linear belt and runs from northwest to southeast
and is surrounded by moderate category of crop diversification on its both
sides. It covers the districts of Gurdaspur, Amritsar, Tarn Taran, Kapurthala,
Jalandhar, Moga, Ludhiana, Sangrur, Fatehgarh Sahib, Patiala, Kurukshetra,
Kaithal Karnal, Sonipat and Panipat. These areas are having flat land, fertile
soils, developed irrigation, developed transport network, major urban and
industrial centers, awakened farmers, etc. All these factors have enabled teh
farmers to select those crops which fetch assured and higher economic
returns to them. Thus, their choice has fallen on wheat-rice crop rotation
which consequently leads to low crop diversification.
From the interpretation of fig. 6.8 it is registered that areas with suitable
environment for agriculture have high crop diversification, whereas areas with
favourable physical environment and developed socio-economic factors have
noted low crop diversification. While some areas which have experienced
harsh physical environment but developed agricultural infrastructure blessed
with moderate crop diversification or areas with poor socio-economic
environment and harsh physical environment have also noted moderate crop
diversification.

320
III. Spatial Distribution of Magnitude of Crop Diversification after Singh's
Technique (Fig. 6.9)
For calculating the index value of crop diversification in the study
region, Singh's method is also used. The average index value of crop
diversification is found 24.52. But it is not uniform in its spatial perspective. It
ranges between 32.04 in Patiala district to 12.31 in Rohtak district. These
variations in index value of crop diversification is owing to variations in
physiography, rainfall, agricultural infrastructure, etc. To know the factors
responsible for these variations, a detailed study is made in the proceeding
paragraphs. The fig.6.9 and Table 6.3 are prepared from the derived index
values which portray the following three categories. These are:
(a) Areas with high diversification (<20 index value)
This category contains seven districts of the study region. Out of these
seven districts, six are lying in southwestern parts of the study region namely
Sirsa, Bhiwani, Hisar, Rohtak, Jhajjar and Jind districts. These are the sandy
area with low rainfall poor agricultural infrastructure thus in such conditions
there is always a great risk in cultivation of few crops. Therefore, farmers of
these areas grow several crops to overcome the risk of crop failure, so that
they can take at least some assured economic returns from others crops if
one crop failed. Thus, farmers grow more crops which have resulted into high
magnitude of crop diversification. Apart from these six districts, one is lying in
the eastern part of the study region namely Panchkula. In this district, the
presence of hills, undulating and dissected topography. poor soils, inadequate
sub - soil water, comparatively high rainfall, low extent of irrigation, small size
of land holdings, less developed infrastructure, nearness to Chandigarh and

0 40
Kms
Low
Medium
High
Index Value
> 25
20-25
< 20
Magnitude
Region's Average = 24.52
Statistical Abstracts of Punjab and Haryana - 2006Source:
PUNJAB-HARYANA PLAINS
Crop Diversification Regions: 2005-06(Singh's Technique)
Fig. 6.9

321
existence of Panchkula town, etc have compelled the farmers to grow wheat,
maize, fodder, vegetables, etc. which resulted into high crop diversification.
(b) Areas of moderate crop diversification (20-25index value)
The category of moderate crop diversification comprises 42 percent of
the total occurrence. This category is found in three different belts and one
patch. The first belt comprises five districts namely Kapurthala, Jalandhar,
Faridkot, Muktsar, Faridkot, Bathinda, Mansa and Fatehabad. All these
districts were traditionally cotton growing areas during 1965-66. But with the
diffusion of agricultural innovations, rice has also emerged as additional crop
which is having third ranking position in the overall cropping pattern of this
belt. Being a sand dunes predominant area, with low rainfall, saline and
alkaline sub-soil water, this region grows only wheat, cotton, rice, and fodder
as major crops and consequently has moderate crop diversification. Whereas
the second belt covers the southern districts namely Mahendragarh, Rewari,
Gurgaon and Faridabad. In this second belt, owing to difficult terrain which is
sandy or rocky with poor irrigational facilities, low rainfall and near to Delhi is
having moderate crop diversification and major crops are bajra, oilseeds,
pulses, wheat, and fodder. In case of small patches which cover Sonipat
district the moderate crop diversification is due to nearness to Delhi and
cultivation of wheat, rice, fodder and vegetables. While the third belt covers
the districts along the Shiwalik foothills. These are Hoshiarpur, Nawanshahr,
Rupnagar, S.A.S. Nagar, Yamunanagar and Ambala districts. In all these
areas physical environment does not allow the cultivation of more crops
because of steep gradient, undulating and dissected topography, soil erosion,
deep sub-soil water, poor irrigational facilities, high rainfall, etc. And as a

322
result major crops grown in this belt are wheat, maize, rice, fodder. But in
case of Yamunanagar district major crops are wheat, rice, sugarcane, fodder,
etc. All these factors are responsible for moderate crop diversification.
(c) Areas of low crop diversification (>25 index value)
This category is found in the districts of Gurdaspur, Amritsar, Tarn
Taran, Moga, Ludhiana, Fatehgarh sahib, Sangrur, Patiala, Kurukshetra,
Kaithal, Karnal and Panipat. In all these areas, flat land, well developed
network of transport, high extent of irrigation, high degree of mechanization,
moderate size of land holdings, diffusion of agricultural innovations, fertile
soils, fresh aquifers of sub-soil waters, high degree of commercialization etc.
are the factors responsible for low magnitude of crop diversification.
Changes in Crop Diversification
Drastic changes in technological, infrastructural, organisational, social
institutions, etc. have taken place during the period under present
investigation. For instance extension in irrigational facilities, extent in net
sown area, increase in area sown more than once, increase in intensity of
cropping, increase in area under HYV of seeds particularly wheat and rice
crops, increase in use of chemical fertilizers and plant protection measure,
increase in density of tube wells and density of tractors, increase in wheat
threshers and harvest combines, rural link roads, rural electrification, market
networks, remunerative prices, liberal credit facilities, government policies,
agriculture search and extension services, farmers training programmes, etc.
This remarkable increase in the proceeding of factors have led to dramatic
changes in the land use and cropping pattern. The cropping pattern of 1965-
66 was of highly diversified in nature. But, it had changed into low magnitude

323
of crop diversification in 1985-86 and further changes to more low magnitude
of crop diversification in 2005-06 which lead to the cultivation of few crops by
the farmers, for instance wheat- rice crop rotation in central parts of the study
region, wheat, maize, rice, fodder crops along the Shiwaliks, wheat-cotton and
wheat-cotton-rice along the western parts and Bajra, wheat, oil seeds, fodder
in the southern parts. Thus, adoption of these crops by the farmers depends
upon higher and assured economic returns from the crops and thus farmers
have become choosy while selecting the cultivation of crops. And as a result
those crops which were not remunerative were left by the farmers and
consequently those crops have disappeared from the agricultural land scape.
For instance grams have disappeared in central parts and maize along the
Shiwaliks.
Thus in lieu of the above mentioned paragraph, the present researcher
is going to discuss and explain the changes in crop diversification in the study
region during 1965-65 to 2005-06. Here the change in crop diversification
which has taken place in the study region is to be discussed technique-wise,
because the researcher has taken three techniques for calculating the index
of crop diversification. These are Gibbs & Martin Technique, Bhatia's
Technique and Singh's Techniques.
A. Changes in crops diversification after Gibbs & Martin Techniques
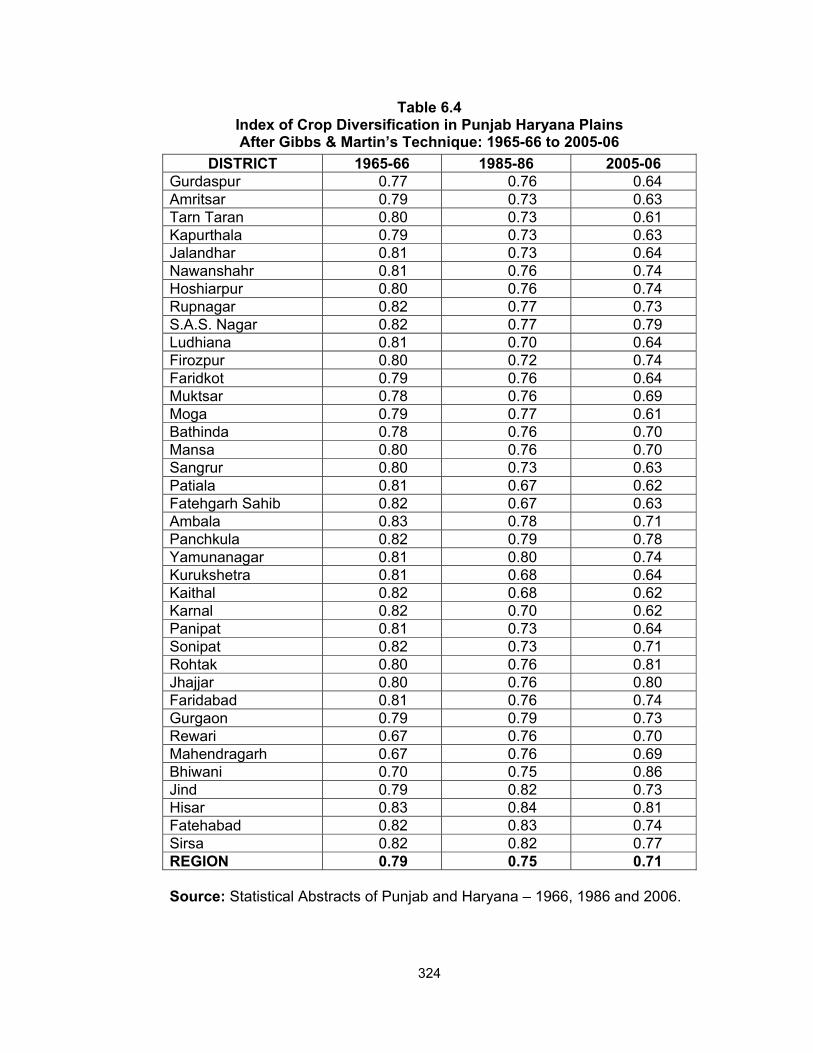
The study of fig 6.1, 6.4 and 6.7 and table 6.4 highlights the following
trends:
(i) After Gibbs & Martin Technique, the overall index value of crop
diversification was noted 0.79 in 1965-66 which had declined to 0.75 in
1985-86 and it has further gone down to 0.71 in 2005-06. It shows that
324
Table 6.4 Index of Crop Diversification in Punjab Haryana Plains After Gibbs & Martin’s Technique: 1965-66 to 2005-06
DISTRICT 1965-66 1985-86 2005-06 Gurdaspur 0.77 0.76 0.64 Amritsar 0.79 0.73 0.63 Tarn Taran 0.80 0.73 0.61 Kapurthala 0.79 0.73 0.63 Jalandhar 0.81 0.73 0.64 Nawanshahr 0.81 0.76 0.74 Hoshiarpur 0.80 0.76 0.74 Rupnagar 0.82 0.77 0.73 S.A.S. Nagar 0.82 0.77 0.79 Ludhiana 0.81 0.70 0.64 Firozpur 0.80 0.72 0.74 Faridkot 0.79 0.76 0.64 Muktsar 0.78 0.76 0.69 Moga 0.79 0.77 0.61 Bathinda 0.78 0.76 0.70 Mansa 0.80 0.76 0.70 Sangrur 0.80 0.73 0.63 Patiala 0.81 0.67 0.62 Fatehgarh Sahib 0.82 0.67 0.63 Ambala 0.83 0.78 0.71 Panchkula 0.82 0.79 0.78 Yamunanagar 0.81 0.80 0.74 Kurukshetra 0.81 0.68 0.64 Kaithal 0.82 0.68 0.62 Karnal 0.82 0.70 0.62 Panipat 0.81 0.73 0.64 Sonipat 0.82 0.73 0.71 Rohtak 0.80 0.76 0.81 Jhajjar 0.80 0.76 0.80 Faridabad 0.81 0.76 0.74 Gurgaon 0.79 0.79 0.73 Rewari 0.67 0.76 0.70 Mahendragarh 0.67 0.76 0.69 Bhiwani 0.70 0.75 0.86 Jind 0.79 0.82 0.73 Hisar 0.83 0.84 0.81 Fatehabad 0.82 0.83 0.74 Sirsa 0.82 0.82 0.77 REGION 0.79 0.75 0.71 Source: Statistical Abstracts of Punjab and Haryana – 1966, 1986 and 2006.

325
during the study period the trend of crop diversification was from high to
low which shows that region's agriculture has transformed from highly
diversified in 1965-66 to highly specialized in 2005-06.
(ii) The index value of crop diversification was recorded lowest of 0.67 in case
of Rewari and Mahendragarh districts in 1965-66, while it was recorded
highest of 0.83 in Ambala district. Whereas in 1985-86 the minimum value
of 0.67 was found in Fatehgarh sahib and Patiala districts. While during
1965-66, these values were of 0.82 and 0.81 respectively it shows these
areas were having high crop diversification in 1965-66 had recorded low
crop diversification in 1985-86. But in case of Mahendragarh and Rewari
districts the index value of crop diversification had increased to 0.76 and
0.76 in 1985-86 respectively which shows the trends towards high crop
diversification. The major reasons for high crop diversification in case of
Mahendragarh and Rewari districts were the deterministic nature of
physical environment and poor development of agricultural infrastructure.
Thus farmers had grown more crops in 1985-86. But in case of Fatehgarh
Sahib and Patiala districts due to well-developed agricultural
infrastructure, the trends is toward low crop diversification. In the year
2005-06 the minimum index value of crop diversification of .61 is recorded
in Tarn Taran district which had .80 and .73 during 1965-66 and 1985-86
respectively. This trend of low crop diversification was also owing to
developed agricultural Infrastructure whereas the highest index of crop
diversification of 0.86 is noted in Bhiwani district during 2005-06 and in
Bhiwani district the trend is from low crop diversification to high crop
diversification which is largely the result of less developed agricultural

326
infrastructure and harsh physical environment. Thus when there was no
development in agricultural infrastructure, the physical environment had
allowed the cultivation of few Crops. But when some development has
taken place in infrastructure, farmers started growing more crops which
has led to high crop diversification in Bhiwani district.
(iii) An Intelligent look of fig. 6.1, 6.4, 6.7 yields that during 1965-66, the high
crop diversification areas were lying in eastern parts and some areas in
southwestern parts. But in 1965-66, areas of high crop diversification had
almost shifted to western parts comprising the districts of Sirsa Fatehabad
and Hisar. But in 2005-06, high crop diversification belt has expanded in
southwestern parts, and covers five districts of the study region. Two
districts of high category are also found in eastern parts covering S.A.S.
Nagar and Panchkula districts of the study region. It shows that category
of high crop diversification has shifted its area. Firstly this category was
predominant particularly in eastern parts of the study Region, but in 1985-
86 it had shrunk and confined to southwestern parts and again in 2005-
06, it has slightly expanded and covered the western and central eastern
and southwestern parts. Moreover, the numbers of districts in 1985-86
were four but in 2005-06 it goes down to seven districts. But at the same
time in 1965-66, the index value of high crop diversification was over 0.80
which had remained the same in 1985-86 also. In 2005-06 the index value
of high category of crop diversification has declined from over 0.80 to 0.75
which shows that trend is towards crop specialization.

327
B. Changes in crops diversification after Bhatia's Techniques
The analysis of figures 6.2, 6.5 and 6.8 and table 6.5 shows that the
overall index value of crop diversification has increased during the study
period. It was recorded 21.35, 25.17 and 31.62 in 1965-66, 1985-1986 and
2005-06 respectively. This indicates that the trend in crop diversification is
from high to low.
(i) The index value of crop diversification was recorded lowest of 17.07 in
Hisar District and highest of 28.22 in Rewari district which indicates that
Rewari district has the lowest magnitude of crop diversification and Hisar
district had the highest crop diversification in the study region during
1965-66.
(ii) It is also found that 25 out of 38 districts had experienced high magnitude
of crop diversification in 1965-66 (fig. 6.2) whereas in 1985-86, the
magnitude of high crop diversification became limited to only four districts
namely Hisar, Fatehabad, Sirsa and Jind (cf. fig. 6.5). In all these areas
the index value was recorded below 20. But in 2005-06, high magnitude
of crop diversification is found in the seven districts of the study region.
And out of seven, six districts namely Sirsa, Fatehabad Hisar, Bhiwani,
Rohtak and Jhajjar confined to southern parts of the study region and
one district namely Panchkula to the Shiwalik hills.
(iii) The moderate category of crop diversification in 1965-66 had contained the districts of Amritsar, Tarn Taran, Muktsar, Moga, Bathinda, Mansa, Sangrur, Rohtak, Jhajjar and Gurgaon. But in 1985-86 this category had expanded and covered 20 districts. It had captured area from the category of high magnitude in 1965-66, especially along the Shiwaliks.

328
Table 6.5
Index of Crop Diversification in Punjab Haryana Plains After Bhatia’s Technique: 1965-66 to 2005-06
DISTRICT 1965-66 1985-86 2005-06 Gurdaspur 21.31 27.34 41.87 Amritsar 23.90 27.96 42.72 Tarn Taran 22.81 28.21 44.00 Kapurthala 21.17 27.49 40.41 Jalandhar 20.10 27.14 42.60 Nawanshahr 21.95 21.87 25.00 Hoshiarpur 20.69 25.08 25.01 Rupnagar 19.71 21.34 25.61 S.A.S. Nagar 20.01 24.93 29.24 Ludhiana 19.64 36.79 42.15 Firozpur 19.82 26.94 30.10 Faridkot 21.75 20.70 30.04 Muktsar 22.09 21.51 31.00 Moga 22.04 21.31 44.01 Bathinda 23.99 25.51 30.11 Mansa 23.93 25.13 31.20 Sangrur 23.91 27.47 43.10 Patiala 19.82 39.11 43.57 Fatehgarh Sahib 21.60 39.26 43.09 Ambala 17.81 23.98 29.97 Panchkula 17.75 23.33 21.63 Yamunanagar 20.60 23.50 25.40 Kurukshetra 20.70 29.60 41.18 Kaithal 19.96 29.86 43.32 Karnal 20.54 28.58 43.41 Panipat 18.44 26.56 35.03 Sonipat 18.29 25.47 41.53 Rohtak 22.01 21.45 22.42 Jhajjar 22.86 21.14 21.83 Faridabad 21.24 25.40 29.19 Gurgaon 22.18 20.10 25.10 Rewari 28.22 23.26 30.21 Mahendragarh 24.31 23.77 30.39 Bhiwani 27.05 25.94 19.73 Jind 21.92 16.92 25.51 Hisar 17.07 15.68 17.88 Fatehabad 19.13 18.23 22.71 Sirsa 19.46 19.54 22.36 REGION 21.35 25.17 31.62 Source: Statistical Abstracts of Punjab and Haryana – 1966, 1986 and 2006.

329
Whereas in 2005-06, it has covered sixteen districts namely Firozpur,
Faridkot, Muktsar, Bathinda, Mansa, Rewari, Jind, Faridabad, Gurgaon,
Mahendragarh, Hoshiarpur, Nawanshahr, Rupnagar, S.A.S. Nagar and
Yamunanagar. All this shows that the trend was from high crop
diversification to moderate crop diversification and low crop
diversification.
(iv) It is noted that there were only three districts namely Rewari,
Mahendragarh and Bhiwani which had low magnitude of crop
diversification in 1965-66. It was the result of harsh physical environment
which did not allow the farmers to grow more corps. But in 1985-86, with
the development of agricultural infrastructure and introduction of Green
Revolution Technology the category of low crop diversification had
expanded and covered 14 districts which were lying in central parts and
north-western parts of the study region. These were highly agriculturally
developed areas where wheat-rice crop rotation had emerged. There is
addition of two districts namely Sonipat and Moga which had shifted from
moderate category to low category, but Firozpur districts had shifted from
low category to Moderate category during 2005-06 (c.f. fig. 6.5 and 6.8).
It is highly agriculturally developed area of the study region which is
found in a compact belt and runs through the central parts right from
Amritsar district in the Northwest to Sonipat district in the Southeast.
(v) Thus the above mentioned discussion revealed that spatially category of
high crop diversification was predominant in 1965-66, and very small
area was covered by the category of low magnitude of crop
diversification. Whereas the category of high magnitude of crop

330
diversification had reduced to four districts in 1985-86. While the
categories of medium and low magnitude of crop diversification was
predominant. But in 2005-06, the category of moderate magnitude of
crop diversification became predominant followed by category of low crop
diversification, while category of high crop diversification has shrunk from
1965-66 to 2005-06. Thus overall trend of the magnitude of crop
diversification according to Bhatia's Technique is from high to low
magnitude which shows region's agriculture has become highly
specialized.
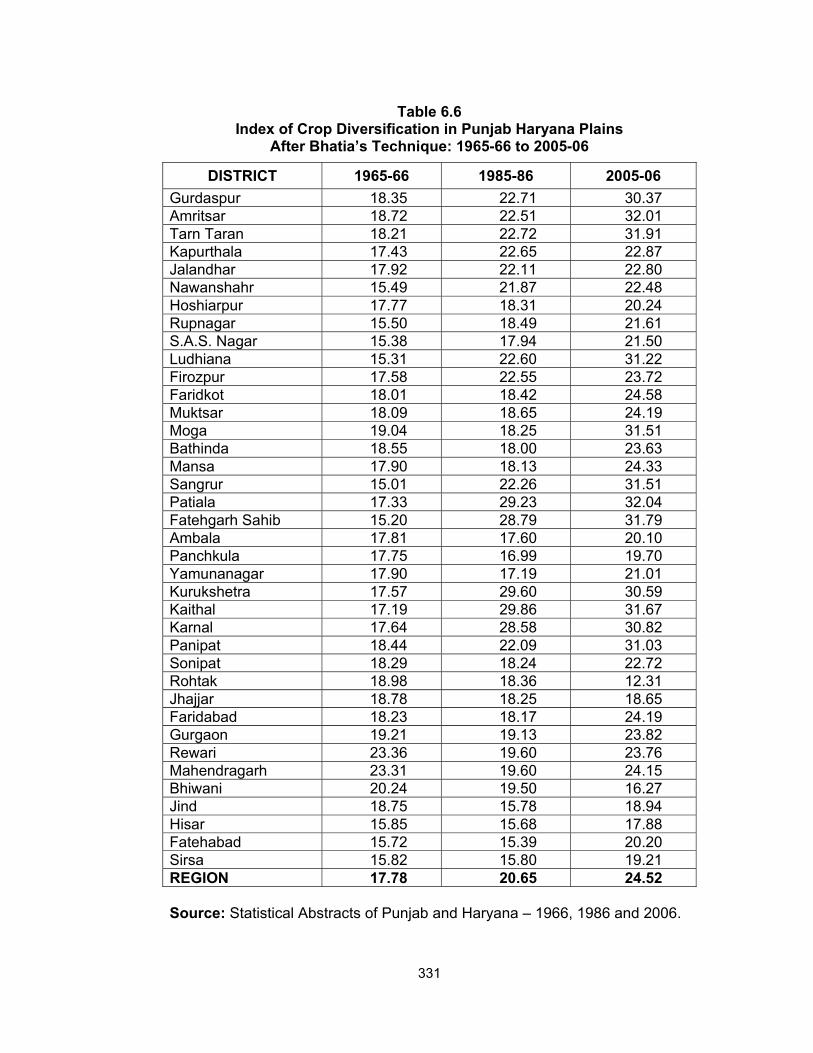
C. Changes in crop diversification after Singh's Technique
A detailed investigation of fig 6.3, 6.6 and 6.9 and table 6.6 reveals the
following points:
(i) For evaluating the trends in crop diversification in the study regions after
Singh's technique, help is taken from figures 6.3, 6.6 and 6.9 and table
6.3. According to Singh's technique in 1965-66, the region's average
index of crop diversification of 17.78 was recorded which had increased
to 20.65 in 1985-86, and it has further increased to 24.52 which indicates
that the magnitude of crop diversification was high in 1965-66, which
continuously was having declining trend up to 2005-06 and as a result
region's magnitude of crop diversification has become low which shows
trend towards specialization. It is also found that Punjab's average index
value of crop diversification in 1965-66 was recorded 17.90 and of
Haryana was 18.46 which indicates that Punjab’s agriculture was more
diversified than Haryana. But in 1985-86, index value for Punjab was
21.30 and of Haryana 19.92 which shows Punjab's agriculture became
331
Table 6.6
Index of Crop Diversification in Punjab Haryana Plains After Bhatia’s Technique: 1965-66 to 2005-06
DISTRICT 1965-66 1985-86 2005-06 Gurdaspur 18.35 22.71 30.37 Amritsar 18.72 22.51 32.01 Tarn Taran 18.21 22.72 31.91 Kapurthala 17.43 22.65 22.87 Jalandhar 17.92 22.11 22.80 Nawanshahr 15.49 21.87 22.48 Hoshiarpur 17.77 18.31 20.24 Rupnagar 15.50 18.49 21.61 S.A.S. Nagar 15.38 17.94 21.50 Ludhiana 15.31 22.60 31.22 Firozpur 17.58 22.55 23.72 Faridkot 18.01 18.42 24.58 Muktsar 18.09 18.65 24.19 Moga 19.04 18.25 31.51 Bathinda 18.55 18.00 23.63 Mansa 17.90 18.13 24.33 Sangrur 15.01 22.26 31.51 Patiala 17.33 29.23 32.04 Fatehgarh Sahib 15.20 28.79 31.79 Ambala 17.81 17.60 20.10 Panchkula 17.75 16.99 19.70 Yamunanagar 17.90 17.19 21.01 Kurukshetra 17.57 29.60 30.59 Kaithal 17.19 29.86 31.67 Karnal 17.64 28.58 30.82 Panipat 18.44 22.09 31.03 Sonipat 18.29 18.24 22.72 Rohtak 18.98 18.36 12.31 Jhajjar 18.78 18.25 18.65 Faridabad 18.23 18.17 24.19 Gurgaon 19.21 19.13 23.82 Rewari 23.36 19.60 23.76 Mahendragarh 23.31 19.60 24.15 Bhiwani 20.24 19.50 16.27 Jind 18.75 15.78 18.94 Hisar 15.85 15.68 17.88 Fatehabad 15.72 15.39 20.20 Sirsa 15.82 15.80 19.21 REGION 17.78 20.65 24.52 Source: Statistical Abstracts of Punjab and Haryana – 1966, 1986 and 2006.

332
more specialized than Haryana. Whereas in 2005-06, the index value of
crop diversification in case of Punjab is 26.22 and for Haryana it is 22.83
which again shows high magnitude of crop diversification in Haryana as
compare to Punjab.
(ii) The lowest index value of crop diversification was 15.21 in Sangrur
district and 23.36 of Rewari district in 1965-66. But in 1985-86, the
minimum index value of crop diversification was noted of 15.39 in
Fatehabad district and 29.86 in Kaithal district. While in 2005-06, the
lowest index value of crop diversification is recorded of 12.31 in Rohtak
district and highest of 32.04 in Patiala district. It shows that the trend is
from high to low magnitude of crop diversification.
(iii) A Review of fig. 6.3, 6.6 and 6.9 shows that in 1965-66, the category of
high degree of crop diversification had covered about 50 percent of the
total occurrences and it was a compact belt. But in 1985-86, most of the
area under high category had shifted to moderate as well as low degree
of crop diversification and only four districts were noted under high
category namely Hisar, Fatehabad, Sirsa and Jind. But in 2005-06 this
category of high crop diversification has expanded and covers seven
districts. One among them along the Shiwaliks and six in the
southwestern parts of the study region, namely Sirsa, Hisar, Jind,
Rohtak, Jhajjar and Bhiwani. Area under both these belts have less
developed agricultural infrastructural as compare to rest of the study
region.
(iv) In case of moderate magnitude of crop diversification, this category had
contained 14 districts and found in three separate belts in 1965-66. But in

333
1985-86, this category had 20 districts as compare to 14 in 1965-66,
whereas in 2005-06, the number of districts has declined to 19.
(v) The category of low magnitude of crop diversification had only three
districts namely Bhiwani, Rewari and Mahendragarh in 1965-66. But it
had expanded and contains 14 districts in 1985-86. Most of these
districts falling in low crop diversification were having either high or
moderate magnitude of crop diversification in 1965-66, but increase in
irrigation, facilities, development in infrastructure, agricultural innovation,
etc. were responsible for shifting districts from high as well as moderate
categories to low category. But in 2005-06, the category of low crop
diversification has 12 districts. Again all this shows that the cropping
pattern of the study Region has experienced a change from high
magnitude crop diversification to low magnitude crop diversification.
Conclusion
It is concluded that according to Gibbs & Martin's technique during
1965-66, the moderate and high magnitude of crop diversification was
predominant in the study region which covered 35 districts. Out of 35,
nineteen districts had experienced high magnitude of crop diversification.
Whereas after Bhatia’s technique, the high magnitude of crop diversification
was more predominant which had covered twenty five districts. While in
respect of Singh's technique the high crop diversification was again noted
predominant. But the low category of crop diversification had remained the
same which comprised only three southern districts namely Bhiwani, Rewari
and Mahendragarh. From figs. 6.1, 6.2 and 6.3, it is deduced that region's
agriculture was highly diversified because of poor agricultural infrastructure,

334
where farmers used to grow several these crops which physical environment
permitted them. But in those areas, where physical environment was very
harsh for crop farming and agricultural infrastructure was also under
developed had experienced low degree of crop diversification. It is also
observed that in 1985-86, with the introduction of Green revolution technology
and development of agricultural infrastructure, the category of high crop
diversification had shrunk. And as a result, it was confined to only four districts
namely Sirsa, Fatehabad, Hisar and Jind. It is also deduced that the
introduction of HYV of wheat and rice and mechanized agriculture had
affected the cropping pattern and magnitude of crop diversification very
significantly in Central parts and as a result in the Central parts the category
of low crop diversification had fourteen districts. Whereas the category of
moderate crop diversification had covered districts along the Shiwaliks where
wheat, maize, rice and fodder were predominant crops here rainfall was
comparatively highly. But in southern districts of the and study region, and
western districts of the study region where frequent occurrences of sand
dunes or remnants of Aravallis rock exist and rainfall is comparatively low had
experienced moderate magnitude of crop diversification.
It is found that the picture of crop diversification becomes more clear in
2005-06. The fourteen districts according to both Bhatia's and Gibbs &
Martian's technique and fifteen districts according to Singh's technique which
cover central parts of the study region have low magnitude of crop
diversification. The main reasons for low crop diversification are emergence of
wheat-rice crop rotation, increase in extent of irrigation, mechanized farming,
developed agricultural infrastructure, etc. The category of moderate crop
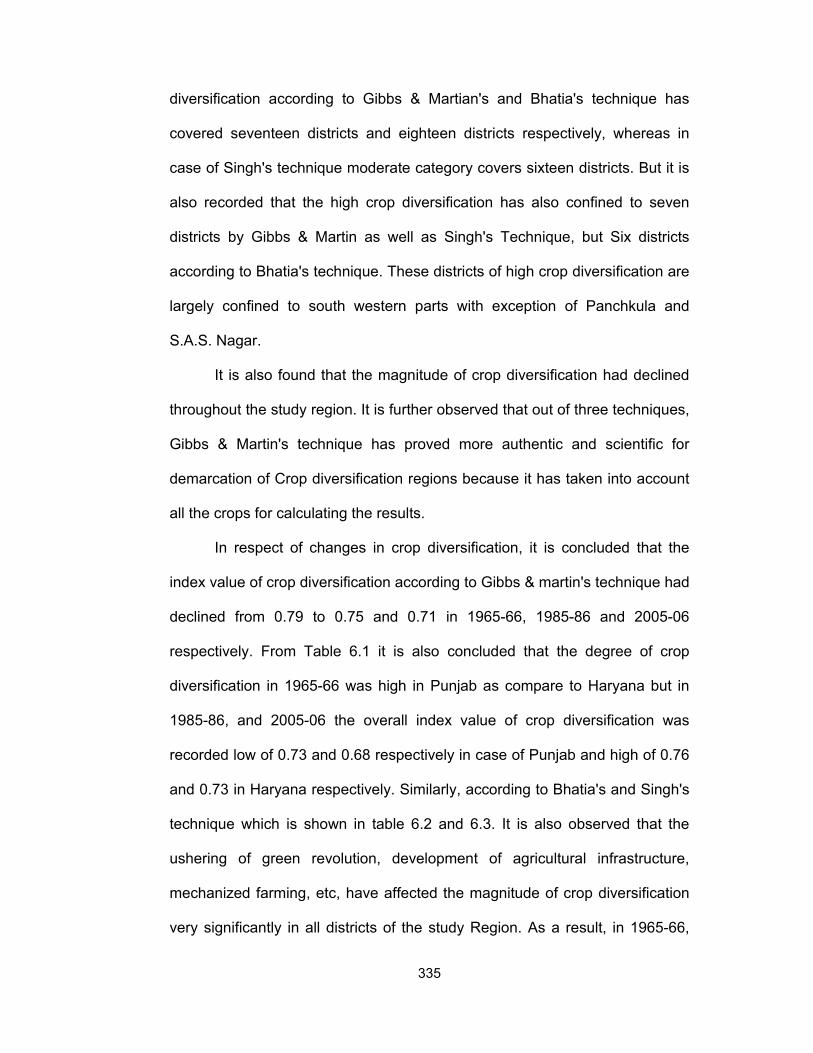
335
diversification according to Gibbs & Martian's and Bhatia's technique has
covered seventeen districts and eighteen districts respectively, whereas in
case of Singh's technique moderate category covers sixteen districts. But it is
also recorded that the high crop diversification has also confined to seven
districts by Gibbs & Martin as well as Singh's Technique, but Six districts
according to Bhatia's technique. These districts of high crop diversification are
largely confined to south western parts with exception of Panchkula and
S.A.S. Nagar.
It is also found that the magnitude of crop diversification had declined
throughout the study region. It is further observed that out of three techniques,
Gibbs & Martin's technique has proved more authentic and scientific for
demarcation of Crop diversification regions because it has taken into account
all the crops for calculating the results.
In respect of changes in crop diversification, it is concluded that the
index value of crop diversification according to Gibbs & martin's technique had
declined from 0.79 to 0.75 and 0.71 in 1965-66, 1985-86 and 2005-06
respectively. From Table 6.1 it is also concluded that the degree of crop
diversification in 1965-66 was high in Punjab as compare to Haryana but in
1985-86, and 2005-06 the overall index value of crop diversification was
recorded low of 0.73 and 0.68 respectively in case of Punjab and high of 0.76
and 0.73 in Haryana respectively. Similarly, according to Bhatia's and Singh's
technique which is shown in table 6.2 and 6.3. It is also observed that the
ushering of green revolution, development of agricultural infrastructure,
mechanized farming, etc, have affected the magnitude of crop diversification
very significantly in all districts of the study Region. As a result, in 1965-66,

336
the category of high magnitude of crop diversification had more areas as
compare to 1985-86 and 2005-06. In case of low magnitude of crop
diversification which was confined to three districts namely Bhiwani,
Mahendragarh and Rewari has expanded in its size in 1985-86 and 2005-06
and shifted its place from southern districts to central districts of the study
region and covers about 40 percent of the total occurrences. The moderate
category of crop diversification has remained significant throughout the study
region by snatching area from the category of high crop diversification of
1965-66.
Overall it is deduced that the study region's cropping pattern was highly
diversified in 1965-66, but later on in 1985-86 the magnitude of crop
diversification became low and it has further become low in 2005-06 which
shows that region's agriculture has become highly specialized from highly
diversified. It is also found that even the magnitude of crop diversification of
each district has also become low with some exceptions. It was all owing to
the development of agricultural infrastructure, favorable, government policies
awakening among the farmers, Introduction of HYV of seeds especially of
wheat and rice crop, etc. which has brought significant changes in the
magnitude of crop diversification in the study region during the period under
present investigation.