8 Critical Indicators of a Multi-tiered System of Student Support

6. CALCULATING INDICATORS OF SUPPORT TO PRODUCERS
Chapter 6.
CALCULATING INDICATORS OF SUPPORT TO PRODUCERS
260. Indicators of support to individual producers are the most widely used of all the indicators. The procedure for calculating producer support indicators is summarised in Diagram 6.1. The process begins by calculating Market Price Support (MPSi) for a number of individual commodities from which a national (aggregate) MPS value is extrapolated (section 6.1). This is then combined with the value of other transfers arising from policies that support individual producers to derive a value for the Producer Support Estimate (PSE) at the national level (section 6.2). From this value, the relative indicators, the %PSE and producer Nominal Assistance Coefficient (producer NAC) are derived (section 6.3).
261. As explained in Chapter 2, the PSE can be separated into four components representing different degrees of commodity specificity, i.e. transfer provided on the basis of single commodities e.g. wheat (Single Commodity Transfers, SCT), a group of commodities, e.g. cereals (Group Commodity Transfers, GCT), all commodities (All Commodity Transfers, ACT), or without obligation on the part of recipients to produce commodities (Other Transfers to Producers, OTP). Transfers to single commodities or groups of commodities are further distinguished at the individual commodity (Producer SCTi) or groups of commodities level (GCTK) (section 6.4). From these values, the relative indicators, the producer Nominal Protection Coefficient (producer NPCi) and %SCTi, can be derived for individual commodities and at the national level (sections 6.5 and 6.6).
Diagram 6.1. Procedure for calculating indicators of support to producers
PSE
ACT OTP
%PSE and Producer NAC
Producer NPCi
Producer SCTi
%SCTi
Producer NPC
Monetary indicators
Percentage indicators or ratios
MPSi
%SCT
GCTK
Producer SCT GCT
Commodity or group of
commodities level
National (aggregate)
level
MPS
THE PSE MANUAL © OECD 2016 − 99

6. CALCULATING INDICATORS OF SUPPORT TO PRODUCERS
6.1. Market Price Support (MPS)
Market Price Support (MPS): The annual monetary value of gross transfers from consumers and taxpayers to agricultural producers, arising from policy measures that create a gap between domestic market prices and border prices of a specific agricultural commodity, measured at the farm gate level.
• MPS values are calculated for a set of individual commodities, which are selected according to rules for the inclusion or exclusion of each commodity.
262. The conceptual basis for calculating MPS is described in sections 4.1 and 4.2. This section explains the procedure to calculate a national (aggregate) MPS based on MPS values for individual commodities.
6.1.1. MPS for individual commodities
263. The process begins by calculating MPS values for individual commodities constituting a representative sample. A standard set of individual commodities is first considered – wheat (WT), maize (MA), barley (BA), sorghum (SO), oats (OT), rye (RY), rice (RI), rapeseed (RS), soybean (SB), sunflower (SF), refined sugar (RS), milk (MK), beef and veal (BF), sheepmeat (SH), wool (WL), pigmeat (PK), poultry (PT) and eggs (EG). These are termed the “standard MPS commodities” (SMC) (see Table 6.1).
264. These commodities were chosen initially because they represented a significant proportion of agricultural production in a large number of OECD countries, and support policies were mainly targeted to them. A standard set of commodities allows comparisons between countries not only at the national (aggregate) level but also at the individual commodity level or for subsets of commodities.
265. The MPS values calculated for individual commodities are used to obtain the national (aggregate) MPS for a country using the extrapolation method (explained below). In order to reduce the associated estimation error, the individual commodities for which MPS is calculated should represent a significant share of the total value of agricultural production in a country. In general, efforts are made to ensure that the sum of the value of production of the individual commodities for which MPS is calculated represents at least 70% of the total value of agricultural production on average over the previous three years. If production of a standard MPS commodity is very small, i.e. less than 1% of total value of production, MPS is not calculated for this commodity. If the sum of the value of production for the standard MPS commodities with the individual shares above 1% is less than 70% of the total value of agricultural production in a country, additional commodities are added until this threshold is reached. The combined group of commodities for which MPS is calculated, both standard and additional, are termed “all MPS commodities” (AMC). 1 Note that this procedure for defining a representative set of commodities relates only to the MPS calculation. Other transfers (budgetary and revenue foregone) cover all agricultural commodities produced in the country.
1. The aggregate share of “All MPS commodities” is above or close to the 70% threshold in the majority of countries for which the OECD estimates support. However, this share is relatively low for Turkey (53% in 2013) and Korea (56% in 2013). In these countries the standard MPS commodities comprise a much smaller proportion of the total agricultural output than in other monitored countries, while the structure of the remaining production is substantially diversified. As a result, the inclusion of additional MPS commodities above those in the standard set has relatively limited marginal effect on the overall coverage share.
100 - THE PSE MANUAL © OECD 2016

6. CALCULATING INDICATORS OF SUPPORT TO PRODUCERS
Table 6.1. Individual commodities for which MPS is calculated in OECD and non-OECD countries All Commodities
WT1 MA RY BA SO OA RI RS RP SF SB MK BF SH WL PK PT EG AP AV BN BS CC CF CO CT CU CV FL FX FV GA GP GR LN MN OR PB PE PL PN PO PP PR RB SP SW TB TM WI WM WOCountryOECD countriesAustralia x x x x x x x x x x x x x x x x x xCanada x x x x x x x x x x x x x x x x xChile x x x x x x x x x x xEU27 x x x x x x x x x x x x x x x x x x x xIceland x x x x x x x xIsrael x x x x x x x x x x x x x x x x x x xJapan x x x x x x x x x x x x x x x x x x x xKorea x x x x x x x x x x x xMexico x x x x x x x x x x x x x x x xNew Zealand x x x x x x x x x x x xNorway x x x x x x x x x x xSwitzerland x x x x x x x x x x x x xTurkey x x x x x x x x x x x x x x x x xUnited States x x x x x x x x x x x x x x x x
Non-OECD countriesBrazil x x x x x x x x x x x xChina x x x x x x x x x x x x x x x xIndonesia x x x x x x x x x x x x x x x xKazakhstan x x x x x x x x x x x x xRussia x x x x x x x x x x x x x xSouth Africa x x x x x x x x x x x x x x xUkraine x x x x x x x x x x x x x x
All MPS Commodities (AMC) Non-MPS commodities Standard MPS Commodities (SMC) Additional MPS Commodities
XEOther Commodities (OC)
1. Wheat is considered a single commodity but may be a composite of durum wheat and common wheat, as in the case of the European Union. 2. For OECD and non-OECD countries - average share for 2008-10. AP – Apples CT – Cotton GR - Grapes PK – Pigmeat RP – Rapeseed TB – Tobacco AV – Avocados CU – Cucumbers LN – Lentils PL – Palm oil RS – Raw sugar TM – Tomatoes BA – Barley CV – Cassava MA – Maize PN – Peanuts RY – Rye WI – Wine BF – Beef and veal EG – Eggs MK – Milk PO – Potatoes SB – Soybeans WL – Wool BN – Dried beans FL – Plants and flowers MN – Mandarins PP – Red pepper SF – Sunflower WO – Welsh onion BS – Bananas FX – Flaxseed OA – Oats PR – Pears SH – Sheep meat WT – Wheat CC – Chinese cabbage FV – Other fruit and vegetables OR – Oranges PT – Poultry SO – Sorghum CF – Coffee GA – Garlic PB – Pepper RB – Rubber SP – Spinach CO – Cocoa beans GP – Grapefruit PE – Dry peas RI – Rice SW – Strawberries
THE PSE MANUAL © OECD 2016 − 101

6. CALCULATING INDICATORS OF SUPPORT TO PRODUCERS
266. Table 6.2 presents a country which produces only seven of the fifteen standard commodities – wheat, i.e. barley, oats, milk, beef and veal, poultry and eggs – so that MPS cannot be calculated for the other nine standard commodities. Further, the value of production for both poultry and eggs is below 1% of the total value of production, and so MPS is not calculated for these two commodities either.
Table 6.2. Selection of individual commodities for MPS estimation (example)
Individual Cumulative
Wheat 515 22 22
Maize 0 0 22
Barley 139 6 28
Oats 52 2 30
Rice 0 0 30
Rapeseed 0 0 30
Soybean 0 0 30
Sunflower 0 0 30
Sugar 0 0 30
Milk 400 17 47
Beef (including veal) 250 11 58
Sheepmeat 0 0 58
Wool 0 0 58
Pigmeat 0 0 58
Poultry 18 0.8 ..
Eggs 16 0.7 ..
Standard MPS commodities (SMC), sub-total 1 356 58 ..
(excluding poultry and eggs)
Cotton 180 8 66
Potatoes 160 7 73
Additional MPS commodities, sub-total 340 15 ..
All MPS commodities (AMC) 1 696 73 ..
Non-MPS commodities (XE) 629 27 100
Total value of agricultural production (VP) 2 325 100 ..
Value of production LC million
Shares in production (%)
LC: Local currency.
267. The five standard commodities for which MPS is calculated represent 58% of the total value of agricultural production. Additional commodities are thus needed to reach the 70% threshold. In this example, cotton and potatoes have important shares in the value of production. By adding these two commodities, the MPS is calculated for six commodities that together represent 73% of the total value of agricultural production. Table 6.1 shows the individual commodities for which MPS is calculated (both
102 − THE PSE MANUAL © OECD 2016

6. CALCULATING INDICATORS OF SUPPORT TO PRODUCERS
standard and additional MPS commodities) for OECD and several non-OECD countries, as well as the aggregate share of these commodities in the total value of agricultural production.
268. Having defined the list of commodities, the next step is to estimate the MPS for each commodity. The process involves the estimation of Market Price Differentials (MPDs), but first it is required to determine whether there are policies in place which create a price gap between domestic market and border prices of the commodity in question. If such policies are in place, an MPD is estimated based on the procedures explained in section 4.4. If there are no such policies in place for the commodity in question, the MPD for this commodity is set at zero. Note that commodities for which MPS is not calculated are different from those for which MPD is set at zero: the former are those with a share of production of less than 1%; the latter do not have policies affecting their market price.17 Once the MPDs have been estimated for selected commodities, the Excess Feed Cost (EFC) and then the Market Price Support (MPS) are calculated (as described in section 4.2).
269. Tables 6.3 and 6.4 illustrate the procedure for calculating MPS and EFC for individual commodities. When “data” is indicated as a source in the last column, the variable comes from an original data input. The data required for the calculations are summarised in Chapter 10. The MPD is set to zero in the case of oats and potatoes, as no policies are in place that change the market price received by producers of these commodities. The quantity of feed consumed by livestock producers includes only domestically produced feed (as explained in section 4.2).
Box 6.1. Description of a PSE country file
The OECD calculates the indicators of support for each country within individual PSE Excel file (with the EU27 treated as one country).1 There are four standard types of worksheets within each country file:
(1) A worksheet named “TOTAL” in which most of the national (aggregate) indicators are calculated, such as the PSE, GSSE, CSE and TSE, as well as the %PSE, producer NAC, %CSE and consumer NAC. This worksheet contains all policy transfers included in the estimation of support for a country, shown under the appropriate PSE, GSSE and CSE categories. Labels are also attached to each transfer, as defined in sub-section 3.3.3.
(2) A worksheet named “SCT GCT” in which the individual commodity producer SCT values are combined to calculate national (aggregate) producer SCT and %SCT indicators. This worksheet is also used to identify the Group Commodity Transfers (GCT), and calculate All Commodity Transfers (ACT) and Other Transfers to Producers (OTP) based on the labels given to each policy measure in the worksheet “TOTAL”.
(3) A group of standard worksheets named “XX SCT” in which the Producer Single Commodity Transfers (producer SCT) and %SCT indicators are calculated for each commodity, including a worksheet for “non-MPS commodities” named “XE SCT”.
(4) A group of standard worksheets named “XX MPS” in which MPS is calculated for each commodity, where XX is a two-letter commodity abbreviation, e.g. WT stands for wheat and MK for milk. This worksheet also contains the data and formulas for calculating the Consumer Single Commodity Transfers (consumer SCT) as well as the producer NPC and consumer NPC, for the commodities concerned.
The tables presented in Chapters 6, 7 and 8 are based on the structure of the country-specific PSE files described above, which are available in the indicator database (www.oecd.org/agriculture/pse) along with the country-specific documentation (Definitions and Sources), providing definitions of data series used and sources.
The country data are combined using a SAS programme to derive indicators at the total OECD level (see Chapter 9).
____________________
1. Separate PSE files are additionally available for EU27 aggregation.
17. MPD is also set to zero in some cases when it takes a negative value (Box 4.2).
THE PSE MANUAL © OECD 2016 − 103

6. CALCULATING INDICATORS OF SUPPORT TO PRODUCERS
Table 6.3. Calculation of MPS for individual commodities (example)
Symbol Description Units Wheat Barley Oats Milk Beef Cotton Potatoes Source / equation
QPi Level of production 000 T 250 110 50 200 100 360 160 Data
VPi Value of production (at farm gate) LC million 515 139 52 400 250 180 160 Data or (QPi * PPi)
QCi Level of consumption 000 T 200 160 200 300 75 400 120 Data or (QPi + QMi - QXi + STKi)
QMi Imports 000 T 50 40 155 100 0 55 0 Data
QXi Exports 000 T 80 0 0 0 25 0 60 Data
STKi Stock change 000 T -20 10 -5 0 0 -15 20 Data
PPi Producer price (at farm gate) LC/T 2,060 1,260 1,040 2,000 2,500 500 1,000 VPi / QPi or data
RPi Reference price LC/T 1,890 1,200 1,040 1,350 2,000 450 1,000 Data
MPDi Market Price Differential LC/T 170 60 0 650 500 50 0 PPi - RPi
TPCi Transfers to producers from consumers LC million 34 7 0 130 38 18 0 If QCi > QPi then MPDi *QPi, otherwise MPDi *QCi
TPTi Transfers to producers from taxpayers LC million 9 0 0 0 13 0 0 If QC > QP then 0, otherwise MPD *(QP - QC)
LVi Price levies LC million 20 0 0 0 10 0 0 Data
EFCLVi Excess Feed Cost LC million - - - 13 9 - - Table 6.4
MPSi Market Price Support LC million 23 7 0 117 31 18 0 TPCi + TPTi - LVi - EFCLVi
Table 6.4. Calculation of EFC for livestock commodities (example)
Symbol Description Units Wheat Barley Oats Total EFC for commodity Source / equation
QC i feed (milk) Quantity of feed crop i used for milk production 000 T 50 70 30 - Data
MPDi Market Price Differential for feed crop i LC/T 170 60 0 - Table 6.3
EFCi (milk) Excess Feed Cost for milk LC million 9 4 0 13 MPDi * QC feed i (milk)
QC i feed (beef) Quantity of feed crop i used for beef production 000 T 40 40 10 - Data
MPDi Market Price Differential for feed crop i LC/T 170 60 0 - Table 6.3
EFCi (beef) Excess Feed Cost for beef LC million 7 2 0 9 MPD i * QC feed i (beef)
104 − THE PSE MANUAL © OECD 2016

6. CALCULATING INDICATORS OF SUPPORT TO PRODUCERS
6.1.2. National (aggregate) MPS
270. Once MPS values have been calculated for individual commodities, a national (aggregate) MPS can be derived. This procedure is called “MPS extrapolation” and is based on the assumption that the ratio between the national (aggregate) MPS and the total value of production is equal to the ratio between MPS and the value of production for the commodities for which MPS has been calculated. This is expressed as:
∑∑
∈
∈=
AMCii
AMCii
C
C
VP
MPS
VPMPS
[6.1]
Where CMPS – national (aggregate) MPS for country C
CVP – value of agricultural production in country C
∑∈AMCi
iMPS – MPS for all commodities for which MPS has been calculated (AMC)
∑∈AMCi
iVP – value of production for all commodities for which MPS has been calculated
271. Therefore the formula for estimating the national (aggregate) MPS for a country is:
C
AMCii
AMCii
C VPVP
MPSMPS ×=
∑∑
∈
∈ [6.2]
272. This procedure is shown for the example country in Table 6.5. The values of MPS for each individual commodity are added together, including those for which it is zero (giving 195 million in local currency units). The result is divided by the value of production for these commodities, including those for which MPS is zero, and multiplied by the total value of production. The extrapolation yields a national (aggregate) MPS of 268 million in local currency units.
Table 6.5. Calculation of national (aggregate) MPS (example) Symbol Description LC million Source / equationVPC Total value of production (at farm gate) 2 325 Table 6.2
VPAMC Value of production of all MPS commodities 1 696 Sum of VPi of all MPS commodities
MPSWT Wheat MPS 23 Table 6.3
MPSBA Barley MPS 7 Table 6.3
MPSOT Oats MPS 0 Table 6.3
MPSMK Milk MPS 117 Table 6.3
MPSBF Beef MPS 31 Table 6.3
MPSSMC Standard MPS commodities, sub-total 177 Sum of MPSi of standard MPS commodities
MPSCT Cotton MPS 18 Table 6.3
MPSPO Potato MPS 0 Table 6.3
MPSAMC All MPS commodities, sub-total 195 Sum of MPSi of All MPS commodities
MPSC Market Price Support 268 MPSAMC / VPAMC * VPc
THE PSE MANUAL © OECD 2016 − 105

6. CALCULATING INDICATORS OF SUPPORT TO PRODUCERS
273. The extrapolation procedure involves measurement bias, because it implies that for commodities for which MPS is not explicitly calculated the ratio of their aggregate MPS to their aggregate value of production is the same as for the commodities for which MPS is calculated. If the latter commodities are supported to a higher degree than the non-MPS commodities this would result in an over-estimation of the aggregate (national) MPS, while if the MPS commodities are supported to a lesser degree that the non-MPS commodities, the opposite would be true. As noted earlier, in order to reduce the error involved in the extrapolation procedure, it is important to ensure that the MPS commodities make up a sufficient share of the total country’s agricultural production.
6.1.3. MPS for “other commodities”
274. For individual countries, the OECD presents the estimated MPS values for each of the MPS commodities and the residual – an aggregate MPS value for non-MPS commodities – is shown as “MPS for other commodities” (MPSXE). It is found by subtracting the value of MPS for all MPS commodities from the national (aggregate) MPS:
∑∈
−=AMCi
iCXE MPSMPSMPS [6.3]
where: XEMPS – total value of MPS for non-MPS commodities
CMPS – national (aggregate) MPS for country C
∑∈AMCi
iMPS – sum of MPS for all MPS commodities
275. To standardise the presentation of support indicators for the OECD total, the estimated MPS values are presented for the standard commodities only and the residual “MPS for other commodities” (MPSOC) is found by subtracting the value of MPS for the standard commodities from the national (aggregate) MPS:
∑∈
−=SMCi
iCOC MPSMPSMPS [6.4]
where: OCMPS – total value of MPS for commodities other than standard MPS commodities
CMPS – national (aggregate) MPS for country C
∑∈SMCi
iMPS – sum of MPS for the standard MPS commodities (SMC)
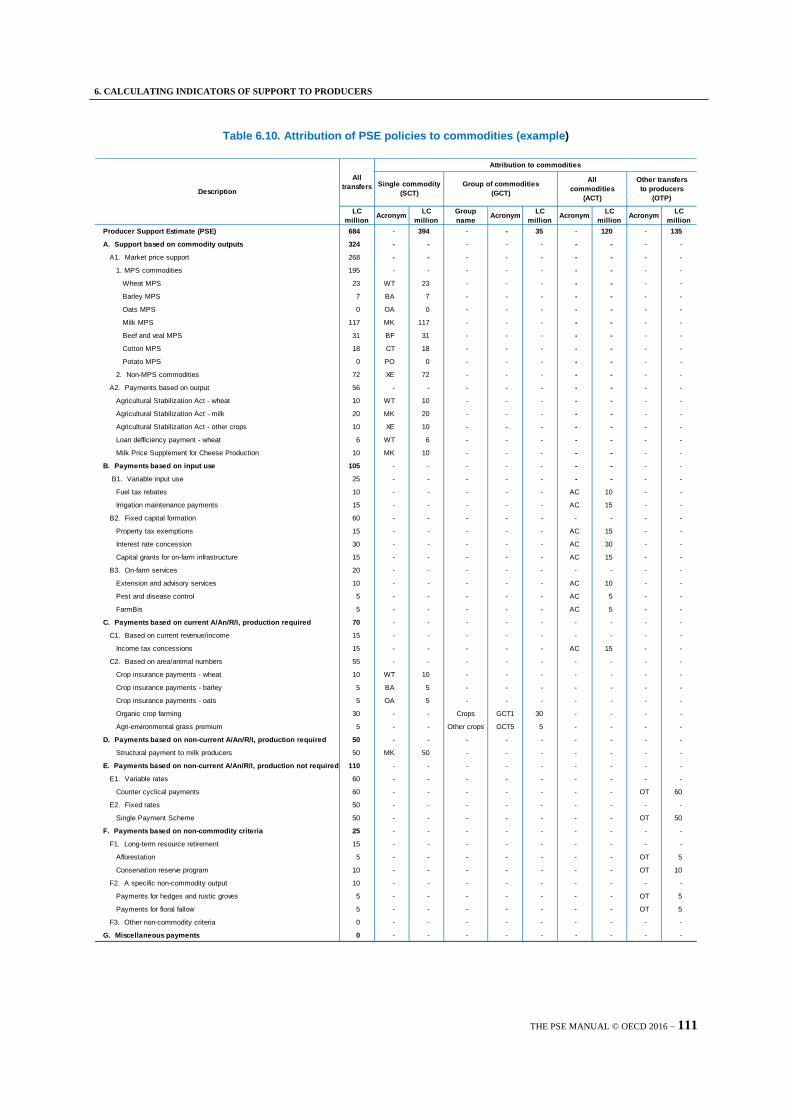
276. These two calculations are shown in Table 6.6.
106 − THE PSE MANUAL © OECD 2016
6. CALCULATING INDICATORS OF SUPPORT TO PRODUCERS
Table 6.6. Calculation of MPS for Other Commodities (example)
Symbol Description LC million Source / equation
MPSC Market Price Support, national aggregate 268 Table 6.5
MPSSMC MPS for Standard MPS commodities 177 Table 6.5
MPSOC MPS for Other commodities 90 MPSC - MPSSMC
MPSAMC MPS for All MPS commodities 195 Table 6.5MPSXE MPS for Non-MPS commodities 72 MPSC - MPSAMC
6.2. Producer Support Estimate (PSE)
Producer Support Estimate (PSE): The annual monetary value of gross transfers from consumers and taxpayers to agricultural producers, measured at the farm gate level, arising from policies that support agriculture, regardless of their nature, objectives or impacts on farm production or income.
• PSE values are calculated by adding to the MPS the value of transfers to producers from other policies.
277. To calculate the PSE for a country, the value of transfers to producers from other agricultural policies is added to the country (aggregate) MPS obtained in Section 6.1:
∑ ∑=+= CategorysubPSEBOTMPSPSE CC )( [6.5]
where: CPSE – PSE for country C
CMPS – national (aggregate) MPS for country C
BOT
– aggregate budgetary and other transfers to producers from policies for country C
∑ CategorysubPSE )( – sum of PSE (sub)categories to which policies are classified from A to G.
278. To ensure transparency and to assist with the calculation of other indicators, the name of each policy measure and the resulting value of transfer are listed under the PSE categories and sub-categories to which they have been classified according to the process set out in section 3.3 (Table 6.7). A selection of the policy measures discussed in sub-section 3.3.4 as worked examples are used here to illustrate. A broad policy measure is listed more than once when transfers relate to different commodities or when groups of commodities can be identified, e.g. Agricultural Stabilization Act and crop insurance payments.
THE PSE MANUAL © OECD 2016 − 107

6. CALCULATING INDICATORS OF SUPPORT TO PRODUCERS
Table 6.7. Calculation of PSE (example)
Description LC million Source / equationProducer Support Estimate (PSE) 684 A.1 + (A.2 + B + C + D + E + F + G)A. Support based on commodity outputs 324 A.1 + A.2
A1. Market Price Support (MPS) 268 Table 6.5A2. Payments based on output 56 Sum of payments in A.2
Agricultural Stabilization Act - Wheat 10 DataAgricultural Stabilization Act - Milk 20 DataAgricultural Stabilization Act - Other crops 10 DataLoan deficiency payments 6 DataMilk Price Supplement for Cheese Production 10 Data
B. Payments based on input use 105 B.1 + B.2 + B.3 B1. Variable input use 25 Sum of payments in B.1
Fuel tax rebates 10 DataIrrigation maintenance payments 15 Data
B2. Fixed capital formation 60 Sum of payments in B.2Property tax exemptions 15 DataInterest rate concession 30 DataCapital grants for on-farm infrastructure 15 Data
B3. On-farm services 20 Sum of payments in B.3Extension and advisory services 10 DataPest and disease control 5 DataFarmBis 5 Data
C. Payments based on current A/An/R/I, 70 Sum of payments in C production required
C1. Based on current revenue/income 15 Sum of payments in C.1Income tax concessions 15 Data
C2. Based on current area/animal numbers 55 Sum of payments in C.2Crop insurance payments - Wheat 10 DataCrop insurance payments - Barley 5 DataCrop insurance payments - Oats 5 DataOrganic crop farming 30 DataAgri-environmental grass premium 5 Data
D. Payments based on non-current A/An/R/I, 50 Sum of payments in D production required
Structural payment to milk producers 50 DataE. Payments based on non-current A/An/R/I, 110 E.1 + E.2 production not required
E1. Variable rates 60 Sum of payments in E.1Counter Cyclical Payments 60 Data
E2. Fixed rates 50 Sum of payments in E.2Single Payment Scheme 50 Data
F. Payments based on non-commodity criteria 25 F.1 + F.2 + F.3F1. long-term resource retirement 15 Sum of payments in F.1
Afforestation 5 DataConservation Reserve Program 10 Data
F2. a specific non-commodity output 10 Sum of payments in F.2Payments for Hedges and Rustic Groves 5 DataPayments for Floral Fallow 5 Data
F3. other non-commodity criteria 0 Sum of payments in F.3G. Miscellaneous payments 0 Sum of payments in G
108 − THE PSE MANUAL © OECD 2016

6. CALCULATING INDICATORS OF SUPPORT TO PRODUCERS
6.3. Percentage PSE (%PSE) and Producer Nominal Assistance Coefficient (producer NAC)
Percentage PSE (%PSE): PSE as a share of gross farm receipts.
Producer Nominal Assistance Coefficient (producer NAC): The ratio between the value of gross farm receipts (including support) and gross farm receipts valued at border prices (measured at farm gate).
279. The %PSE is calculated by dividing the PSE by the value of gross farm receipts (GFR), and multiplying the result by 100:
100100% ×+
=×=CC
C
C
CC BOTVP
PSEGFRPSE
PSE [6.6]
280. GFR represents the value of production (VP), to which are added Budgetary and Other Transfers (BOT). Working through this formula in the example results in a %PSE of 25% (Table 6.8).
Table 6.8. Calculation of PSE and Producer NAC (example)
Symbol Description Units Value Source / equationVPC Total value of production (at farm gate) LC million 2 325 Table 6.5
PSEC Producer Support Estimate LC million 684 Table 6.7
MPSC Market Price Support LC million 268 Table 6.7
BOTC Budgetary and Other Transfers to Producers LC million 416 Table 6.7 (A2+B+C+D+E+F+G)
GFRC Gross Farm Receipts LC million 2 741 VPC + BOTC
%PSEC Percentage Producer Support Estimate % 25 100* PSEC / GFRC
Producer NACC Producer Nominal Assistance Coefficient Ratio 1.33 GFRC / (VPC - MPSC) or
1 + %PSEC / (100 - %PSEC)
281. The producer NAC is calculated by dividing the value of gross farm receipts by the value of production at border prices. Expressed algebraically:
CC
CC MPSVP
GFRCproducerNA−
= [6.7]
282. The value of production at border prices is obtained by subtracting the value of MPS from the total value of production, e.g. LC 2 325 million in the example. The producer NAC is mathematically related to the %PSE, and can be alternatively derived as:
( )C
CC PSE
PSECproducerNA%100
%1−
+= [6.8]
283. Working through this formula in the example results in a producer NAC of 1.33.
THE PSE MANUAL © OECD 2016 − 109

6. CALCULATING INDICATORS OF SUPPORT TO PRODUCERS
6.4. Indicators of producer support based on the degree of commodity specificity
• The PSE can expressed as the sum of four mutually exclusive category indicators of support transfers, relating respectively to a single commodity (SCT), a group of commodities (GCT), all commodities (ACT), and whether commodity production is not required (OTP).
284. The PSE can be broken down into four separate indicators of support based on the degree to which policy measures deliver support on a commodity basis: i.e. support provided to a single commodity, a group of commodities, all commodities, or whether producers are not required to produce commodities to receive support (Table 6.9).
Table 6.9. Indicators of producer support based on the degree of commodity specificity
Indicator Relationship with PSE categories
I. Producer Single Commodity Transfers (producer SCT)
Sum of all single commodity transfers in PSE categories A, B, C and D
— Commodity i (1 to n) (producer SCTi)1 - Includes only specific policy measures for commodity i
II. Group Commodity Transfers (GCT)
— Group k (1 to m) (GCTk)
Sum of transfers to groups of commodities in PSE categories B, C, and D - Includes only specific policy measures for group k
III. All Commodity Transfers (ACT) Sum of transfers to all commodities in PSE categories B, C, and D
IV. Other Transfers to Producers (OTP) Sum of transfers in PSE categories E, F and G
Total PSE (I+II+III+IV) Sum of transfers to single, group and all commodities and other transfers (producer SCT+GCT+ACT+OTP)
1. For policy measures applying to groups of commodities, the PSE/CSE database for each country contains complete information on the list of commodities included in groups (see also Annex 6.1).
285. These four categories are mutually exclusive in the sense that payments included in one category are not included in others, e.g. transfers to wheat in the producer SCT are not included in transfers to cereals as a group in the GCT category. In this way, there are no overlaps between the categories, and they therefore add up to the total PSE.
286. The first step in calculating these indicators is to attribute each policy measure to one of these four categories, and then within the producer SCT and GCT categories to specific commodities or groups of commodities respectively. This is part of the process of labelling policy measures as detailed in sub-section 3.3.3. The following four sub-sections explain further details about these indicators.
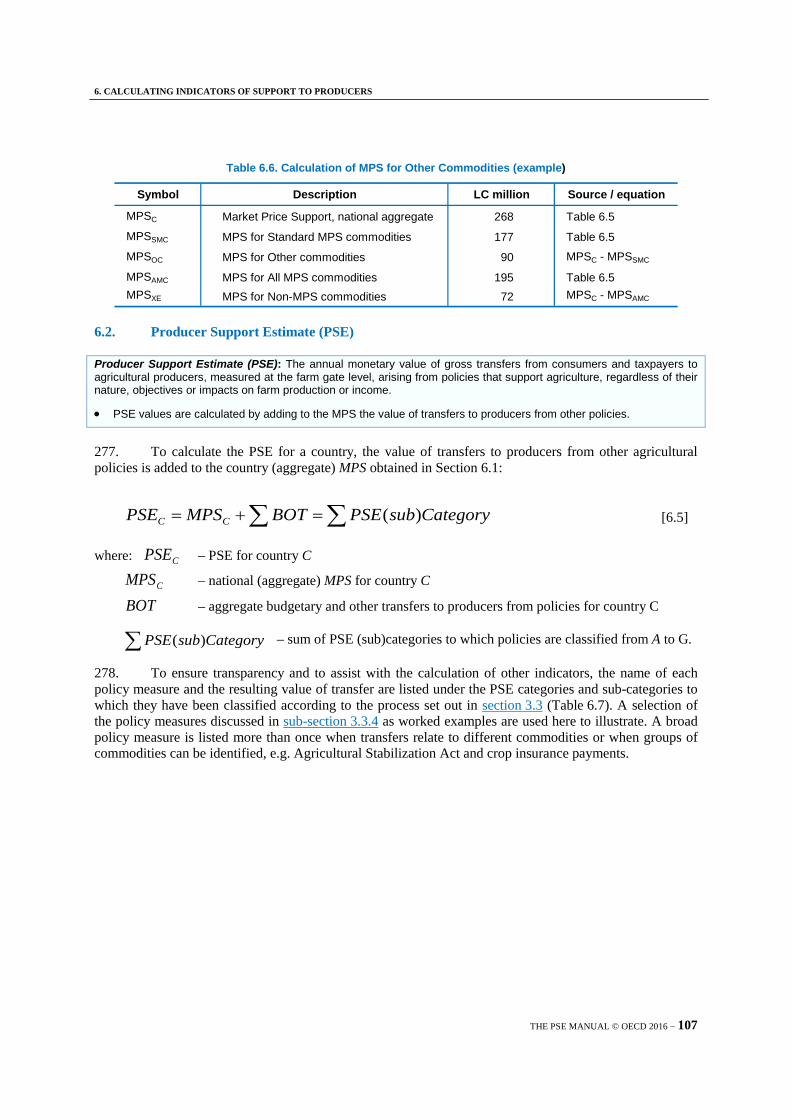
287. Table 6.10 shows how this attribution is made for policy measures in the example. The two letter symbol in the column titled “Single commodity” indicates the commodity to which support is provided. These are policies whereby receipt of the transfer requires the production of that designated commodity. MPS is by definition included in the producer SCT, as it captures the transfers associated with policies affecting the price of a particular commodity. The label “AC” is given to policy measures which place no restrictions on the commodity produced but require the recipient to produce some commodity of their choice. Policy measures in the last three PSE categories (E, F and G) are labelled “OTP” because by definition these provide transfers that either do not require commodity production or their commodity specificity is unknown.
110 − THE PSE MANUAL © OECD 2016
6. CALCULATING INDICATORS OF SUPPORT TO PRODUCERS
Table 6.10. Attribution of PSE policies to commodities (example)
LC million Acronym LC
millionGroup name Acronym LC
million Acronym LC million Acronym LC
millionProducer Support Estimate (PSE) 684 - 394 - - 35 - 120 - 135
A. Support based on commodity outputs 324 - - - - - - - - -
A1. Market price support 268 - - - - - - - - -
1. MPS commodities 195 - - - - - - - - -
Wheat MPS 23 WT 23 - - - - - - -
Barley MPS 7 BA 7 - - - - - - -
Oats MPS 0 OA 0 - - - - - - -
Milk MPS 117 MK 117 - - - - - - -
Beef and veal MPS 31 BF 31 - - - - - - -
Cotton MPS 18 CT 18 - - - - - - -
Potato MPS 0 PO 0 - - - - - - -
2. Non-MPS commodities 72 XE 72 - - - - - - -
A2. Payments based on output 56 - - - - - - - - -
Agricultural Stabilization Act - wheat 10 WT 10 - - - - - - -
Agricultural Stabilization Act - milk 20 MK 20 - - - - - - -
Agricultural Stabilization Act - other crops 10 XE 10 - - - - - - -
Loan defficiency payment - wheat 6 WT 6 - - - - - - -
Milk Price Supplement for Cheese Production 10 MK 10 - - - - - - -
B. Payments based on input use 105 - - - - - - - - -
B1. Variable input use 25 - - - - - - - - -
Fuel tax rebates 10 - - - - - AC 10 - -
Irrigation maintenance payments 15 - - - - - AC 15 - -
B2. Fixed capital formation 60 - - - - - - - - -
Property tax exemptions 15 - - - - - AC 15 - -
Interest rate concession 30 - - - - - AC 30 - -
Capital grants for on-farm infrastructure 15 - - - - - AC 15 - -
B3. On-farm services 20 - - - - - - - - -
Extension and advisory services 10 - - - - - AC 10 - -
Pest and disease control 5 - - - - - AC 5 - -
FarmBis 5 - - - - - AC 5 - -
C. Payments based on current A/An/R/I, production required 70 - - - - - - - - -
C1. Based on current revenue/income 15 - - - - - - - - -
Income tax concessions 15 - - - - - AC 15 - -
C2. Based on area/animal numbers 55 - - - - - - - - -
Crop insurance payments - wheat 10 WT 10 - - - - - - -
Crop insurance payments - barley 5 BA 5 - - - - - - -
Crop insurance payments - oats 5 OA 5 - - - - - - -
Organic crop farming 30 - - Crops GCT1 30 - - - -
Agri-environmental grass premium 5 - - Other crops GCT5 5 - - - -
D. Payments based on non-current A/An/R/I, production required 50 - - - - - - - - -
Structural payment to milk producers 50 MK 50 - - - - - - -
E. Payments based on non-current A/An/R/I, production not required 110 - - - - - - - - -
E1. Variable rates 60 - - - - - - - - -
Counter cyclical payments 60 - - - - - - - OT 60
E2. Fixed rates 50 - - - - - - - - -
Single Payment Scheme 50 - - - - - - - OT 50
F. Payments based on non-commodity criteria 25 - - - - - - - - -
F1. Long-term resource retirement 15 - - - - - - - - -
Afforestation 5 - - - - - - - OT 5
Conservation reserve program 10 - - - - - - - OT 10
F2. A specific non-commodity output 10 - - - - - - - - -
Payments for hedges and rustic groves 5 - - - - - - - OT 5
Payments for floral fallow 5 - - - - - - - OT 5
F3. Other non-commodity criteria 0 - - - - - - - - -
G. Miscellaneous payments 0 - - - - - - - - -
DescriptionAll
commodities(ACT)
Other transfers to producers
(OTP)
Attribution to commodities
Group of commodities(GCT)
Single commodity(SCT)
All transfers
THE PSE MANUAL © OECD 2016 − 111
6. CALCULATING INDICATORS OF SUPPORT TO PRODUCERS
6.4.1. Producer Single Commodity Transfers (producer SCT)
Producer Single Commodity Transfers (producer SCT): the annual monetary value of gross transfers from consumers and taxpayers to agricultural producers, measured at the farm gate level, arising from policies linked to the production of a single commodity such that the producer must produce the designated commodity in order to receive the transfer.
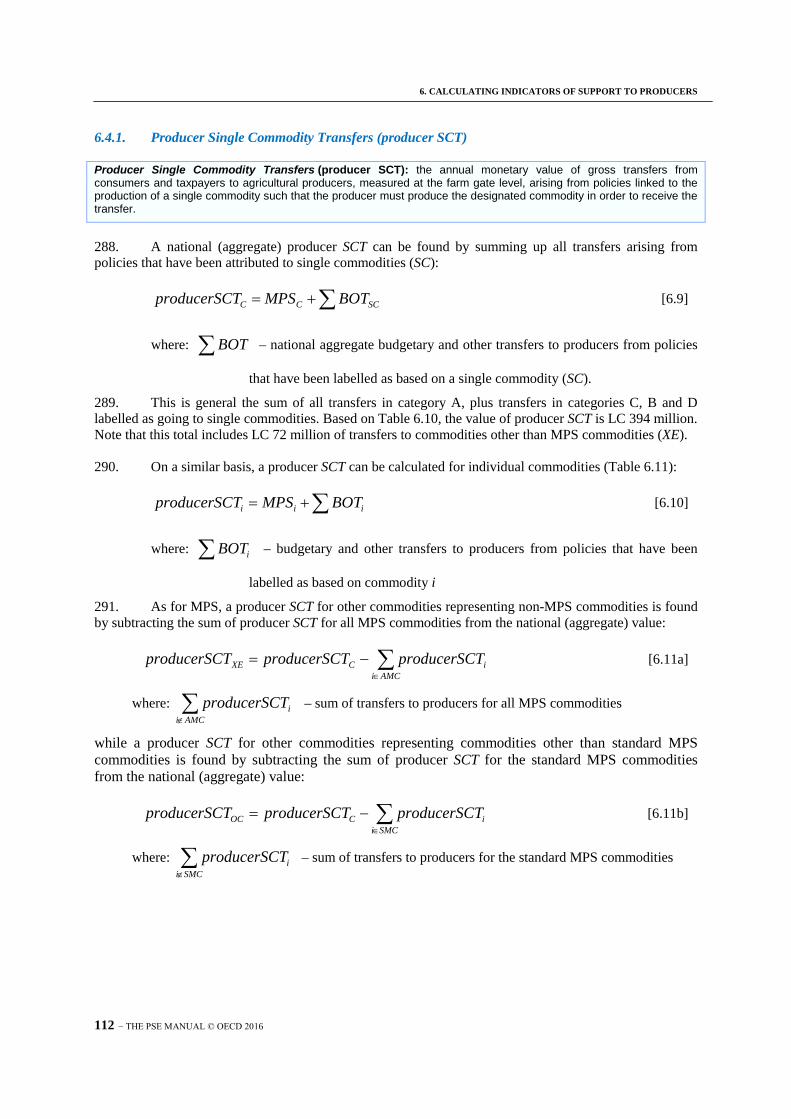
288. A national (aggregate) producer SCT can be found by summing up all transfers arising from policies that have been attributed to single commodities (SC):
∑+= SCCC BOTMPSTproducerSC [6.9]
where: ∑BOT – national aggregate budgetary and other transfers to producers from policies
that have been labelled as based on a single commodity (SC).
289. This is general the sum of all transfers in category A, plus transfers in categories C, B and D labelled as going to single commodities. Based on Table 6.10, the value of producer SCT is LC 394 million. Note that this total includes LC 72 million of transfers to commodities other than MPS commodities (XE).
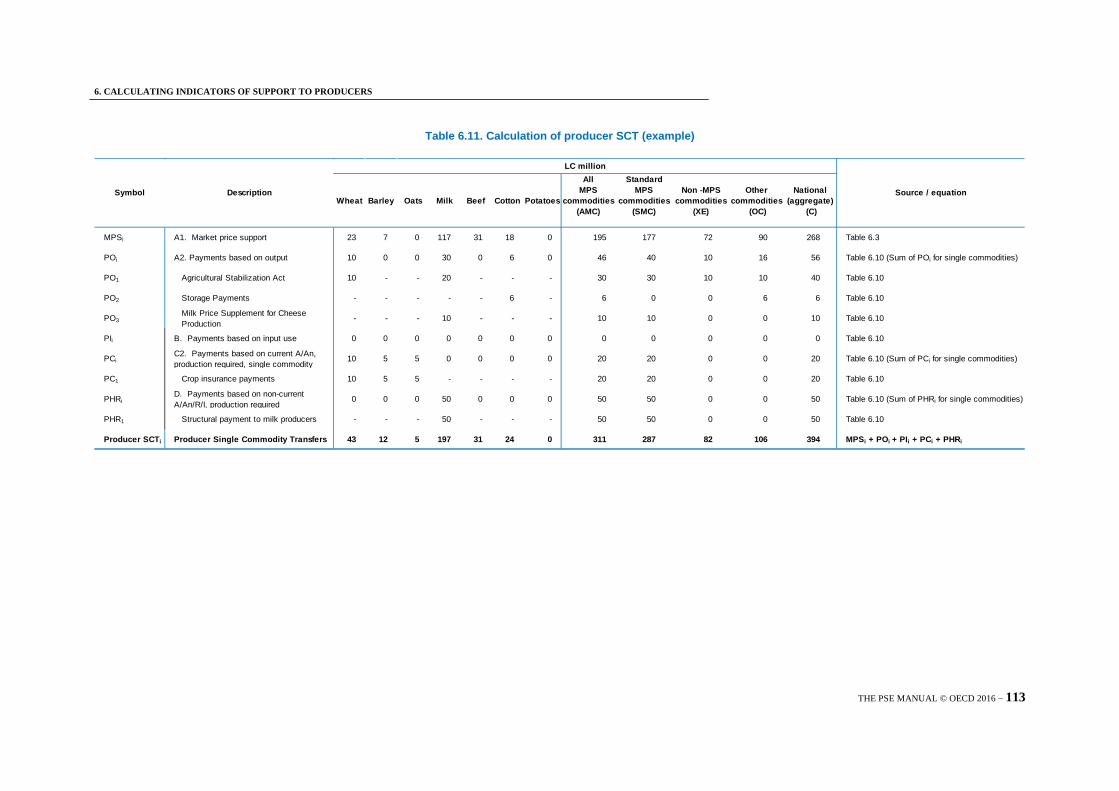
290. On a similar basis, a producer SCT can be calculated for individual commodities (Table 6.11):
∑+= iii BOTMPSTproducerSC [6.10]
where: ∑ iBOT – budgetary and other transfers to producers from policies that have been
labelled as based on commodity i
291. As for MPS, a producer SCT for other commodities representing non-MPS commodities is found by subtracting the sum of producer SCT for all MPS commodities from the national (aggregate) value:
∑∈
−=AMCi
iCXE TproducerSCTproducerSCTproducerSC [6.11a]
where: ∑∉AMCi
iTproducerSC – sum of transfers to producers for all MPS commodities
while a producer SCT for other commodities representing commodities other than standard MPS commodities is found by subtracting the sum of producer SCT for the standard MPS commodities from the national (aggregate) value:
∑∈
−=SMCi
iCOC TproducerSCTproducerSCTproducerSC [6.11b]
where: ∑∉SMCi
iTproducerSC – sum of transfers to producers for the standard MPS commodities
112 − THE PSE MANUAL © OECD 2016
6. CALCULATING INDICATORS OF SUPPORT TO PRODUCERS
Table 6.11. Calculation of producer SCT (example)
Wheat Barley Oats Milk Beef Cotton Potatoes
All MPS
commodities (AMC)
Standard MPS
commodities (SMC)
Non -MPScommodities
(XE)
Other commodities
(OC)
National (aggregate)
(C)
MPSi A1. Market price support 23 7 0 117 31 18 0 195 177 72 90 268 Table 6.3
POi A2. Payments based on output 10 0 0 30 0 6 0 46 40 10 16 56 Table 6.10 (Sum of POi for single commodities)
PO1 Agricultural Stabilization Act 10 - - 20 - - - 30 30 10 10 40 Table 6.10
PO2 Storage Payments - - - - - 6 - 6 0 0 6 6 Table 6.10
PO3Milk Price Supplement for Cheese Production
- - - 10 - - - 10 10 0 0 10 Table 6.10
PIi B. Payments based on input use 0 0 0 0 0 0 0 0 0 0 0 0 Table 6.10
PCiC2. Payments based on current A/An, production required, single commodity
10 5 5 0 0 0 0 20 20 0 0 20 Table 6.10 (Sum of PCi for single commodities)
PC1 Crop insurance payments 10 5 5 - - - - 20 20 0 0 20 Table 6.10
PHRiD. Payments based on non-current A/An/R/I, production required
0 0 0 50 0 0 0 50 50 0 0 50 Table 6.10 (Sum of PHRi for single commodities)
PHR1 Structural payment to milk producers - - - 50 - - - 50 50 0 0 50 Table 6.10
Producer SCTi Producer Single Commodity Transfers 43 12 5 197 31 24 0 311 287 82 106 394 MPSi + POi + PIi + PCi + PHRi
LC million
Symbol Description Source / equation
THE PSE MANUAL © OECD 2016 − 113

6. CALCULATING INDICATORS OF SUPPORT TO PRODUCERS
6.4.2. Group Commodity Transfers (GCT)
Group Commodity Transfers (GCT): the annual monetary value of gross transfers from consumers and taxpayers to agricultural producers, measured at the farm gate level, arising from policies whose payments are made on the basis that one or more of a designated list of commodities is produced, i.e. a producer may produce from a set of allowable commodities and receive a transfer that does not vary with respect to this decision.
292. The value of Group Commodity Transfers for a country is calculated by adding together the value of transfers that have been attributed to groups of commodities:
∑= GCTC BOTGCT [6.12]
where: ∑ GCTBOT – aggregate budgetary and other transfers to producers from policies that
have been labelled as based on a group of commodities (GCT)
293. Based on Table 6.10, this comes to LC 35 million.
294. On a similar basis, a GCTk can be calculated for specific groups of commodities, where:
∑= kk BOTGCT [6.13]
where: ∑ kBOT – budgetary and other transfers to producers from policies that have been
labelled as based on a commodity group k.
295. There are nine standard commodity groups (Table 6.12). If the policy measure is targeting a group of commodities not covered by any of these nine groups, an additional group may be created to reflect actual support policies. Detailed country lists of commodity groups included in the GCT are provided in Annex 6.1. Transfers allocated to the different groups within the GCT are mutually exclusive, e.g. transfers to the grains group are not included in transfers to a grains and oilseeds group.
Table 6.12. Calculation of GCT (example)
Symbol Group Commodity Transfers (GCT) LC millionShare of national
(aggregate) GCT %
GCT1 All crops 30 86
GCT2 All arable crops 0 0
GCT3 Grains 0 0
GCT4 Oilseeds 0 0
GCT5 Other crops 5 14
GCT6 All fruits and vegetables 0 0
GCT7 All livestock 0 0
GCT8 Ruminants 0 0
GCT9 Non-ruminants 0 0
GCT10 Non-standard commodity group n 0 0
GCT11 Non-standard commodity group m 0 0
GCTC National (aggregate) GCT 35 100
114 − THE PSE MANUAL © OECD 2016

6. CALCULATING INDICATORS OF SUPPORT TO PRODUCERS
296. Table 6.12 illustrates the allocation of transfers to the different groups based on the attribution done in Table 6.10. In this case, all the policy measures are targeted to the standard groups, so that no additional groups are required.
6.4.3. All Commodity Transfers (ACT)
All Commodity Transfers (ACT): the annual monetary value of gross transfers from consumers and taxpayers to agricultural producers, measured at the farm gate level, arising from policies that place no restrictions on the commodity produced but require the recipient to produce some commodity of their choice.
297. The value of All Commodity Transfers for a country is calculated by adding together the value of transfers that have been attributed to all commodities (AC):
∑= ACC BOTACT [6.14]
where: ∑ ACBOT – aggregate budgetary and other transfers to producers from policies that
have been labelled as based on all commodities (AC)
298. Table 6.10 shows that there were nine policies attributed to ACT. Summing up the value of transfers from these seven policies gives an ACT estimate of LC 120.
6.4.4. Other Transfers to Producers (OTP)
Other Transfers to Producers (OTP): The annual monetary value of gross transfers from consumers and taxpayers to agricultural producers, measured at the farm gate level, arising from policies that do not require any commodity production at all.
299. Other transfers to producers are calculated by summing together the total values of transfers from policies that are classified into the PSE categories E, F and G.
)()()( GyPSEcategorFyPSEcategorEyPSEcategorOTPC ++= [6.15]
300. In the example, there are six such policies, providing LC 135 million in support to producers.
6.5. Producer Nominal Protection Coefficient (producer NPC)
Producer Nominal Protection Coefficient (producer NPC): The ratio between the average price received by producers at the farm gate (including payments per tonne of current output and excluding price levies per tonne of current output), and the border price, measured at the farm gate.
• Producer NPC values may be calculated at the individual commodity and national (aggregate) levels.
6.5.1. Producer NPC for individual commodities
301. The producer NPC for an individual commodity can be derived in two ways. First, domestic and border prices can be compared, where the domestic price is the producer price plus the per unit transfers received from payments based on output minus the price levies based on output:
THE PSE MANUAL © OECD 2016 − 115
6. CALCULATING INDICATORS OF SUPPORT TO PRODUCERS
i
i
i
i
ii
i RPQP
LVOQPPO
PPCproducerNP
−+
= [6.16]
where: iPP – producer price of commodity i
iPO – sum of payments to commodity i based on output (PSE sub-category A.2)
iQP – quantity produced of commodity i
iLVO – price levies based on output for commodity i
iRP – reference price of commodity i
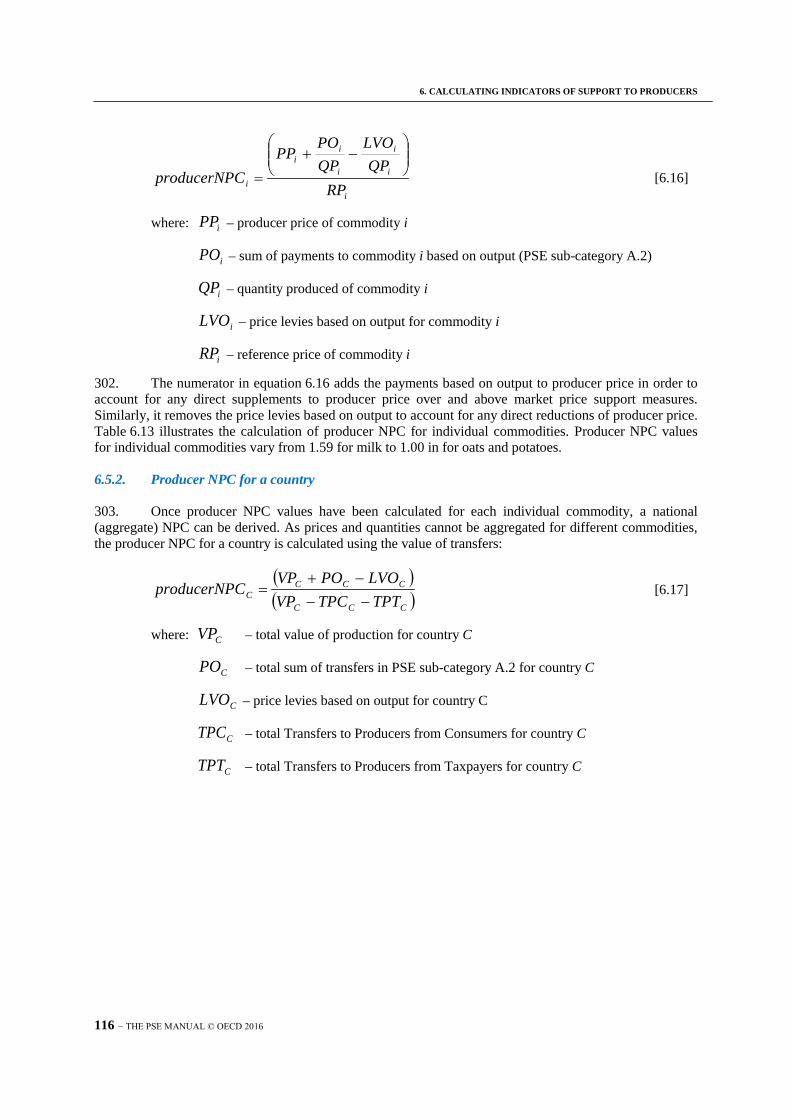
302. The numerator in equation 6.16 adds the payments based on output to producer price in order to account for any direct supplements to producer price over and above market price support measures. Similarly, it removes the price levies based on output to account for any direct reductions of producer price. Table 6.13 illustrates the calculation of producer NPC for individual commodities. Producer NPC values for individual commodities vary from 1.59 for milk to 1.00 in for oats and potatoes.
6.5.2. Producer NPC for a country
303. Once producer NPC values have been calculated for each individual commodity, a national (aggregate) NPC can be derived. As prices and quantities cannot be aggregated for different commodities, the producer NPC for a country is calculated using the value of transfers:
( )( )CCC
CCCC TPTTPCVP
LVOPOVPCproducerNP
−−−+
= [6.17]
where: CVP – total value of production for country C
CPO – total sum of transfers in PSE sub-category A.2 for country C
CLVO – price levies based on output for country C
CTPC – total Transfers to Producers from Consumers for country C
CTPT – total Transfers to Producers from Taxpayers for country C
116 − THE PSE MANUAL © OECD 2016

6. CALCULATING INDICATORS OF SUPPORT TO PRODUCERS
304. While the VP, PO and LVO values are known at the national level, values for TPC and TPT have to be calculated. Following the assumption and procedure for deriving a national (aggregate) MPS, these values are derived by extrapolating from TPC and TPT for the individual commodities according to:
C
AMCii
AMCii
C VPVP
TPCTPC ×=
∑∑
∈
∈ and C
AMCii
AMCii
C VPVP
TPTTPT ×=
∑∑
∈
∈ [6.18]
where: ∑∈AMCi
iTPC – sum of TPC for all commodities for which MPS has been calculated
∑∈AMCi
iTPT
– sum of TPT for all commodities for which MPS has been calculated
∑∈AMCi
iVP
– sum of VP for all commodities for which MPS has been calculated
305. Table 6.14 shows the calculation of a national (aggregate) producer NPC, which at 1.20 is exactly the same as the aggregate producer NPC for All MPS commodities.
306. The producer NPC for individual commodities can also be calculated based on the transfer values method, by substituting the appropriate values for the individual commodity into equation 6.17.
THE PSE MANUAL © OECD 2016 − 117

6. CALCULATING INDICATORS OF SUPPORT TO PRODUCERS
Table 6.13. Calculation of producer NPC for individual commodities (example)
Symbol Description Units Wheat Barley Oats Milk Beef Cotton Potatoes Source / equation
QPi Level of production 000 T 250 110 50 200 100 360 160 Table 6.3
PPi Producer price (at farm gate) LC/T 2,060 1,260 1,040 2,000 2,500 500 1,000 Table 6.3
VPi Value of production (at farm gate) LC million 515 139 52 400 250 180 160 Table 6.3
RPi Reference Price (at farm gate) LC/T 1,890 1,200 1,040 1,350 2,000 450 1,000 Table 6.3
POi A2. Payments based on output LC million 10 0 0 30 0 6 0 Table 6.11
POTi Payments based on output per tonne LC/T 40 0 0 150 0 17 0 POi / QPi
LVi Price levies of which: LC million 20 0 0 0 10 0 0 Table 6.3
LVOi Producer levies based on output LC million 0 0 0 0 0 0 0 data
LVOTi Producer levies based on output per tonne LC/T 0 0 0 0 0 0 0 LVOi / QPi
TPCi Transfers to producers from consumers LC million 34 7 0 130 38 18 0 Table 6.3
TPTi Transfers to producers from taxpayers LC million 9 0 0 0 13 0 0 Table 6.3
Producer Nominal Protection Coefficient Ratio 1.11 1.05 1.00 1.59 1.25 1.15 1.00 (PPi + POTi - LVOTi) / RPi or
(VPi + POi - LVOi) / (VPi - TPCi - TPTi)
Producer NPCi
Table 6.14. Calculation of a national (aggregate) producer NPC (example)
Symbol Description UnitsAll MPS
commodities (AMC)
National (aggregate)
(C)Source / equation
VPi Value of production (at farm gate) LC million 1,696 2,325 Table 6.2
POi A2. Payments based on output LC million 46 56 Table 6.13 and Table 6.11
LVOi Price levies based on output LC million 0 0 Table 6.13
TPCi Transfers to producers from consumers LC million 226 310 TPCC = TPCAMC / VPAMC * VPC
TPTi Transfers to producers from taxpayers LC million 21 29 TPTC = TPTAMC / VPAMC * VPC
Producer NPC Producer Nominal Protection Coefficient Ratio 1.2 1.2 (VPi + POi - LVOi) / (VPi - TPCi - TPTi)
118 − THE PSE MANUAL © OECD 2016
6. CALCULATING INDICATORS OF SUPPORT TO PRODUCERS
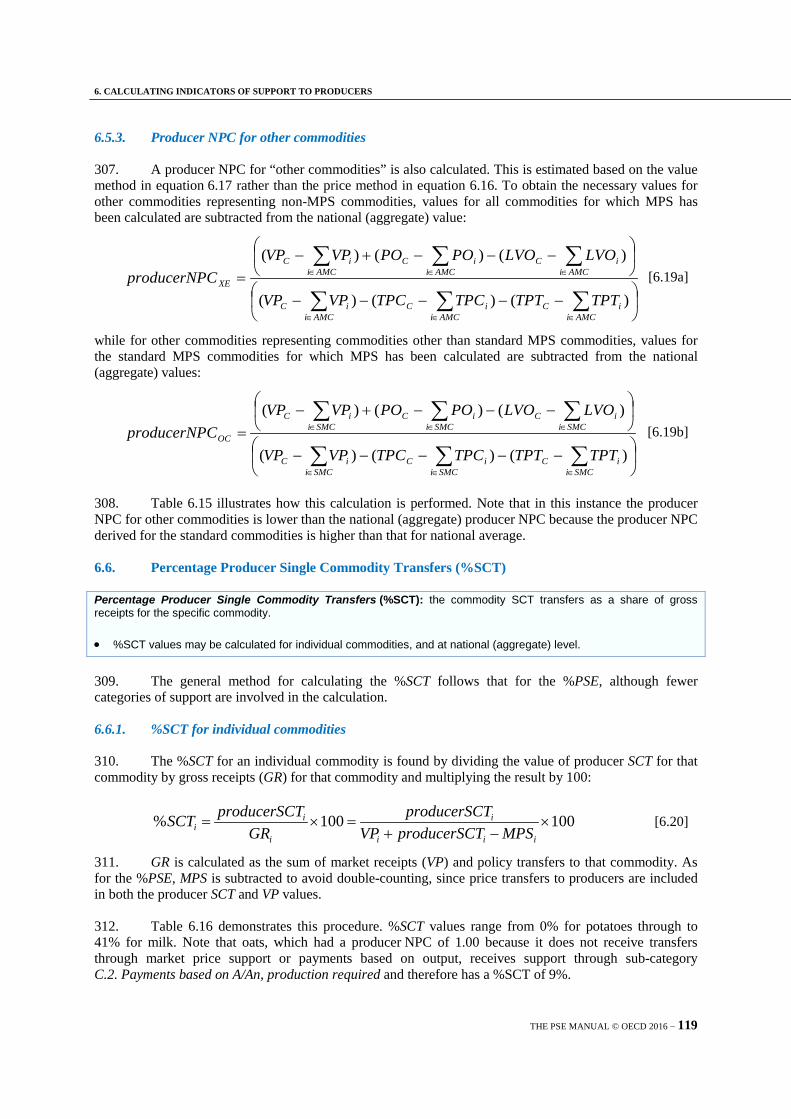
6.5.3. Producer NPC for other commodities
307. A producer NPC for “other commodities” is also calculated. This is estimated based on the value method in equation 6.17 rather than the price method in equation 6.16. To obtain the necessary values for other commodities representing non-MPS commodities, values for all commodities for which MPS has been calculated are subtracted from the national (aggregate) value:
−−−−−
−−−+−
=
∑∑∑
∑∑∑
∈∈∈
∈∈∈
)()()(
)()()(
AMCiiC
AMCiiC
AMCiiC
AMCiiC
AMCiiC
AMCiiC
XE
TPTTPTTPCTPCVPVP
LVOLVOPOPOVPVPCproducerNP [6.19a]
while for other commodities representing commodities other than standard MPS commodities, values for the standard MPS commodities for which MPS has been calculated are subtracted from the national (aggregate) values:
−−−−−
−−−+−
=
∑∑∑
∑∑∑
∈∈∈
∈∈∈
)()()(
)()()(
SMCiiC
SMCiiC
SMCiiC
SMCiiC
SMCiiC
SMCiiC
OC
TPTTPTTPCTPCVPVP
LVOLVOPOPOVPVPCproducerNP [6.19b]
308. Table 6.15 illustrates how this calculation is performed. Note that in this instance the producer NPC for other commodities is lower than the national (aggregate) producer NPC because the producer NPC derived for the standard commodities is higher than that for national average.
6.6. Percentage Producer Single Commodity Transfers (%SCT)
Percentage Producer Single Commodity Transfers (%SCT): the commodity SCT transfers as a share of gross receipts for the specific commodity.
• %SCT values may be calculated for individual commodities, and at national (aggregate) level.
309. The general method for calculating the %SCT follows that for the %PSE, although fewer categories of support are involved in the calculation.
6.6.1. %SCT for individual commodities
310. The %SCT for an individual commodity is found by dividing the value of producer SCT for that commodity by gross receipts (GR) for that commodity and multiplying the result by 100:
100100% ×−+
=×=iii
i
i
ii MPSTproducerSCVP
TproducerSCGR
TproducerSCSCT [6.20]
311. GR is calculated as the sum of market receipts (VP) and policy transfers to that commodity. As for the %PSE, MPS is subtracted to avoid double-counting, since price transfers to producers are included in both the producer SCT and VP values.
312. Table 6.16 demonstrates this procedure. %SCT values range from 0% for potatoes through to 41% for milk. Note that oats, which had a producer NPC of 1.00 because it does not receive transfers through market price support or payments based on output, receives support through sub-category C.2. Payments based on A/An, production required and therefore has a %SCT of 9%.
THE PSE MANUAL © OECD 2016 − 119

6. CALCULATING INDICATORS OF SUPPORT TO PRODUCERS
Table 6.15. Calculation of a producer NPC for Other Commodities (example)
Symbol Description UnitsNational
(aggregate)(C)
All MPS commodities
(AMC)
Standard MPS commodities
(SMC)
Non -MPScommodities
(XE)
Other commodities
(OC)Source / equation
VPi Value of production (at farm gate) LC million 2,325 1,696 1,356 629 969VPC and VPSMC: Table 6.2VPXE = VPC - VPAMC
VPOC = VPC - VPSMC
POi A2. Payments based on output LC million 56 46 40 10 16 Table 6.11
LVOi Price levies based on output LC million 0 0 0 0 0 Table 6.13
TPCi Transfers to producers from consumers LC million 310 226 208 84 102TPCC and TPCSMC: Tables 6.13 and 6.14TPCXE = TPCC - TPCAMC
TPCOC = TPCC - TPCSMC
TPTi Transfers to producers from taxpayers LC million 29 21 21 8 8TPTC and TPTSMC: Tables 6.13 and 6.14TPTXE = TPTC - TPTAMC
TPTOC = TPTC - TPTSMC
Producer NPC Producer Nominal Protection Coefficient Ratio 1.20 1.20 1.24 1.19 1.15 (VPi + POi - LVOi) / (VPi - TPCi - TPTi)
120 − THE PSE MANUAL © OECD 2016

6. CALCULATING INDICATORS OF SUPPORT TO PRODUCERS
Table 6.16. Calculation of %SCT for individual commodities (example)
Symbol Description Units Wheat Barley Oats Milk Beef Cotton Potatoes Source / equation
VPi Value of production LC million 515 139 52 400 250 180 160 Table 6.3
PSCTi Producer Single Commodity Transfers LC million 43 12 5 197 31 24 0 Table 6.11
MPSi A1. Market Price Support LC million 23 7 0 117 31 18 0 Table 6.3
POi A2. Payments based on output LC million 10 0 0 30 0 6 0 Table 6.11
PIi B. Payments based on input use LC million 0 0 0 0 0 0 0 Table 6.11
PCiC2. Payments based on current A/An, production required (single commodity) LC million 10 5 5 0 0 0 0 Table 6.11
PHRiD. Payments based on non-current A/An/R/I, production required (single commodity) LC million 0 0 0 50 0 0 0 Table 6.11
GRi Gross Receipts for individual commodity LC million 535 144 57 480 250 186 160 VPi + (PSCTi - MPSi)
%PSCTi Percentage Producer Single Commodity Transfer % 8 8 9 41 12 13 0 100 * PSCTi / GRi or
100 * PSCTi / (PSCTi + VPi - MPSi)
THE PSE MANUAL © OECD 2016 − 121

6. CALCULATING INDICATORS OF SUPPORT TO PRODUCERS
Table 6.17. Calculation of a national (aggregate) %SCT and a %SCT for Other Commodities (example)
Symbol Description UnitsNational
(aggregate)(C)
All MPS commodities
(AMC)
Standard MPS commodities
(SMC)
Non -MPScommodities
(XE)
Other commodities
(OC)Source / equation
VPi Value of production LC million 2,325 1,696 1,356 629 969 VPC and VPSMC: Table 6.2 VPXE = VPC - VPAMC
VPOC = VPC - VPSMC
PSCTi Producer Single Commodity Transfers LC million 394 311 287 82 106 Table 6.11
MPSi A1. Market Price Support LC million 268 195 177 72 90 Table 6.11
POi A2. Payments based on output LC million 56 46 40 10 16 Table 6.11
PIi B. Payments based on input use LC million 0 0 0 0 0 Table 6.11
PCi C2. Payments based on current A/An, production required (single commodity)
LC million 20 20 20 0 0 Table 6.11
PHRi D. Payments based on non-current A/An/R/I, production required (single commodity)
LC million 50 50 50 0 0 Table 6.11
GRi Gross receipts LC million 2,451 1,812 1,466 639 985 GRC = VPC + PSCTC - MPSC
GRAMC = VPAMC + PSCTAMC - MPSAMC
GRSMC = VPSMC + PSCTSMC - MPSSMC
GRXE = GRC - GRAMC
GROC = GRC - GRSMC
%PSCTi Percentage Producer Single Commodity Transfer
% 16 17 20 13 11 100 * PSCTi = PSCTi / GRi or100 * PSCTi / (PSCTi + VPi - MPSi)
122 − THE PSE MANUAL © OECD 2016

6. CALCULATING INDICATORS OF SUPPORT TO PRODUCERS
6.6.2. %SCT for a country
313. A national (aggregate) %SCT is obtained using the same formulas as for individual commodities except that the values represent the national (aggregate) values:
100100% ×−+
=×=CCC
C
C
CC MPSTproducerSCVP
TproducerSCGR
TproducerSCSCT [6.21]
314. Table 6.17 presents the results for this calculation.
6.6.3. %SCT for other commodities
315. The %SCT for other commodities representing non-MPS commodities can be found by using the producer SCT and GR values for the all MPS commodities and for the country as a whole:
100)(
)(% ×
−
−=
∑∑
∈
∈
AMCiiC
AMCiiC
XE GRGR
TproducerSCTproducerSCSCT [6.22a]
while for other commodities representing commodities other than standard MPS commodities by using the producer SCT and GR values for the standard MPS commodities and for the country as a whole:
100)(
)(% ×
−
−=
∑∑
∈
∈
SMCiiC
SMCiiC
oc GRGR
TproducerSCTproducerSCSCT [6.22b]
316. Table 6.17 also shows the calculation of the %Producer SCT for other commodities.
THE PSE MANUAL © OECD 2016 − 123
6. CALCULATING INDICATORS OF SUPPORT TO PRODUCERS
Annex 6.1.
Commodity groups applied in estimates for OECD countries
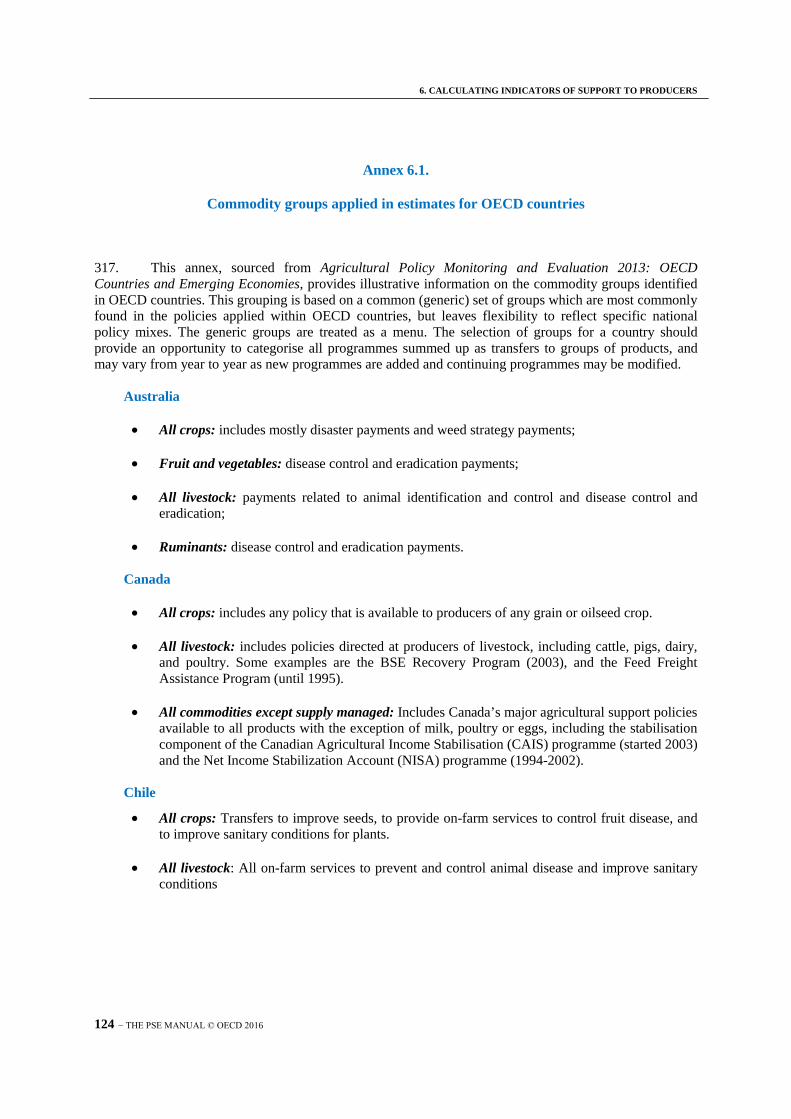
317. This annex, sourced from Agricultural Policy Monitoring and Evaluation 2013: OECD Countries and Emerging Economies, provides illustrative information on the commodity groups identified in OECD countries. This grouping is based on a common (generic) set of groups which are most commonly found in the policies applied within OECD countries, but leaves flexibility to reflect specific national policy mixes. The generic groups are treated as a menu. The selection of groups for a country should provide an opportunity to categorise all programmes summed up as transfers to groups of products, and may vary from year to year as new programmes are added and continuing programmes may be modified.
Australia
• All crops: includes mostly disaster payments and weed strategy payments;
• Fruit and vegetables: disease control and eradication payments;
• All livestock: payments related to animal identification and control and disease control and eradication;
• Ruminants: disease control and eradication payments.
Canada
• All crops: includes any policy that is available to producers of any grain or oilseed crop.
• All livestock: includes policies directed at producers of livestock, including cattle, pigs, dairy, and poultry. Some examples are the BSE Recovery Program (2003), and the Feed Freight Assistance Program (until 1995).
• All commodities except supply managed: Includes Canada’s major agricultural support policies available to all products with the exception of milk, poultry or eggs, including the stabilisation component of the Canadian Agricultural Income Stabilisation (CAIS) programme (started 2003) and the Net Income Stabilization Account (NISA) programme (1994-2002).
Chile
• All crops: Transfers to improve seeds, to provide on-farm services to control fruit disease, and to improve sanitary conditions for plants.
• All livestock: All on-farm services to prevent and control animal disease and improve sanitary conditions
124 − THE PSE MANUAL © OECD 2016

6. CALCULATING INDICATORS OF SUPPORT TO PRODUCERS
European Union
• All crops: Any policy that is available to producers of any crop, such as measures for irrigation, pest control or environmentally friendly crop farming and payments for seed production.
• All arable crops: This group is only used for measures such as payments for crop rotation, as most area payments under Agenda 2000 were restricted to COP (see below).
• Cereals, oilseeds and protein crops (COP): Any policy that is available to producers of any COP crop, such as set-aside payments and Agenda 2000 area payments after 2003.
• Grains: Payments per hectare of cereals, with a rate per ha for any cereal different from that for oilseeds or protein crops. They were introduced by the 1992 reform. In 2004, these payments became part of the COP group.
• Oilseeds: Payments per hectare of oilseeds, with a rate per ha for any oilseed different from that for cereals or protein crops.
• Protein crops: payments per hectare of protein crops, with a rate per ha for any protein crops different from that for cereals or oilseeds.
• All fruit and vegetables: measures for the whole fruit and vegetable sector, such as measures for orchard improvement.
• Other crops: Payments to crops other than COP, including grass and forage crops.
• All livestock: Policies directed at producers of livestock, including cattle, pigs, dairy, and poultry. Examples are measures for disease control, breeding improvement, compensating losses or manure handling, as well as some regional payments.
• Ruminants: Payments for beef, sheep and goats such as less-favoured area payments before 2000, which were paid per livestock unit and sustainable animal breeding payments.
• Non-ruminants: No payment is made specifically to non-ruminants in EU member states.
• Milk and beef: Payments to the dairy sector, which cannot be associated to either milk production of meat production, such as investments in stables.
Iceland
• All livestock: Includes policies directed at producers of livestock, including cattle, pigs, dairy, and poultry. An example is the animal breeding programme.
• Ruminants: Policies directed at producers of cattle, dairy and sheepmeat.
• Milk and beef: Payments to the dairy sector which are related to disaster payments
THE PSE MANUAL © OECD 2016 − 125

6. CALCULATING INDICATORS OF SUPPORT TO PRODUCERS
Israel
• All crops: Payments for soil conservation practices.
• All grains: Payments for rain-fed grain growers and investment grants to introduce more advanced technologies in grain production.
• All livestock: Investment grants to improve efficiency of livestock production.
• Fruit excluding citrus: Investment grants to implement technologies saving water and labour.
• Oranges and grapefruit: Investment grants to implement technologies saving water and labour.
• Vegetables: Investment grants to implement technologies saving water and labour.
• Beef and sheep: Payments per area grazed to maintain cattle, sheep and goats on pastures in peripheral regions and payments to establish basic infrastructure in grazing areas.
Japan
• All crops: Direct payment for environmentally friendly farming.
• All arable crops: Includes direct (income based) payments to core farmers.
• Livestock: Includes policy directed at producers of livestock, including cattle, pigs, dairy, and poultry. Animal disease control programme is an example.
• Wheat, barley and soybeans: Policy that was available to producers of wheat, barley and soybeans, but which ended in 2008.
Korea
• All crops: Payments based on input use such as fertilizer, seeds and pesticides. In more recent years (starting from 1999), this group includes also pest and disease control payments, payments for set-aside, direct payment for environment-friendly farming practices, paddy-field environmental conservation payment and direct payment for landscape preservation.
• All livestock: Policies directed at producers of livestock, including cattle, pigs, dairy, and poultry. The transfers in this category include three programmes: direct payment for environmentally-friendly livestock practices, payments for management of livestock waste, and credit concessions to livestock farmers.
• Beef and pigmeat: Payments in the meat quality enhancement programme. It is the payments per head of animal to encourage good quality beef and pigmeat.
• Beef and milk: Payments in the cattle reproduction programme which includes artificial insemination.
126 − THE PSE MANUAL © OECD 2016
6. CALCULATING INDICATORS OF SUPPORT TO PRODUCERS
Mexico
• All crops: Includes any policy that is available to producers of any grain or oilseed crop. Most of the policies in this group belong to ALIANZA.
• Grains: Technical assistance program of ALIANZA, which ended in 2002.
• All livestock: Policies directed at producers of livestock, including cattle, pigs, dairy, and poultry. Some examples are ALIANZA programs such as the Livestock Improvement, and the Genetic Improvement.
• Several smaller groups of commodities are as follows: “Maize and beans”, “Fruits”, “Sorghum, maize and oilseeds”, “Alternative crops”, “Citruses” and “fruit, flowers, industrial crops, and alternative crops”. Some of these payments are sub-national under ALIANZA. None of these payments have been provided recently, except for “Maize and beans”.
New Zealand
• All livestock: Payments on animal disease control programmes that seek to safeguard the health of the agricultural animal population. These programmes include export quality assurance for live animals, the reduction of production-limiting diseases, disease surveillance and disease eradication. This payment represented 100% of GCT since 1993, when the payments for the other group (sheep meat, wool, beef and milk) were completely stopped.
• Sheep meat, wool, beef and milk: Labour subsidy programme, fertilizer price subsidy programme, livestock incentive scheme, land development and encouragement loan scheme, interest concession programme from the rural bank and finance corporation, debt discounting write-off programme from the rural bank and finance corporation, the debt write-off programme for producer boards. The payments for this category were completely stopped in 1992 as the reform of these sectors was accomplished.
Norway
• Grains: Payments based on output, payments per hectare of grains, transport subsidies, and regional subsidies.
• All fruit and vegetables: Support for energy saving in greenhouses, investment support for greenhouses and storehouses and packaging of horticultural products, and various area payments for potatoes, vegetables, fruits and berries.
• All livestock: Payments to producers of livestock, including cattle, pigs, dairy, and poultry. Examples are deficiency payments, per head payments, and the vacation and temporary substitute scheme for livestock producers, as well as some regional payments.
• Ruminants: Per head payments for grazing animals.
• Tubers: Various payments to root crops, including under the acreage and cultural landscape scheme.
• Feed crops: All subsidies to coarse feed, including acreage support to mountain farming, and support to meadow seed storage.
THE PSE MANUAL © OECD 2016 − 127

6. CALCULATING INDICATORS OF SUPPORT TO PRODUCERS
Switzerland
• All livestock: Includes policies that are available to livestock raised in difficult conditions (livestock in mountain areas, 1986-98; livestock in difficult conditions, 1999-2006). At a later stage this group includes also payments for animal welfare (payments for animal housing systems, from 1996; payments for keeping animal outdoors, from 1999).
• Ruminants: Base area payment for grassland (1993-98) and payments for roughage eating animals (from 1999). The programme consists of per head payments available to all producers for ruminants (beef, sheep and goats, horses, lamas, alpacas, etc.).
• All crops: Payments based on input use such as fertilizer, seeds and pesticides; however, the most important part of transfers within this group was the payments for integrated production (1992-98).
• Arable crops: Transfers to this group are mainly the base area payment to arable land applied in the 1992-98 period.
• Grains: Mainly the base premium for coarse grains (1986-2000), relatively small amounts of payments were for extensive production of grains (1992-98).
• Oilseeds: Area payments for oilseeds (from 1999).
• Grains and oilseeds: Area payments for extensive grains and rapeseed cultivation (from 1999).
• All crops except wine: Payments for crop production on steep slopes.
• All crops, cattle and sheep: Payments for Ecological Compensation and Extensive Meadows
Turkey
• All Crops: Primarily includes support for input use, such as fertiliser subsidies, pesticide subsidies, hybrid seed subsidies and support for natural disasters.
• Grains: Area feed crops premium.
• All livestock: Transfers to livestock producers in the form of input support, such as support for feed, capital grants, livestock replacement and control of disease.
• Milk, beef and sheep meat: Support to producers of cattle, dairy and sheep for animal replacement due to natural disasters through the Livestock Replacement Programme and for pasture improvement.
• Wheat, sugar, cotton, sunflower: Payments under the On-Farm Development Support Programme, terminated in 2005.
• Hazelnuts and tobacco: Payments under the Transition Programme.
128 − THE PSE MANUAL © OECD 2016

6. CALCULATING INDICATORS OF SUPPORT TO PRODUCERS
United States
• All crops: Primarily includes payments for environmental conservation and protection purposes. Examples of programmes in this group include the Conservation Security Program and Crop Disaster Payments Program.
• All non-insured crops: Payments under the Non-insured Crop disaster Assistance Program.
• Ruminants: Support to producers of cattle, dairy and sheep under the Feed Assistance Program and the Grassland Reserve Program.
• All livestock: Payments under the Livestock Indemnity Program
• Trees and vineyards: Payments under the Tree and Vineyard Disaster Payments Program.
Brazil
• All arable crops: Insurance subsidy within the Crop Guarantee programme (Garantia-Safra).
• All livestock: Rural Insurance Premium Subsidy for livestock
China
• All crops: Price subsidies to fertilisers and other chemical inputs; per unit of land payments to compensate farmers for an increase in prices of inputs such as fertilisers, pesticides, plastic films and diesel; subsidies for improving soil organic matter levels; subsidies for the construction of small-sized water facilities; subsidy to reduce the fee burden on agricultural irrigation water; budgetary expenditures to assist construction of small irrigation facilities; payments to protect agricultural water and soil production resources; payments for soil conservation.
• Grains: A number of policy measures targeting grain producers, such as per unit of land direct payments to grain producers; payments for an extension of new varieties of grains; insurance subsidies for grain producers; payments for the development of large-scale production of grains; payments to support the development of high-quality grain production in 13 main grain producing provinces.
• Wheat, maize, soybean: Per unit of land payments to encourage application of new varieties of selected crop seeds.
• Livestock: Payments within the Standardized Livestock Raising Pilot Programme; subsides for the prevention and control of animal epidemics; payments to protect grassland and pasture; payments for the extension of new varieties of livestock.
Indonesia
• All crops: Subsidy paid to state-owned fertiliser manufacturers to compensate for the sale of certain fertiliser products to farmers at the government-determined Highest Retail Price. Since 2008 it also includes budgetary expenditures on the Direct Fertiliser Aid programme, which distributes organic and NPK fertilisers at no cost to farmers who participate in field schools.
THE PSE MANUAL © OECD 2016 − 129

6. CALCULATING INDICATORS OF SUPPORT TO PRODUCERS
Kazakhstan
• All crops: Seeds subsidy, fuel subsidy, mineral fertiliser and chemicals subsidy, compensation on interest of sowing and harvesting loans, multi-year loans for sowing and harvesting, credit for individual farmers for field works, loans based on funds from local governments, pledge-free financing programme, feed subsidy, credit provided through credit associations, credit based on funds from local governments, credit for investment projects, rural micro-credit to individual borrowers, credit to micro-credit organisations, subsidy for transportation of irrigation water, write-off of tax arrears to state farms producing elite seeds (arrears as of 1 January 2000).
• Grains: Credit through farmer co-operatives (production services), payments per hectare of grains.
• Oilseeds: Payments per hectare of oilseeds.
• Other crops: Compensation of crop insurance indemnities.
• Fruit and vegetables: Seed subsidy (for the establishment of perennial fruit plantations and vineyards), support for the establishment and maintenance of perennial fruit plantations and vineyards, direct public investment in horticulture projects, credit for investment projects (greenhouses), concessions associated with leasing of greenhouses, payments per hectare of vegetables and melons, payments per hectare of fruit and berries.
• All livestock: Ad hoc drought measure, support for purchase of pedigree livestock, commercial loans for livestock production, credit based on funds from local governments, credit for investment projects (livestock reproduction farms), credit to micro-credit organisations, credit for purchase of breeding stock and feeds, compensation for loss from animal culling due to epizootics, write-off of tax arrears to state farms that raise pedigree livestock.
• Milk and beef: Investment in construction of industrial milk and meat production facilities, credit for acquisition of pedigree beef and milk cattle.
• Feed crops: Payments per hectare of other crops.
Russian Federation
• All crops: Fertiliser and agricultural chemicals subsidy (from 1993), subsidies for quality seeds and sowing, crop insurance subsidy, regional interest rate subsidy (2001-2004) and non-specified variable input and fixed-cost subsidies for the crop sector (from 2005), as well as payments for improvement of agricultural land and compensation for natural disasters.
• Other crops: Seed subsidy, expenditures for preparation of low-productive arable land for cultivation of fodder crops, for maintenance of crop plantations.
• All livestock: Pedigree programme, mixed feed subsidy, and non-specified variable input and fixed-cost subsidies for the livestock sector, development of family livestock farms
• Vegetables: Energy subsidy for greenhouses (between 1992 and 2004).
• Poultry and pig meat: Public grants for the construction and reconstruction of poultry and pig complexes (in 2003).
130 − THE PSE MANUAL © OECD 2016

6. CALCULATING INDICATORS OF SUPPORT TO PRODUCERS
South Africa
• Horticulture: Water quota subsidy between 1994 and 1998.
• Beef and veal, sheep: Purchase loans for stock feed, subsidies for transportation of livestock and fodder, sinking of boreholes in times of drought for livestock, water transport, as well as fire damage subsidy, payments under the Interim Natural Grazing Recovery Scheme and subsidies for conversion of marginal lands.
Ukraine
• All crops: Fertiliser subsidies and seed subsidies.
• Other crops: Payments for support for orchards, vineyards and berry fields.
• Grains Programmes covering disaster relief (in 2003-04) and a chemical subsidy (in 2003).
• All livestock: Fish meal subsidy (between 1986 and 1988) and payments to individual producers within the Programme for Support to Animal Husbandry, partial reimbursement of the cost of construction of livestock farms and complexes
• All except milk and meat: Payments based on "VAT accumulation" mechanism (from 1999).
• Grains and oilseeds: Interest-free cash advances for purchase of inputs (between 1994 and 1997), debt write-off on state commodity credit, and transfers arising from the restructuring of debt on state commodity credit.
THE PSE MANUAL © OECD 2016 − 131