
Chapter 6 Cable Regulation in the Internet Era · Chapter 6 Cable Regulation in the Internet Era...
71
Chapter 6 Cable Regulation in the Internet Era * Gregory S. Crawford Department of Economics University of Warwick January 18, 2013 Abstract The market for multi-channel video programming has undergone considerable change in the last 15 years. Direct-Broadcast Satellite service, spurred by 1999 legislation that leveled the playing field with cable television systems, has grown from 3% to 33% of the U.S. MVPD (ca- ble, satellite, and telco video) market. Telephone operators have entered in some parts of the US and online video distributors are a growing source of television viewing. This chapter con- siders the merits of cable television regulation in light of these developments. It surveys the dismal empirical record on the effects of price regulation in cable and the more encouraging but incomplete evidence on the benefits of satellite and telco competition. It concludes with a consideration of four open issues in cable markets: horizontal concentration and vertical inte- gration in the programming market, bundling by both cable systems and programmers, online video distribution, and temporary programming blackouts from failed carriage negotiations for both broadcast and cable programming. While the distribution market is clearly now more competitive, concerns in each of these areas remain. JEL: L50, L43, L41, L42 * Requisite blurb: “Gregory S. Crawford is a Professor of Economics at the University of Warwick in the United Kingdom.” I would like to thank Nancy Rose, Ali Yurukoglu, Tasneem Chipty, Leslie Marx, Tracy Waldon, and seminar participants at the NBER Conferences on Economic Regulation for helpful comments. Thanks also to ESRC Grant RES-062-23-2586 for financial support for this research. An older version of this paper circulated under the title, “Cable Regulation in the Satellite Era.” Correspondence may be sent to Gregory S. Crawford, Department of Economics, University of Warwick Coventry, CV4 7AL, United Kingdom (email [email protected]).
Transcript of Chapter 6 Cable Regulation in the Internet Era · Chapter 6 Cable Regulation in the Internet Era...

Chapter 6
Cable Regulation in the Internet Era ∗
Gregory S. Crawford
Department of Economics
University of Warwick
January 18, 2013
Abstract
The market for multi-channel video programming has undergone considerable change in the
last 15 years. Direct-Broadcast Satellite service, spurred by 1999 legislation that leveled the
playing field with cable television systems, has grown from 3% to 33% of the U.S. MVPD (ca-
ble, satellite, and telco video) market. Telephone operators have entered in some parts of the
US and online video distributors are a growing source of television viewing. This chapter con-
siders the merits of cable television regulation in light of these developments. It surveys the
dismal empirical record on the effects of price regulation in cable and the more encouraging
but incomplete evidence on the benefits of satellite and telco competition. It concludes with a
consideration of four open issues in cable markets: horizontal concentration and vertical inte-
gration in the programming market, bundling by both cable systems and programmers, online
video distribution, and temporary programming blackouts from failed carriage negotiations for
both broadcast and cable programming. While the distribution market is clearly now more
competitive, concerns in each of these areas remain.
JEL: L50, L43, L41, L42
∗Requisite blurb: “Gregory S. Crawford is a Professor of Economics at the University of Warwick in the United
Kingdom.” I would like to thank Nancy Rose, Ali Yurukoglu, Tasneem Chipty, Leslie Marx, Tracy Waldon, and
seminar participants at the NBER Conferences on Economic Regulation for helpful comments. Thanks also to ESRC
Grant RES-062-23-2586 for financial support for this research. An older version of this paper circulated under the
title, “Cable Regulation in the Satellite Era.” Correspondence may be sent to Gregory S. Crawford, Department of
Economics, University of Warwick Coventry, CV4 7AL, United Kingdom (email [email protected]).
1 Introduction
Now is a quiet time in the on-again, off-again regulation of the cable television industry. Since
the 1996 Telecommunications Act eliminated price caps for the majority of cable service bundles
on March 31, 1999, cable systems have been free to charge whatever they like for the services
chosen by the vast majority of subscribers. That was a watershed year, as the Satellite Home
Viewer Improvement Act of 1999 also relaxed regulatory restrictions limiting the ability of direct-
broadcast satellite (DBS) systems to provide local television signals into major television markets.
Since then, satellite providers have added 23 million more subscribers than cable, giving them over
a third of the multi-channel video programming distribution (MVPD) marketplace and providing
two credible competitors to incumbent cable systems in most markets (FCC (2001c), FCC (2005b)).
More recently, local telephone operators Verizon and AT&T have invested billions to provide video
in their local service areas and, by 2010, had earned another 7% of the market and online video
distribution is a growing source of television viewing.
On the other hand, while concentration has fallen in video distribution, the last 15 years has also
seen continued national consolidation, with the top 8 firms increasing their national share of MVPD
subscribers from 68.6% in 1997 to 84.0% in 2010 (FCC (1998c), FCC (2012c)). Programming
markets have also become more concentrated over this period. This has raised concerns about
competition and integration in the wholesale (programming) market. Horizontal concentration and
channel occupancy limits enacted after the 1992 Cable Act were struck down in 2001, reinstated
in 2007, and struck down again in 2009 (Make (2009)). As cable prices continue to rise, lawmakers
wonder about the feasibility of a-la-carte services to reduce cable prices (Hohmann (2012)).
This chapter considers the merits of regulation in cable television markets in light of these devel-
opments. I do so in three parts. In the first part, I survey past and present cable regulations and
assess their effects. I begin by surveying the reasons for and effects of the four major periods of
regulation and deregulation of cable prices (1972-1984, 1984-1992, 1992-1996, 1996-present). The
evidence for regulation is discouraging: unregulated periods exhibit rapid increases in quality and
penetration (and prices), while regulated periods exhibit slight decreases in prices and possibly
lower quality. Consumer welfare estimates, while few, suggest consumers prefer unregulated cable
services. This highlights the difficulty regulating prices in an industry, like cable, where service
quality cannot be regulated and is easily changed.
I then review the empirical record on the consequences of competition in cable markets. Evidence
from duopoly (“overbuilt”) cable markets is robust: an additional wireline competitor lowers cable
prices, with estimates ranging from 8% to 34%. Evidence of the effect of satellite competition is
less compelling: surveyed rates are often only marginally lower and sometimes higher. Empirical
studies trying to measure satellite competition’s effects accounting for quality changes find prices
2

may be (somewhat) lower, that most of the consumer benefits from such competition accrues to
satellite and not cable subscribers, and that significant market power remains. While telco entry
has clearly been important to consumers in those markets where it has come, I know of no evidence
of its effects on cable prices or quality.
Finally, I address four open issues in cable markets where conclusions are harder to come by. First,
while horizontal concentration has clearly increased in the programming market, theoretical models
have ambiguous predictions of its effects and empirical work is hampered by insufficient data on
affiliate fees (prices). The evidence on vertical integration is more substantial: integrated systems
clearly favor affiliated programming, but whether for reasons of efficiency or foreclosure remain
unclear. Second, bundling impacts market outcomes in both the distribution and programming
markets. In distribution, it clearly enables systems to better capture consumer surplus and offer
high-quality and diverse programming, but it may do so at significant cost to consumers. Recent
research by Crawford and Yurukoglu (2012) finds consumers would not be better off under a la
carte. Worse, theoretical models suggest bundling in the wholesale market may enhance market
power and serve as an effective barrier to entry. Empirical evidence of this effect is critically
needed. Finally, industry participants and regulators alike are keenly interested in the likely effects
of growing online video consumption and what can be done about increasingly frequent bargaining
breakdowns between content providers and distributors that leave consumers “in the dark.”
The focus of this chapter is almost exclusively on the cable television market in the United States.
I do this for several reasons. First, the evolution of the video programming industry and the
regulations that apply to it differ considerably across countries. This has led to dramatic differences
in the market reach of cable systems, their market share among households passed, and the relative
importance of cable versus satellite versus telco operators in the retail and programming markets
(cf. OECD (2001, Table 2)). Second, this is a mostly empirical survey, and by virtue of a series of
FCC reports both on cable industry prices and on competition in the market for video programming
(e.g. FCC (2012b), FCC (2012c)) and a private data collection industry, there is surprisingly good
information about cable systems in the United States, both in the aggregate and for individual
systems. Adequately analyzing the experience in other countries would require a chapter in itself,
a worthwhile undertaking but beyond the scope of this effort. Finally, beyond a brief description
of the current regulatory treatment, I do not consider the economic and regulatory features of the
market for broadband Internet access. In part, the economic issues are different and more suitable
to a chapter on telecommunications, but in the main for the same reasons as above. This is a deep
and substantive policy issue whose treatment would quickly exhaust my space. See Jerry Hausman
and Greg Sidak’s chapter on Telecommunications markets for further analysis of this issue.
On the whole, the future looks bright for the organization of the cable television industry. Satellite
and telco competition has largely replaced price regulation as the constraining force on cable pricing
3

quality choice. Furthermore, consumer demand for online and mobile video is driving innovation
in video delivery. Several important areas of uncertainty remain, however. Issues of horizontal
concentration both up- and down-stream, vertical integration, bargaining breakdowns, and the
potential for foreclosure in both the traditional and online video programming markets are real
and significant. While there is no clear evidence of harm, more research is needed. Until then,
academics and regulators would do well to analyze these issues closely in the coming years.
2 A Cable Television Lexicon
The essential features of cable television systems have changed little in the industry’s 50 years of
existence. Then as now, cable systems choose a portfolio of television networks, bundle them into
services, and offer these services to consumers in local, geographically separate, cable markets.
Cable systems purchase the rights to distribute program networks in the Programming Market.
Since the mid-1990s, cable systems in the U.S. have had to compete for customers with Direct
Broadcast Satellite (DBS) providers. Since the mid-2000s, both have had to compete with tele-
phone operators offering video service in their local services areas. Together, cable, satellite, and
telephone company (telco) operators are said to compete in the Multi-channel Video Programming
Distribution (MVPD) market. This is sometimes just called the Distribution Market.
As in many media markets, the video programming industry earns most of its revenue from one
of two sources: monthly fees charged by cable systems to consumers for access to programming
and advertising fees charged (mostly) by networks to advertisers for access to audiences. Figure 1
demonstrates that advertising revenue has grown in importance to the industry and now comprises
over 30% of cable’s $97.6 billion in 2011 revenue (NCTA (2013a),NCTA (2013b)). Figure 2 provides
a graphical representation of the multi-channel video programming industry.
Insert Figure 1 Here
Insert Figure 2 Here
Cable systems today offer four main types of program networks. Broadcast networks are television
signals broadcast over the air in the local cable market by television stations and then collected
and retransmitted by cable systems. Examples include the major, national broadcast networks
– ABC, CBS, NBC, and FOX – as well as public and independent television stations. Cable
programming networks are fee- and advertising-supported general and special-interest networks
distributed nationally to MVPDs via satellite. Examples include some of the most recognizable
networks associated with pay television, including MTV, CNN, and ESPN.1 Premium programming
4

networks are advertising-free entertainment networks, typically offering full-length feature films.
Examples include equally familiar networks like HBO and Showtime. Pay-Per-View Networks are
specialty channels devoted to on-demand viewing of high-value programming, typically offering the
most recent theatrical releases and specialty sporting events.
Systems exhibit moderate differences in how they bundle networks into services. Historically,
broadcast and cable programming networks were bundled and offered as Basic Service while pre-
mium programming networks were unbundled and sold as Premium Services.2 In the last 20 years,
systems have diversified their offerings, often slimming down Basic Service to (largely) broadcast
networks and offering many of the most popular cable networks in multiple bundles called Expanded
Basic Services. They have also taken advantage of digital compression technology to dramatically
increase their effective channel capacity and offer hundreds of smaller cable networks. These net-
works are typically also bundled and offered as Digital Services. For Basic, Expanded Basic, or
Digital Services, consumers are not permitted to buy access to the individual networks offered in
bundles; they must instead purchase the entire bundle.
Migration to digital technologies also allowed cable systems to offer high-speed (broadband) ac-
cess to the Internet. This required significant investments in physical infrastructure, notably to
accommodate digital data and allow upstream communication (cf. Figure 3), but has proven to
be a successful undertaking: despite being deployed several years after telephone systems’ Digital
Subscriber Line (DSL) technology, cable systems in 2005 commanded over 63% of the broadband
market, earning revenues of $6.7 billion in 2003, over 12% of cable systems’ total revenue and
growing fast (FCC (2005b)).3
Insert Figure 3 Here
MVPDs continue to innovate in delivering video programming to households. Almost all MVPDs
now lease or sell Digital Video Recorders (DVRs) with hundreds of hours of recording time.4
Many also now offer video on demand with libraries of movies and previously aired episodes of
popular television series. In June 2009, Comcast and Time Warner introduced TV Everywhere to
allow authenticated cable subscribers to watch video online, on tablet computers like the iPad, or
on their mobile phones.5 While takeup has been slow due to the challenges of contracting with
content providers over rights through these new distribution channels, it is only a matter of time
before households will be able to consume the “four anys”: any programming, on any device, in
any place, and at any time.
MVPDs are not alone in these goals. It is now commonplace for consumers to rely on “over-the-
top” (OTT) delivery of video programming over the Internet. According to Nielsen (via the FCC),
“approximately 48% of Americans now watch video online, and 10% watch mobile video” (FCC
5
(2012c, p111)). That being said, in 2011 Nielsen also estimates the average American watched 27
minutes/week of video on the Internet (and 7 min/week on a mobile phone) versus over 5 hours
of traditional and time-shifted television. Similarly, Screen Digest estimates that online video
distributor (OVDs) revenue was no more than $407 million in 2010, just 0.3% of the $143 billion
spent by households and advertisers on traditional television. I discuss the likely effects of further
growth in online video distribution in Section 7.3 below.
3 A Brief History of Cable Regulation
3.1 1950-1984: The Early History
The cable television industry began in the 1950s to transmit broadcast television signals to areas
that couldn’t receive them due to interference from natural features of the local terrain.6 In order
to provide cable service, cable systems needed to reach “franchise agreements” with the appropriate
regulatory body, usually local municipalities. These agreements typically included agreements on
a timetable for infrastructure deployment, a franchise fee (typically a small percentage of gross
revenue), channel set-asides for public interest uses (e.g. community programming), and maximum
prices for each class of offered cable service in return for an exclusive franchise to use municipal
rights-of-way to install the system’s infrastructure.
Cable grew quickly until 1966, when the Federal Communications Commission (FCC) asserted
its authority over cable operators and forbid the importation of broadcast signals into the top
100 television markets unless it was satisfied that such carriage “would be consistent with the
public interest, and particularly with the establishment and healthy maintenance of UHF television
broadcast service.”7 It also instituted content restrictions that prevented the distribution of movies
less than 10 years old or sporting events broadcast within the previous 5 years. In 1972, the FCC
provided a comprehensive set of cable rules. First, it sought to balance broadcasting and cable
television interests by permitting limited importation of distant broadcast signals. It also, however,
imposed a host of other requirements, including Must-Carry, franchise standards, network program
nonduplication, and cross-ownership rules (FCC (2000b)).8
The next decade saw a gradual reversal of the 1972 regulations and a period of significant program-
ming and subscriber growth. First, rules originally established in 1969 were affirmed in 1975 that
franchise price regulation must be confined to services that included broadcast television stations
(GAO (1989)). As a result, premium or pay-TV stations were not nor ever have been subject to
price regulation. Second, in 1972 Time introduced Home Box Office (HBO) for the purpose of
providing original content on an advertising-free, fee-supported cable network. In 1975, it demon-
strated the ability to distribute programming via satellite and, in 1977, fought and won in court
6

against the FCC’s content restrictions, allowing HBO and a generation of subsequent cable net-
works to provide whatever programming they desired.9 Since the production of programming is a
public good, the advent of low-cost satellite technology with sizeable economies of scale revolution-
ized the distribution of programming for cable systems. WTBS, CNN, and ESPN began national
distribution of general-interest, news, and sports programming, respectively, in 1979 and 1980. In
all, no less than 13 of the 15 most widely available advertising-supported programming networks,
and all of the top 5 most widely available fee-supported programming networks, were launched
between 1977 and 1984. Cable systems grew at double-digit rates.
3.2 1984-Present: Back and Forth
While the scope of federal regulations had diminished by 1979, state and local regulations remained.
By the mid-1980s, however, the price terms of these contracts came under attack as cable joined
the “deregulation revolution” sweeping through Congress (Kahn (1991)). Convinced that three or
more over-the-air broadcast television signals provided a sufficient competitive alternative to cable
television service, Congress passed the 1984 Cable Act to free the vast majority of cable systems
from all price regulations.10
By 1991, cable systems had dramatically expanded their offered services. The average system
offered a Basic Service including a bundle of 35 channels as well as 4-6 Premium Services (GAO
(1991)). Prices also increased, however, rising 56% in nominal and 24% in real terms between
November 1986 and April 1991.
Concerned that high and rising prices reflected market power by monopoly cable systems, Congress
reversed course and passed the 1992 Cable Act to “provide increased consumer protection in cable
television markets”. Regulation differed by tiers of cable service and only applied if a system
was not subject to “effective competition.”11 Basic tiers were regulated, if desired, by the local
franchise authority, which was required to certify with the FCC. Cable programming (Expanded
Basic) tiers were regulated by the FCC.12 Both followed rules set by the FCC, reducing prices to
“benchmarks” based on prices charged by systems facing effective competition. In April 1993 the
FCC capped per-channel cable prices systems could charge for most types of cable service. The
FCC soon found, however, that not only did cable bills fail to decline, but that for nearly one-third
of cable subscribers, they had increased. Many systems had introduced new, unregulated services
and moved popular programming networks to those services; others had re-allocated their portfolio
of programming across services (FCC (1994), Hazlett and Spitzer (1997), Crawford (2000)). In
February 1994 the FCC imposed an additional 7% price reduction.
Responding to political pressure from cable systems, the FCC almost immediately began relaxing
price controls. First, “Going Forward” rules were established in November, 1994. As discussed by
7

Paul Joskow in his chapter analyzing incentive regulation in electricity transmission markets, an
important feature of incentive (price-cap) regulation are the rules governing the maximum price
over time. This is particularly important in cable markets, where both the number and cost of
programming networks regularly increase over time. Instead of allowing systems to increase prices
by a planned “cost + 7.5%” for each added network, the Going Forward rules permitted increases of
up to $1.50 per month over 2 years if up to six channels were added, regardless of cost (Hazlett and
Spitzer (1997)). Prices controls were further relaxed by the adoption of “Social Contracts” with
major cable providers in late 1995 and early 1996. These allowed systems to increase their rates for
Expanded Basic tiers on an annual basis in return for a promise to upgrade their infrastructure.13
The deregulatory about-face culminated with the passage of the 1996 Telecommunications Act.
This eliminated all price regulation for Expanded Basic tiers after March 31, 1999. Regulation of
Basic Service rates remains the only source of price regulation in the US cable television industry.
3.3 Must-Carry/Retransmission Consent
In addition to imposing price caps, the 1992 Cable Act introduced another set of regulations
whose effects are still being felt: Must-Carry and Retransmission Consent. Since 1972, cable
systems were subject to Must-Carry: they were required to carry all local broadcast signals available
in their franchise area. Systems fought Must-Carry, however, arguing it interfered with their
choice of content, and succeeded in having it struck down on First Amendment grounds in 1988.
The 1992 Cable Act, however, not only restored it but gave local broadcast stations the option
either to demand carriage on local cable systems (Must-Carry) or negotiate with those systems
for compensation for carriage (Retransmission Consent). These rules were upheld by the Supreme
Court in 1997.
Retransmission Consent has remained a point of contention between broadcast networks and cable
systems ever since. Agreements are often negotiated on repeating three-year intervals. Smaller (esp.
UHF) stations commonly select Must-Carry, but larger stations and station groups, particularly
those affiliated with the major broadcast networks, have aggressively used Retransmission Consent
to obtain compensation from cable systems. Systems initially refused to pay stations directly
for carriage rights, a position that has only changed in the last few years. Instead, they signed
carriage agreements for broadcaster-affiliated cable networks. ESPN2 (ABC), America’s Talking
(NBC), and FX (Fox) all were launched on systems this way.14 More recently, Disney (ABC) has
used Retransmission Consent to obtain expanded carriage agreements for SoapNet and the Disney
Channel and NBC to charge higher affiliate fees for CNBC and MSNBC (Schiesel (2001)). Indeed,
the power of retransmission consent to obtain carriage agreements was one stated motivation for
the purchase of CBS by Viacom in 1999.
8
Disagreements between broadcast television stations (and their affiliated networks) and MVPDs
over retransmission consent fees have become a hot-button policy issue in the last 5 years. Several
high-profile negotiations have resulted in broadcast stations being blacked out in major media
markets and one pro-MVPD lobbying group estimates there were broadcast-station blackouts in
40 television markets in 2011 and 91 in 2012.15 At root have been new and growing demands by
broadcasters for cash compensation for retransmission rights. An innovation as recently as 2007-
08, such demands are now the norm. I discuss the implications of what might be done to mitigate
welfare losses from temporary blackouts in Section 7.4 below.
3.4 Programming Market Regulations
While the focus of cable regulations has historically been on controlling prices charged by cable
providers, there has been recent interest in the organization and operation of the programming
(input) market. The basic features of this market are as follows.16 Most network production costs
are fixed. Rights sales generate both transfer payments (“affiliate fees”) from MVPDs, typically in
the form of a payment per subscriber per month, and advertising revenue. The relative importance
of each varies by network, but across cable programming networks 40% of revenue comes from
advertising (NCTA (2005a)). Programming is non-rivalrous: sales of programming to one MVPD
does not reduce the supply available to others.
Carriage agreements are negotiated on a bilateral basis between a network (or network groups)
and an individual system or system groups, also known as Multiple System Operators (MSOs).
Comcast is the largest MSO in the United States with 22.8 million subscribers, or 22.6% of the
MVPD market (Table 6). Many of the largest MVPD operators either own or have ownership
interests in programming networks as do major broadcast networks. Indeed, all of the top 20 (non-
CSPAN) cable networks by subscriber reach and all of the top 15 by ratings are owned by one of
8 firms, raising concerns about diversity in the media marketplace.17
The 1992 Cable Act introduced two important regulations regarding competition in the program-
ming market. First, it directed the FCC to establish reasonable limits on the number of subscribers
a cable operator may serve (the horizontal, or subscriber, limit) as well as the number of channels
a cable operator may devote to affiliated program networks (the vertical, or channel occupancy,
limit) (FCC (2005d)). These were set in 1993 at 30% of cable subscribers for the horizontal limit
and 40% of channel capacity (up to capacities of 75) for the vertical limit.18 In the Time Warner II
decision in 2001, the U.S. Court of Appeals for the D.C. Circuit reversed and remanded these rules,
finding the FCC had not provided a sufficient rationale for their implementation. A subsequent
2007 rule that reinstated the limits was dismissed in 2009 as “arbitrary and capricious.”
The 1992 Cable Act also introduced program access and carriage rules. These forbid affiliated
9

MVPDs and networks from discriminating against unaffiliated rivals in either the programming or
distribution markets and also ruled out exclusive agreements between cable operators and their affil-
iated networks. These rules were enforced through a complaint process at the FCC, but complaints
had been relatively rare, particularly in the recent 10 years.
The program access rules were required in the ’92 Cable Act to be evaluated on a rolling 5-year
basis. In October of 2012, the FCC permitted them to lapse, replacing them with rules giving
the Commission the right to review any programming agreement for anti-competitive effects on
a case-by-case basis. Until 2010, the program access rules also only applied to satellite-delivered
programming (the so-called “terrestrial loophole”). This was important, as for a few regional mar-
kets, including Philadelphia, San Diego, and parts of the Southeast US, some regional networks
distributed via microwave, including Regional Sports Networks (RSNs), reached exclusive agree-
ments with their affiliated MSO, excluding rival MVPDs from access to “critical” content (FCC
(2005d)). The new case-by-case rules include a (rebuttable) presumption that exclusive deals with
RSNs are unfair.
3.5 Merger Review
Under the 1934 Communications Act, the FCC’s mandate is to ensure that the organization of
communications and media markets serves the “public interest, convenience, and necessity”. This
mandate has been interpreted by the FCC to give it the power to approve or deny mergers among
communications or media firms whenever it involves a transfer of licenses. Since the licenses involved
are necessary to offer the firms’ services,19 in practice this gives the commission the power to approve
all media or communications merger.20 Prior to the passage of the 1996 Telecommunications Act,
this power wasn’t exercised as existing regulations on ownership (e.g. ownership limits, cross-
ownership restrictions) foreclosed large communications and media mergers. Since then, however,
the commission has taken an ever stronger role in approving communications and media mergers,
often imposing conditions on the merged entity.
Merger conditions, while not explicit regulations, have the same effect on firms. Recent examples
of conditions placed on merging parties cover a variety of alleged harms. In the Comcast-AT&T
merger completed in November of 2002, the commission ordered the merged firm to divest itself
of its interests in Time Warner Cable.21 In the News Corp-DirecTV and Adelphia-Time Warner-
Comcast mergers completed in December of 2003 and July of 2006, respectively, the commission
imposed a number of conditions, backed by a binding arbitration process, designed to ensure non-
discriminatory access to the combined firms regional sports and broadcast programming networks
(Kirkpatrick (2003)). Finally, in the recent Comcast-NBC/Universal merger approved in January,
2011, the Commission imposed a number of conditions over a 7-year period, including program
10

access-like rules for newly integrated content, a non-discrimination condition in online video (and
the removal of management rights in Hulu, an OVD), and a “neighborhooding” condition for
channel placement of news programming.
3.6 Other Cable Regulations
Cable systems are subject to a myriad of additional regulations (FCC (2000b)). A few of these are
briefly discussed here.
Broadband Access Regulation The market for high-speed (broadband) Internet access has
grown considerably in the last 10 years and is now an important source of revenue for most ma-
jor cable systems. It has also caused a regulatory fight between cable systems, Internet Service
Providers (ISPs), and local telephone providers over the appropriate regulatory treatment of broad-
band access. As low-speed (“dial-up”) access only required access to a local telephone line, ISPs
like AOL and Earthlink grew in the late 1990s without regulatory oversight. As broadband access
became viable, however, telephone companies were required to share access to their broadband
(Digital Subscriber Line, or DSL) network with unaffiliated rivals.
In FCC (2000c), the FCC ruled that cable broadband service was an “information service” and not
a “telecommunications service” subject to common carrier (i.e. access) regulation. In June of 2005,
the Supreme Court upheld this decision (Schatz, Drucker, and Searcy (2005)). In August of 2005,
a similar set of rules was put in place for DSL providers (Schatz (2005)). Going forward, DSL and
cable will compete on near-equal terms and neither will be required to share access with unaffiliated
rivals. This policy is in marked contrast to wholesale broadband access policies implemented in
many other developed countries.
Cable/Telco Cross-Ownership and Telephone Company Entry The 1984 Cable Act forbid
Local Exchange Carriers (LECs) from providing cable service within their telephone service areas.
The 1996 Telecommunications Act relaxed this restriction, providing a number of methods under
which telephone companies could provide video service, including building a wireline cable system
(FCC (2000b, p.17)).22 Early efforts at video entry were small in scale and often unprofitable. The
largest effort was put forth by Ameritech (now owned by AT&T), which purchased and built cable
systems that passed almost two million homes. They were only able to attract 225,000 subscribers,
however, and exited the business in 1998 (FCC (2004b)).
Each of the three extant LECs (AT&T, CenturyLink, and Verizon) now offer video programming in
some form. CenturyLink largely resells DirecTV satellite services bundled with their own telephone
and broadband services. Verizon and AT&T, instead, invested billions upgrading their networks to
11
provide television service in direct competition with cable and satellite companies.23 Table 6 shows
both have been successful: they are now the 7th and 9th largest MVPDs with a total national
market share of 6.5%.
An important determinant of the success of LEC entry is the ease with which they can obtain
agreements to provide video service with local franchise authorities (LFAs). LECs have complained
that the franchising process is an important barrier to entry in cable markets. For example, Verizon
estimated it would have to obtain agreements with almost 10,000 municipalities if it wished to
provide video programming throughout its service area and that LFAs (backed by incumbent cable
operators) took too long and required too many concessions (FCC (2005c)).24 In September 2005,
Texas passed a law introducing a simplified statewide franchising process, something CenturyLink
is encouraging in a number of other states. In 2007, the FCC also adopted rules that limited cities’
abilities to regulate or slow telco entry, a decision upheld by the courts in 2008.
3.7 Satellite Regulations
Federal regulation of the satellite television industry has also influenced the cable television indus-
try. While satellite distribution of programming was initially intended for retransmission by cable
systems, a small consumer market also developed. By the mid-1980s, approximately 3 million
households had purchased C-Band (12-foot) satellite dishes, mostly in rural areas without access
to cable service.
It wasn’t until the mid-1990s, however, that direct satellite service to households thrived. Fueled by
the complementary developments of improved compression technology, more powerful satellites, and
smaller (18-inch) satellite dishes, Hughes introduced DirecTV in 1993. Subscriptions grew quickly,
particularly among the estimated 20 million households without access to cable service. Wider
adoption was hindered, however, by a regulatory hurdle: in an effort to protect local television
stations, satellite systems were only permitted to provide broadcast network programming if the
household could not receive the local broadcast signal over-the-air. This hurdle was removed,
however, with the passage on November 28, 1999 of the Satellite Home Viewer Improvement Act
(SHVIA). This permitted direct-broadcast satellite providers to distribute local broadcast signals
within local television markets. Within a year, satellite providers were doing so in the top 50-60
television markets. Satellite systems now provide a set of services comparable to those offered by
cable systems for the vast majority of U.S. households.25
Unlike cable systems, satellite providers have never been subject to price regulations. Most other
rules described above for cable service apply equally to satellite providers, however. For example,
since January 1, 2002, satellite providers that distribute local signals must follow a “carry-one,
carry-all” approach similar to Must-Carry and must negotiate carriage agreements with local tele-
12

vision stations under Retransmission Consent (FCC (2005b)). Furthermore, under the conditions
put in place in the News Corp-DirecTV merger, the combined firm is subject to the same rules
governing competition in the programming market.26
4 The Consequences of Cable Regulation and Deregulation
The cable industry has undergone several recent periods of regulation and deregulation. This has
provided an ample record to evaluate the consequences of cable regulations. In this section I present
broad trends in economic outcomes in the industry. In the next section I evaluate the theoretical
and empirical evidence of the consequence of regulation on those outcomes.
4.1 The Facts to be Explained
Prices Figure 4 reports price indices from the Consumer Price Index (CPI) from December, 1983
until November, 2012. Reported are series for (i) MVPD (i.e. cable + satellite) services and (ii)
consumer non-durables.27
Insert Figure 4 Here
Four distinct periods are clear in the figure and are described in Table 1 below. Reported in
the table is the compound annual growth rate for each price index corresponding to periods of
cable regulation and deregulation (1st three periods) and telco entry into the video market (last
period). The first period describes price increases following the passage of the 1984 Cable Act.
Price deregulation from the 1984 Act begins in December 1986 and continues until April 1993,
when the first price caps from the 1992 Cable Act were implemented. The second period begins
at that point and continues until the passage of the “Going Forward” rules relaxing price caps
in November 1994. The third period starts at that point and continues to the end of 2005, the
(effective) time of telco entry into video markets. The last period begins then and continues to the
present.
Insert Table 1 Here
From these price series, regulation (deregulation) is associated with positive (negative) relative cable
price growth . Prices in the period preceding the 1992 Cable Act increased at an annual growth rate
of 4.61% greater than that for other consumer non-durables. Similarly, prices after the relaxation
of the ’92 regulation have increased at a rate 2.57% greater than that of non-durables, while prices
13

during the (short) regulatory period fell 3.45% relative to non-durables. Telco competition also
appears to matter: prices in the last period are slightly less than those for non-durables over the
period.
Subscriptions Did lower prices lead to more subscriptions? Figure 5 reports aggregate sub-
scribers to MVPD (cable, satellite, and telco) services by year between 1983 and 2010. Unfortu-
nately, this data is only at the annual level, making precise predictions of the impacts of short
regulatory periods difficult. Nonetheless, I duplicate the table on growth rates for prices both for
cable subscribers and all MVPD subscribers and report these in Table 2.
Insert Figure 5 Here
There are three interesting features of the data in Table 2. First, cable subscriber growth is positive
throughout all periods but the last, including periods when prices were rising. While many features
of the economic environment are also changing over this period, one plausible explanation for this
relationship is that the quality of cable services has been increasing over time. I provide some rough
measures of cable quality in what follows. Second, despite lower prices between 1993 and 1995,
cable subscriber growth is lower than during the previous, deregulatory, period. This suggests
regulation may itself have had an impact on cable quality. Third, note the dramatic reduction in
cable subscriber growth after 1995. While a normal feature of a market that is reaching saturation,
this also reflects the growth in satellite and telco operators as viable competitors to cable systems:
total MVPD subscriber growth, while not at pre-1995 levels, is still substantial, despite reaching
aggregate penetration rates almost 90% of U.S. households by 2010.
Insert Table 2 Here
Quality Both the price and subscription data suggest that accounting for the quality of cable
service is important for understanding outcomes in cable markets. Measuring the quality of cable
services can, however, be very challenging. Various approaches have been taken in the economic
literature, from using simple network counts (Rubinovitz (1993), Crandall and Furchtgott-Roth
(1996), Emmons and Prager (1997)) to a mix of indicators for specific networks (e.g. ESPN, CNN,
MTV) and network counts (Crawford (2000)) to imputing it from observed prices and market shares
under the assumption of optimal quality choice (Crawford and Shum (2007)). Since channels are
clearly very different in their value to consumers, it is perhaps best to enumerate them if the data
allow it. Crawford and Yurukoglu (2012) do this for over 50 individual cable networks in their
recent work analyzing the welfare effects of a la carte policies.
14

Figures 6 and 7 provide two rough measures of cable service quality over time. The first, Figure
6, reports the number of programming networks available for carriage on cable systems as well
as (from 1996) the average number of Basic, Expanded Basic, and Digital Tier networks actually
offered to households. Both the number of networks available to systems and those actually offered
by systems has increased considerably over time. This is particularly true in the periods 1978-1988
and 1994-present.28
Insert Figure 6 Here
The number of cable networks is, however, an incomplete measure of cable service quality. The value
of programming on ESPN today is significantly greater than it was in 1985. This increase in the
value in programming can partially be measured by the cost to cable systems for that programming.
Figure 7 describes the average cost to cable systems of program networks from 1989-2003(as well
as duplicating the average number of networks on Basic and Digital Tiers from Figure 6). The
top-most, solid, lines in the figure use the left-hand axis and report the total per-subscriber cost
for networks charging affiliate fees according to Kagan World Media (Kagan World Media (1998),
Kagan World Media (2004)). The left half of this series is a list (“top-of-rate-card”) price, while the
right half is an average (across systems) price. One can compare the pattern of these prices with
the average number networks over the same period, represented by the dashed line and using the
right-hand axis. The trend in total costs roughly matches the trend in number of networks. This
might be expected if network costs were constant over time. They are not, however. The bottom,
dotted, lines report the total per-subscriber cost for networks charging affiliate fees conditioning on
the networks charging positive fees in 1989. This isolates the increase in cost to cable systems from
increased quality for a given set of programming networks.29 Together, these series show that costs
to cable systems have been increasing over time due both to increased costs for existing networks
as well as increases in the number of offered networks.
Insert Figure 7 Here
Services A final feature of cable service that has evolved considerably over the last 20 years is
the number of services from which households can choose. Cable television technology is such that
all signals are transmitted to every household served by a system. As such, the least cost method
of providing any cable service is to bundle all the programming. Early cable systems did just
that. The development of Premium networks in the early 1980s, however, necessitated excluding
households that chose not to subscribe. This was costly, requiring a service technician go to each
household and physically block programming with an electromechanical “trap”. The development
of scrambling (encryption) technology in the 1980s and 1990s solved that problem but instead
15
required households interested in such programming to have an “addressable converter” (set-top
box) to unscramble the video signal. Subscribers and subscriptions to Premium Networks grew (cf.
Figure 8).30
Insert Figure 8 Here
Addressable converters also allowed cable systems to unbundle some of their Basic networks. As
discussed earlier, these were called Expanded Basic Services (or Tiers). There was some concern
in the late 1980s and early 1990s that cable systems were introducing tiers in order to evade rate
regulation in the pre-1986 and post-1992 periods.31 These concerns have waned since the passage of
the 1996 Telecommunications Act. Where offered, the vast majority of households choose at least
one Expanded Basic service, a digital service, broadband (cable modem) access to the Internet,
and/or telephone service from their cable operator. Table 3 describes the recent evolution of these
advanced service offerings.
Insert Table 3 Here
The growing popularity of digital tiers (and associated digital converters) has led some consumer
advocates to call for cable systems to unbundle some or all networks and offer them to consumers
on an a la carte basis (Consumers Union (2003)). I discuss this important policy issue in Section
7.2.
5 The Consequences of Cable Regulation
The challenge in interpreting these trends in the cable data are two. First, how much of the increase
in cable prices is due to increases in cable market power and how much is due to increases in the
quality of cable services? And to what extent has regulation limited the exercise of cable market
power or distorted the incentives to offer quality? Second, even if systems have market power, if
this gives rise to the incentives to increase product quality over time, consumers may benefit despite
the welfare losses from that power. How have consumers valued changes in the portfolio of cable
services? How has regulation influenced these choices? I evaluate the theoretical and empirical
evidence on these questions in what follows.
5.1 Theoretical Models of Price and Quality Choice under Regulation
Most theory of optimal regulation focuses on products of a given quality or qualities (Breautigam
(1989), Armstrong and Sappington (2007)). While there are difficult implementation issues in
16
this case, including how best to accommodate informational asymmetries between the firm and
regulator and how best to accommodate changes in the economic environment facing the regulated
firm over time, the conclusions of the theory are straightforward: regulation can limit the exercise
of market power by limiting the prices firms can charge.
The problem is more challenging, however, when firms can also choose product qualities. In what
follows, I briefly survey the theoretical literature on price and quality choice with and without
regulation for single- and multi-product monopolists. Focusing on monopoly is in part for conve-
nience, as that is the focus of much of the economic literature, but it is also largely appropriate
for the cable television industry.32 That being said, I provide insights from oligopoly models where
possible.
Price, quality, and regulation for single-product monopolists Assessing the influence of
regulation on price and quality choice is relatively straightforward for single-product monopolists.
An unregulated single-product monopolist may under- or over-provide quality depending on the
nature of consumer preferences and firm costs (Spence (1975)). The key factors are two: whether
households that highly value quality value more highly or lowly increments to quality and the extent
of quantity reduction (relative to a social planner) due to market power over price. These depend on
the specific features of the market under study and empirical estimates of their relative importance
are few.33. A single-product monopolist facing price-cap regulation, however, will generally under-
provide quality as it must bear the costs of any quality improvements and may not be able to
increase price to recoup those costs (Brennan (1989)). It is the norm, therefore, to accompany
price-cap regulation with mechanisms that monitor and penalize firms for adverse product quality
(Armstrong and Sappington (2007)).
Price, quality, and regulation for multi-product monopolists Assessing the influence of
regulation on price and quality choice is more complicated for the more realistic case of multi-
product monopolists. The seminal paper on price and quality choice without regulation is Mussa
and Rosen (1978) (MR). They show that products offered by unregulated multi-product monopolists
are, under reasonable conditions, subject to quality degradation: offered qualities are below the
efficient level for all consumers except those with the highest tastes for quality.
The intuition for multiproduct monopoly quality degradation can be understood in a simple example
with two types of consumers and a monopolist offering two goods. Let the consumer that values
more highly product quality be called the high type. The monopolist would like to sell products
to each consumer type at a quality and price that maximizes his profits. Since there are only two
consumers, he only needs two products. In a perfect world, he would choose the quality for the
high-type product at just that point where the additional revenue he could get from the high type
17

to pay for a slightly higher quality would equal the additional cost he would have to pay to produce
that slightly higher quality (and similarly for the low type). Consumers would be left with nothing
(as each would be paying their maximum willingness-to-pay) and the monopolist would earn all
the surplus that was available in the market.
Unfortunately, the monopolist’s first-best price-quality portfolio isn’t incentive-compatible: con-
sumers won’t go along. Under reasonable assumptions on preferences and costs, the high type
would earn some surplus consuming the low-quality product (and paying less). The monopolist re-
alizes this in advance, however, and therefore chooses a second-best pair of prices and qualities. This
second best sweetens the deal for the high type in two ways. First, it keeps her quality the same,
but lowers its price, making the high-quality product more attractive to the high type. Second,
it degrades the quality of the low-quality product (also lowering its price), making the low-quality
product less attractive to the high type. Quality degradation is costly, however: lowering quality
lowers what the low type is willing to pay by more than the reduction in cost to the monopolist.
Quality degradation therefore continues until the monopolist’s profit losses on low types exactly
matches their profit gain on high types (driven by the higher price it can charge them without
causing them to switch to the low-quality product).34
In a pair of papers, Besanko, Donnenfeld, and White (1987, 1988) (BDW) extend the Mussa-
Rosen model to consider a monopolist’s quality choice problem in the presence of regulation. They
consider three forms of regulation – Minimum Quality Standards (MQS), Maximum Price (Price-
Cap) Regulation, and Rate of Return Regulation – the second of which is most relevant in cable
markets. They show that setting a price cap has an important effect on the monopolist’s offered
qualities. Relative to the quality offered by an unregulated firm, the presence of a price-cap lowers
quality for the high-quality good. The intuition is straightforward: with a price cap, the firm
cannot charge as much as it would like for a good of the efficient quality. Since it can’t raise prices,
it simply reduces quality until the price cap is the optimal price to charge.35 Do consumers benefit?
Besanko, Donnenfeld, and White (1988) show that they can for small reductions in prices, but both
consumer and total welfare can fall if caps are set too low.
Implications for Cable Television Markets Are these results likely to apply in cable television
markets? I argue they are, at least for Basic and Expanded Basic Services.36 Cable price regulations
before 1984 were governed by agreements negotiated between cable systems and the local franchise
authority. While the theory may apply in those settings, it would depend on the specific terms of
those agreements. Generalizing about the many and heterogeneous forms of local price regulation
in place at that time is therefore difficult.
Price regulations implemented after the 1992 Act, however, map fairly well to the theory; only a
few features of the actual regulations differed from the assumptions described above. In particular,
18
while the theory assumes only the high-quality good is subject to price caps, prices for all Basic
and Expanded Basic (so-called Cable Programming) Services were subject to regulation under the
’92 Act. That being said, most systems in the mid-1990s either offered a single Basic Service or,
if offering multiple Expanded Basic Services, earned the majority of their Basic Revenue from the
highest-quality service(s), making the effect of the regulations on those services the practically
most relevant ones.37 Furthermore, while the theory describes price caps in levels, prices in cable
markets were regulated on a per-channel basis. If anything, however, this made it easier for systems
to adjust their (per-channel) product quality by allowing them to add relatively low-value networks
rather than dropping networks as would have been necessary to come under a fixed cap.
Why then didn’t regulators also regulate product quality, as in telecommunications, electricity,
and other regulated product markets? In cable markets they cannot. The primary components of
product quality for cable television services are the television networks included on those services.38
By the First Amendment, cable systems have freedom of expression and regulators cannot therefore
mandate what networks to carry (or not).
What then can one conclude from the theory as applied to cable television markets? While the
specifics of regulatory interventions matter, the theory strongly advises against the use of price caps
in markets, like cable, where quality cannot be regulated and is easily changed by firms. While
prices may fall, so too will quality. Furthermore, market power may be unaffected: the regulated
price is likely to move toward the optimal monopoly price for the (now-lower) quality. Worse, unless
caps are set well across markets and time - and how can regulators know? - consumers and firms
can both be worse off.
5.2 Econometric Studies of the Effects of Regulation
Does empirical research confirm these findings? How much of the increase in cable prices is due
to the exercise of cable market power and how much is due to increases in the quality of cable
services? And what effect has regulation had?
5.2.1 Research Using Time Series Data
A number of studies have broached these questions using time series data. Jaffe and Kanter (1990)
and Prager (1992) analyze the impact of the 1984 Cable Act on outcomes in financial markets to
infer it’s effects on cable system market power.39 Jaffe and Kanter (1990) analyze the impact of
the 1984 Cable Act on the sales price of cable franchises exchanged between 1982 and 1987 and
find important compositional effects: while sales prices appear unchanged in the top 100 television
markets (where competition between cable and broadcast markets was stronger), they find large and
19

significantly positive effects outside of these markets. This suggests that, with the relaxation of price
regulations, cable systems were expected to be able to exercise market power where competition
was weak and that this expectation translated into higher sales prices for franchises. Prager (1992)
analyzes the impact of news events associated with the 1984 Cable Act on stock prices for 10 publicly
traded cable television companies between 1981 and 1988. She finds no evidence of an increase in
stock prices at the time the Act was passed, but does find that cable stocks outperformed the market
ex post, i.e. in the years after the rate deregulation was actually implemented. Such unanticipated
changes are consistent either with widespread uncertainty about the likely effects of deregulation or
with an actual increase in market power due to increased quality of and demand for cable services
(possibly themselves influenced by deregulation).
Hazlett and Spitzer (1997) use aggregate time-series data to analyze the impacts of both the 1984
and 1992 Cable Acts. In addition to surveying the economic literature at that time, they analyze
a host of outcome measures, including prices, penetration (subscriptions), cash flows, tiering, and
quality (as measured by the number of networks, their expenditure on programming, and their
viewing shares), and reach three main conclusions. First, price increases after the 1984 Cable Act
and price decreases after the 1992 Cable Act were associated with similar changes in cable service
quality. Second, (monthly) subscription data suggest that price deregulation did not decrease
subscriptions and price regulation did not increase them. Finally, systems appeared to evade price
regulation by introducing new Expanded Basic tiers and moving popular programming to those
tiers.40 Similar patterns are apparent in the aggregate data presented in the last section.
There are several difficulties drawing firm conclusions about the impact of regulation using aggre-
gate time series data, however. First, it is often difficult to control for all changes in the economic
environment other than the change in regulation (e.g. aggregate sectoral, demographic, and/or
macroeconomic trends). Furthermore, a lack of observations often limits the ability to draw strong
statistical inferences. The majority of studies analyzing questions of cable market power and the
impact of regulation have therefore used disaggregate cross-section data.
5.2.2 Research Using Disaggregate Cross-Section Data
Reduced Form Approaches Early empirical work using cross-section data tested the joint
hypothesis that cable systems had market power and that regulation reduced their ability to exercise
that power. Most authors used a reduced-form approach, regressing cable prices (or other outcome
variables) across markets on indicators of the presence and strength of regulatory control. The
evidence from these papers is generally mixed. For example, Zupan (1989a) analyzes data on a
cross-section of 66 cable systems in 1984 and finds prices are $3.82 per month lower in regulated
markets. Prager (1990), however, analyzes a sample of 221 communities in 1984 finds the opposite
20

result: rate regulation is associated with both more frequent and larger rate increases. Similarly,
Beutel (1990) analyzes the franchise award process in 27 cities between 1979 and 1981 and finds that
franchises were generally awarded to systems that promised to charge higher prices per channel.41
Possible reasons for this literature’s lack of consistent results include an inability to (accurately)
account for cable service quality when evaluating price effects and the likely endogeneity of the
regulation decision within local cable markets. The decision to regulate prices for local cable
service (when permitted) likely depends on observed and unobserved features of the cable system,
market, and household tastes for cable service and regulation. Ideally one would instrument for
the decision to regulate, but finding factors that influence the presence or strength of regulation
but don’t influence prices can be quite challenging.42
A Framework for Measuring Market Power More recent empirical research has taken a
different approach to measuring cable market power and the impact of regulation. Following Bres-
nahan (1987), an empirical literature within the field of Industrial Organization has developed that
provides a set of empirical tools to measure market power using explicit models of firm behavior and
observations on firms’ prices and quantities (or market shares).43 Furthermore, this framework can
also measure changes in quality and the impact of regulation on firm behavior. I briefly introduce
this framework and then survey existing research applying it in cable television markets.
Consider a cross-section of markets each occupied by a single firm selling a single product of fixed
quality.44 Let aggregate demand in each market be given by Qn = D(pn, yn), where Qn is quantity
demanded in market n, pn is price of the good in market n, and yn are variables that shift demand
across markets (e.g. income, other household characteristics, etc.). As each firm is a single-product
monopolist, optimal prices in market n are given by:
pn = cn −
Qn
∂D(pn, yn)/∂pn(1)
where cn is the marginal cost of the good in market n. This equation shows that prices in market
n equal marginal costs plus a markup. Rearranging terms yields the familiar Lerner Index, (pn −
cn)/pn = 1/ǫDn where ǫDn is the (absolute value of the) price-elasticity of demand in market n.
The Lerner Index shows that price-cost margins (equivalently, markups) are higher the lower the
absolute value of the elasticity of demand facing the firm.
If we could observe marginal costs, cn, and demand, D(pn, yn), we could simply calculate the
markup in each market. Firms facing more inelastic demand would have greater markups and thus
more market power. In practice, however, we don’t observe either. To infer market power, we must
estimate them.
Assuming the data provides sufficient variation and good instruments for prices, estimating demand
21

is a straightforward proposition.45 Estimating marginal costs is more difficult. Rather than obtain
hard-to-find cost data, the typical solution is to make an assumption about how marginal costs
vary with observables (e.g. cost factors, quantity) and estimate them based on their influence on
observed prices in (1).46 If these issues can be overcome, it is possible to estimate the market power
facing firms across markets and/or time.
Suppose now that the firm in market n is regulated. The extent to which this constrains its pricing
can be parameterized as follows.
pn = cn − θQn
∂D(pn, yn)/∂pn(2)
Here θ measures the extent to which prices exceed marginal costs in market n. If demand and
marginal costs can be estimated, one can use (exogenous) variation in demand to estimate θ by
examining how much prices exceed marginal costs across markets with differing elasticities of de-
mand.47 If regulation is constraining firm behavior, prices will be close to marginal costs even if
demand is inelastic (i.e. θ ≈ 0). If not, prices will be close to the monopoly markup (i.e. θ ≈ 1).
Quality change is also easy to accommodate, at least in principle. Let qn measure the quality of
the product in market n. If we now parameterize demand by Qn = D(pn, yn, qn), prices are given
by
pn = cn − θQn
∂D(pn, yn, qn)/∂pn(3)
If quality is higher in some market (or time period), demand will increase and/or become more
inelastic, increasing prices. Separating the influence of quality change and market power is simply
then a matter of assessing the relative strength of qn and θ on prices.48
Measuring Market Power and the Effects of Regulation in Cable Markets Two papers
apply the framework above to measure the impact of regulation on pricing in cable markets.49 First,
Mayo and Otsuka (1991) estimate demand and pricing equations for Basic and Premium services
using data from a cross-section of over 1,200 cable markets in 1982. Regulation at this time
was determined by terms of local (municipal or state) franchise agreements and varied across the
markets in the study. Across all systems (regulated or not), θ is estimated at 0.097 (0.021). While
significantly different from 0, the relatively small value suggests regulation significantly constrained
system pricing.50
Second, Rubinovitz (1993) estimates demand, pricing, and quality (number of channels) equations
for Basic cable services using data from a panel of over 250 cable systems in both a regulated
period (1984) and an unregulated period (1990). In the raw data, prices are 42% higher in the
latter period, but satellite channels have more than doubled and subscriptions are more than 50%
22
greater. For reasons of idiosyncratic model specification, the absolute level of θ cannot be identified
in each period, but differences in θ can. This he finds to be 0.18 (0.08), implying that, controlling for
increased costs due to expanded channel offerings, the increased exercise of market power increased
prices by 18%, or .18/.42 = 43% of the observed price change. He concludes both increased quality
and increased market power were responsible for deregulated price increases.
Almost all the studies surveyed to date focus on the impact of regulation on prices. But what of
quality? The aggregate data in Section 4.1 suggest understanding regulation’s impact on quality is
critical to understanding outcomes in cable markets. In a recent paper, Crawford and Shum (2007)
extend the market power framework to assess the impact of regulation on both prices and quality
in cable markets. Rather than use observed measures of service quality (e.g. number of offered
networks), they use data from a cross-section of 1,042 cable markets in 1995 to estimate preferences
and costs and then use the implication of the optimal price and quality choice to infer the level
of offered quality in each cable market. An example provides the intuition for their procedure.
Suppose the cable systems in two markets had identical market shares for each of two offered
services, but the price of the high-quality service was higher in the first market. The higher price
in the first market suggests households are willing to pay more for cable service quality in that
market (perhaps because mean household age or household size is larger in that market).51 By
making high types more profitable, this tightens the incentive compatibility constraint for those
types, increasing the incentive to degrade quality for low types. Thus even if prices are similar in
the two markets, offered quality (under the theory) must be lower in the first.
After inferring the quality of each offered service in each cable market, the authors relate these
quality measures to indicators of whether the cable market had certified with the FCC to regulate
Basic Service under the terms of the 1992 Cable Act. They find that quality for high-quality
goods is somewhat higher, that quality for low- and medium-quality goods is substantially higher,
and that quality per dollar for all goods is higher in regulated markets (despite higher prices).
Interestingly, these effects are consistent with BDW’s theoretical predictions of minimum quality
standards and not price-cap regulation.52
Measuring the Consumer Benefits of Regulation The previous studies focus on the impact
of regulation on cable prices and quality. This relies on a static view of cable markets and focuses
on the short-run losses from cable market power. A long-run view must acknowledge that monopoly
profits provide strong incentives for systems to invest in service quality if that enhances consumer
willingness-to-pay for cable services. Two studies estimate consumer demand for cable services and
ask about the welfare effects of (i.e. benefits to consumers from) cable price regulation.53
Crandall and Furchtgott-Roth (1996, Chapter 3) examine the welfare effects of changes arising
from the 1984 Cable Act. They estimate a multinomial logit demand model on 441 households
23

from 1992 and augment that with information about the cable service available to 279 of them in
1983. Despite the substantial increase in prices in this period (cf. Figure 4), they estimate that
households would be have had to be compensated by $5.47 per month in 1992 to face the choices
available to them in 1983.54
Crawford (2000) examines the welfare effects of changes arising from the 1992 Cable Act. He
also estimates a multinomial logit demand system on 344 cable systems from 1992 and 1995.55
Furthermore, he introduces a new approach for measuring service quality. Rather than simply
counting the number of networks offered by systems, he controls for the actual identities (among
the top-20 cable networks) of those networks (e.g. ESPN, CNN, and MTV). This turns out to be
important not only for accurate estimation of cable demand, but in valuing household welfare from
the Cable Act.56 He finds a welfare gain of at most $0.03 per subscriber per month. The lack of
effect is not due to quality reductions in response to price caps, but the simple fact that, in his
data, prices increased despite the regulations.
5.2.3 Conclusions
The accumulated evidence is not encouraging for proponents of regulation in cable markets. Re-
search based on time-series data suggest that while prices briefly declined after the 1992 Cable Act,
so too may have product quality. Detailed econometric studies based on disaggregate cross-section
data provide mixed evidence. Some find that regulation lowers cable prices from monopoly levels,
while others find negligible effects. Evidence of the impact of regulation on quality is positive,
although further research is necessary, and evidence on consumer welfare effects of changes in cable
choice sets is, if anything, in favor of deregulation.
6 The Rise of Competition in Cable Markets and Its Effects
The rise of competition from satellite and telephone company providers has dramatically changed
the cable marketplace. Whereas for 40 years the vast majority of households faced a local cable
monopolist, most households now have the option of three or more MVPD providers. This section
addresses the impact on cable prices and services of competition in the distribution market.
6.1 Duopoly (“Overbuilt”) Cable Markets
There is considerable evidence that cable prices are lower when there are two wireline competitors
in a market. Hazlett (1986a) finds that cable prices are $1.82 lower in duopoly relative to monopoly
cable markets. Levin and Meisel (1991) analyze a cross-section of 47 cable systems in 1990 and find
24

that, controlling for the number of programming networks offered, cable prices are between $2.94
and $3.33 per month less in competitive relative to non-competitive cable markets. Emmons and
Prager (1997), using data on a cross-section of 319 cable markets in 1983 and 1989, obtain similar
results: prices for incumbents that face competition from another cable system are an estimated
20.1% lower in 1983 and 20.5% lower in 1989.57
More recent data suggests a similar pattern. Using data from the ten most recent FCC reports on
cable industry prices, Table 4 reports the average price, number of channels, and price per channel
for cable systems defined by the FCC as noncompetitive, facing a wireline competitor, and facing
satellite competition.58 The upper panel of the table presents the raw data, while the lower panel
presents the percentage difference between noncompetitive systems and systems facing either a
wireline or satellite competitor.
Insert Table 4 Here
The last row in the first set of columns in the table shows that, on average between 2001 and 2011,
prices for systems facing wireline competition were 7.8% lower than for non-competitive systems.
Definitive conclusions about causality are difficult, however, due to selection problems. Entry by a
competitor is not exogenous to the price charged by an incumbent cable system or the characteristics
of the entertainment market. If new firms entered into markets where incumbent cable systems
charged high prices, the table likely under-estimates the true effect of wireline competition on
prices. Similarly, as most wireline competition occurred in large urban markets and these have
more substitutes to cable, the table may over-estimate the true effect. Accurately controlling for
differences in economic conditions across markets and the endogeneity of entry is required in order
to make stronger conclusions from such data.
The last row in Table 4 also reports the correlation between wireline competition and cable service
quality, as measured by the number of Basic and Expanded Basic channels, as well as the price
per channel, a useful competitive benchmark. Keeping in mind the same concerns about selection,
the data demonstrates that, on average between 2001 and 2011, wireline competitors offered 6.2%
more Basic and Expanded Basic channels and charged 12.9% less on a per-channel basis. Further
analysis of recent price and quality data that both analyzed the effects of recent telco entry and
controlled for the potential endogeneity of this entry would be welcome.
6.2 Competition between Cable and Satellite
The problem with duopoly cable markets is that they are rare, accounting for only 1-2% of all
cable markets before the entry of telco operators (FCC (2005b, Footnote 627)). From a policy
25

perspective, it is much more important therefore to assess the impact of satellite competition on
cable prices and quality.
Table 5 reports trends in cable, satellite, and telco subscribers and their respective share of the
MVPD market. Satellite subscriptions grew very quickly, even before 1999 when SHVIA allowed
satellite providers to distribute local broadcast channels. So too have telco subscriptions since their
entry into the market in 2006. The net effects of satellite and telco subscriber growth has been
to first slow and then reverse cable industry subscriber growth. Cable systems in 2010 had fewer
subscribers than at any time since 1995.
Insert Table 5 Here
Table 4 also provides some evidence on the correlation between satellite competition and cable
prices and service quality. Turning to the third set of columns in each group, the table reports
average prices, number of channels, and price per channel for cable systems who have been granted
a finding of effective competition due to facing at least two satellite competitors whose total market
share exceeds 15% of the MVPD market.59 The last line demonstrates that, on average between
2001 and 2011, cable markets facing DBS competition (as defined by the FCC) paid approximately
the same prices, were offered approximately the same quality, and therefore had approximately the
same price per channel.
Given the keen interest in the role of satellite competition, Congress commissioned the General
Accounting Office to conduct several studies of satellite’s impact on cable prices and product
offerings (GAO (2000), GAO (2003)). The early study, using 1998 data, found a positive and
significant impact of increased satellite market share on a cable incumbent’s prices, while the latter
study, using 2001 data, found a negative and significant (though economically small) impact.
So where is the benefit of satellite competition? A fundamental problem in such studies (as in
Table 4) is that the correlation between cable prices on satellite market shares may not be driven
by a causal relationship, but by correlated unobservables. If tastes for video programming differ
across markets, both satellite market shares and cable prices will be higher in markets with greater
tastes for programming, causing an upward bias on the effect of satellite shares on cable prices.
Similarly, if offered cable qualities are (unobservably) higher in markets with high satellite shares,
as for example if cable systems improve service quality in the face of satellite competition, a similar
effect will arise. One solution is to instrument for satellite market shares in a regression of cable
prices on satellite shares, but that can be difficult if instruments are hard to find.60
In a widely cited study, Goolsbee and Petrin (2004) suggest a solution to this problem. First,
they estimate a multinomial probit demand system for Expanded Basic, Premium, and satellite
services from a sample of roughly 30,000 households in 317 television markets in early 2001. Using
26

a system’s franchise fee as their primary price instrument, they find own-price elasticities of -1.5
for Expanded Basic, -3.2 for Premium, and -2.4 for satellite along with quite plausible (and large)
cross-price elasticities.
As in previous studies, they regress cable prices on (a nonlinear transformation) of satellite market
shares.61 Unlike previous studies, however, they also include estimates of unobserved characteristics
and tastes for Expanded Basic and Premium cable services. By including composite measures of
cable service quality, this approach “takes the correlated unobservable out of the error” and allows
a consistent estimate of the impact of satellite share on cable prices.62
They find the effect to be both statistically and economically significant. Reducing satellite pene-
tration to the minimum observed in the data is associated with a $4.15 (15%) increase in the price
of cable services. They also find it is associated with a slight increase in the observed quality of
cable services.
In a recent paper, Chu (2010) digs more deeply into the effects of satellite competition, explicitly
modeling both price and quality competition and examining the heterogeneity in cable system
responses to satellite rivals. He finds that different cable operators respond differently to satellite
entry. Most systems lower prices and raise quality, but in some markets they increase both (and
in some markets decrease both). The total effect is consistent with widespread patterns in the
industry and similar to the effects of regulation found in Crawford and Shum (2007): prices are
slightly lower (and indeed higher in some markets), but quality is substantially higher.
So, has satellite competition “worked”? On this, the evidence is mixed. Chu shows that if one does
not permit cable and satellite operators to compete on quality, prices after satellite entry would
indeed have been lower for both. On the other hand, estimated cable system markups and profits
are only slightly (9%) less after satellite entry, and the consumer welfare benefits are concentrated:
while estimated consumers surplus increases by 32% on average, most of these benefits go to the
5% of the market that are satellite customers. Cable customers only benefit slightly.
6.3 Conclusions
Are (most) cable markets competitive? The evidence for wireline competition is encouraging, but its
narrow scope (pre-telco entry) has limited measured benefits to a small fraction of cable households
and lack of data (post-telco entry) renders conclusions impossible. While there is some evidence
of a positive impact of satellite competition on cable prices, the estimated cable price elasticities
suggest cable systems still exert considerable market power.63
Despite this, more large-scale entry appears unlikely. Further wireline entry means paying substan-
tial fixed costs and facing entrenched competitors.64 Wireless broadband entry may be a solution
27
in the long-run, but would require both major increases in electromagnetic spectrum and strong
competition from other, higher-value, uses of (potentially) mobile broadband.
How then to increase consumer welfare in cable markets? I hope my survey of the theoretical and
empirical literatures in the last section convincingly rules out price regulation as an option. Some
have proposed mandatory a la carte cable packages and/or competition from online video providers
as mechanisms to help consumers. I discuss the likely consequences of each of these, as well as
other open issues in MVPD markets, in the next section.
7 Open Issues in MVPD Markets
In this section, I consider four open issues in cable and satellite markets: horizontal concentra-
tion and vertical integration in programming markets, bundling, online video distribution, and
bargaining breakdowns.
7.1 The Programming Market
7.1.1 Horizontal Concentration and Market Power
An important economic issue in the programming market is that of market power. Cable systems
have evolved from small, locally-owned operations into major national corporations. Table 6, drawn
from FCC reports on the status of competition in the programming market, reports concentration
measures for the industry for several of the past 20 years.65
Insert Table 6 Here
As can be seen in the table, the sum of the market shares for the top 4, top 8, and top 25 MVPD
providers have all increased over time, with the top 4 MVPDs serving 68% of the market and the
top 8 serving 84% in 2010.
There are both pro- and anti-competitive effects that could arise from this increased concentration.
Increased firm size may yield economies of scale, greater facility developing and launching new
program networks, and lower costs for investing in and deploying new services like digital cable,
broadband Internet access, telephone service, and online video services. It may also, however,
increase market power in the programming market.
There have unfortunately been a number of false starts regarding the appropriate analytical frame-
work for analyzing outcomes in the programming market. The FCC’s original horizontal subscriber
28

limits were based on an “Open Field” analysis which determined the minimum viable scale for a
programming network and then set limits such that no two maximal-size MVPD providers could
jointly exclude the network from the market (FCC (2005d, Par 72)). The Time Warner II deci-
sion, however, criticized this approach as lacking a connection between the horizontal limit and the
ability to exercise market power. The 2007 rules dismissed by the courts used a monopsony model
as an alternative framework, but that too doesn’t appear useful as networks are differentiated and
terms between programmers and cable operators are negotiated on a bilateral basis, so that if a
cable operator with market power were to reduce its purchases of programming at the margin, it
would have no obvious effect on the prices it pays on inframarginal programming.
A Bargaining Approach Given the well-documented behavior of programmers and MVPDs in
the programming market, a bargaining framework clearly seems most appropriate for analyzing
outcomes. Unfortunately, bargaining models are known for their wealth of predictions, often de-
pending on subtle features of the rules of the game that are hard to verify in practice. What can
bargaining theory tell us about market power and the consequences of horizontal concentration in
programming markets?
The conventional wisdom is that increased concentration in the MVPD market improves the bar-
gaining outcomes of cable systems, reducing affiliate fees to program suppliers. In a standard
bargaining approach, increased size for an individual cable system reduces the viability of a pro-
gram network if an agreement is not reached between the two parties. This necessarily lowers the
networks “threat point,” increasing the expected surplus to the cable system (with specifics deter-
mined by the particular model). These mechanisms are at play in the Nash Bargaining Framework
used by Crawford and Yurukoglu (2012) in their analysis of the industry.66
What does empirical work suggest about horizontal concentration and outcomes in the program-
ming market? Assessing the consequences of increased system size on network surplus in program-
ming markets is conceptually simple, but a lack of data on transaction prices (affiliate fees) has
prevented much empirical work. Ford and Jackson (1997) exploit rarely available programming
cost data reported as part of the 1992 Cable Act regulations to assess (in part) the impact of
buyer size and vertical integration on programming costs. Using data from a cross-section of 283
cable systems in 1993, they find important effects of MSO size and vertical affiliation on costs: the
average/smallest MSO is estimated to pay 11%/52% more than the largest MSO and vertically
affiliated systems are estimated to pay 12-13% less per subscriber per month. Chipty (1995) takes
a different strategy: she infers the impact of system size on bargaining power from its influence on
retail prices. She also finds support for the conventional wisdom that increased buyer size reduces
systems’ programming costs. Finally, Crawford and Yurukoglu (2012) estimate the relative bar-
gaining power of channel conglomerates like ABC Disney and Viacom relative to cable operators
29

and satellite systems. While not the focus of their study, they find that MVPDs generally have
higher bargaining power than channels for small channel conglomerates, but that the situation
is reversed for large channel conglomerates, and that, among distributors, small cable operators
and satellite providers have slightly less estimated bargaining power than large cable operators.
While feasible, they don’t estimate the effect of up- and downstream mergers within their sample
on estimated bargaining power, an interesting potential avenue to directly explore the relationship
between concentration and bargaining outcomes.
7.1.2 Vertical Integration and Foreclosure
Many MVPD operators either own or have ownership interests in programming networks. So
do major broadcast networks. This has drawn considerable attention from regulators in MVPD
markets. FCC (2005b) documents the status of vertical integration in MVPD markets as of 2004.
In brief, of 388 national programming networks and 96 regional programming networks in 2004, 89
(24), or 23% (25%), were affiliated with a major cable operator.67 An additional 103 (22), or 27%
(23%) were affiliated with a broadcast programming provider.68 Furthermore, in 2006 all of the
top 20 networks by subscribers (save C-SPAN) and top 15 by ratings were owned by either a cable
operator or broadcast network.69
As in most cases of vertical integration, there are both efficiency and strategic reasons MVPDs
and program networks may want to integrate. Regarding efficiency, vertical integration could
eliminate double marginalization, improving productive efficiency. Similarly, it could minimize
transactions costs and reduce the risk of new program development. It could also internalize
important externalities between systems and networks in the areas of product choice, service quality,
and brand development. Or it could eliminate inefficiencies in the bargaining process.
Unfortunately, vertical integration may also provide the integrated firm incentives to foreclose un-
affiliated rivals (Rey and Tirole (2007)). For example, an integrated programmer-distributor could
deny access to its affiliated programming to downstream rivals or raise the costs they pay relative to
that of its integrated downstream division. Similarly, the integrated programmer-distributor could
deny carriage on its affiliated distributor to upstream rivals or reduce the revenue they receive
relative to its integrated upstream division. Downstream foreclosure was the primary motivator
underlying the exclusivity prohibition for affiliated content in the program access rules as well as
the reason for several merger conditions required by the FCC in its approval of the 2011 Comcast-
NBC/Universal merger. Similarly, concerns about upstream foreclosure drove the news neighbor-
hooding condition in that merger due to concerns about the incipient integration of MSNBC, the
dominant network for business news, with Comcast, the largest MVPD and one with important
footprints in several very large markets for business news. The latter case is instructive, as the
30

concern addressed by the merger condition was not (necessarily) one of complete foreclosure, i.e.
that Comcast would no longer carry rival business news networks, but that it would disadvan-
tage them in terms of channel placement, reducing viewership and thus rivals’ advertising revenue.
This highlights the subtle ways in which an integrated firm with market power in one market can
disadvantage rivals in vertically-related markets.
Existing empirical research has universally found that vertically integrated MVPDs are more likely
to carry their affiliated program networks, but whether this is pro- or anti-competitive remains
an open issue. Waterman and Weiss (1996) examine the impact of vertical relationships between
pay networks and cable operators in 1989. They find that affiliated MSOs are more likely to carry
their own and less likely to carry rival networks. Subscribership follows the same pattern, though
they find no estimated effect on prices.70 Chipty (2001) addresses similar questions, including
whether integration influences MVPD carriage of Basic cable networks. Using 1991 data, she
finds integration with premium networks is associated with fewer premium nets, fewer basic movie
networks (AMC), higher premium prices, and higher premium subscriptions. On balance she finds
households in integrated markets have higher welfare than those in unintegrated markets, although
the effects are not statistically significant. As in the studies analyzing the impact of regulation,
however, it is difficult to assess if differences across cable systems in product offerings and prices are
driven exclusively by integration or by other features of integrated systems (e.g. size, marketing,
etc.). Crawford, Lee, Whinston, and Yurukoglu (2012) have begun to analyze this issue in markets
for Regional Sports Networks, but as yet have no firm conclusions.
7.1.3 Conclusions
The analysis of competition in the programming market is unfortunately inconclusive. Horizontal
concentration in both programming and distribution markets has clearly increased over time, but
the consequences for efficiency and welfare are unclear. More research both measuring the effects
of increased concentration and the appropriate public policy responses to it would be welcome.
Of more concern is the potential this increased market power provides incentives via vertical rela-
tionships to foreclose unaffiliated rivals. While the theory clearly supports this as a possibility, so
too are efficiency benefits reasonable. More empirical work is needed to assess potential foreclosure
effects and to test the alternative motivations to integrate.
7.2 Bundling
As complaints about high and rising cable bills continue, recent regulatory and legislative focus has
turned to the consequences of bundling in cable and satellite markets at both the wholesale and
31

retail level. At the wholesale level, cable operators have long complained about the programmers
tying less-value programming to the ability to get high-value programming. In 2008, the FCC
explored a rule-making on the matter, but nothing was ever circulated or voted (Make (2008). At
the retail level, both the General Accounting Office and the Federal Communications Commission
have analyzed the likely effects of bundling in cable markets, finding mixed but generally negative
(and extremely uncertain) effects for consumers (GAO (2003), FCC (2004a)). In 2006, the FCC,
under a new chairman, published a follow-up study that repudiated many of its earlier conclusions
and found that unbundling could actually improve consumer welfare (FCC (2006b)).
Is then bundling a market failure in cable markets? Might not a la carte sales at either the wholesale
or retail level improve consumer welfare? I survey the existing theoretical and empirical evidence
in what follows.
7.2.1 Theoretical Motivations to Bundle
In many product markets, bundling enhances economic efficiency. A variety of industries emphasize
the benefits of bundling in simplifying consumer choice (as in telecommunications and financial
services) or reducing costs from consolidated production of complementary products (as in health
care and manufacturing). In either case, bundling promotes efficiency by reducing consumer search
costs, reducing product or marketing costs, or both. Moreover, if profitable, bundling can enhance
incentives to offer products by increasing the share of total surplus appropriable by firms (Crawford
and Cullen (2007)).
Two literatures in economics suggest that bundling can instead reduce consumer welfare in product
markets. First, a longstanding and influential theoretical literature suggests bundling may arise in
many contexts to sort consumers in a manner similar to 2nd-degree price discrimination (Stigler
(1968), Adams and Yellen (1976)). When consumers have heterogeneous tastes for several products,
a monopolist may bundle to reduce that heterogeneity, earning greater profit than would be possible
with component (unbundled) prices. Bundling - like price discrimination - allows firms to design
product lines to extract maximum consumers surplus. While firms clearly benefit in this case,
consumer welfare may fall, often because bundling requires consumers to purchase products in
which they have little interest (Bakos and Brynjolfsson (1999), Armstrong (1996)).
Insert Figure 9 Here
Figure 9, from Crawford and Yurukoglu (2012), demonstrates the intuition of this line of argument
in a simple example of a monopolist selling two goods with zero costs. In the figure, the demand
curve for each good is given by the dashed lines. It is clear that if the monopolist sold the two
32

goods a la carte, at whatever price it chose for each there would be consumers that valued each good
at greater than its price who would purchase it (earning consumer surplus) as well as consumers
that valued each at less than its price (but more than its cost) who would not purchase it (causing
deadweight loss). Compare that to the case if the monopolist were to bundle given by the solid
line in the figure. As long as valuations for the two goods are not perfectly correlated, consumers
valuation of the bundle will be less dispersed than those for the components, allowing the firm to
capture more of the combined surplus with a single price. While I chose valuations that are highly
negatively correlated in the figure to emphasize this point, it is quite general: a la carte regulations
can unlock surplus and improve consumer welfare for given input costs.
Another recent literature analyzes how bundling can also be used to extend market power or
deter entry (e.g. Whinston (1990), Nalebuff (2004), Bakos and Brynjolfsson (2000)). In this
context, bundling reduces the market for potential entrants by implicitly providing a discount on
“competitive” products for all consumers with high tastes for “noncompetitive” products. Figure
10, from Nalebuff (2004), demonstrates the intuition of this line of argument in another simple
example, this time of a monopolist providing two goods (A & B) facing a potential entrant in the
market for B. Shown in the figure are consumers’ willingness-to-pay for each product, assumed to
be distributed uniformly over a range of [0, 1] for each product. As above, assume away any costs
and that the monopolist must commit both to a method of sale (a la carte or bundling) as well as
prices.
Insert Figure 10 Here
If the monopolist sells each good separately, the entrant will enter market B, just undercut the
monopolist’s price, and earn all the sales in that market. The figure demonstrates what happens
if he instead chooses to bundle. If the entrant enters, all consumers that value good B at greater
than its price will buy it. This is given by the shaded area in the southeast of the figure. All
remaining consumers that value the two goods at greater than the bundle price will buy it. This
is given by the shaded area at the top of the figure. Note the effect bundling has on the potential
market for the entrant. Because all consumers with high willingness-to-pay for good A will tend to
prefer the bundle, the entrant is able to only compete for half the market, i.e. those with low WTP
for good A. In effect, bundling A with B allows the monopolist to provide an implicit discount
on good B to all consumers with high WTP for good A. The entrant cannot match that discount
and is effectively foreclosed from that portion of the market. If the entrant faces fixed entry costs,
bundling in this setting can foreclose the market from potential entry. Even if the entrant does
enter, his profits will be lower than if the monopolist did not bundle. This can influence welfare
in dynamic environments if, for example, firms have to make investment decisions based on the
expected profitability of their operations.
33

7.2.2 Bundling in Cable Markets
The literature surveyed above demonstrates that there are many possible motives for bundling.
Which are likely to apply cable markets? And what are the implications for consumer and total
welfare?
It is easy to motivate that bundling reduces costs to cable systems. As described in Section 4, and it
is unbundling networks that is costly, requiring methods to prevent consumption by non-subscribers.
While the rise of addressable converters (set-top boxes) is lowering this cost, many (esp. small
companies’) cable subscribers still do not use them.71 Furthermore, bundling simplifies consumer
choice, reducing administrative and marketing costs, and it guarantees widespread availability, a
feature viewed as essential for networks seeking advertising revenue (FCC (2004a)).
It is also widely believed, however, that systems bundle to price discriminate in cable markets.
Cable systems and program networks both argue that bundling allows them to capture surplus
from the (possibly many) low-value consumers that would likely not choose to purchase a channel
on a stand-alone basis (FCC (2004a)).
Recent empirical work in the economics literature bears out these discriminatory effects. Using
data from a cross-section of 1,159 cable markets in 1995, Crawford (2008) tests the implications
of the discriminatory theory and finds qualified support for it. He estimates the profit and welfare
implications of his results, finding that bundling an average top-15 special-interest cable networks
is estimated to increase profits and reduce consumer welfare, with an average effect of 4.7% (4.0%).
On balance, total welfare increases, with an average effect of 2.0%. In a simulation study, Crawford
and Cullen (2007) confirm these effects and also find that bundling enhances industry incentives to
provide networks than would a la carte sales, but may do so at significant cost to consumers. Re-
cent work by Rennhoff and Serfes (2008), under somewhat restrictive assumptions, reaches similar
conclusions about welfare effects of a la carte, while Byzalov (2010) finds the opposite result.
There is an important weakness in all of these papers, however: they treat the affiliate fees paid
by cable systems to programmers as given. This is contrary to both the nature of programming
contracts (which typically require systems to pay sometimes much higher fees if channels are offered
a la carte) as well as bargaining incentives in an a la carte world (Crawford and Yurukoglu (2012,
Sec.2)). In an important recent paper, Crawford and Yurukoglu (2012) evaluate the welfare effects
of a la carte allowing for renegotiation between programmers and distributors in an a la carte
environment. They confirm the results of the previous paragraph, that consumer surplus would
rise under a la carte if programming costs to distributors were fixed, but instead estimate that
renegotiation would cause these costs to rise by more than 100%, raising a la carte prices to
households and lowering both consumer surplus and firm profits. On average, they find consumers
would be no better off under a la carte (and strictly worse off under themed tiers), and that any
34

implementation or marketing costs would likely make them worse off.72
Claims of bundling’s potential to deter entry or enhance market power have been made in both
the distribution and programming markets. In the distribution market, wireline competitors to
incumbent cable systems have articulated versions of the entry deterrence argument when objecting
to (i) the terrestrial exception to the program access rules and (ii) the “clustering” of cable systems
within localized (e.g. MSA) markets (FCC (2005b, Paragraphs 154-158)). In each case, rival
MVPDs may be at a significant competitive disadvantage, even if the foreclosed network is the
only network by which rival bundles differ. In the programming market, MVPD buyers have
complained about the bundling of affiliated program networks, both when negotiating rights to
broadcast networks under retransmission consent as well as critical non-broadcast networks (FCC
(2005b, Paragraphs 162), FCC (2005d, Footnote 232)). In this case, program networks that compete
with those bundled with high-value networks may have difficulty obtaining carriage agreements,
particularly if they appeal to similar niche tastes. Responding to these concerns, the FCC in late
2007 announced a new proceeding to investigate the issue, but no formal rulemaking appears to
have come from it (Cauley (2007)). While theoretically plausible, I know of no empirical evidence
of entry deterrence in either the distribution or programming markets. Empirical studies of these
topics would be welcome.
7.2.3 Conclusions
Is bundling a market failure in the cable industry? While it would appear so at existing cable
system costs, those would be sure to change in an a la carte world, casting very strong doubts
about the potential welfare benefits of mandated a la carte. Regulators would be wise to stay away
from this superficially-appealing policy option.
More uncertainty surrounds the issue of bundling for market power or entry deterrence. While
existing theoretical research does not draw explicit welfare conclusions, it is clear that bundling
can have important competitive effects, particularly if, as seems to be the norm in programming
markets, it is partnered with vertical integration and horizontal concentration. This could represent
a substantial barrier to entry for diverse independent programming in cable markets. It is worthy
of further study.
7.3 Online Video
In Section 2, I described recent developments in the market for online distribution of video pro-
gramming. In this section, I briefly discuss two implications of these developments.
The first is to address whether online video distribution (OVD) is a substitute or complement
35
for existing pay-tv programming and whether it can plausibly provide a substantive competitive
alternative to existing pay-tv bundles. Comments in the most recent FCC report on video market
competition found support for both substitution and complementarity of OVD, and some mentioned
that they thought it did provide a competitive threat (FCC (2012c)). Before analyzing these claims,
it is important to distinguish between types of video content. While there is a large amount of
short-form and web-only video that will likely serve as a weak substitute for programming provided
on pay-television platforms, like the FCC I will focus my analysis on video content that is similar
to that professionally-produced and exhibited by broadcast and cable networks and created using
professional-grade equipment and talent.
While there is not yet empirical evidence on this point, economic theory suggests the effects of
professionally-produced online video in both the short- and long-run will largely be complementary.
The reason is that the only entities that have the expertise and scale to produce content like that
currently produced by broadcast and cable networks are those networks. While many such networks
have been aggressive in exploring online video distribution, they have uniformly been doing so in
ways that protect their existing revenue streams from traditional MVPDs (e.g. authentication
methods like those used by TV Everywhere and/or delays in making available programming online
that is also distributed via traditional channels). In practice, online-video distribution serves as a
form of third-party “mixed bundling”: content providers sell via a MVPD bundle to the majority
of their viewers, but offer online viewing either (for free) as a way to enhance the value of the
traditional bundle (TV Everywhere) or (for pay) on an a la carte basis to those few viewers who
value highly online consumption and/or do not purchase an MVPD bundle. Of course, some
OVDs (e.g. Netflix) are seeking to disrupt this business model by licensing original content in
direct competition with traditional programmers, but this strategy is in its infancy and it is very
uncertain if it will be successful.
The ability of OVDs to compete directly with traditional MVPDs is further complicated by fore-
closure concerns. Online video distributors must necessarily rely on a high-speed broadband con-
nection to households in order to deliver their programming, the vast majority of which are also
owned by existing cable or telco MVPDs. There are legitimate concerns that MVPDs will somehow
manipulate their broadband networks in ways that disadvantage rival OVDs, perhaps by offering
differential download speeds for rival online content, imposing data caps that lower the value of an
Internet-delivered video service, or setting usage-based prices with similar effects. Furthermore, it
is hard to determine if such strategies are anti-competitive, as they can also help MVPDs efficiently
manage their network traffic. Netflix has complained that AT&T, Comcast, and Time Warner have
pursued strategies that disadvantage OVDs and lawmakers are concerned about this issue.
The market for online video distribution is in its infancy, so appropriate policies are difficult to
determine. More empirical research establishing some basic facts about the nature of traditional
36

and online television substitutability, measuring the incentives to foreclosure, and distinguishing
between efficient and foreclosing MVPD management practices would be welcome.
7.4 Bargaining breakdowns
A final topic of growing interest among policymakers is the growing number of bargaining break-
downs that result in channel blackouts on affected MVPDs. Section 3.3 documented blackouts
arising from retransmission consent negotiations, but similar disagreements also arise for cable pro-
gramming networks. Why do breakdowns happen? What are the welfare costs? Is this a market
failure? And is there an appropriate public policy response? I briefly discuss each of these points
in this section.
Standard bargaining theory assumes each side of a negotiation has complete information about the
gains from trade and each party’s threat position. In practice, of course, there can be uncertainty
about these matters and this uncertainty can influence each party’s demands and willingness to
accede to the other party’s demands. This is particularly relevant when there is a shift in the market
from historical patterns of contracting, as when broadcasters began demanding cash payments for
retransmission consent in the late 2000s.
It is uncertain what are the welfare costs from such breakdowns. Most are short-lived, e.g. measured
in days, and there is are no good measures of the welfare costs of such temporary interruptions. It is
also uncertain if this is a market failure. Parties on both sides of carriage negotiations have market
power (hence the use of a bargaining framework) and the high costs of both developing programming
and distributing that programming on a scale comparable to existing MVPDs suggest there is little
policymakers can do about that market power.
Policy proposals advocated in the trade press largely focus on a binding arbitration procedure.
This could work for national programming as an independent arbitrator could likely obtain access
to contracts reached in settings comparable to the one being disputed. It would work less well
for local or regional (broadcast and/or RSN) programming due to the lack of directly comparable
settings, but is something that could be considered. Before any such policy is adopted, however,
further research is needed about whether the situation demands a regulatory response and, if so,
what would be the optimal such response.
8 Conclusion
This chapter surveys the consequences of economic regulation in the cable television industry and
evaluates the impact of competition from satellite and telephone company providers on potential
37

market failures in the industry. Prospects for efficient outcomes in the distribution market look
better than ever. Satellite and telco competition has largely replaced price regulation as the con-
straining force on cable pricing and driving force for innovative services, a welcome outcome given
the empirical record on regulation’s effects in cable markets. While prices continue to rise, so too
does quality and it may be that (most) consumers are better off. Mandatory a la carte, while
superficially appealing, is not likely to improve average consumer welfare and could significantly
decrease it.
If price and “choice” regulation is not likely to be effective at improving consumer welfare in video
markets, what then should policymakers do? This is a difficult question. Owners of valuable
content (sports leagues, movie studios) necessarily have market power. The media conglomerates
that program that content and the cable systems that distribute it do as well. The immense time
and expense required to enter any of these markets is a significant barrier to entry, as are consumer
switching costs in distribution (Shcherbakov (2010)).
That being said, some basic principles can help guide policymaking in video markets. Legislative
and regulatory efforts should focus on lowering barriers to entry throughout the video supply chain.
For example, the combination of national franchising standards and widespread low-cost access to
public rights-of-way would lower the cost of additional wireline entry in distribution. Similarly,
additional electromagnetic spectrum for fixed or mobile broadband would facilitate wireless entry
and increase the capacity available for online video distribution. Standardized set-top boxes, if
technically feasible, would lower consumer switching costs and increase market competitiveness.
Policy initiatives in these directions would be useful.
At the same time, the competition regulators should keep a close eye on the potential anti-
competitive effects of tying and bundling in the programming market as well as the risks associated
with vertical integration and foreclosure in programming and both traditional and online video
distribution. No one knows what the video market will look like 15 years from now. It is important
that those with the most to lose do not leverage their influence to distort that evolution.
38

Notes
1So-called cable networks earned their name by having originally been available only on cable.
2In the last 10 years, premium networks have begun “multiplexing” their programming, i.e. offering multiple
channels under a single network/brand (e.g. HBO, HBO 2, HBO Family, etc.).
3In 2010, non-video services, largely Internet and telephone services, contributed 37.1% of cable operators revenue
(FCC (2012c)).
4A Digital Video Recorder is a device that allows households to record video to a hard drive-based digital storage
medium.
5As this chapter goes to press, Dish has introduced an “app” to rave reviews that allows access to all of their
content on mobile devices (Roettgers (2013)).
6See Foster (1982, Chapter 5) and Noll, Peck, and McGowan (1973) for a survey of the history of broadcast
television and its regulation.
72 FCC 2d at 782 as cited in Besen and Crandall (1981, p.90).
8Must-Carry rules require systems to carry all local broadcast signals available in their franchise area. These
rules were amended by the 1992 Cable Act.
9See HBO v. FCC, 567 Fd 2nd 9 (1977).
10Other terms of franchise agreements remained in effect. See GAO (1989).
11There are four separate tests for effective competition: (i) a cable market share under 30%, (ii) there are at least
two unaffiliated MVPDs serving 50% of the cable market and achieving a combined share of 15%, (iii) the franchising
authority is itself a MVPD serving 50% of the cable market, and (iv) the local exchange carrier offers comparable
video programming services (47 CFR 76.905).
12In what follows I use Expanded Basic tier to refer to the FCC designation Cable Programming tier.
39

13See, e.g., FCC (1998d, p.6) describing the FCC’s social contract with Time Warner. In it, Time Warner was
permitted to increase its Expanded Basic prices by $1/year for 5 years in return for agreeing to invest $4 billion to
upgrade its system. It also dismissed over 900 rate complaints and provided small refunds to subscribers.
14America’s Talking became MSNBC in 1996. CBS lacked any affiliated networks in the initial Retransmission
Consent negotiations but used them to launch Eye on People in 1996.
15See http://www.americantelevisionalliance.org/blog/ for details.
16See Wildman and Owen (1985) for a detailed description of the market for the supply of programming.
17Comcast, Time Warner, Cox, and Cablevision among cable MSOs; News Corp/Fox, Disney/ABC, Viacom/CBS,
and GE/NBC among broadcasters. In 2011, Comcast purchased GE/NBC, further consolidating the market.
18The 30% limit was changed in 1999 to 30% of MVPD subscribers.
19In the case of cable systems, the licenses to be transferred are the cable television relay service license that “are
essential to the operation of the [firm]” (FCC (2001b)).
20Note that the FCC’s merger review process is in addition to that required by competition law: any merger
between firms of a given size (roughly sales or assets of $50 million) must be approved by the federal antitrust
authorities, the Department of Justice or the Federal Trade Commission, under the Clayton Act.
21This condition had been agreed to in advance by the companies (Feder (2002)).
22Many early cable franchise agreements were exclusive within a given municipality. The 1992 Cable Act forbid
exclusivity.
23This was viewed in part as a defensive response to cable entry into local telephone service.
24They particularly objected to build-out requirements, especially if they don’t overlap with their service area.
25In 2006, EchoStar (Dish Network) provided broadcast programming in about 160 television markets and DirecTV
about 145.
40

26At this time, EchoStar does not own significant programming interests and is not subject to programming rules.
27The cable series began including satellite services in the late 1990s. In principle, it has also included satellite
radio since 2003, although as of October 2005 no satellite radio data had been sampled.
28These are likely supply-side phenomena, the former driven by the relaxation of FCC content restrictions and the
feasibility of low-cost satellite distribution and the latter driven by significant upgrades in cable infrastructure and
the (possibly anticipated) rollout of digital tiers of service.
29Consistent with conventional wisdom, this suggests new networks charge lower average prices than established
networks. Indeed, new networks often pay systems (i.e. charge negative prices) for a period of years before becoming
established and negotiating positive fees.
30Subscribers to Premium Networks are often called “Pay Households”. Total subscriptions to Premium Networks
are often called “Pay Units”.
31This concern was driven by differential regulatory treatment of different tiers in the various regulatory periods.
The 1992 Act in particular introduced a split regulatory structure, with local franchise authorities given authority
to regulate rates of Basic service and the FCC given authority to regulate rates of Expanded Basic services. Some
estimates of total subscribers to Expanded Basic Services fell after the 1984 Cable Act and increased again after the
1992 Act (GAO (1989), GAO (1991), Hazlett and Spitzer (1997)).
32Previous to 1999, the vast majority of cable systems did not face competition in their local service areas. Even
after satellite entry in 1999, because satellite systems choose price and quality on a national basis, existing cable
systems can be modeled as monopolists on the “residual demand” given by demand in their local market less those
subscribers attracted (at each cable price and quality) to national satellite providers (Crawford, Shcherbakov, and
Shum (2011)).
33Crawford, Shcherbakov, and Shum (2011) attempt to estimate the relative importance of market power over
quality and market power over price in cable television markets.
34With more types and products, there is a marginal/inframarginal tradeoff in optimal price and quality choice:
41

marginal profit losses from degrading quality for any product against inframarginal profit gains on higher prices for
all higher qualities.
35The effect on low types is the opposite. The firm cannot extract as much surplus from high types with a price
cap. This relaxes the incentive compatibility constraint for high types, reducing the incentive to degrade quality to
low types. As such, quality and prices actually rise for low-quality goods.
36Recall that prices for Premium Services may not and have never been regulated (cf. Section 3.1).
37For example, see the sample statistics for 1995 data in Crawford and Shum (2007). Furthermore, Basic Services
are the most important offered by cable systems, providing five times the revenue of (unregulated) Premium Services
(NCTA (2005d))
38Other dimensions that matter, albeit less, include customer service, signal reliability, and advanced service
offerings.
39Such “event study” techniques were first applied to analyze the impact of regulation by Schwert (1981), Binder
(1985), and Rose (1985).
40This is not surprising given the nature of the cable regulation over time. Local and state price regulations (prior
to 1984) and federal price regulations (after 1994) often applied only to the lowest bundle of networks offered by the
system. This introduced incentives to offer Expanded Basic tiers to avoid price controls. Corts (1995) and Crawford
(2000) provide further theoretical and empirical support for this view.
41Some authors have attributed such findings to evidence of rent-seeking by local franchise authorities (Hazlett
(1986b), Zupan (1989b)).
42See Crawford and Shum (2007) for a representative discussion of this issue.
43See the citations in Bresnahan (1989) for an extensive bibliography. Berry and Pakes (1993) and Nevo (2000)
are more recent applications.
44Much of the presentation in this section follows Bresnahan (1989).
42

45The last 15 years has seen an explosion in the estimation of differentiated product demand systems in Industrial
Organization. See, inter alia, Berry (1994), Berry, Levinsohn, and Pakes (1995), Nevo (2001), and Petrin (2003) for
recent applications. Crandall and Furchtgott-Roth (1996), Crawford (2000), and Goolsbee and Petrin (2004) apply
these tools in the cable industry.
46This can introduce difficult identification issues as it may be hard to differentiate between price increases due to
diseconomies of scale and those due to increased exercise of market power. Bresnahan (1989) discusses this issue in
detail.
47A similar approach underlies the method of Conjectural Variations. Despite lacking a sound theoretical founda-
tion, the approach has been used to measure market power in oligopoly settings. See Bresnahan (1989) for more.
48Of course, this assumes there are good observable measures of product quality, qn. This must be evaluated on
a case-by-case basis.
49While conceptually simple, implementing the framework described above can be quite difficult in practice. Diffi-
cult identification issues arise in each of the papers surveyed below, casting at least some doubt on their conclusions.
Where possible, I note these concerns.
50Unfortunately, the paper lacks a clear discussion of identification. Estimation is “by two-stage least squares”,
but the motivation for the exclusion restrictions that identify the key parameters is missing.
51In reduced form regressions, the level and shape of the distribution of household income, age, and size were
important determinants of cable prices and quality.
52The 1992 Cable Act, in addition to regulating prices, required systems to offer a Basic Service containing all
offered broadcast and public, educational, and government channels. Many systems introduced “bare-bones” Limited
Basic Services as a consequence of those terms. The authors’ results suggest this and not price caps had a greater
effect on offered service quality in cable markets.
53In this setting, welfare effects are measured by either the compensating or equivalent variation. The compensating
and equivalent variation are measures of the amount of money required to make households in a market indifferent
43
between facing a cable choice set (e.g. set of services, prices and qualities for those services) before and after a change
in the economic environment. The compensating variation asks how much money is required to make someone
indifferent to their initial position; the equivalent variation asks how much money is required to make someone
indifferent to their final position.
54This is likely an underestimate of the true welfare loss, as their quality measure is based on the number of offered
broadcast and satellite channels and the latter increased significantly in quality over the period.
55Care should be taken relying on welfare measures from logit demand systems, particularly when evaluating the
introduction of new products (Petrin (2003)). Crawford (2000) argues that this concern is moderated in his case
because of the popularity of the newly introduced services.
56For example, that the average number of networks increased by approximately 2 from 1992 to 1995 suggests
limited welfare gains to households; that on average 1.5 of those 2 were top-20 networks suggests the opposite
conclusion. Furthermore, many systems were alleged to have moved their most popular programming to unregulated
tiers of service in response to the Act and he can measure that effect.
57Hazlett and Spitzer (1997, Table 3-3) summarize the findings of these and a number of other studies in the 1980s
and early 1990s. Across a variety of datasets, duopoly cable markets are associated with prices 8%-34% lower than
monopoly cable markets.
58“Price” here equals price for Basic Service, Expanded Basic Service, and equipment.
59Because of this definition, some care should be taken interpreting the results in this table too broadly. While, for
example, the national satellite market share has been above 15% since 2001, the share of subscribers in the 2004 price
survey served by cable systems that have been granted a finding of effective competition due to satellite competition
was only 2.35% (FCC (2005a, Attachment 1)).
60The GAO studies appear to use homes passed and system age as instruments for satellite share, but it’s hard to
see how these would be appropriate instruments. If correlated with satellite share due to differences across markets in
offered cable service quality, they should also be correlated with cable prices and belong in the cable price regression.
44

61Strictly speaking, they regress cable prices on the mean utility for satellite service. This can be considered a
measure of the satellite market share.
62This approach, while promising, relies heavily on the assumed functional forms for demand and pricing equations.
63For example, an own-price elasticity of -1.5 would imply a markup of 67% in the case of a single-product
monopolist.
64An exception perhaps being incumbent telco entry in their service areas not currently being provided video
service.
65Note such and measures are most relevant than the programming market. Incumbent cable systems do not
strictly he each other.
66Some bargaining models yield predictions contrary to this conventional wisdom. For example, Chipty and Snyder
(1999) conclude that increased concentration can actually reduce a MVPDs bargaining power, as they estimate the
size of the surplus to be split between a cable system and a programming network depends on the shape of the
network’s gross surplus function. They estimate this on 136 data points in the 1980s and early 1990s and find it is
convex, implying it is better to act as two small operators than one big one. This convexity seems at odds both with
the institutional relationship between network size and advertising revenue (which limits the ability of networks to
obtain advertising revenue at low subscriber levels) as well as claims made by industry participants and observers
of the benefits of increased size. Similarly, Raskovich (2003) builds a bargaining model with a pivotal buyer, one
with whom an agreement is necessary for a seller’s viability, and finds that being pivotal is disadvantageous as if an
agreement is not reached the seller will not trade and it is only the pivotal buyer who can guarantee this outcome.
This can reduce the incentives to merge if merging would make a buyer pivotal. While interesting and potentially
relevant in some settings, this doesn’t seem to accurately describe the nature of most negotiations between networks
and MVPDs.
67These were Comcast with 10 affiliated national networks and 12 affiliated regional networks, Time Warner with
29 (12), Cox with 16 (5), and Cablevision with 5 (16).
68These were News Corp/Fox with 12 affiliated national networks and 22 affiliated regional networks, Disney/ABC
45
with 20 (0), Viacom/CBS with 39 (0), and GE/NBC with 17 (0).
69These values have only increased since then due to the merger of Comcast with NBC/Universal in 2011.
70See also Waterman and Weiss (1997) for the impact of integration on carriage of basic cable networks.
71In 2004, Insight Communications estimates 2/3 of its 1 million customers did not use a converter (FCC (2004a,
p. 39)). By contrast, all satellite subscribers must have a digital receiver/converter. Many larger cable systems are
migrating towards all-digital systems, particularly in large markets, but the process is ongoing.
72Furthermore, no paper in the literature accounts for the influence bundling may have on the quality of program-
ming chosen by networks. It is possible to articulate scenarios where bundling encourages firms to offer program
quality closer to what a social planner would offer than would be the case under a la carte and that moving to an a
la carte world could have important welfare effects due to reductions in the resulting quality of programming.
46

References
Adams, W. J., and J. L. Yellen (1976): “Commodity Bundling and the Burden of Monopoly,”
Quarterly Journal of Economics, 90(3), 475–98.
Armstrong, M. (1996): “Multiproduct Non-Linear Pricing,” Econometrica, 64(1), 51–75.
Armstrong, M., and D. Sappington (2007): “Recent Developments in the Theory of Regu-
lation,” in Handbook of Industrial Organization, ed. by M. Armstrong, and R. Porter, vol. 3,
chap. 1. North-Holland, Amsterdam.
Bakos, Y., and E. Brynjolfsson (1999): “Bundling Information Goods: Pricing, Profits, and
Efficiency,” Management Science, 45(2), 1613–1630.
Bakos, Y., and E. Brynjolfsson (2000): “Bundling and Competition on the Internet,” Mar-
keting Science, 19(1), 63–82.
Berry, S. (1994): “Estimating Discrete Choice Models of Product Differentiation,” Rand Journal
of Economics, 25(2), 242–262.
Berry, S., J. Levinsohn, and A. Pakes (1995): “Automobile Prices in Market Equilibrium,”
Econometrica, 63(4), 841–890.
Berry, S., and A. Pakes (1993): “Some Applications and Limitations of Recent Advances in
Industrial Organization: Merger Analysis,” American Economic Review, 83(2), 247–252.
Besanko, D., S. Donnenfeld, and L. J. White (1988): “The Multiproduct Firm, Quality
Choice, and Regulation,” Journal of Industrial Economics, 36(4), 411–429.
Besen, S., and R. Crandall (1981): “The Deregulation of Cable Television,” Law and Contem-
porary Problems, 44(1), 79–124.
Beutel, P. (1990): “City Objectives in Monopoly Franchising: The Case of Cable Television,”
Applied Economics, 22(9), 1237–1247.
Binder, J. (1985): “Measuring the Effects of Regulation with Stock Price Data,” Rand Journal
of Economics, 16(2), 167–183.
Breautigam, R. (1989): “Optimal Policies for Natural Monopolies,” in Handbook of Industrial
Organization, ed. by R. Schmalensee, and R. Willig, vol. 1, chap. 23, pp. 1289–1346. North-
Holland, Amsterdam.
Brennan, T. (1989): “Regulating by Capping Prices,” Journal of Regulatory Economics, 1(2),
133–147.
47

Bresnahan, T. (1987): “Competition and Collusion in the American Auto Industry: The 1955
Price War,” Journal of Industrial Economics, 35(4), 457–482.
(1989): “Empirical Studies of Industries with Market Power,” in Handbook of Industrial
Organization, ed. by R. Schmalensee, and R. Willig, vol. 2, chap. 17, pp. 1011–1058. North-
Holland, Amsterdam.
Byzalov, D. (2010): “Unbundling Cable Television: An Empirical Investigation,” Working Paper,
Temple University.
Cauley, L. (2007): “FCC puts ’A La Carte’ on the Menu,” USA Today, September 11, 2007.
Chipty, T. (1995): “Horizontal Integration for Bargaining Power: Evidence from the Cable Tele-
vision Industry,” Journal of Economics and Management Strategy, 4(2), 375–97.
Chipty, T. (2001): “Vertical Integration, Market Foreclosure, and Consumer Welfare in the Cable
Television Industry,” American Economic Review, 91(3), 428–453.
Chipty, T., and C. M. Snyder (1999): “The role of Firm Size in Bilateral Bargaining: A Study
of the Cable Television Industry,” Review of Economics and Statistics, 31(2), 326–340.
Chu, C. S. (2010): “The Effects of Satellite Entry on Cable Television Prices and Product Quality,”
Rand Journal of Economics, 41(4), 730–764.
Consumers Union (2003): “FCC Report Shows Cable Rates Skyrocketing; Group calls on
Congress to allow consumers to buy programming on an a la carte basis,” Consumers Union,
July 8, 2003.
Corts, K. S. (1995): “Regulation of a Multi-Product Monopolist: Effects on Pricing and
Bundling,” Journal of Industrial Economics, 43(4), 377–397.
Crandall, R., and H. Furchtgott-Roth (1996): Cable TV: Regulation or Competition?
Brookings Institution Press, Washington, DC.
Crawford, G. S. (2000): “The Impact of the 1992 Cable Act on Household Demand and Welfare,”
RAND Journal of Economics, 31(3), 422–449.
(2008): “The Discriminatory Incentives to Bundle in the Cable Television Industry,”
Quantitative Marketing and Economics, 6(1), 41–78.
Crawford, G. S., and J. Cullen (2007): “Bundling, Product Choice, and Efficiency: Should
Cable Television Networks be Offered A La Carte?,” Information Economics and Policy, 19(3-4),
379–404.
48
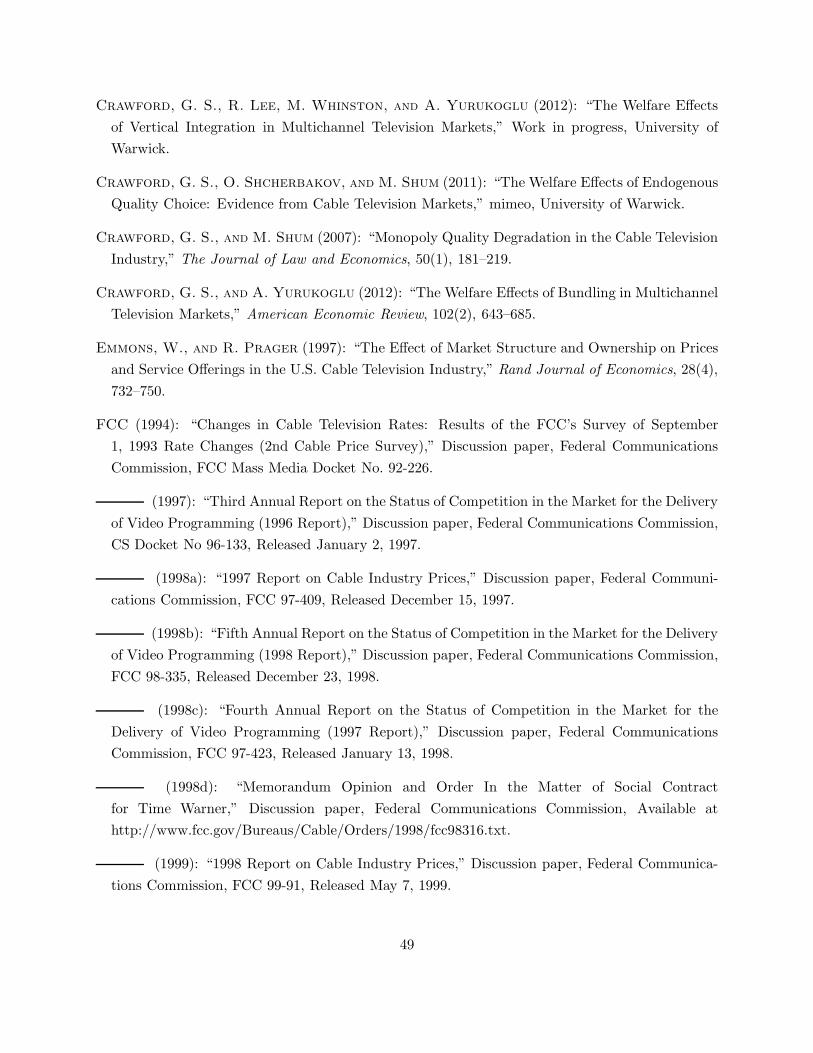
Crawford, G. S., R. Lee, M. Whinston, and A. Yurukoglu (2012): “The Welfare Effects
of Vertical Integration in Multichannel Television Markets,” Work in progress, University of
Warwick.
Crawford, G. S., O. Shcherbakov, and M. Shum (2011): “The Welfare Effects of Endogenous
Quality Choice: Evidence from Cable Television Markets,” mimeo, University of Warwick.
Crawford, G. S., and M. Shum (2007): “Monopoly Quality Degradation in the Cable Television
Industry,” The Journal of Law and Economics, 50(1), 181–219.
Crawford, G. S., and A. Yurukoglu (2012): “The Welfare Effects of Bundling in Multichannel
Television Markets,” American Economic Review, 102(2), 643–685.
Emmons, W., and R. Prager (1997): “The Effect of Market Structure and Ownership on Prices
and Service Offerings in the U.S. Cable Television Industry,” Rand Journal of Economics, 28(4),
732–750.
FCC (1994): “Changes in Cable Television Rates: Results of the FCC’s Survey of September
1, 1993 Rate Changes (2nd Cable Price Survey),” Discussion paper, Federal Communications
Commission, FCC Mass Media Docket No. 92-226.
(1997): “Third Annual Report on the Status of Competition in the Market for the Delivery
of Video Programming (1996 Report),” Discussion paper, Federal Communications Commission,
CS Docket No 96-133, Released January 2, 1997.
(1998a): “1997 Report on Cable Industry Prices,” Discussion paper, Federal Communi-
cations Commission, FCC 97-409, Released December 15, 1997.
(1998b): “Fifth Annual Report on the Status of Competition in the Market for the Delivery
of Video Programming (1998 Report),” Discussion paper, Federal Communications Commission,
FCC 98-335, Released December 23, 1998.
(1998c): “Fourth Annual Report on the Status of Competition in the Market for the
Delivery of Video Programming (1997 Report),” Discussion paper, Federal Communications
Commission, FCC 97-423, Released January 13, 1998.
(1998d): “Memorandum Opinion and Order In the Matter of Social Contract
for Time Warner,” Discussion paper, Federal Communications Commission, Available at
http://www.fcc.gov/Bureaus/Cable/Orders/1998/fcc98316.txt.
(1999): “1998 Report on Cable Industry Prices,” Discussion paper, Federal Communica-
tions Commission, FCC 99-91, Released May 7, 1999.
49

(2000a): “1999 Report on Cable Industry Prices,” Discussion paper, Federal Communi-
cations Commission, FCC 00-214, Released June 15, 2000.
(2000b): “Cable Television Fact Sheet,” Discussion paper, Federal Communications Com-
mission, Available at http://www.fcc.gov/mb/facts/csgen.html.
(2000c): “Declaratory Ruling and Notice of Proposed Rulemaking,” Discussion paper,
Federal Communications Commission, FCC 02-77.
(2001a): “2000 Report on Cable Industry Prices,” Discussion paper, Federal Communi-
cations Commission, FCC 01-49, Released February 14, 2001.
(2001b): “Memorandum Opinion and Order,” Discussion paper, Federal Communications
Commission, CS Docket No. 0030, FCC 01-12.
(2001c): “Seventh Annual Report on the Status of Competition in the Market for the
Delivery of Video Programming (2000 Report),” Discussion paper, Federal Communications
Commission, FCC 01-1, Released January 8, 2001.
(2002a): “2001 Report on Cable Industry Prices,” Discussion paper, FCC, FCC 02-107,
Released April 4, 2002.
(2002b): “Eighth Annual Report on the Status of Competition in the Market for the
Delivery of Video Programming (2001 Report),” Discussion paper, Federal Communications
Commission, FCC 01-389, Released January 14, 2002.
(2002c): “Ninth Annual Report on the Status of Competition in the Market for the Delivery
of Video Programming (2002 Report),” Discussion paper, Federal Communications Commission,
FCC 02-338, Released December 31, 2002.
(2003): “2002 Report on Cable Industry Prices,” Discussion paper, Federal Communica-
tions Commission, FCC 03-136, Released July 8, 2003.
(2004a): “Report on the Packaging and Sale of Video Programming to the Public,”
Discussion paper, FCC, November 18, 2004. Available at http://www.fcc.gov/mb/csrptpg.html.
(2004b): “Tenth Annual Report on the Status of Competition in the Market for the
Delivery of Video Programming (2003 Report),” Discussion paper, Federal Communications
Commission, FCC 04-5, Released January 28, 2004.
(2005a): “2004 Report on Cable Industry Prices,” Discussion paper, Federal Communi-
cations Commission, FCC 05-12, Released February 4, 2005.
50

(2005b): “Eleventh Annual Report on the Status of Competition in the Market for the
Delivery of Video Programming (2004 Report),” Discussion paper, Federal Communications
Commission, FCC 05-13, Released February 4, 2005.
(2005c): “Notice of Proposed Rulemaking,” Discussion paper, Federal Communications
Commission, MM Docket No. 05-311, FCC 05-189.
(2005d): “Second Further Notice of Proposed Rulemaking,” Discussion paper, Federal
Communications Commission, MM Docket No. 92-264, FCC 05-96.
(2006a): “2005 Report on Cable Industry Prices,” Discussion paper, Federal Communi-
cations Commission, FCC 06-179, Released December 27, 2006.
(2006b): “Further Report on the Packaging and Sale of Video Programming to the Public,”
Discussion paper, FCC, February, 2006. Available at http://www.fcc.gov/mb/csrptpg.html.
(2006c): “Twelfth Annual Report on the Status of Competition in the Market for the
Delivery of Video Programming (2005 Report),” Discussion paper, Federal Communications
Commission, FCC 06-11, Released March 3, 2006.
(2009a): “2006-2008 Report on Cable Industry Prices,” Discussion paper, Federal Com-
munications Commission, FCC 09-53, Released January 16, 2009.
(2009b): “Thirteenth Annual Assessment on the Status of Competition in the Market for
the Delivery of Video Programming (2006 Report),” Discussion paper, Federal Communications
Commission, FCC 07-206, Released January 16, 2009.
(2011): “2009 Report on Cable Industry Prices,” Discussion paper, Federal Communica-
tions Commission, DA 11-284, Released February 14, 2011.
(2012a): “2010 Report on Cable Industry Prices,” Discussion paper, Federal Communi-
cations Commission, DA 12-377, Released March 9, 2012.
(2012b): “2011 Report on Cable Industry Prices,” Discussion paper, Federal Communi-
cations Commission, DA 12-1322, Released August 13, 2012.
(2012c): “Fourteenth Annual Assessment on the Status of Competition in the Market for
the Delivery of Video Programming (2007-2010 Report),” Discussion paper, Federal Communi-
cations Commission, FCC 12-81, Released July 20, 2012.
Feder, B. (2002): “U.S. Clears Cable Merger of AT&T Unit with Comcast,” New York Times,
November 14, 2002.
51
Ford, G., and J. Jackson (1997): “Horizontal Concentration and Vertical Integration in the
Cable Television Industry,” Review of Industrial Organization, 12(4), 501–518.
Foster, A. (1982): Understanding Broadcasting. Addison-Wesley Publishing Group, 2 edn.
GAO (1989): “National Survey of Cable Television Rates and Services,” Discussion paper, General
Accounting Office, GAO/RCED-89-193.
(1991): “Telecommunications: 1991 Survey of Cable Television Rates and Services,”
Discussion paper, General Accounting Office, GAO/RCED-91-195.
(2000): “The Effect of Competition from Satellite Providers on Cable Rates,” Discussion
paper, General Accounting Office, GAO/RCED-00-164.
(2003): “Issues Related to Competition and Subscriber Rates in the Cable Television
Industry,” Discussion paper, General Accounting Office, GAO-04-8.
Goolsbee, A., and A. Petrin (2004): “Consumer Gains from Direct Broadcast Satellites and
the Competition with Cable TV,” Econometrica, 72(2), 351–81.
Hazlett, T. (1986a): “Competition versus Franchise Monopoly in Cable Television,” Contempo-
rary Policy Issues, 4(2), 80–97.
(1986b): “Private Monopoly and the Public Interest: An Economic Analysis of the CAble
TElevision Franchise,” University of Pennsylvania Law Review, 134(6).
Hazlett, T., and M. Spitzer (1997): Public Policy Towards Cable Television: The Economics
of Rate Controls. MIT Press.
Hohmann, G. (2012): “Reckefeller criticizes cable TV industry,” Charleston Daily Mail, July 29,
2012.
Jaffe, A., and D. Kanter (1990): “Market Power of Local Cable Television Franchises: Evidence
from the Effects of Deregulation,” Rand Journal of Economics, 21(2), 226–234.
Kagan World Media (1998): “Economics of Basic Cable Television Networks,” Discussion paper,
Kagan World Media.
(2004): “Cable Program Investor,” Discussion paper, Kagan World Media, March 15,
2004.
Kahn, A. E. (1991): The Economics of Regulation: Principles and Institutions. MIT Press.
Kirkpatrick, D. (2003): “F.C.C. Approves Deal Giving Murdoch Control of DirecTV,” New York
Times, December 20, 2003.
52

Levin, S., and J. Meisel (1991): “Cable Television and Competition: Theory, Evidence, and
Policy,” Telecommunications Policy, 16(6), 519–528.
Make, J. (2008): “Martin Weighs Wholesale Cable Unbundling, Other Video Changes,” Commu-
nications Daily, August 1, 200.
(2009): “FCC Draws Fire from Appeals Court in Cable Cap Loss,” Communications
Daily, August 31, 2009.
Mayo, J., and Y. Otsuka (1991): “Demand, Pricing, and Regulation: Evidence from the Cable
TV Industry,” Rand Journal of Economics, 22(3), 396–410.
Mussa, M., and S. Rosen (1978): “Monopoly and Product Quality,” Journal of Economic Theory,
18(2), 301–17.
Nalebuff, B. (2004): “Bundling as an Entry Barrier,” Quarterly Journal of Economics, 119(1),
159–187.
NCTA (2005a): “NCTA Industry Overview,” Discussion paper, National Cable Television Associ-
ation, Available at http://www.ncta.com/Docs/PageContent.cfm?pageID=86.
(2005b): “NCTA Industry Overview: Broadband Deployment,”
Discussion paper, National Cable Television Association, Available at
http://www.ncta.com/ContentView.aspx?contentId=59.
(2005c): “NCTA Industry Overview: Cable Networks,” Discussion paper, National Cable
Television Association, Available at http://www.ncta.com/ContentView.aspx?contentId=63.
(2005d): “NCTA Industry Overview: Revenue From Customers,”
Discussion paper, National Cable Television Association, Available at
http://www.ncta.com/Docs/PageContent.cfm?pageID=309.
(2013a): “Cable Advertising Revenue, 1999-2011,” Discussion paper, National Cable Tele-
vision Association, Available at http://www.ncta.com/Stats/AdvertisingRevenue.aspx. Accessed
January 10, 2013.
(2013b): “Cable Industry Revenue, 1996-2011,” Discussion paper, National Cable Tele-
vision Association, Available at http://www.ncta.com/Stats/CustomerRevenue.aspx. Accessed
January 10, 2013.
(2013c): “NCTA Industry Overview: Infrastructure Expendi-
tures,” Discussion paper, National Cable Television Association, Available at
http://www.ncta.com/Stats/InfrastructureExpense.aspx. Accessed January 13, 2013.
53
Nevo, A. (2000): “Mergers with Differentiated Products: The Case of the Ready-To-Eat Cereal
Industry,” RAND Journal of Economics, 31(3), 395–421.
Nevo, A. (2001): “Measuring Market Power in the Ready-To-Eat Cereal Industry,” Econometrica,
69(2), 307–342.
Noll, R., M. Peck, and J. McGowan (1973): Economic Aspects of Television Regulation.
Brookings Institution.
OECD (2001): “The Development of Broadband Access in OECD Countries,” Discussion paper,
Organization for Economic Cooperation and Development, DSTI/ICCP/TISP(2001)2/FINAL.
Petrin, A. (2003): “Quantifying the Benefits of New Products: The Case of the Minivan,” Journal
of Political Economy, 110(4), 705–729.
Prager, R. (1990): “Firm Behavior in Franchise Monopoly Markets,” Rand Journal of Economics,
21(2), 211–225.
(1992): “The Effects of Deregulating Cable Television: Evidence from Financial Markets,”
Journal of Regulatory Economics, 4(4), 347–363.
Raskovich, A. (2003): “Pivotal Buyers and Bargaining Position,” Journal of Industrial Eco-
nomics, 51(4), 405–426.
Rennhoff, A. D., and K. Serfes (2008): “Estimating the Effects of a la Carte Pricing: The
Case of Cable Television,” SSRN eLibrary.
Rey, P., and J. Tirole (2007): “A Primer on Foreclosure,” in Handbook of Industrial Organiza-
tion, ed. by M. Armstrong, and R. Porter, vol. 3, chap. 33. North-Holland, Amsterdam.
Roettgers, J. (2013): “Dishs new second-screen app looks good, which should worry its competi-
tion,” Gigaom (Website), Available at http://gigaom.com/2013/01/06/dish-second-screen-app/,
accessed January 6, 2013.
Rose, N. (1985): “The Incidence of Regulatory Rents in the Motor Carrier Industry,” Rand Journal
of Economics, 16(3), 299–318.
Rubinovitz, R. (1993): “Market Power and Price Increases for Basic Cable Service Since Dereg-
ulation,” Rand Journal of Economics, 24(1), 1–18.
Schatz, A. (2005): “FCC Unanimously Approves Deregulation of DSL Service,” Wall Street
Journal, August 5, 2005.
Schatz, A., J. Drucker, and D. Searcy (2005): “Small Internet Providers Can’t Use Cable
Lines; Is Wireless the Answer?,” Wall Street Journal, June 28, 2005.
54

Schiesel, S. (2001): “In Cable TV, Programmers Provide a Power Balance,” New York Times,
July 16, 2001.
Schwert, G. (1981): “Using Financial Data to Measure the Effects of Regulation,” Journal of
Law and Economics, 24(1), 121–158.
Shcherbakov, A. (2010): “Measuring consumer switching costs in the television industry,”
mimeo., Yale University.
Spence, A. M. (1975): “Monopoly, Quality, and Regulation,” Bell Journal of Economics, 6(2),
417–29.
Stigler, G. J. (1968): “A Note on Block Booking,” in The Organization of Industry, ed. by
G. Stigler. Richard D. Irwin.
Waterman, D. H., and A. A. Weiss (1996): “The Effects of Vertical Integration between Cable
Television Systems and Pay Cable Networks,” Journal of Econometrics, 72(1-2), 357–95.
(1997): Vertical Integration in Cable Television. MIT Press and AEI Press.
Whinston, M. (1990): “Tying, Foreclosure, and Exclusion,” American Economic Review, 80(4),
837–859.
Wildman, S., and B. Owen (1985): “Program Competition, Diversity, and Multichannel
Bundling in the New Video Industry,” in Video Media Competition: Regulation, Economics,
and Technology, ed. by E. M. Noam. Columbia University Press.
Zupan, M. A. (1989a): “The Efficacy of Franchise Bidding Schemes in the Case of Cable Television
: Some Systematic Evidence,” Journal of Law and Economics, 32(1), 401–36.
(1989b): “Non-price Concessions and the Effect of Franchise Bidding Schemes on Cable
Company Costs,” Applied Economics, 21(3), 305–323.
55

Table 1: Growth Rates in Cable and Satellite Prices by Period
Cable andPeriod Satellite CPI Nondurable CPI Difference
12/86 - 4/93 8.99 4.38 4.615/93 - 11/94 -2.34 1.11 -3.4512/94 - 12/05 5.07 2.50 2.571/06 - 11/12 2.42 3.09 -0.67
Source: Bureau of Labor Statistics
56

Table 2: Growth Rates in MVPD Subscribers by Period
TotalCable Satellite Telco Total
Subscriber Subscriber Subscriber IndustryPeriod CAGR CAGR CAGR CAGR
1987-1993 5.0 5.11994-1995 4.2 5.91996-2005 0.5 29.0 3.82006-2010 -1.7 3.5 87.2 1.3
Source: FCC (2001c), FCC (2002b), FCC (2002c), FCC (2004b), FCC (2005b), FCC (2006c), FCC (2009b), FCC
(2012c)
57

Table 3: Advanced Cable Services
Digital Programming Broadband Access Telephone Service
Percent Percent Percent Percent Percent PercentYear Offered Subscribed Offered Subscribed Offered Subscribed
1998 16.8 2.1 19.3 0.8 0.21999 30.0 7.3 26.6 2.2 0.42000 58.1 12.8 45.4 6.0 1.52001 77.6 21.7 70.8 10.9 2.22002 88.3 29.0 69.8 17.4 3.82003 34.1 25.0 4.52004 97.3 38.4 94.8 31.8 5.72005 43.6 38.8 9.02006 49.9 44.3 14.52007 57.2 55.0 23.02008 63.4 61.7 30.82009 68.6 67.3 35.72010 74.7 74.2 40.0
Source: FCC (1999), FCC (2000a), FCC (2001a), FCC (2002a), FCC (2003), FCC (2005a), NCTA (2005b), FCC
(2006a), FCC (2009a), FCC (2011), FCC (2012a), FCC (2012b).
58
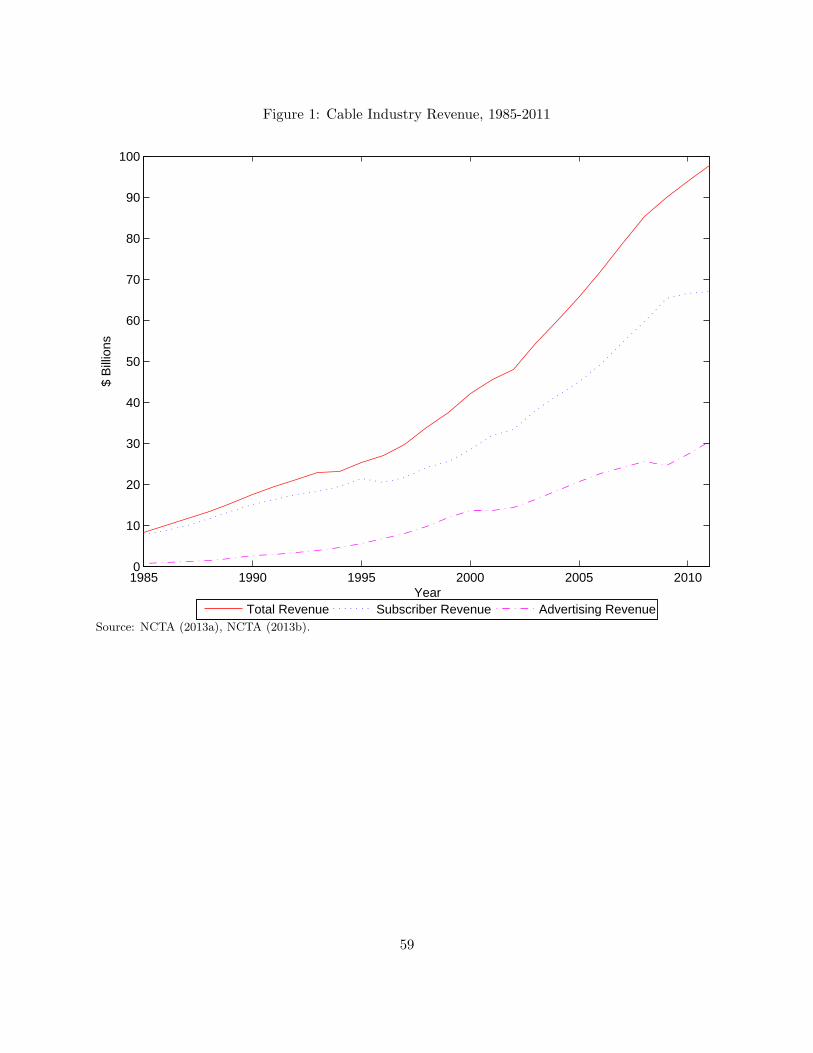
Figure 1: Cable Industry Revenue, 1985-2011
1985 1990 1995 2000 2005 20100
10
20
30
40
50
60
70
80
90
100
Year
$ B
illio
ns
Total Revenue Subscriber Revenue Advertising RevenueSource: NCTA (2013a), NCTA (2013b).
59

Table 4: Noncompetitive and Competitive Cable Systems
Basic &Exp. Basic Price per
Year Prices Channels Channel
Facing Facing Facing Facing Facing FacingNoncomp. Wireline DBS Noncomp. Wireline DBS Noncomp. Wireline DBSSystems Comp. Comp. Systems Comp. Comp. Systems Comp. Comp.
Levels
1998 $29.97 $29.46 $31.40 48.8 49.9 31.9 0.61 0.59 0.981999 $31.70 $30.82 $31.73 51.1 50.6 35.1 0.62 0.61 0.902000 $34.11 $33.74 $33.23 54.8 56.5 38.6 0.62 0.60 0.86
2001 $37.13 $34.03 $37.13 59.3 56.0 53.3 0.63 0.61 0.702002 $40.26 $37.61 $37.05 62.7 60.9 53.9 0.64 0.62 0.692003 $43.14 $37.14 $42.32 67.3 71.5 67.7 0.64 0.52 0.632004 $45.56 $38.67 $43.95 70.1 75.3 70.5 0.65 0.51 0.622005 $47.71 $40.23 $47.76 70.3 73.9 70.2 0.68 0.54 0.68
2006 $50.29 $42.91 $51.37 70.6 74.9 73.9 0.71 0.57 0.702007 $51.66 $47.19 $52.11 72.5 75.5 72.3 0.71 0.63 0.722008 $53.72 $49.40 $53.36 72.8 76.1 72.4 0.74 0.65 0.742009 $55.55 $56.85 $57.43 77.7 85.8 77.4 0.71 0.66 0.742010 $57.59 $58.54 $59.29 111.6 138.0 125.4 0.52 0.42 0.472011 $60.47 $61.17 $63.97 120.4 130.7 129.9 0.50 0.47 0.49
Relative to Noncompetitive Systems
1998 -1.7 4.8 2.3 -34.6 -3.9 60.31999 -2.8 0.1 -1.0 -31.3 -1.8 45.72000 -1.1 -2.6 3.1 -29.6 -4.1 38.3
2001 -8.3 0.0 -5.6 -10.1 -3.0 11.32002 -6.6 -8.0 -2.9 -14.0 -3.8 7.12003 -13.9 -1.9 6.2 0.6 -19.0 -2.52004 -15.1 -3.5 7.4 0.6 -21.0 -4.12005 -15.7 0.1 5.1 -0.1 -19.8 0.2
2006 -14.7 2.1 6.1 4.7 -19.6 -2.42007 -8.7 0.9 4.1 -0.3 -12.3 1.22008 -8.0 -0.7 4.5 -0.5 -12.0 -0.12009 2.3 3.4 10.4 -0.4 -7.3 3.82010 1.6 3.0 23.7 12.4 -17.8 -8.42011 1.2 5.8 8.6 7.9 -6.8 -1.9
2001-2011Average -7.8 0.1 6.2 0.1 -12.9 0.4
Source: FCC (2000a), FCC (2001a), FCC (2002a), FCC (2003), FCC (2005a), FCC (2006a), FCC (2009a), FCC
(2011), FCC (2012a), FCC (2012b)
60

Table 5: MVPD Subscribers
Subscribers Share of(millions) MVPD Subscribers
TotalYear Cable Satellite Telco MVPD Cable Satellite Telco1993 57.2 0.1 57.3 99.8 0.21994 59.7 0.6 60.3 99.0 1.01995 62.1 2.2 64.3 96.6 3.41996 63.5 4.3 67.8 93.7 6.31997 64.2 5.0 69.2 92.8 7.21998 65.4 7.2 72.6 90.1 9.91999 66.7 10.1 76.8 86.8 13.22000 66.3 13.0 79.3 83.6 16.42001 66.7 16.1 82.8 80.6 19.42002 66.5 18.2 84.7 78.5 21.52003 66.1 20.4 86.5 76.4 23.62004 66.1 23.2 89.3 74.0 26.02005 65.4 26.1 91.5 71.5 28.52006 65.3 28.0 0.3 93.6 69.8 29.9 0.32007 64.9 30.6 1.3 96.8 67.0 31.6 1.32008 63.7 31.3 3.1 98.1 64.9 31.9 3.22009 62.1 32.6 5.1 99.8 62.2 32.7 5.12010 59.8 33.3 6.9 100.0 59.8 33.3 6.9
Source: FCC (2001c), FCC (2002b), FCC (2002c), FCC (2004b), FCC (2005b), FCC (2006c), FCC (2009b), FCC
(2012c)
61

Table 6: Concentration in the MVPD Market1992 1997 2000
Market Market MarketRank Company Share Company Share Company Share
1 TCI 27.3 TCI 25.5 AT&T 19.12 TimeWarner 15.3 TimeWarner 16.0 TimeWarner 14.93 Continental 7.5 MediaOne 7.0 DirecTV 10.34 Comcast 7.1 Comcast 5.8 Comcast 8.45 Cox 4.7 Cox 4.4 Charter 7.46 Cablevision 3.5 Cablevision 3.9 Cox 7.37 TimesMirror 3.3 DirecTV 3.6 Adelphia 5.98 Viacom 3.1 Primestar 2.4 EchoStar (Dish) 5.19 Century 2.5 Jones 2.0 Cablevision 4.3
10 Cablevision 2.5 Century 1.6 Insight 1.2
Top 4 57.2 Top 4 54.3 Top 4 52.7Top 8 71.8 Top 8 68.6 Top 8 78.4Top 25 —- Top 25 84.9 Top 25 89.8
2004 2007 2010
Market Market MarketRank Company Share Company Share Company Share
1 Comcast 23.4 Comcast 24.7 Comcast 22.62 DirecTV 12.1 DirecTV 17.2 DirecTV 19.03 TimeWarner 11.9 EchoStar (Dish) 14.1 EchoStar (Dish) 14.04 EchoStar (Dish) 10.6 TimeWarner 13.6 TimeWarner 12.35 Cox 6.9 Cox 5.5 Cox 4.96 Charter 6.7 Charter 5.3 Charter 4.57 Adelphia 5.9 Cablevision 3.2 Verizon FiOS 3.58 Cablevision 3.2 Bright 2.4 Cablevision 3.39 Bright 2.4 Suddenlink 1.3 AT&T Uverse 3.0
10 Mediacom 1.7 Mediacom 1.3 Bright 2.2
Top 4 58.0 Top4 69.6 Top4 68.0Top 8 80.7 Top8 86.0 Top8 84.0Top 25 90.4 Top 25 —- Top 25 —-
Source: FCC (1997), FCC (1998c), FCC (2001c), FCC (2005b), FCC (2012c)
62
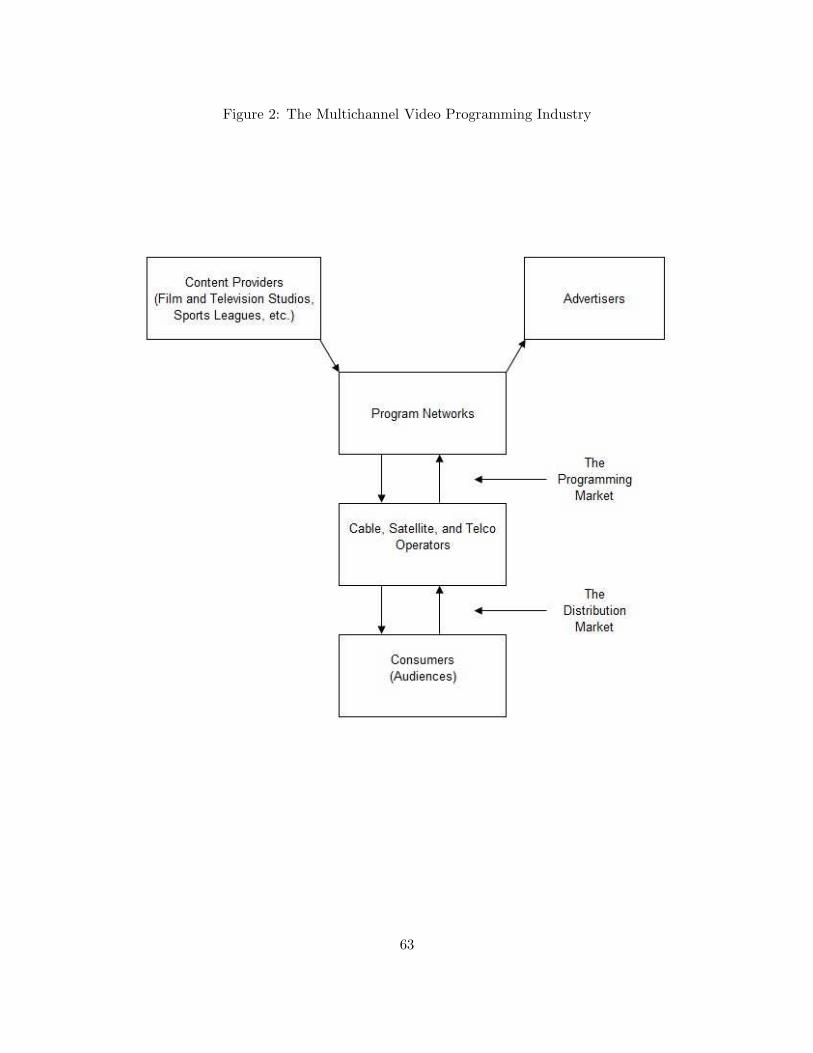
Figure 2: The Multichannel Video Programming Industry
63

Figure 3: Cable Industry Infrastructure Investment, 1996-2011
0.0
2.0
4.0
6.0
8.0
10.0
12.0
14.0
16.0
18.0
1996 1997 1998 1999 2000 2001 2002 2003 2004 2005 2006 2007 2008 2009 2010 2011
$ b
illi
on
Year
Source: NCTA (2013c).
64
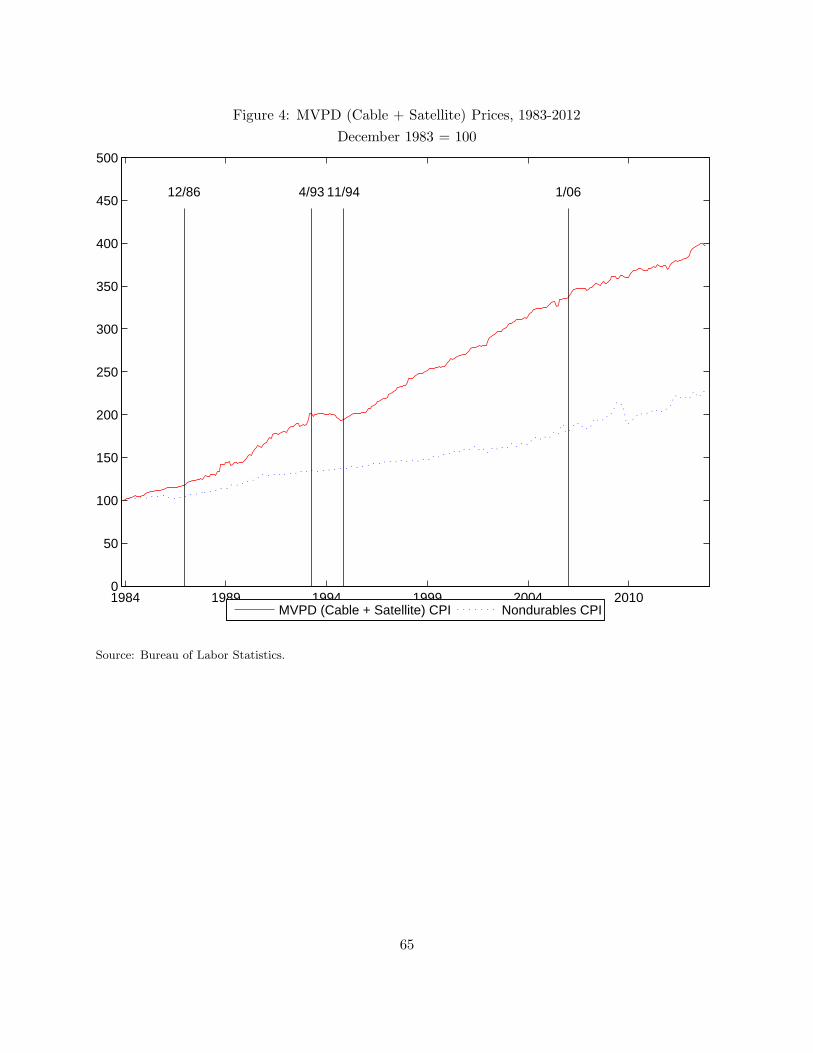
Figure 4: MVPD (Cable + Satellite) Prices, 1983-2012
December 1983 = 100
1984 1989 1994 1999 2004 20100
50
100
150
200
250
300
350
400
450
500
12/86 4/93 11/94 1/06
MVPD (Cable + Satellite) CPI Nondurables CPI
Source: Bureau of Labor Statistics.
65

Figure 5: MVPD Subscribers, 1983-2010
1985 1990 1995 2000 2005 20100
10
20
30
40
50
60
70
80
90
100
110
Year
Mill
ion
s
Total MVPD Subscribers Cable Subscribers Satellite Subscribers Telco Subscribers
Source: Hazlett and Spitzer (1997), FCC (2001c), FCC (2004b), FCC (2005b), FCC (2006c), FCC (2009b), FCC
(2012c)
66
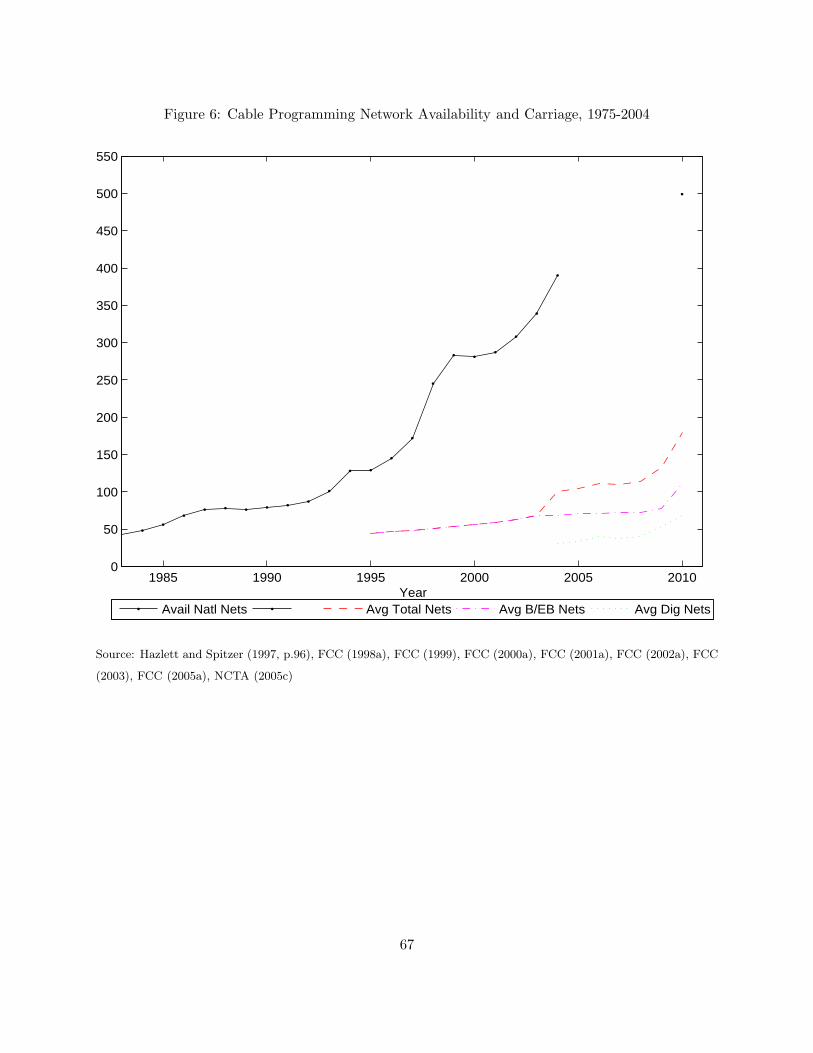
Figure 6: Cable Programming Network Availability and Carriage, 1975-2004
1985 1990 1995 2000 2005 20100
50
100
150
200
250
300
350
400
450
500
550
Year
Avail Natl Nets Avg Total Nets Avg B/EB Nets Avg Dig Nets
Source: Hazlett and Spitzer (1997, p.96), FCC (1998a), FCC (1999), FCC (2000a), FCC (2001a), FCC (2002a), FCC
(2003), FCC (2005a), NCTA (2005c)
67
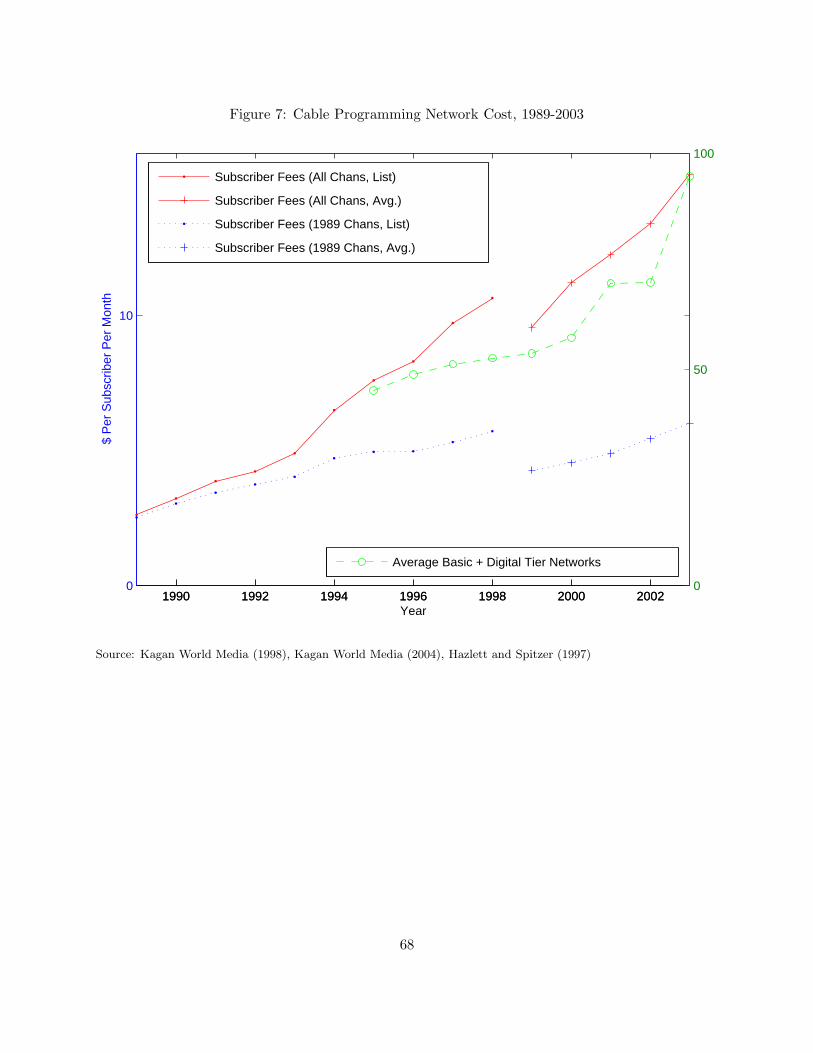
Figure 7: Cable Programming Network Cost, 1989-2003
1990 1992 1994 1996 1998 2000 20020
10
Year
$ P
er S
ubsc
riber
Per
Mon
th
1990 1992 1994 1996 1998 2000 20020
50
100
Subscriber Fees (All Chans, List)
Subscriber Fees (All Chans, Avg.)
Subscriber Fees (1989 Chans, List)
Subscriber Fees (1989 Chans, Avg.)
Average Basic + Digital Tier Networks
Source: Kagan World Media (1998), Kagan World Media (2004), Hazlett and Spitzer (1997)
68

Figure 8: Premium Subscribers and Subscriptions, 1990-2003
1990 1992 1994 1996 1998 2000 20020
10
20
30
40
50
60
70
80
90
Year
Mill
ions
Premium Subscribers (Pay Households) Premium Subscriptions (Pay Units)
Source: FCC (1998b), FCC (2004b), FCC (2005b)
69
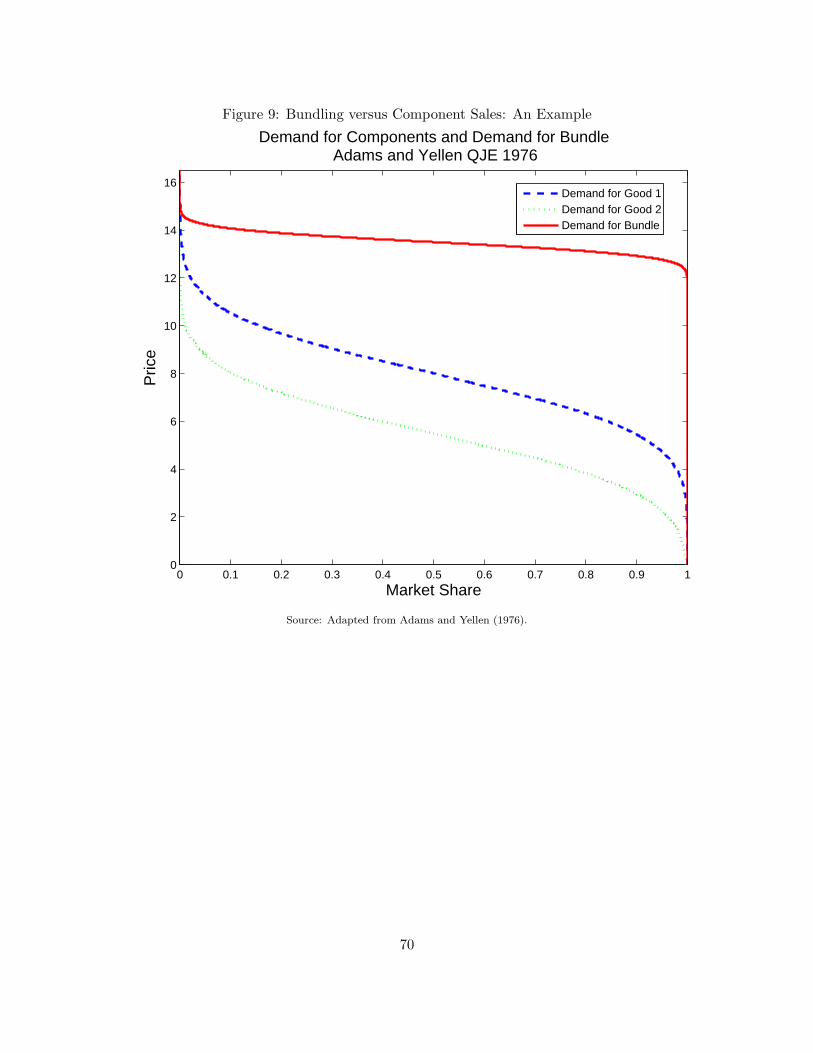
Figure 9: Bundling versus Component Sales: An Example
0 0.1 0.2 0.3 0.4 0.5 0.6 0.7 0.8 0.9 10
2
4
6
8
10
12
14
16
Market Share
Pric
eDemand for Components and Demand for Bundle
Adams and Yellen QJE 1976
Demand for Good 1Demand for Good 2Demand for Bundle
Source: Adapted from Adams and Yellen (1976).
70

Figure 10: Bundling to Deter Entry
1
1
0
B
A
0.5
x-pe
x
pe
Figure 2
Entrant’s market area
Source: Nalebuff (2004).
71