Chapter 6 and 7 Practice Test - Ms Jeong Webpage -...
49
Chapter 6 and 7 Practice Test Multiple Choice Identify the choice that best completes the statement or answers the question. ____ 1. Which set of ordered pairs does not represent a function? i) ii) iii) iv) a. i b. ii c. iv d. iii ____ 2. Identify the domain of this relation. a. c. b. d. ____ 3. Identify the range of this relation. 1 3 6 8 9 –2 0 3 5 a. c. b. d. ____ 4. For the function , determine . a. 7 b. 2 c. 14 d. 3 ____ 5. For the function , determine x when . a. 83 b. –67 c. 11 d. –11 ____ 6. Write as an equation in two variables. a. c. b. d. ____ 7. Joshua went on a bike ride. During the ride, he stopped to play at a park, as shown by line segment CD. How much time did Joshua spend at the park?
Transcript of Chapter 6 and 7 Practice Test - Ms Jeong Webpage -...

Chapter 6 and 7 Practice Test
Multiple Choice
Identify the choice that best completes the statement or answers the question.
____ 1. Which set of ordered pairs does not represent a function?
i)
ii)
iii)
iv)
a. i b. ii c. iv d. iii
____ 2. Identify the domain of this relation.
a. c.
b. d.
____ 3. Identify the range of this relation.
1
3
6
8
9
–2
0
3
5
a. c.
b. d.
____ 4. For the function , determine .
a. 7 b. 2 c. 14 d. 3
____ 5. For the function , determine x when .
a. 83 b. –67 c. 11 d. –11
____ 6. Write as an equation in two variables. a. c. b. d.
____ 7. Joshua went on a bike ride. During the ride, he stopped to play at a park, as shown by line segment CD. How much time did Joshua spend at the park?

Time (min)
Dis
tan
ce f
rom
ho
me (
km
)
Joshua's Bike Ride
O
A
B
C D
E
20 40 60 80 100 120
1
2
3
4
5
a. 65 min. b. 75 min. c. 70 min. d. 80 min.
____ 8. A person in a car drives away from a stop sign, cruises at a constant speed, and then slows down as she approaches another stop sign. Which graph best represents this situation?
a.
Time (min)
Sp
eed
(km
/h)
c.
Time (min)
Sp
eed
(km
/h)
b. d.

Time (min)
Sp
eed
(km
/h)
Time (min)
Sp
eed
(km
/h)
____ 9. This graph shows the free-fall speed of a skydiver as a function of time. At what speed was the skydiver travelling 10 s before she reached the ground?
Time (s)
Sp
eed
(km
/h)
Free-Fall Speed of a Skydiver
O
A B
C
D
E
5 10 15 20 25 30 35 40 45 50 55 60 65
40
80
120
160
a. 20 km/h b. 140 km/h c. 30 km/h d. 10 km/h
____ 10. Which graph best represents the cost of renting a kayak as a function of time?
a. c.

Time (h)
Co
st
($)
Renting a Kayak
Time (h)
Co
st
($)
Renting a Kayak
b.
Time (h)
Co
st
($)
Renting a Kayak
d.
Time (h)
Co
st
($)
Renting a Kayak
____ 11. Which of these graphs represents a function? i) ii)
x
y
x
y
iii) iv)

x
y
x
y
a. ii b. i c. iii d. iv
____ 12. Which of these graphs represents a function? i) ii)
x
y
x
y
iii) iv)
x
y
x
y
a. iv b. ii c. i d. iii
____ 13. Determine the domain and range of the graph of this function.

y = f(x)
0 2 4–2–4 x
2
4
–2
–4
–6
y
a. c.
b. d.
____ 14. This graph shows the masses of people, m, as a function of age, a. Determine the range of the graph.
Age (years)
Mass (
kg
)
Ages and Masses of People
0 4 8 12 16 20 a
20
40
60
80
100m
a. c.
b. d.
____ 15. This is a graph of the function . Determine the range value when the domain value is 2.

g(x) = –2x + 3
0 2 4–2–4 x
2
4
–2
–4
y
a. 0.5 b. 7 c. –1 d. 1
____ 16. This is a graph of the function . Determine the domain value when the range value is –4.
g(x) = –3x + 2
0 2 4–2–4 x
2
4
–2
–4
y
a. –2 b. 0.5 c. 11 d. 2
____ 17. This graph represents a 150-L hot-water tank being filled at a constant rate. Determine the rate of change of the relation.
Time (min)
Vo
lum
e (
L)
Filling a Hot-Water Tank
(25, 75)
(50, 150)
0 10 20 30 40 50 t
25
50
75
100
125
150
175V
a. 25 L/min c. 75 L/min b. 3 L/min d. 0.33 L/min
____ 18. Which equation does not represent a linear relation?

i)
ii) iii)
iv)
a. iii b. ii c. i d. iv
____ 19. This graph shows distance, d kilometres, as a function of time, t minutes. Determine the vertical and horizontal intercepts.
Time (min)
Dis
tan
ce (
km
)
d = f(t)
20 40 60 80 100 120 t
20
40
60
80
100
d
a. Vertical intercept: 80
Horizontal intercept: 96
c. Vertical intercept: 96 Horizontal intercept: 80
b. Vertical intercept: 64 Horizontal intercept: 96
d. Vertical intercept: 80 Horizontal intercept: 64
____ 20. Which graph represents the linear function ?
a.
0 2 4–2–4 x
2
4
–2
–4
y
c.
0 2 4–2–4 x
2
4
–2
–4
y
b. d.

0 2 4–2–4 x
2
4
–2
–4
y
0 2 4–2–4 x
2
4
–2
–4
y
____ 21. The graph shows the cost of hosting an anniversary party. What is the maximum number of people who can attend the party for a cost of $1500?
Cost of an Anniversary Party
Co
st
($)
Number of people
010 20 30 40 50 60 n
300
600
900
1200
1500
1800
2100
C
a. 61 people c. 33 people b. 38 people d. 27 people
____ 22. This graph shows the cost of a taxi ride. The cost, C dollars, is a function of the duration of the ride, t min. What is the duration of the ride when the cost is $35?

Time (min)
Co
st
($)
Cost of a Taxi Ride
010 20 30 40 50 60 70 t
10
20
30
40
50
C
a. 45 min c. 50 min b. 58 min d. 53 min
____ 23. Determine the slope of this line segment.
0
A
B
2 4–2–4 x
2
4
–2
–4
y
a.
−
2
3
c. 2
3
b. −
3
2
d. 3
2
____ 24. Determine the slope of the line that passes through G(3, –3) and H(–5, 9).
a. 3
2
c. 2
3
b. −
2
3
d. −
3
2
____ 25. Is the slope of this line segment positive, negative, zero, or not defined?

0
S
T
4 8–4–8 x
4
8
–4
–8
y
a. zero c. not defined b. positive d. negative
____ 26. Determine the steepness of this roof by calculating its slope.
rise
run
a.
−
5
3
c. 3
5
b. 5
3
d. −
3
5
____ 27. A straight section of an Olympic downhill ski course is 34 m long. It drops 16 m in height. Determine the slope of this part of the course. a.
c.
b.
d.
____ 28. A line has x-intercept 2 and y-intercept 6? Determine the slope of the line. a. 1
3
c. −3
b. 3 d. −
1
3
____ 29. Which of these line segments are parallel?

0A
B
E
F
C
D
G
H
2 4–2–4 x
2
4
–2
–4
y
a. CD and EF c. AB and CD b. EF and GH d. AB and EF
____ 30. Determine the slope of the line that is perpendicular to this line segment.
0
A
B
2 4–2–4 x
2
4
–2
–4
y
a. 3 c. 1
3
b. –3 d. –
1
3
____ 31. Determine the slope of the line that is parallel to this line segment.

0
K
X
2 4–2–4 x
2
4
–2
–4
y
a.
–3
7
c. 3
7
b. 7
3
d. –
7
3
____ 32. Determine the slope of a line that is perpendicular to the line through W(–9, 7) and X(6, –10). a.
−
15
17
c. –15
b. −
17
15
d. 15
17
____ 33. Determine the slope of a line that is parallel to the line through L(–6, 3) and K(12, –9). a. 2
3
c. −
2
3
b. 3
2
d. −
3
2
____ 34. Write an equation for the graph of a linear function that has slope and y-intercept –3.
a.
c.
b.
d.
____ 35. Which graph represents the equation ?
a. c.

0 2 4–2–4 x
2
4
–2
–4
y
0 2 4–2–4 x
2
4
–2
–4
y
b.
0 2 4–2–4 x
2
4
–2
–4
y
d.
0 2 4–2–4 x
2
4
–2
–4
y
____ 36. For a service call, a plumber charges a $95 initial fee, plus $45 for each hour he works. Write an equation to represent the total cost, C dollars, for t hours of work. a. c. b. d.
____ 37. Which graph has slope 1 and y-intercept 0?
a. c.

0 2 4–2–4 x
2
4
–2
–4
y
0 2 4–2–4 x
2
4
–2
–4
y
b.
0 2 4–2–4 x
2
4
–2
–4
y
d.
0 2 4–2–4 x
2
4
–2
–4
y
____ 38. Describe the graph of the linear function with this equation:
a. The graph is a line through (–2, 3) with slope .
b. The graph is a line through (2, ) with slope .
c. The graph is a line through (2, ) with slope .
d. The graph is a line through (–2, 3) with slope .
____ 39. Write an equation for the graph of a linear function that has slope 8 and passes through R(4, ). a.
b.
c.
d.
____ 40. Which graph represents the equation ?

a.
0 2 4–2–4 x
2
4
–2
–4
y
c.
0 2 4–2–4 x
2
4
–2
–4
y
b.
0 2 4–2–4 x
2
4
–2
–4
y
d.
0 2 4–2–4 x
2
4
–2
–4
y
____ 41. Write an equation in slope-point form for this line.
0 2 4–2–4 x
2
4
–2
–4
y
a.
c.

b.
d.
____ 42. Write this equation in slope-intercept form:
a.
13
5
c.
13
5
b.
13
5
d.
13
5
____ 43. Determine the y-intercept of the graph of this equation:
a. c. b. 13 d. 3
____ 44. Write an equation in slope-point form for the line that passes through A(1, 4) and B(6, 8). a.
c.
b.
d.
____ 45. Write this equation in general form:
a. c.
b. d.
____ 46. Write this equation in general form:
a. c.
b. d.
____ 47. Determine the x-intercept and the y-intercept for the graph of this equation:
a. x-intercept: 18; y-intercept: 12 c. x-intercept: 18; y-intercept: b. x-intercept: ; y-intercept: d. x-intercept: ; y-intercept: 12
____ 48. Which equation is written in general form? a. c.
b. d.
____ 49. Which graph represents the equation ?
a. c.

0 2 4–2–4 x
2
4
–2
–4
y
0 2 4–2–4 x
2
4
–2
–4
y
b.
0 2 4–2–4 x
2
4
–2
–4
y
d.
0 2 4–2–4 x
2
4
–2
–4
y
____ 50. Write this equation in slope-intercept form:
a. y =
10
3x +
4
3
c. y =
10
3x –
4
3
b. y = –
10
3x +
4
3
d. y = –
10
3x – 4
____ 51. Which equation is equivalent to ?
a.
c.
b.
d.
____ 52. A line has x-intercept –9 and y-intercept 3. Determine the equation of the line in general form. a. c.
b. d.
____ 53. Jon has x egg cartons that hold 12 eggs and y egg cartons that hold 18 eggs. He uses these cartons to store 72 eggs. Which equation represents the relation? a. c.
b. d.

Short Answer
54. Consider the relation represented by this set of ordered pairs.
Describe the relation in words.
55. Different coloured game pieces can be associated with their lengths, in centimetres. Consider the relation
represented by this arrow diagram. Represent the relation as a graph.
Red
Black
Yellow
Green
White
5
7
10
12
has a length (cm) of
Blue
56. For the function , determine .
57. For the function , determine x when .
58. a) Write in function notation:
b) Write as an equation in two variables:
59. Natasha spent part of the afternoon running errands. This graph shows her distance from home as a function
of time.

Time (min)
Dis
tan
ce f
rom
ho
me (
km
)
Natasha's Drive
O
A
B
C D
E
5 10 15 20 25 30 35 40 45 50 55 60 65 70 75 80 85 90 95 100105110115
1
2
3
4
5
6
7
8
a) How far did Natasha drive in total? b) How long was Natasha away from home?
60. This table shows the refund, r dollars, for different numbers of juice tetra paks, n. Is this relation a function?
Explain.
Number of Juice Tetra Paks, n
Refund, r ($)
5 0.25
12 0.60
17 0.85
24 1.20
30 1.50
61. Which equations represent linear relations? Create tables of values if necessary.
a) d)
b) e)
c) f)
62. Determine the vertical and horizontal intercepts of this graph.
0
y = f(x)
2 4–2–4 x
2
4
–2
–4
y

63. Determine the rate of change and the vertical intercept of this graph.
0
y = f(x)
2 4–2–4 x
2
4
–2
–4
y
64. This graph shows the cost, C dollars, of printing an advertising flyer for the school play as a function of the
number of flyers printed, n. What is the cost when 1000 flyers are printed?
Number of flyers (100s)
Co
st
($)
Flyers for the School Play
0 4 8 12 16 20 n
100
200
300
400
500 C
65. This graph shows cost, C dollars, as a function of time, t hours. What is the time when the cost is $35?

Time (h)
Co
st
($)
0
C = f(t)
1 2 3 4 t
10
20
30
40
50
60
C
66. A line has x-intercept –8 and y-intercept 5. Determine the slope of a line perpendicular to this line.
67. For each equation, identify the slope and y-intercept of its graph.
i)
ii)
iii)
68. Write an equation for the line that passes through E(–3, –7) and F(2, 10). Write the equation in slope-point
form and in slope-intercept form.
69. Write this equation in general form:
70. Determine the slope of the line of this equation:
Problem
71. A relation contains 5 elements in the domain and 6 elements in the range. Can this relation be a function?
Justify your answer.
72. A gas station attracts customers by offering coupons worth $0.03 for every $1.00 spent on gasoline.
Value of Gas Purchase, v
($)
Value of Coupons, c
($)
1
2

0.36
20
1.20
50
a) Use function notation to express c as a function of v. b) Copy and complete the table. c) What is the value of the coupons a customer will receive if she spends $80 on gasoline? d) How much does a customer have to spend on gasoline to receive $5.00 in coupons?
73. This table shows the speed of a hot air balloon at different time intervals after lift off. A student drew a graph
to represent the data in the table.
Time, t (s)
Speed, S (m/s)
0 0
1 2.4
2 5.6
3 10.0
4 12.4
6 15.0
9 16.1
10 16.1
Time (s)
Sp
eed
(m
/s)
Speed of a Hot Air Balloon
2 4 6 8 10
5
10
15
20
25
a) Describe any errors in the graph. b) Is this relation a function? Explain.
74. Four litres of latex paint covers approximately 37 m2 and costs $52.
a) Copy and complete this table.
Volume of Paint, p (L) 0 4 8 12 16
Cost, c ($) 0 52
Area Covered, A (m2) 0 37

b) Graph the area covered as a function of the volume of paint.
c) Graph the area covered as a function of the cost.
d) Write the domain and range of the functions in parts b and c.
75. a) This is a graph of the function .
Determine the range value when the domain value is 2.

f(x) = 2 x + 1
0 2 4–2–4 x
2
4
–2
–4
y
b) This is the graph of the function .
Determine the range value when the domain value is 3.
g(x) = 1 – 2x
0 2 4–2–4 x
2
4
–2
–4
y
76. A company rents paddle boats by the day. This table shows the total cost of renting a paddle boat for different
numbers of days.
Number of Days (n)
Total Cost ($)
1 $54.00
3 $112.00
5 $170.00
7 $228.00
a) Graph the relation between the total cost of the rental and the number of days.

b) Does the graph represent a linear relation? How do you know? c) Determine the rate of change, then describe what it represents.
77. The graph represents the cost of printing pamphlets.
Number of pamphlets (hundreds)
Co
st
($)
Cost of Printing Pamphlets
04 8 12 16 20 n
60
120
180
240
300
360
c
a) Identify the dependent and independent variables. b) Sohan calculated the rate of change as follows:
Change in cost:
Change in number of pamphlets: 2000 pamphlets – 500 pamphlets = 1500 pamphlets
Rate of change:
Did he calculate the rate of change correctly? Explain.

c) Describe what the rate of change represents.
78. This graph represents the relation between the distance a vehicle travels and the number of revolutions of a
tire. An equation for the distance travelled, d metres, after r revolutions of the tire is .
Distance a Car Travels
Dis
tan
ce (
m)
Number of tire revolutions
0100 200 300 400 500 600 700 r
200
400
600
800
1000
1200
1400
1600d
a) Identify the dependent and independent variables. b) Does the graph represent a linear relation? How do you know? c) Describe another strategy you could use to determine whether this relation is linear.
79. This graph shows the length, l metres, of an object’s shadow as a function of the height of the object, h
metres.

Height of object (m)
Len
gth
of
sh
ad
ow
(m
)
Length of an Object's Shadow
04 8 12 16 20 24 28 32 36 h
10
20
30
40
50
60
70l
a) What is the rate of change? What does it represent? b) A tree has height 13 m. About how long is its shadow? c) The length of the shadow of a building is 45 m. About how tall is the building?
80. Sketch a graph of the linear function .
81. This graph shows the distance, d kilometres, from Beijing, China, to Edmonton, Alberta, as a function of
flying time, t hours.
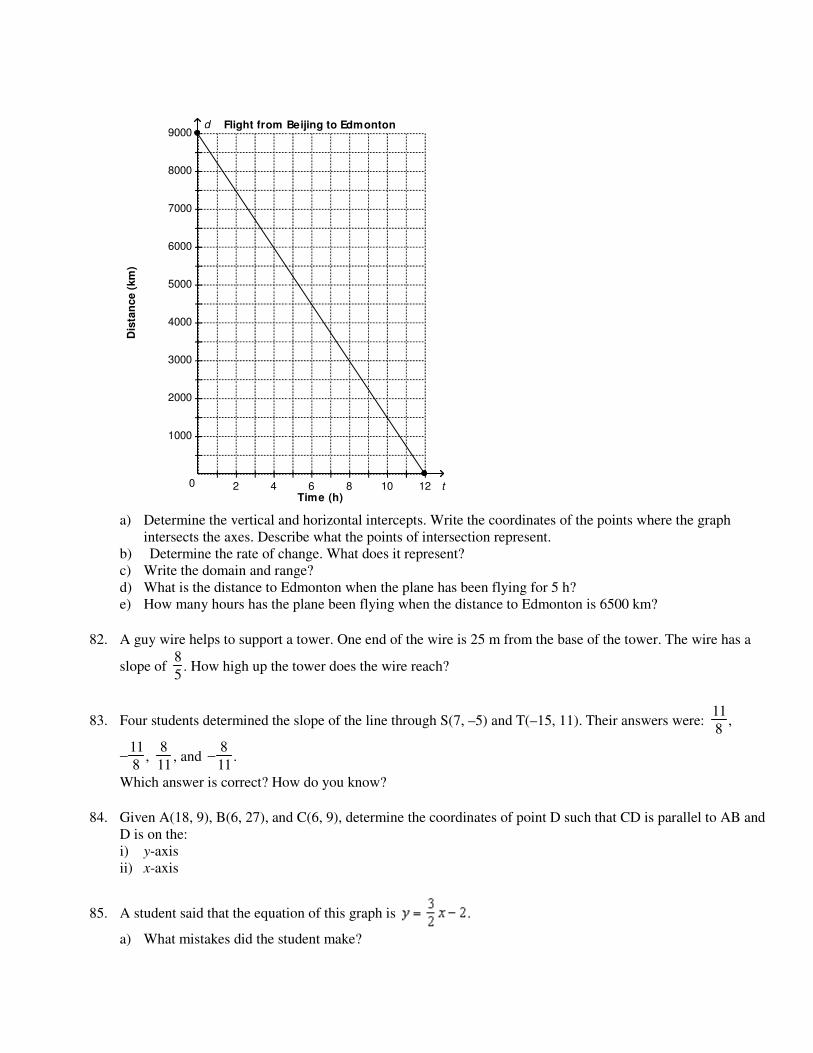
Dis
tan
ce (
km
)
Time (h)
Flight from Beijing to Edmonton
0 2 4 6 8 10 12 t
1000
2000
3000
4000
5000
6000
7000
8000
9000d
a) Determine the vertical and horizontal intercepts. Write the coordinates of the points where the graph
intersects the axes. Describe what the points of intersection represent. b) Determine the rate of change. What does it represent? c) Write the domain and range? d) What is the distance to Edmonton when the plane has been flying for 5 h? e) How many hours has the plane been flying when the distance to Edmonton is 6500 km?
82. A guy wire helps to support a tower. One end of the wire is 25 m from the base of the tower. The wire has a
slope of 8
5. How high up the tower does the wire reach?
83. Four students determined the slope of the line through S(7, –5) and T(–15, 11). Their answers were: 11
8,
−
11
8,
8
11, and −
8
11.
Which answer is correct? How do you know?
84. Given A(18, 9), B(6, 27), and C(6, 9), determine the coordinates of point D such that CD is parallel to AB and
D is on the: i) y-axis ii) x-axis
85. A student said that the equation of this graph is .
a) What mistakes did the student make?

b) What is the equation of the graph?
0 2 4–2–4 x
2
4
–2
–4
y
86. An equation of a line is . Determine the value of m when the line passes through the point J(–5, 2).
87. Francine runs a T-shirt company. For each order she receives, Francine charges a flat fee of $50, plus $8.95
per T-shirt . a) Write an equation for the total cost, C dollars, for ordering n T-shirts. b) Marnell ordered 62 T-shirts. What was the total cost? c) Jakub paid a total cost of $971.85. How many T-shirts did he order?
88. Students at Tahayghen Secondary School sell punch during the school carnival. The number of cups sold, n,
is a linear function of the temperature in degrees Celsius, t. The students sold 458 cups when the temperature was 25°C. They sold 534 cups when the temperature was 29°C. a) Write an equation in slope-point form to represent this function. b) Use the equation in part a to determine the approximate temperature when the students sell 325 cups of
punch.
89. Write an equation in general form for the line that passes through A(3, –4) and B(11, 8).
90. Graph this equation:
Describe the strategies you used.
0 4 8 12 16–4–8–12–16 x
4
8
–4
–8
y

Chapter 6 and 7 Practice Test Answer Section
MULTIPLE CHOICE
1. ANS: A PTS: 1 DIF: Easy REF: 5.2 Properties of Functions
LOC: 10.RF2 TOP: Relations and Functions KEY: Conceptual Understanding
2. ANS: C PTS: 1 DIF: Easy REF: 5.2 Properties of Functions LOC: 10.RF1 TOP: Relations and Functions KEY: Conceptual Understanding
3. ANS: C PTS: 1 DIF: Easy REF: 5.2 Properties of Functions LOC: 10.RF1 TOP: Relations and Functions KEY: Conceptual Understanding
4. ANS: C PTS: 1 DIF: Easy REF: 5.2 Properties of Functions LOC: 10.RF8 TOP: Relations and Functions KEY: Procedural Knowledge
5. ANS: C PTS: 1 DIF: Easy REF: 5.2 Properties of Functions LOC: 10.RF8 TOP: Relations and Functions KEY: Procedural Knowledge
6. ANS: B PTS: 1 DIF: Easy REF: 5.2 Properties of Functions LOC: 10.RF8 TOP: Relations and Functions KEY: Conceptual Understanding
7. ANS: C PTS: 1 DIF: Easy REF: 5.3 Interpreting and Sketching Graphs LOC: 10.RF1 TOP: Relations and Functions KEY: Conceptual Understanding
8. ANS: D PTS: 1 DIF: Moderate REF: 5.3 Interpreting and Sketching Graphs LOC: 10.RF1 TOP: Relations and Functions KEY: Conceptual Understanding
9. ANS: A PTS: 1 DIF: Easy REF: 5.3 Interpreting and Sketching Graphs LOC: 10.RF1 TOP: Relations and Functions KEY: Conceptual Understanding
10. ANS: A PTS: 1 DIF: Easy REF: 5.3 Interpreting and Sketching Graphs LOC: 10.RF1 TOP: Relations and Functions KEY: Conceptual Understanding
11. ANS: B PTS: 1 DIF: Easy REF: 5.5 Graphs of Relations and Functions LOC: 10.RF2 TOP: Relations and Functions KEY: Conceptual Understanding
12. ANS: A PTS: 1 DIF: Easy REF: 5.5 Graphs of Relations and Functions LOC: 10.RF2 TOP: Relations and Functions KEY: Conceptual Understanding
13. ANS: B PTS: 1 DIF: Easy REF: 5.5 Graphs of Relations and Functions LOC: 10.RF1 TOP: Relations and Functions KEY: Conceptual Understanding
14. ANS: D PTS: 1 DIF: Easy REF: 5.5 Graphs of Relations and Functions LOC: 10.RF1 TOP: Relations and Functions KEY: Conceptual Understanding
15. ANS: C PTS: 1 DIF: Easy REF: 5.5 Graphs of Relations and Functions LOC: 10.RF8 TOP: Relations and Functions KEY: Conceptual Understanding
16. ANS: D PTS: 1 DIF: Easy REF: 5.5 Graphs of Relations and Functions LOC: 10.RF8 TOP: Relations and Functions KEY: Conceptual Understanding
17. ANS: B PTS: 1 DIF: Easy REF: 5.6 Properties of Linear Functions

LOC: 10.RF3 TOP: Relations and Functions KEY: Procedural Knowledge
18. ANS: C PTS: 1 DIF: Moderate REF: 5.6 Properties of Linear Functions LOC: 10.RF4 TOP: Relations and Functions KEY: Procedural Knowledge
19. ANS: A PTS: 1 DIF: Easy REF: 5.7 Interpreting Graphs of Linear Functions LOC: 10.RF5 TOP: Relations and Functions KEY: Conceptual Understanding
20. ANS: A PTS: 1 DIF: Easy REF: 5.7 Interpreting Graphs of Linear Functions LOC: 10.RF5 TOP: Relations and Functions KEY: Procedural Knowledge
21. ANS: C PTS: 1 DIF: Easy REF: 5.7 Interpreting Graphs of Linear Functions LOC: 10.RF8 TOP: Relations and Functions KEY: Conceptual Understanding
22. ANS: D PTS: 1 DIF: Easy REF: 5.7 Interpreting Graphs of Linear Functions LOC: 10.RF8 TOP: Relations and Functions KEY: Conceptual Understanding
23. ANS: B PTS: 1 DIF: Easy REF: 6.1 Slope of a Line LOC: 10.RF5 TOP: Relations and Functions KEY: Procedural Knowledge
24. ANS: D PTS: 1 DIF: Easy REF: 6.1 Slope of a Line LOC: 10.RF5 TOP: Relations and Functions KEY: Procedural Knowledge
25. ANS: C PTS: 1 DIF: Easy REF: 6.1 Slope of a Line LOC: 10.RF5 TOP: Relations and Functions KEY: Conceptual Understanding
26. ANS: B PTS: 1 DIF: Easy REF: 6.1 Slope of a Line LOC: 10.RF5 TOP: Relations and Functions KEY: Procedural Knowledge
27. ANS: B PTS: 1 DIF: Moderate REF: 6.1 Slope of a Line LOC: 10.RF5 TOP: Relations and Functions KEY: Procedural Knowledge
28. ANS: C PTS: 1 DIF: Moderate REF: 6.1 Slope of a Line LOC: 10.RF5 TOP: Relations and Functions KEY: Procedural Knowledge
29. ANS: D PTS: 1 DIF: Easy REF: 6.2 Slopes of Parallel and Perpendicular Lines LOC: 10.RF3 TOP: Relations and Functions KEY: Procedural Knowledge
30. ANS: D PTS: 1 DIF: Easy REF: 6.2 Slopes of Parallel and Perpendicular Lines LOC: 10.RF3 TOP: Relations and Functions KEY: Procedural Knowledge
31. ANS: C PTS: 1 DIF: Easy REF: 6.2 Slopes of Parallel and Perpendicular Lines LOC: 10.RF3 TOP: Relations and Functions KEY: Procedural Knowledge
32. ANS: D PTS: 1 DIF: Easy REF: 6.2 Slopes of Parallel and Perpendicular Lines LOC: 10.RF3 TOP: Relations and Functions KEY: Procedural Knowledge
33. ANS: C PTS: 1 DIF: Easy REF: 6.2 Slopes of Parallel and Perpendicular Lines LOC: 10.RF3 TOP: Relations and Functions KEY: Procedural Knowledge
34. ANS: B PTS: 1 DIF: Easy REF: 6.4 Slope-Intercept Form of the Equation for a Linear Function LOC: 10.RF7 TOP: Relations and Functions KEY: Conceptual Understanding
35. ANS: B PTS: 1 DIF: Easy REF: 6.4 Slope-Intercept Form of the Equation for a Linear Function LOC: 10.RF7 TOP: Relations and Functions KEY: Conceptual Understanding
36. ANS: C PTS: 1 DIF: Easy

REF: 6.4 Slope-Intercept Form of the Equation for a Linear Function LOC: 10.RF7 TOP: Relations and Functions KEY: Conceptual Understanding
37. ANS: B PTS: 1 DIF: Easy REF: 6.4 Slope-Intercept Form of the Equation for a Linear Function LOC: 10.RF7 TOP: Relations and Functions KEY: Conceptual Understanding
38. ANS: B PTS: 1 DIF: Easy REF: 6.5 Slope-Point Form of the Equation for a Linear Function LOC: 10.RF6 TOP: Relations and Functions KEY: Conceptual Understanding
39. ANS: B PTS: 1 DIF: Easy REF: 6.5 Slope-Point Form of the Equation for a Linear Function LOC: 10.RF6 TOP: Relations and Functions KEY: Conceptual Understanding
40. ANS: C PTS: 1 DIF: Easy REF: 6.5 Slope-Point Form of the Equation for a Linear Function LOC: 10.RF6 TOP: Relations and Functions KEY: Conceptual Understanding | Procedural Knowledge
41. ANS: A PTS: 1 DIF: Easy REF: 6.5 Slope-Point Form of the Equation for a Linear Function LOC: 10.RF6 TOP: Relations and Functions KEY: Conceptual Understanding
42. ANS: A PTS: 1 DIF: Moderate REF: 6.5 Slope-Point Form of the Equation for a Linear Function LOC: 10.RF6 TOP: Relations and Functions KEY: Conceptual Understanding
43. ANS: B PTS: 1 DIF: Easy REF: 6.5 Slope-Point Form of the Equation for a Linear Function LOC: 10.RF6 TOP: Relations and Functions KEY: Conceptual Understanding | Procedural Knowledge
44. ANS: C PTS: 1 DIF: Easy REF: 6.5 Slope-Point Form of the Equation for a Linear Function LOC: 10.RF6 TOP: Relations and Functions KEY: Conceptual Understanding | Procedural Knowledge
45. ANS: A PTS: 1 DIF: Easy REF: 6.6 General Form of the Equation for a Linear Relation LOC: 10.RF6 TOP: Relations and Functions KEY: Conceptual Understanding
46. ANS: C PTS: 1 DIF: Easy REF: 6.6 General Form of the Equation for a Linear Relation LOC: 10.RF6 TOP: Relations and Functions KEY: Conceptual Understanding
47. ANS: D PTS: 1 DIF: Easy REF: 6.6 General Form of the Equation for a Linear Relation LOC: 10.RF6 TOP: Relations and Functions KEY: Conceptual Understanding | Procedural Knowledge
48. ANS: B PTS: 1 DIF: Easy REF: 6.6 General Form of the Equation for a Linear Relation LOC: 10.RF6 TOP: Relations and Functions KEY: Conceptual Understanding
49. ANS: C PTS: 1 DIF: Easy REF: 6.6 General Form of the Equation for a Linear Relation LOC: 10.RF6 TOP: Relations and Functions KEY: Conceptual Understanding | Procedural Knowledge
50. ANS: B PTS: 1 DIF: Easy REF: 6.6 General Form of the Equation for a Linear Relation LOC: 10.RF6 TOP: Relations and Functions KEY: Conceptual Understanding
51. ANS: C PTS: 1 DIF: Moderate REF: 6.6 General Form of the Equation for a Linear Relation LOC: 10.RF6

TOP: Relations and Functions KEY: Conceptual Understanding
52. ANS: C PTS: 1 DIF: Moderate REF: 6.6 General Form of the Equation for a Linear Relation LOC: 10.RF6 TOP: Relations and Functions KEY: Conceptual Understanding
53. ANS: A PTS: 1 DIF: Moderate REF: 6.6 General Form of the Equation for a Linear Relation LOC: 10.RF6 TOP: Relations and Functions KEY: Conceptual Understanding
SHORT ANSWER
54. ANS:
The relation shows the association “multiplied by 5 is” from a set of numbers to a set of numbers.
PTS: 1 DIF: Moderate REF: 5.1 Representing Relations LOC: 10.RF4 TOP: Relations and Functions KEY: Conceptual Understanding | Procedural Knowledge
55. ANS:
Red
Bla
ck
Yello
w
Gre
en
White
Lengths of Game Pieces
Len
gth
(cm
)
Blu
e
0
1
2
3
4
5
6
7
8
9
10
11
12
Colour
PTS: 1 DIF: Moderate REF: 5.1 Representing Relations LOC: 10.RF4 TOP: Relations and Functions KEY: Conceptual Understanding | Procedural Knowledge
56. ANS: –37
PTS: 1 DIF: Moderate REF: 5.2 Properties of Functions LOC: 10.RF8 TOP: Relations and Functions KEY: Procedural Knowledge
57. ANS: –30
PTS: 1 DIF: Moderate REF: 5.2 Properties of Functions LOC: 10.RF8 TOP: Relations and Functions KEY: Procedural Knowledge

58. ANS: a)
b)
PTS: 1 DIF: Easy REF: 5.2 Properties of Functions LOC: 10.RF8 TOP: Relations and Functions KEY: Conceptual Understanding
59. ANS: a) 10 km b) 115 min
PTS: 1 DIF: Moderate REF: 5.3 Interpreting and Sketching Graphs LOC: 10.RF1 TOP: Relations and Functions KEY: Conceptual Understanding
60. ANS: For each number in the first column, there is only one number in the second column. So, the relation is a function.
PTS: 1 DIF: Easy REF: 5.4 Graphing Data LOC: 10.RF2 TOP: Relations and Functions KEY: Communication | Conceptual Understanding
61. ANS: The relations in parts a, c, and f are linear.
PTS: 1 DIF: Moderate REF: 5.6 Properties of Linear Functions LOC: 10.RF4 TOP: Relations and Functions KEY: Conceptual Understanding
62. ANS: Horizontal intercept: 3 Vertical intercept: 2
PTS: 1 DIF: Easy REF: 5.7 Interpreting Graphs of Linear Functions LOC: 10.RF5 TOP: Relations and Functions KEY: Conceptual Understanding
63. ANS: Rate of change: −1; vertical intercept: 2
PTS: 1 DIF: Easy REF: 5.7 Interpreting Graphs of Linear Functions LOC: 10.RF5 TOP: Relations and Functions KEY: Procedural Knowledge
64. ANS: $200.00
PTS: 1 DIF: Easy REF: 5.7 Interpreting Graphs of Linear Functions LOC: 10.RF8 TOP: Relations and Functions KEY: Conceptual Understanding
65. ANS: 1.5 h
PTS: 1 DIF: Easy REF: 5.7 Interpreting Graphs of Linear Functions LOC: 10.RF8 TOP: Relations and Functions KEY: Conceptual Understanding
66. ANS:
–8
5
PTS: 1 DIF: Moderate REF: 6.2 Slopes of Parallel and Perpendicular Lines

LOC: 10.RF3 TOP: Relations and Functions KEY: Procedural Knowledge
67. ANS: i) slope: 5; y-intercept:
ii) slope: ; y-intercept: 9
iii) slope: ; y-intercept:
PTS: 1 DIF: Easy REF: 6.4 Slope-Intercept Form of the Equation for a Linear Function LOC: 10.RF6 TOP: Relations and Functions KEY: Conceptual Understanding
68. ANS:
or
PTS: 1 DIF: Moderate REF: 6.5 Slope-Point Form of the Equation for a Linear Function LOC: 10.RF7 TOP: Relations and Functions KEY: Conceptual Understanding | Procedural Knowledge
69. ANS:
PTS: 1 DIF: Easy REF: 6.6 General Form of the Equation for a Linear Relation LOC: 10.RF6 TOP: Relations and Functions KEY: Conceptual Understanding
70. ANS:
PTS: 1 DIF: Easy REF: 6.6 General Form of the Equation for a Linear Relation LOC: 10.RF6 TOP: Relations and Functions KEY: Conceptual Understanding
PROBLEM
71. ANS:
Sample answer: A relation is a function when each element in the domain is associated with exactly one element in the range. If there are more elements in the range than in the domain, at least one element in the domain is associated with more than one element in the range. This violates the definition of a function. Therefore, the relation is not a function.

For example:
A
B
C
D
E
3
1
2
4
5
6
PTS: 1 DIF: Difficult REF: 5.2 Properties of Functions LOC: 10.RF2 TOP: Relations and Functions KEY: Communication | Problem-Solving Skills
72. ANS: a)
b)
Value of Gas Purchase, v
($)
Value of Coupons, c
($)
1 0.03
2 0.06
12 0.36
20 0.60
40 1.20
50 1.50
c) To determine c(80), use:
c(80) is the value of c when . This means that when a customer spends $80 on gasoline, she will receive coupons valued at $2.40.
d) To determine the value of v when , use:
means that when , ; that is, a customer has to spend $166.67 on
gasoline to receive $5.00 in coupons.
PTS: 1 DIF: Difficult REF: 5.2 Properties of Functions LOC: 10.RF8 TOP: Relations and Functions KEY: Problem-Solving Skills

73. ANS: a) Since time and speed can have any numerical value between those indicated by the points on the graph,
the points on the graph should be joined. b) The relation is a function because there is only one speed for each time.
PTS: 1 DIF: Moderate REF: 5.4 Graphing Data LOC: 10.RF1 | 10.RF2 TOP: Relations and Functions KEY: Communication | Problem-Solving Skills
74. ANS: a)
Volume of Paint, p (L) 0 4 8 12 16
Cost, c ($) 0 52 104 156 208
Area Covered, A (m2) 0 37 74 111 148
b)
Volume of paint (L)
Are
a c
overe
d (
m )2
Area Covered by Paint
0 4 8 12 16 p
20
40
60
80
100
120
140
160
A
c)Area that Can Be
Covered for a Given Cost
Cost ($)
Are
a c
overe
d (
m )2
0 50 100 150 200 c
20
40
60
80
100
120
140
160
A
d) Part b: domain: ; range:
Part c: domain: ; range:

PTS: 1 DIF: Difficult REF: 5.5 Graphs of Relations and Functions LOC: 10.RF1 TOP: Relations and Functions KEY: Communication | Problem-Solving Skills
75. ANS: a)
To determine the value of f(x) when : Begin at on the x-axis. Draw a vertical line to the graph, then a horizontal line to the y-axis. The line appears to intersect the y-axis at 5. So,
When the domain value is 2, the range value is 5.
f(x) = 2 x + 1
0 2 4–2–4 x
2
4
–2
–4
y
b)
To determine the value of x when :
Since , begin at on the
y-axis. Draw a horizontal line to the graph, then a vertical line to the x-axis. The line appears to intersect the x-axis at –1. So, when ,
When the range value is 3, the domain value is –1.
g(x) = 1 – 2x
0 2 4–2–4 x
2
4
–2
–4
y
PTS: 1 DIF: Moderate REF: 5.5 Graphs of Relations and Functions LOC: 10.RF8 TOP: Relations and Functions KEY: Communication | Problem-Solving Skills
76. ANS: a)

Number of days
Co
st
($)
Cost of Renting a Paddle Boat
0 1 2 3 4 5 6 7 n
40
80
120
160
200
240
c
b) This graph represents a linear relation because the points lie on a straight line. c) Choose two points on the line. Calculate the change in each variable from one point to the other.
Change in cost:
Change in number of days: 7 days – 3 days = 4 days
Rate of change:
The rate of change represents the daily cost of renting a paddle boat, which is $29.00 per day.
PTS: 1 DIF: Moderate REF: 5.6 Properties of Linear Functions LOC: 10.RF4 | 10.RF3 TOP: Relations and Functions KEY: Communication | Problem-Solving Skills
77. ANS: a) The dependent variable is the cost, c. The independent variable is the number of copies, n. b) No, Sohan did not calculate the rate of change correctly. Instead of dividing the change in the cost by the
change in the number of pamphlets, he divided the change in the number of pamphlets by the change in the cost.
Rate of change: $0.14/pamphlet
c) The rate of change represents the cost of printing each pamphlet after the machine has been set up. The
cost per pamphlet is 14¢.
PTS: 1 DIF: Moderate REF: 5.6 Properties of Linear Functions LOC: 10.RF4 | 10.RF3 TOP: Relations and Functions KEY: Communication | Problem-Solving Skills
78. ANS: a) The dependent variable is distance, d. The independent variable is number of tire revolutions, r.

b) The graph represents a linear relation because the graph is a straight line. c) I could create a table of values for the relation, then calculate the change in each variable. If the changes
in both variables are constant, the relation is linear.
PTS: 1 DIF: Moderate REF: 5.6 Properties of Linear Functions LOC: 10.RF4 | 10.RF3 | 10.RF1 TOP: Relations and Functions KEY: Communication | Problem-Solving Skills
79. ANS: a) Choose two points on the line. Calculate the change in each variable from one point to the other.
Change in length of shadow:
Change in height of object:
Rate of change:
The rate of change is positive so the length of the shadow increases with the height of the object. For every 1 m of height, the length of the shadow is 3 m.
b) To estimate the length of the shadow, use the graph.
From 13 on the h-axis, draw a vertical line to the graph, then a horizontal line to the l-axis. From the graph, the length of the shadow will be about 39 m.
c) To estimate the height of the building, use the graph.
From 45 on the l-axis, draw a horizontal line to the graph, then a vertical line to the h-axis. From the graph, the height of the building will be about 15 m.
PTS: 1 DIF: Moderate REF: 5.7 Interpreting Graphs of Linear Functions LOC: 10.RF3 | 10.RF8 TOP: Relations and Functions KEY: Communication | Problem-Solving Skills
80. ANS:
Since the function is linear, its graph is a straight line. Determine the y-intercept: When ,
Determine the x-intercept: When ,

Determine the coordinates of a third point on the graph. When ,
Plot the points (0, 2), (5, 0), and (10, –2), then draw a line through them.
0 2 4 6 8 10–2 x
2
4
6
–2
–4
–6
y
PTS: 1 DIF: Moderate REF: 5.7 Interpreting Graphs of Linear Functions LOC: 10.RF1 | 10.RF3 | 10.RF8 TOP: Relations and Functions KEY: Problem-Solving Skills
81. ANS: a) On the vertical axis, the point of intersection has coordinates (0, 9000). The vertical intercept is 9000. At
the start of the trip, the distance from Beijing to Edmonton is 9000 km. On the horizontal axis, the point of intersection has coordinates (12, 0). The horizontal intercept is 12. It takes approximately 12 h to fly from Beijing to Edmonton.
b) Choose two points on the line. Calculate the change in each variable from one point to the other.
Change in distance:
Change in time:
Rate of change:
The rate of change is negative so the distance is decreasing with time. Every hour, the distance to Edmonton decreases by approximately 750 km.
c) The domain is the set of possible values of the time:
The range is the set of possible values of the distance:

d) To estimate the distance to Edmonton, use the graph.
From 5 on the t-axis, draw a vertical line to the graph, then a horizontal line to the d-axis. From the graph, the distance to Edmonton is approximately 5250 km.
e) To estimate how many hours the plane has been flying, use the graph.
From 6500 on the d-axis, draw a horizontal line to the graph, then a vertical line to the t-axis. From the
graph, the number of hours the plane has been flying is approximately 3 h.
PTS: 1 DIF: Moderate REF: 5.7 Interpreting Graphs of Linear Functions LOC: 10.RF3 | 10.RF5 | 10.RF8 TOP: Relations and Functions KEY: Communication | Problem-Solving Skills
82. ANS: Sketch a diagram.
rise
25 m
The guy wire is attached to the building 40 m above the ground.
PTS: 1 DIF: Moderate REF: 6.1 Slope of a Line LOC: 10.RF5 TOP: Relations and Functions KEY: Problem-Solving Skills
83. ANS: Subtract corresponding coordinates to determine the change in x and in y. From S to T: The rise is the change in y-coordinates.
The run is the change in x-coordinates.

Slope of ST = −
8
11
The slope of ST is −
8
11.
The correct answer is −
8
11.
PTS: 1 DIF: Moderate REF: 6.1 Slope of a Line LOC: 10.RF5 TOP: Relations and Functions KEY: Communication | Problem-Solving Skills
84. ANS:
Slope of AB =
Slope of AB =
Slope of AB =
The slope of AB is −
3
2.
Since CD is parallel to AB, the slopes of CD and AB are equal.
So, the slope of CD is −
3
2.
i) Point D is on the y-axis. So, it has coordinates (0, y).
Use the formula for the slope of a line:
Slope of CD =
−
3
2 =
−
3
2 =
(–6)(−3
2) = (–6)
9 =
18 =
The coordinates of point D are (0, 18). ii) Point D is on the x-axis. It has coordinates (x, 0).
Use the formula for the slope of a line:
Slope of CD =

−
3
2 =
−
3
2 =
(−3
2) =
=
(2) = (2)( )
= –18 –3x = –36
x = 12 The coordinates of point D are (12, 0).
PTS: 1 DIF: Difficult REF: 6.2 Slopes of Parallel and Perpendicular Lines LOC: 10.RF3 TOP: Relations and Functions KEY: Problem-Solving Skills
85. ANS: a) The student may have interchanged the signs of the slope and y-intercept. b) Use the equation:
To write the equation of a linear function, determine the slope of the line, m, and its y-intercept, b. The line intersects the y-axis at 2; so, . From the graph, the rise is when the run is .
So, , or
Substitute for m and b in .
The equation of the graph is:
PTS: 1 DIF: Moderate REF: 6.4 Slope-Intercept Form of the Equation for a Linear Function LOC: 10.RF6 TOP: Relations and Functions KEY: Communication | Problem-Solving Skills
86. ANS: Substitute the coordinates of point J(–5, 2) into the equation , then solve for m.
So, when the line passes through the point J(–5, 2), the value of m is .

PTS: 1 DIF: Difficult REF: 6.4 Slope-Intercept Form of the Equation for a Linear Function LOC: 10.RF6 TOP: Relations and Functions KEY: Problem-Solving Skills
87. ANS: a) The flat fee is: $50
When n T-shirts are ordered, the additional cost is: 8.95n dollars So, an equation is:
b) Use the equation:
The total cost was $604.90. c) Use the equation:
Jakub ordered 103 T-shirts.
PTS: 1 DIF: Moderate REF: 6.4 Slope-Intercept Form of the Equation for a Linear Function LOC: 10.RF6 TOP: Relations and Functions KEY: Problem-Solving Skills
88. ANS: a) n = f(t), so two points on the graph have coordinates C(25, 458) and D(29, 534).
Use this form for the equation of a linear function:
Substitute: , , , and

In slope-point form, the equation that represents this function is: b) Use:
Substitute:
When the students sell 325 cups of punch, the approximate temperature is 18°C.
PTS: 1 DIF: Difficult REF: 6.5 Slope-Point Form of the Equation for a Linear Function LOC: 10.RF7 TOP: Relations and Functions KEY: Problem-Solving Skills
89. ANS: Since the coordinates of 2 points on the line are known, use this form for the equation of a linear function:
Substitute: , , , and

In general form, an equation that represents the line that passes through A(3, –4) and B(11, 8) is:
PTS: 1 DIF: Moderate REF: 6.6 General Form of the Equation for a Linear Relation LOC: 10.RF7 | 10.RF5 TOP: Relations and Functions KEY: Problem-Solving Skills
90. ANS: Sample answer: Determine the x- and y-intercepts. To determine the x-intercept, substitute y = 0:
The x-intercept is 4 and is described by the point (4, 0). To determine the y-intercept, substitute x = 0:
The y-intercept is and is described by the point (0, ). On a grid, plot the points that represent the intercepts. Draw a line through the points.

0
x - 4y - 4 = 0
4 8 12 16–4–8–12–16 x
4
8
–4
–8
y
PTS: 1 DIF: Moderate REF: 6.6 General Form of the Equation for a Linear Relation LOC: 10.RF7 | 10.RF5 TOP: Relations and Functions KEY: Communication | Problem-Solving Skills