CHAPTER 5: WRITING SAMPLE CORRELATION MININGdwb5.unl.edu/Diss/Kokensparger/Chapter5.pdf · CHAPTER...
22
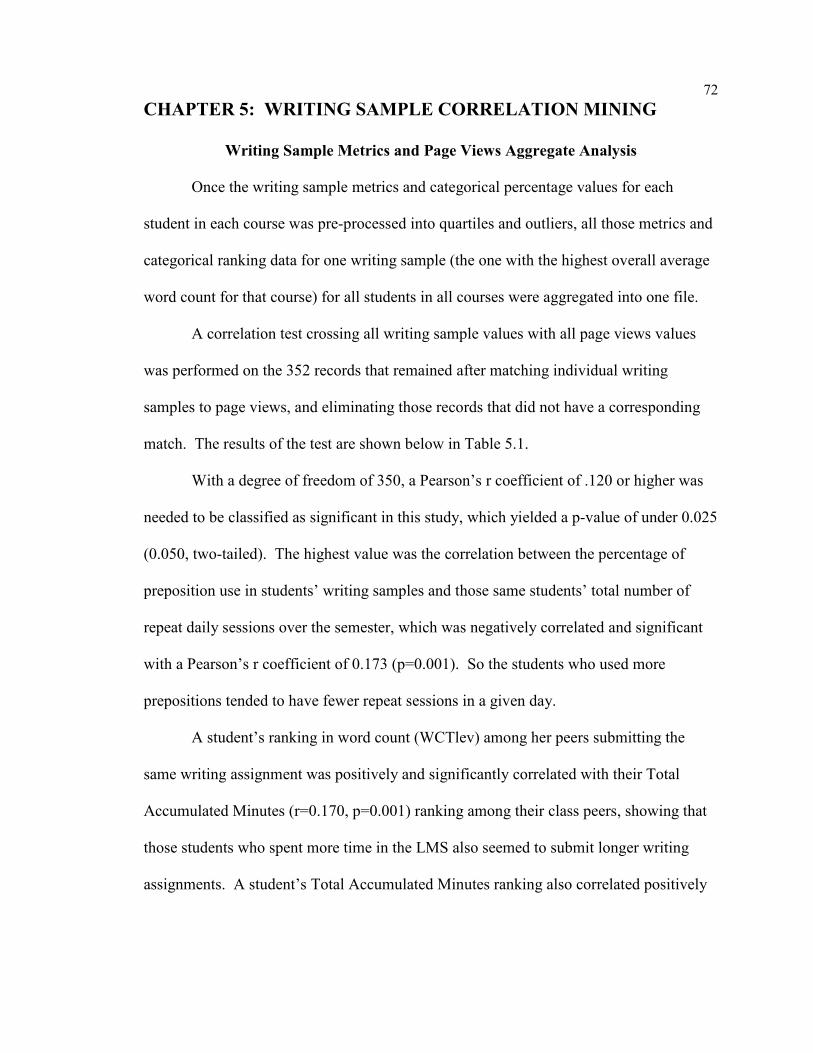
72 CHAPTER 5: WRITING SAMPLE CORRELATION MINING Writing Sample Metrics and Page Views Aggregate Analysis Once the writing sample metrics and categorical percentage values for each student in each course was pre-processed into quartiles and outliers, all those metrics and categorical ranking data for one writing sample (the one with the highest overall average word count for that course) for all students in all courses were aggregated into one file. A correlation test crossing all writing sample values with all page views values was performed on the 352 records that remained after matching individual writing samples to page views, and eliminating those records that did not have a corresponding match. The results of the test are shown below in Table 5.1. With a degree of freedom of 350, a Pearson’s r coefficient of .120 or higher was needed to be classified as significant in this study, which yielded a p-value of under 0.025 (0.050, two-tailed). The highest value was the correlation between the percentage of preposition use in students’ writing samples and those same students’ total number of repeat daily sessions over the semester, which was negatively correlated and significant with a Pearson’s r coefficient of 0.173 (p=0.001). So the students who used more prepositions tended to have fewer repeat sessions in a given day. A student’s ranking in word count (WCTlev) among her peers submitting the same writing assignment was positively and significantly correlated with their Total Accumulated Minutes (r=0.170, p=0.001) ranking among their class peers, showing that those students who spent more time in the LMS also seemed to submit longer writing assignments. A student’s Total Accumulated Minutes ranking also correlated positively
Transcript of CHAPTER 5: WRITING SAMPLE CORRELATION MININGdwb5.unl.edu/Diss/Kokensparger/Chapter5.pdf · CHAPTER...
72
CHAPTER 5: WRITING SAMPLE CORRELATION MINING
Writing Sample Metrics and Page Views Aggregate Analysis
Once the writing sample metrics and categorical percentage values for each
student in each course was pre-processed into quartiles and outliers, all those metrics and
categorical ranking data for one writing sample (the one with the highest overall average
word count for that course) for all students in all courses were aggregated into one file.
A correlation test crossing all writing sample values with all page views values
was performed on the 352 records that remained after matching individual writing
samples to page views, and eliminating those records that did not have a corresponding
match. The results of the test are shown below in Table 5.1.
With a degree of freedom of 350, a Pearson’s r coefficient of .120 or higher was
needed to be classified as significant in this study, which yielded a p-value of under 0.025
(0.050, two-tailed). The highest value was the correlation between the percentage of
preposition use in students’ writing samples and those same students’ total number of
repeat daily sessions over the semester, which was negatively correlated and significant
with a Pearson’s r coefficient of 0.173 (p=0.001). So the students who used more
prepositions tended to have fewer repeat sessions in a given day.
A student’s ranking in word count (WCTlev) among her peers submitting the
same writing assignment was positively and significantly correlated with their Total
Accumulated Minutes (r=0.170, p=0.001) ranking among their class peers, showing that
those students who spent more time in the LMS also seemed to submit longer writing
assignments. A student’s Total Accumulated Minutes ranking also correlated positively

73
and significantly with a student’s ranking in the percentage of usage of words of Six
Letters (r=0.139,p=0.009) or more in her writing.
The usage of prepositions by students in their writing showed significant negative
correlations with the Repeated Sessions per Day (r=-0.173, p=0.001) calculated value,
and its closely-aligned High Times Out student (r=-0.143, p=0.007, which is generated
from the RSDLevs value). Therefore, from this study it can be ascertained that students
who login to the LMS more than once a day in comparison with their peers tend to use
fewer prepositions in their submitted writing assignments. Those same correlational
values and polarity were produced by comparing the same page views session metrics,
Repeated Sessions per Day (r=-0.141,p=0.008) and High Times Out students (r=-0.142,
p=0.008) with the relativity word category (for example, “area,” “bend,” “stop,” and
“exit”).
Cognitive-Mechanical word usage (for example, words like “cause,” “know,” and
“ought”), which were generally the highest percentage of words used over all of the
assignments by most students in this study, was positively and significantly correlated
with the Average Clicks per Session metrics in the page views data (r=0.158, p=0.003),
and the only category that had any level of significance with this metric.
The final word sample category of interest in this correlational test, the Verbs
usage level rankings was significant in a negative direction with the Files page views
category (r=-0.170,p= 0.001), and positively with the Grade page views category
(r=0.144,p=0.007). As mentioned many times above, the Files (and other course content
areas) category is often in a polarity opposite that of Grades in its relationship with other
metrics.
74
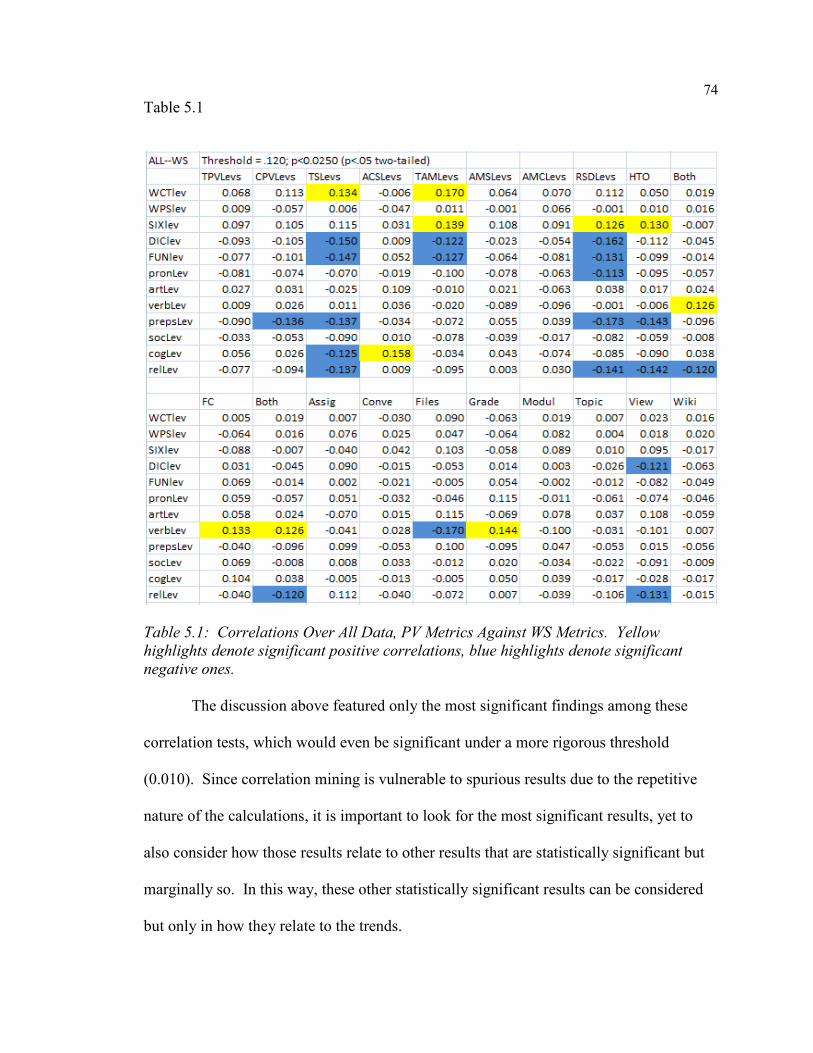
Table 5.1
Table 5.1: Correlations Over All Data, PV Metrics Against WS Metrics. Yellow
highlights denote significant positive correlations, blue highlights denote significant
negative ones.
The discussion above featured only the most significant findings among these
correlation tests, which would even be significant under a more rigorous threshold
(0.010). Since correlation mining is vulnerable to spurious results due to the repetitive
nature of the calculations, it is important to look for the most significant results, yet to
also consider how those results relate to other results that are statistically significant but
marginally so. In this way, these other statistically significant results can be considered
but only in how they relate to the trends.

75
Some of these trends include:
Word count in writing samples seems to correlate positively with most Page View
sessions metrics, except for Average Clicks per Session, where the correlation is of
lowest significance. Word count appears to have no significant relationship whatsoever
with URL token categories that students visit within the LMS, such as Assignments,
Grades, and Files.
Words per sentence (WPS), which is the average number of words in all of the
sentences in the writing samples, did not approach significance in any of the page views
session or categorical metrics.
The Average Minutes per Click, which is the page views session metric that is
closely aligned with students classified as Fast Clickers, had no writing sample metrics or
categories approaching significance. Neither did the Assignments, Conversations,
Modules, Topic, or Wiki page views categories.
In general, the Repeat Sessions per Day (and corresponding High Times Out)
metrics had a number of weaker though significant relationships with writing sample
metrics and categories. It appears that the High Times Out group reveal their usage
patterns in their writing samples much more than the Fast Clickers group, which only had
a near-significant relationship with Verb usage.
Writing Samples Analysis -- Sample Type Aggregates
A similar analysis to that done immediately above was done with aggregate data
by writing sample type, to determine if there were major differences in relationships

76
between writing sample metrics and page views metrics between students submitting one
type of writing assignment (e.g., a term paper) and another type of assignment (e.g., a
short reflection paper). The same correlational analysis was conducted over three
different sets of students, as determined by this table:
Table 5.2
Writing Sample Categories
CourseID Type WC Timing Cats Class
316813 Paper 780 MY CE A
316814 Paper 802 MY CE A
314538 Essay 837 EY oc A
314092 Short 862 MY cvre A
316841 Paper 1705 MY ECV B
316747 Position 1732 EY C B
316804 Term 1748 EY EC B
316805 Term 1774 EY EC B
314041 Term 2902 EY EC C
316837 Research 3080 EY EC C
316838 Research 3120 EY EC C
316819 Mult 3715 Mult C D
315028 Final 3808 EY CE D
314083 Final 4940 EY CE D
Table 5.2: Writing Sample Characteristics and Classifications
The “Class” of each writing sample type for each course was primarily
determined by the average word count for the sample, breaking it down into Class A
77
(average WC less than 1000), Class B (average WC between 1000 and 2000), Class C
(average WC between 2000 and 3500), and Class D (average EC of 3500 or larger).
Class A Papers (Average Word Count less than 1000 Words)
The Class A Papers (average Word Count less than 1000 words) aggregated
analysis included 4 of the 14 courses with a total of 106 subjects. A correlational
overview analysis was conducted using the R statistical software package.
With a degree of freedom of 104 for this sample, a Pearson’s r correlation of
0.220 or greater, either positively or negatively, was considered significant with a p-value
under 0.025 (p<.050, two-tailed), which was the threshold chosen for the overall
aggregate correlational analysis previously described. Greater Pearson’s r correlation
values in a positive or negative direction were therefore of higher significance in the
findings.
The highest Pearson’s r value was yielded through a comparison of student
rankings in their use of prepositions in their writing samples (prepsLev) and their
rankings in the Repeated Sessions Day (r-value of -0.322, p=0.001). The prepsLev
category, which is the most prominent writing samples category in this group of papers
(i.e., assignments with an average word count of less than 1000) was also negatively and
significantly correlated with rankings for the number of Course Page Views (r=-0.273,
p=0.005), number of Total Sessions the student accumulated over the semester while
engaged in the course (r=-0.273,p=0.005) and High Times Out (r=-0.239, p=0.014).
Though prepsLev had a number of significant relationships (all negative) with the
page views session factors, the category had no significant relationships among the page
78
views URL categories. Two other categories did, however, with the students’ use of
verbs in their submitted writing (verbLev) relating negatively and significantly with
students’ visiting the course Modules (r=-0.252, p=0.009) and students’ use of relativity
language (e.g., “area,” “bend,” “exit,” and “stop”) in their submitted writing (relLev)
relating negatively and significantly with students’ viewing (View) course content (r=-
0.234, p=0.016). The relLev category was also negatively and significantly correlated to
the RSDLevs metric (r=-.240, p=0.013).
The students’ use of cognitive-mechanical words (e.g., “cause”, “know”, “ought”,
and “think”), represented within the cogLev category, was positively (one of the few that
were not negative) and significantly correlated with the Total Page Views session metric
(r=0.234, p=0.016)
This class of paper (A) has the only significant interactions with the percentage of
six-letter or higher words (SIXlev) Writing Sample metric, with six such significant
correlations (and 2 additional nearly-significant ones). This metric correlates
significantly and positively with page views session metrics (Total Accumulated
Minutes, Average Minutes per Click, including a significant positive correlation with
students classified as High Times Out (r=0.220, p=0.023) and a significant negative
correlation with students classified as Fast Clickers (r=-0.320, p=0.001), and thus, with
prepsLev, could possibly be used as a chief predictor for High Times Out students, and
the only predictor in this classification of papers for the Fast Clickers students.

79
Table 5.3
Table 5.3: Correlations Over All Metrics for Class A Writing Samples. Yellow
highlights denote significant positive correlations, blue highlights denote significant
negative ones.
Class B Papers (Average Word Count between 1000 and 2000 Words)
The Class B Papers (average Word Count between 1000 and 2000 words)
aggregated analysis also included 4 of the 14 courses with a total of 128 subjects. A
correlational overview analysis was conducted using the R statistical software package.
With a degree of freedom of 126 for this sample, a Pearson’s r correlation of
0.199 or greater, either positively or negatively, was considered significant with a p-value
under 0.025 (p<.050, two-tailed), which was the threshold chosen for the overall
80
aggregate correlational analysis previously described. Greater Pearson’s r correlation
values in a positive or negative direction were therefore of higher significance in the
findings.
The highest Pearson’s r value was yielded through a comparison of student
rankings in their use of pronouns in their writing samples (pronLev) and their rankings in
the Total Accumulated Minutes (r=-0.267, p=0.002). The pronLev category also joined
the relLev category (which represents students’ use of relativity words, with examples
provided in the classification above) in a significant and negative correlation with the
total number of Course Page Views over the semester.
The relativity word usage, which is the most prominent writing samples category
in this group of papers (i.e., assignments with an average word count of greater than 1000
and less than 2000) was also negatively and significantly correlated with rankings for six
other page views session factors, including the High Times Out students (r=-0.223,
p=0.011). As such, it could therefore be used as a chief predictor of High Times Out
students in this classification of writing assignments.
Students who visit the Files area in those courses requiring this classification of
writing assignments also tend to write the longer papers in terms of word count, tend to
use more words per sentence on average than their peers in the same course, and tend to
use a higher percentage of articles in their writing. They also tend to use a lower
percentage of verbs in their writing.
The word count metric is also significantly and positively correlated with the
Average Minutes per Click page views session metric (r=0.199, p=0.024), indicating that
81
students who spend more time between clicks in the LMS also tend to write papers with
higher word counts for this classification of assignment.
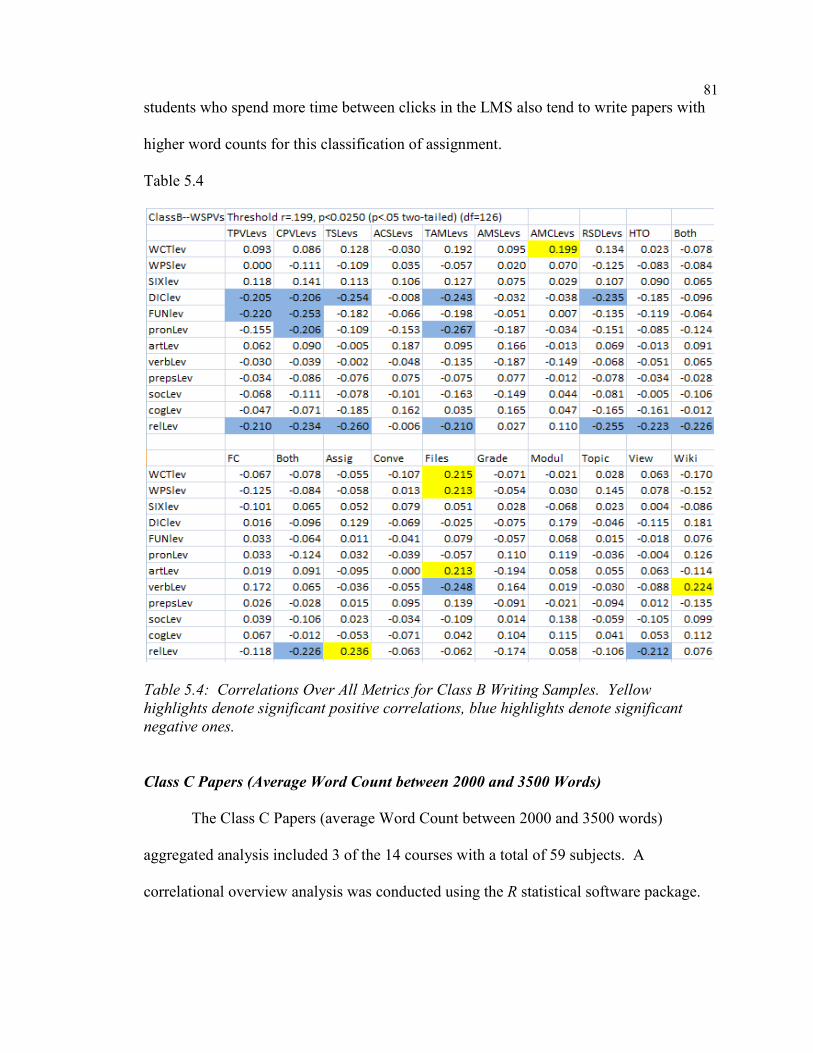
Table 5.4
Table 5.4: Correlations Over All Metrics for Class B Writing Samples. Yellow
highlights denote significant positive correlations, blue highlights denote significant
negative ones.
Class C Papers (Average Word Count between 2000 and 3500 Words)
The Class C Papers (average Word Count between 2000 and 3500 words)
aggregated analysis included 3 of the 14 courses with a total of 59 subjects. A
correlational overview analysis was conducted using the R statistical software package.
82
With a degree of freedom of 57 for this sample, a Pearson’s r correlation of 0.300 or
greater, either positively or negatively, was considered significant with a p-value under
0.025 (p<.050, two-tailed), which was the threshold chosen for the overall aggregate
correlational analysis previously described. Greater Pearson’s r correlation values in a
positive or negative direction were therefore of higher significance in the findings.
A comparison of student rankings in their use of prepositions in their writing
samples (prepsLev) and their rankings in the Repeated Sessions Days (r-value of -0.339,
p=0.009) gave the highest Pearson’s r value. The prepsLev category also significantly
and negatively correlated with the High Times Out student classification (r=-0.315,
p=0.015).
No other significant correlations were discovered in Class C writing assignments
(greater than 2000 words and less than 3500 words.

83
Table 5.5
Table 5.5: Correlations Over All Metrics for Class C Writing Samples. Blue highlights
denote significant negative correlations.
Class D Papers (Average Word Count greater than 3500 Words)
The Class D Papers (average Word Count greater than 3500 words) aggregated
analysis also included 3 of the 14 courses with a total of 59 subjects. A correlational
overview analysis was conducted using the R statistical software package.
With a degree of freedom of 57 for this sample, a Pearson’s r correlation of 0.297
or greater, either positively or negatively, was considered significant with a p-value under
0.025 (p<.050, two-tailed), which was the threshold chosen for the overall aggregate
84
correlational analysis previously described. Greater Pearson’s r correlation values in a
positive or negative direction were therefore of higher significance in the findings.
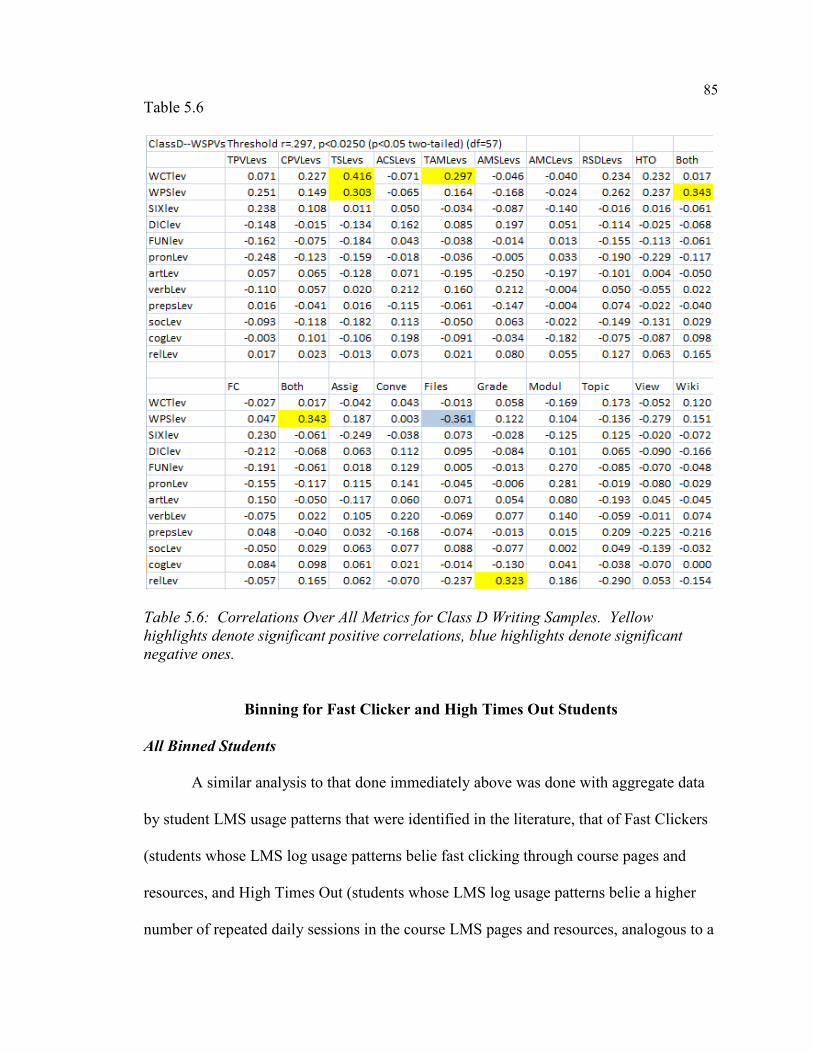
The highest Pearson’s r value was yielded through a comparison of students’
rankings in their word count of their writing samples (WCTlev) and their rankings in the
Total Sessions (r-value of 0.416, p=0.001). The WCTlev category also correlated
significantly and positively with the Total Accumulated Minutes session metric
(r=0.297,p=0.023).
Significant and positive correlations were produced between the WPSlev metric
and both the Total Sessions metric (r=0.303, p=0.020), the Both classification of students
(i.e., those students who are classified as both Fast Clickers and High Times Out)
(r=0.343, p=0.008), and significantly and negatively with the Files page views URL
category (r=-0.361, p=0.005).
The other significant correlation among Class D writing assignments is the
positive correlation between the relLev writing sample category and the Grades page
views category (r=0.325, p=0.012).
The correlations in this classification of writing samples were almost entirely
positive (with one exception). The other classifications of writing samples gave mostly
negative correlations (Classes B and C in particular) or of mixed positive and negative (as
in the case of Class A). Class D correlations were mostly positive, perhaps illustrating
that papers of longer word count requirements also tend to reveal positive relationships
with page view metrics within an LMS, as if the longevity of an assignment (whether or
not it can be substantially completed in one sitting) has a direct relationship with the
course itself (which cannot be substantially completed in one sitting
85
Table 5.6
Table 5.6: Correlations Over All Metrics for Class D Writing Samples. Yellow
highlights denote significant positive correlations, blue highlights denote significant
negative ones.
Binning for Fast Clicker and High Times Out Students
All Binned Students
A similar analysis to that done immediately above was done with aggregate data
by student LMS usage patterns that were identified in the literature, that of Fast Clickers
(students whose LMS log usage patterns belie fast clicking through course pages and
resources, and High Times Out (students whose LMS log usage patterns belie a higher
number of repeated daily sessions in the course LMS pages and resources, analogous to a
86
“time-out and return that same day to log back in and resume” situation). This was done
to determine if there were major differences in relationships between writing sample
metrics and page views metrics among students classified in the two categories outlined
above. The same correlational analysis was conducted over three different sets of
students, as determined by this table:
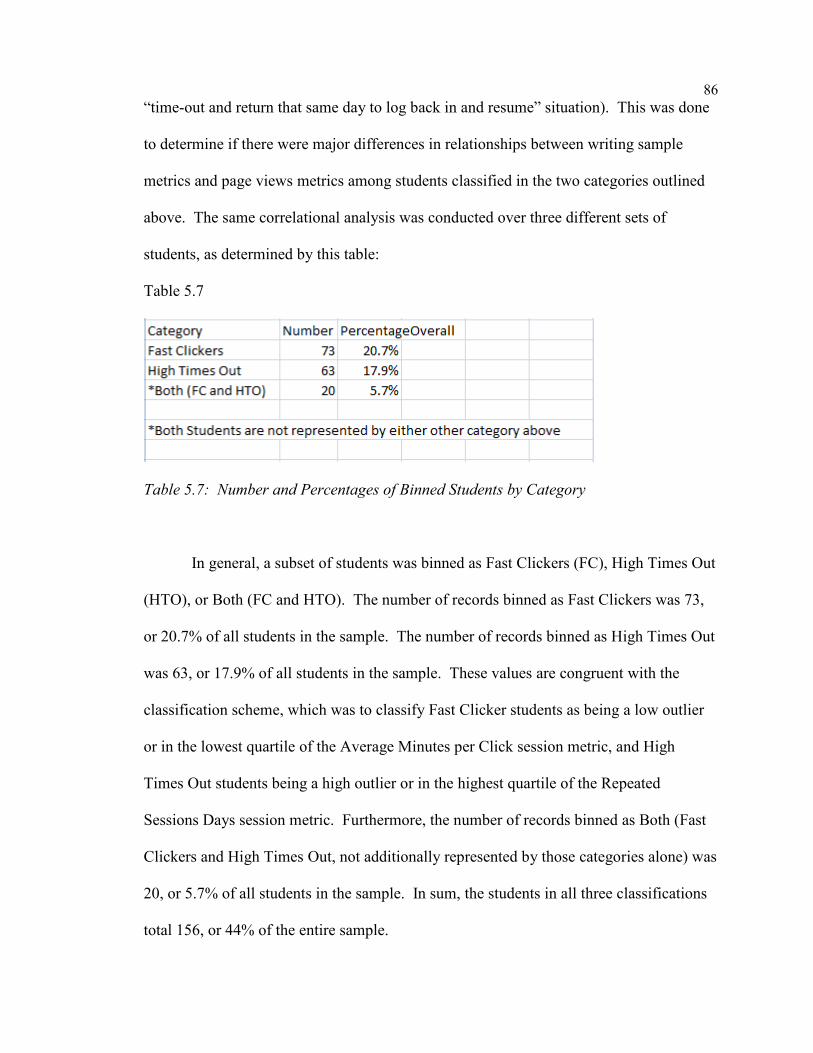
Table 5.7
Table 5.7: Number and Percentages of Binned Students by Category
In general, a subset of students was binned as Fast Clickers (FC), High Times Out
(HTO), or Both (FC and HTO). The number of records binned as Fast Clickers was 73,
or 20.7% of all students in the sample. The number of records binned as High Times Out
was 63, or 17.9% of all students in the sample. These values are congruent with the
classification scheme, which was to classify Fast Clicker students as being a low outlier
or in the lowest quartile of the Average Minutes per Click session metric, and High
Times Out students being a high outlier or in the highest quartile of the Repeated
Sessions Days session metric. Furthermore, the number of records binned as Both (Fast
Clickers and High Times Out, not additionally represented by those categories alone) was
20, or 5.7% of all students in the sample. In sum, the students in all three classifications
total 156, or 44% of the entire sample.

87
A correlation test crossing all writing sample values with all page view values
was performed on the 156 binned records that were classified and identified as described
above. The results of the test are shown below in Table 5.8.
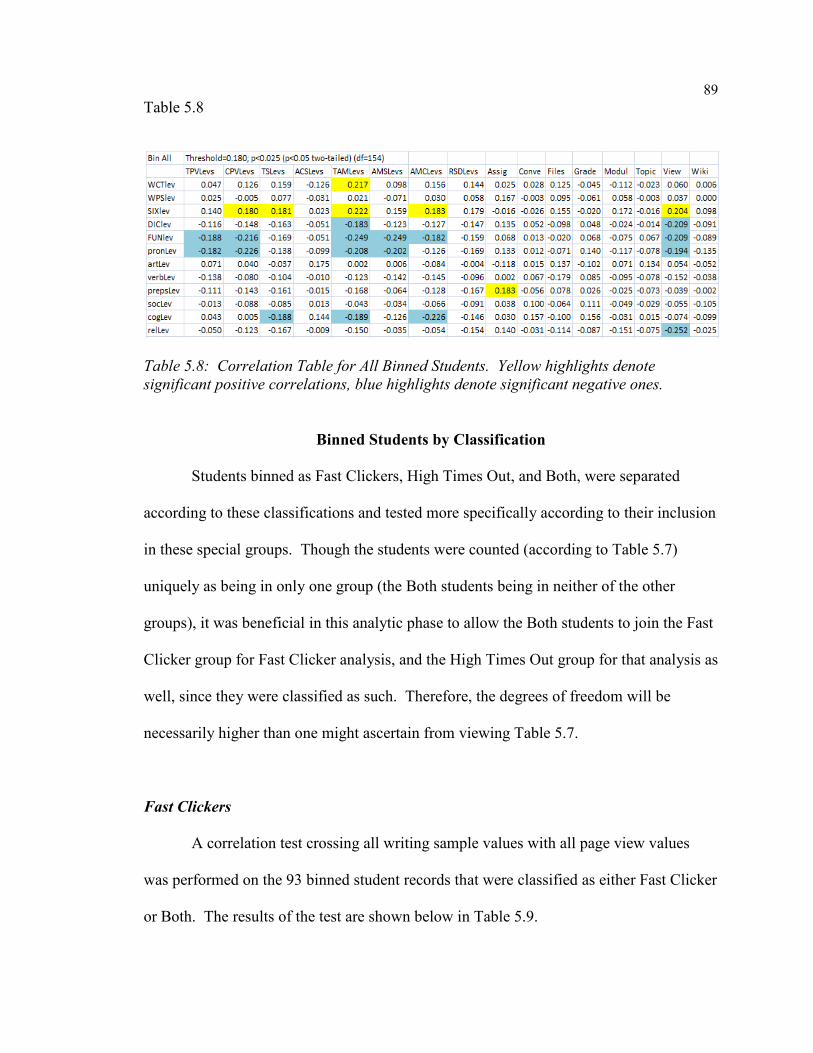
With a degree of freedom of 154, a Pearson’s r coefficient of 0.180 or higher was
needed to be classified as significant in this study, which yielded a p-value of under
0.0250 (p<0.050 two-tailed). The highest value was the correlation between the
percentage of relativity word usage in students’ writing samples and those same students’
total number of page views visits to View content areas (r=-0.252, p=0.002). In general,
students who had a higher percentage of URL logs in the View category were
significantly or negatively correlated with the percentage of their pronoun use as well
(r=-0.194, p=0.015).
For this classification of students, cognitive word usage was also significantly and
negatively correlated with the Total Sessions (r=-0.188, p=0.019), Total Accumulated
Minutes (r=-0.189, p=0.018), and Average Minutes per Click (r=-0.226, p=0.005) session
metrics. The percentage of usage of pronouns in writing assignments by this
classification of students also correlated significantly and negatively with the Total Page
Views (r=-0.182, p=0.023), Course Page Views (r=-0.226,p=0.005), Total Accumulated
Minutes (p=-0.208,p=0.009), Average Minutes per Session (r=-0.202, p=0.012) and the
View category (r=-0.194, p=0.015).
The only significant positive correlation among this classification of students was
the usage of prepositions with the visits to Assignment (r=0.183, p=0.022) pages. There
were also 5 significant positive correlations between the percentage use of Six-letter
words (or greater), and the page views session metrics of Course Page Views (r=0.180,

88
p=0.024), Total Sessions (r=0.181, p=0.024), Total Accumulated Minutes (r=0.222,
p=0.005), Average Minutes per Click (r=0.183, p=0.022), and the View category (r=.204,
p=0.011) Only one significant positive correlation was produced in the word count
metric, with the Total Accumulated Minutes page views session metric (r=0.217,
p=0.006).
The significant correlation values produced within the percent usage of dictionary
(DIClev) and functional words (FUNlev) are enigmas because they are highly sensitive to
misspellings and typographical errors (e.g., a space mistakenly inserted in the middle of a
word that would be recognized as a dictionary and functional word, making it into two
non-recognizable words), yet FUNlev was one of the most dynamic metrics among this
set of correlations. Therefore, they are ignored in this discussion, but retained in the
generation of the decision trees, since they both played prominent roles in some of the
trees, even the pruned ones. The significance of these two categories would be an
excellent vector for further study in this area.
From this test a number of possibilities arise which may ultimately lead to deeper
exploration into LMS usage patterns under Fast Clicker and High Times Out and
corresponding writing sample characteristics. These possibilities will be explored in
detail below.
However, before that data modeling took place, the correlations were examined
within each category, among the Fast Clicker students, the High Times Out students, and
those few students who were classified as being both.
89
Table 5.8
Table 5.8: Correlation Table for All Binned Students. Yellow highlights denote
significant positive correlations, blue highlights denote significant negative ones.
Binned Students by Classification
Students binned as Fast Clickers, High Times Out, and Both, were separated
according to these classifications and tested more specifically according to their inclusion
in these special groups. Though the students were counted (according to Table 5.7)
uniquely as being in only one group (the Both students being in neither of the other
groups), it was beneficial in this analytic phase to allow the Both students to join the Fast
Clicker group for Fast Clicker analysis, and the High Times Out group for that analysis as
well, since they were classified as such. Therefore, the degrees of freedom will be
necessarily higher than one might ascertain from viewing Table 5.7.
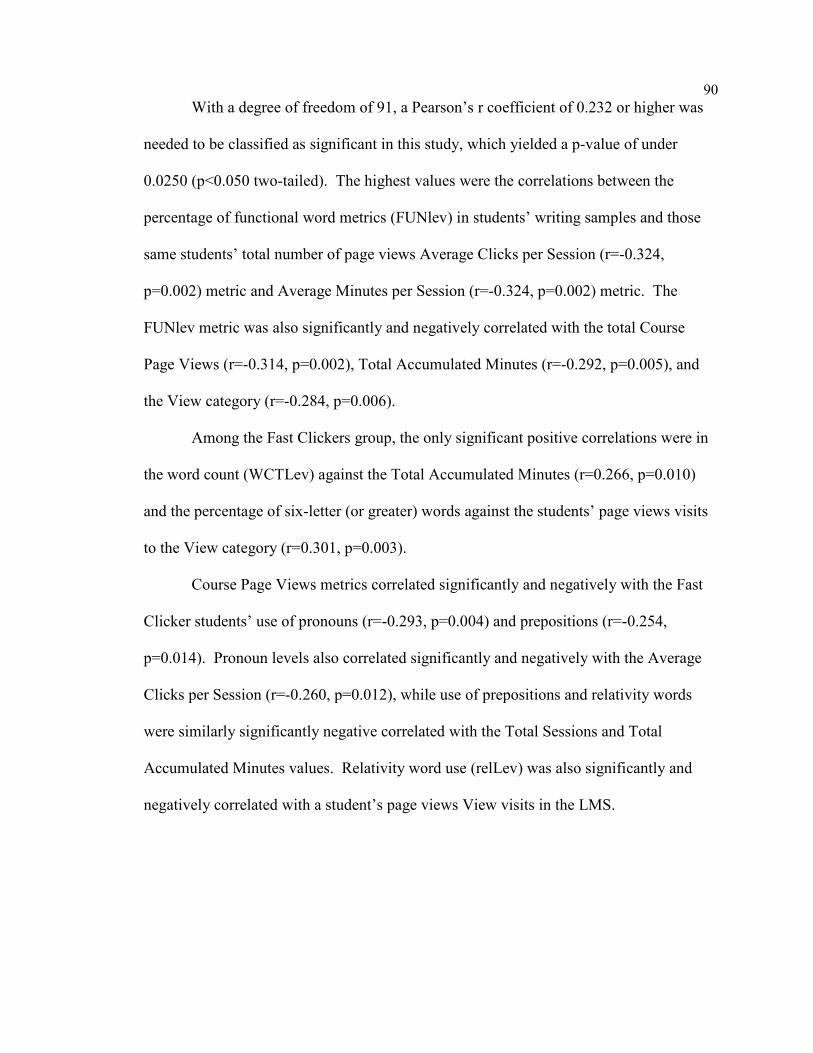
Fast Clickers
A correlation test crossing all writing sample values with all page view values
was performed on the 93 binned student records that were classified as either Fast Clicker
or Both. The results of the test are shown below in Table 5.9.
90
With a degree of freedom of 91, a Pearson’s r coefficient of 0.232 or higher was
needed to be classified as significant in this study, which yielded a p-value of under
0.0250 (p<0.050 two-tailed). The highest values were the correlations between the
percentage of functional word metrics (FUNlev) in students’ writing samples and those
same students’ total number of page views Average Clicks per Session (r=-0.324,
p=0.002) metric and Average Minutes per Session (r=-0.324, p=0.002) metric. The
FUNlev metric was also significantly and negatively correlated with the total Course
Page Views (r=-0.314, p=0.002), Total Accumulated Minutes (r=-0.292, p=0.005), and
the View category (r=-0.284, p=0.006).
Among the Fast Clickers group, the only significant positive correlations were in
the word count (WCTLev) against the Total Accumulated Minutes (r=0.266, p=0.010)
and the percentage of six-letter (or greater) words against the students’ page views visits
to the View category (r=0.301, p=0.003).
Course Page Views metrics correlated significantly and negatively with the Fast
Clicker students’ use of pronouns (r=-0.293, p=0.004) and prepositions (r=-0.254,
p=0.014). Pronoun levels also correlated significantly and negatively with the Average
Clicks per Session (r=-0.260, p=0.012), while use of prepositions and relativity words
were similarly significantly negative correlated with the Total Sessions and Total
Accumulated Minutes values. Relativity word use (relLev) was also significantly and
negatively correlated with a student’s page views View visits in the LMS.

91
Table 5.9
Table 5.9: Correlation Table for Fast Clicker (FC) Binned Students Yellow highlights
denote significant positive correlations, blue highlights denote significant negative ones.
High Times Out
A correlation test crossing all writing sample values with all page view values
was performed on the 83 binned student records that were classified and identified as
having High Times Out (HTO), as described above. The results of the test are shown
below in Table 5.10.
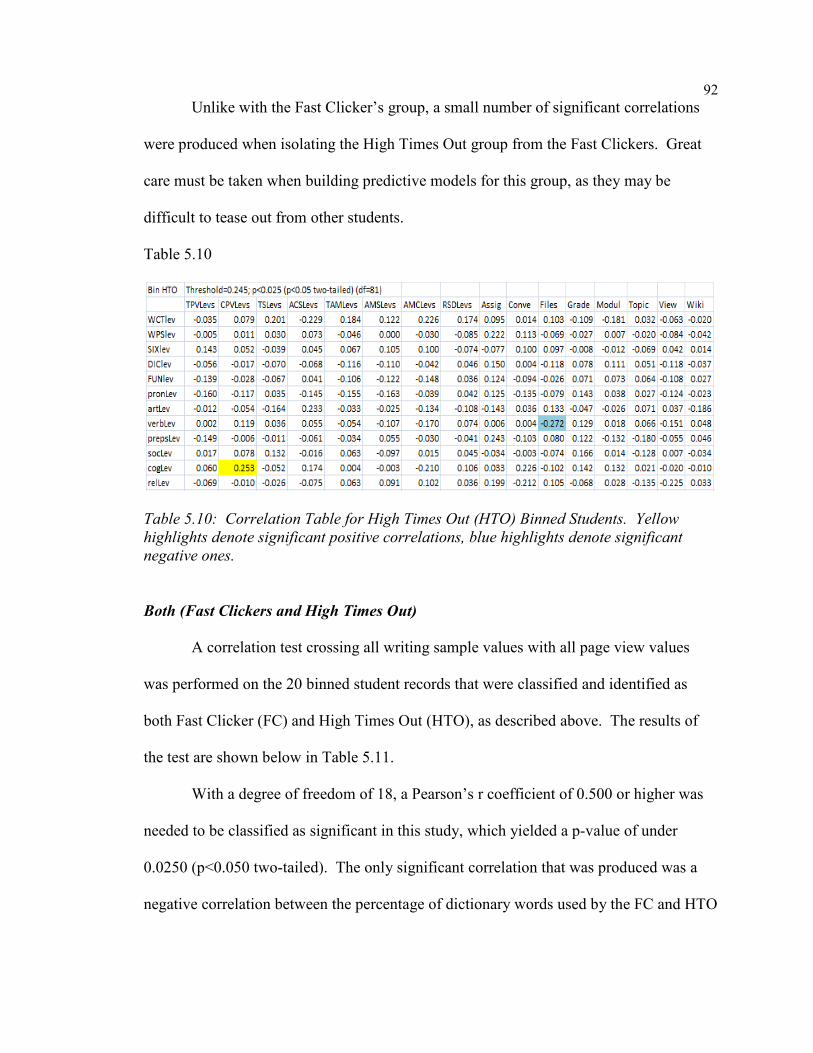
With a degree of freedom of 81, a Pearson’s r coefficient of 0.245 or higher was
needed to be classified as significant in this study, which yielded a p-value of under 0.250
(p<0.050 two-tailed). When broken down in this way, only two significant correlations
were produced from the test: a significant and negative correlation between the HTO
students’ use of verbs in writing class assignments and visiting Files in page views (r=-
0.272, p=0.013), and a significant positive correlation between the HTO students’ use of
cognitive words in writing samples and their total Course Page Views for the semester
(r=0.253, p=0.021).
92
Unlike with the Fast Clicker’s group, a small number of significant correlations
were produced when isolating the High Times Out group from the Fast Clickers. Great
care must be taken when building predictive models for this group, as they may be
difficult to tease out from other students.
Table 5.10
Table 5.10: Correlation Table for High Times Out (HTO) Binned Students. Yellow
highlights denote significant positive correlations, blue highlights denote significant
negative ones.
Both (Fast Clickers and High Times Out)
A correlation test crossing all writing sample values with all page view values
was performed on the 20 binned student records that were classified and identified as
both Fast Clicker (FC) and High Times Out (HTO), as described above. The results of
the test are shown below in Table 5.11.
With a degree of freedom of 18, a Pearson’s r coefficient of 0.500 or higher was
needed to be classified as significant in this study, which yielded a p-value of under
0.0250 (p<0.050 two-tailed). The only significant correlation that was produced was a
negative correlation between the percentage of dictionary words used by the FC and HTO
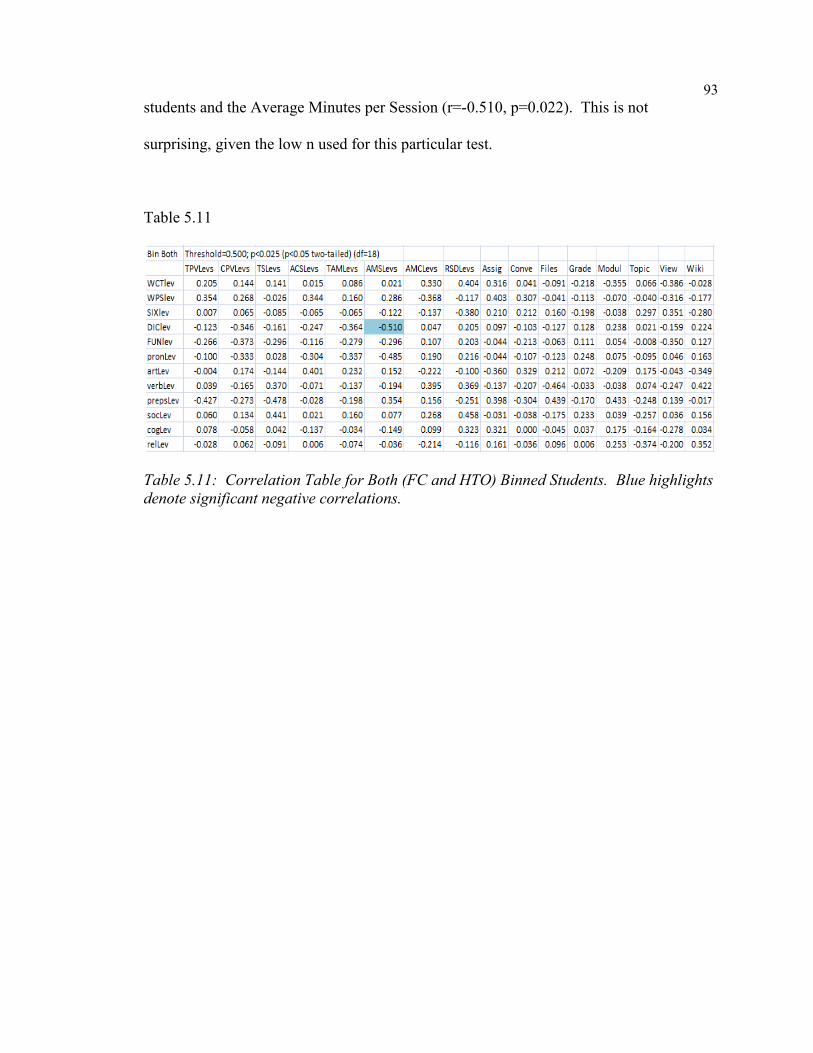
93
students and the Average Minutes per Session (r=-0.510, p=0.022). This is not
surprising, given the low n used for this particular test.
Table 5.11
Table 5.11: Correlation Table for Both (FC and HTO) Binned Students. Blue highlights
denote significant negative correlations.