Chapter 5 The Behavior of Interest Rates. © 2004 Pearson Addison-Wesley. All rights reserved 5-2...
32
Chapter 5 The Behavior of Interest Rates
-
date post
21-Dec-2015 -
Category
Documents
-
view
218 -
download
0
Transcript of Chapter 5 The Behavior of Interest Rates. © 2004 Pearson Addison-Wesley. All rights reserved 5-2...

Chapter 5
The Behavior of Interest Rates

© 2004 Pearson Addison-Wesley. All rights reserved 5-2
Interest rates are negatively related to the price of bonds
• If we can explain why bond prices change, we can explain why interest rate fluctuate.
• To derive a demand curve of assets, like money or bonds, we use the theory of asset demand.

© 2004 Pearson Addison-Wesley. All rights reserved 5-3
Determinants of Asset Demand
1. Wealth: the total resources owned by the individuals.
2. Expected return: on one asset relative to alternative assets
3. Risk: on one asset relative to alternative assets
4. Liquidity: relative to alternative assets

© 2004 Pearson Addison-Wesley. All rights reserved 5-4
Determinants of Asset Demand

© 2004 Pearson Addison-Wesley. All rights reserved 5-5
Derivation of Bond Demand Curve
(F – P)i = RETe =
P
Point A:
P = $950
($1000 – $950)i = = 0.053 = 5.3%
$950
Bd = $100 billion

© 2004 Pearson Addison-Wesley. All rights reserved 5-6
Derivation of Bond Demand Curve
Point B:
P = $900
($1000 – $900)i = = 0.111 = 11.1%
$900
Bd = $200 billion
Point C: P = $850, i = 17.6% Bd = $300 billion
Point D: P = $800, i = 25.0% Bd = $400 billion
Point E: P = $750, i = 33.0% Bd = $500 billion
Demand Curve is Bd in Figure 1 which connects points A, B, C, D, E.
Has usual downward slope

© 2004 Pearson Addison-Wesley. All rights reserved 5-7
Derivation of Bond Supply Curve
Point F: P = $750, i = 33.0%, Bs = $100 billion
Point G: P = $800, i = 25.0%, Bs = $200 billion
Point C: P = $850, i = 17.6%, Bs = $300 billion
Point H: P = $900, i = 11.1%, Bs = $400 billion
Point I: P = $950, i = 5.3%, Bs = $500 billion
Supply Curve is Bs that connects points F, G, C, H, I, and has upward
slope

© 2004 Pearson Addison-Wesley. All rights reserved 5-8
Supply and Demand Analysis ofthe Bond Market
Market Equilibrium
1. Occurs when Bd = B
s, at P* =
$850, i* = 17.6%
2. When P = $950, i = 5.3%, Bs >
Bd (excess supply): P to P*, i
to i*
3. When P = $750, i = 33.0, Bd >
Bs (excess demand): P to P*,
i to i*

© 2004 Pearson Addison-Wesley. All rights reserved 5-9
Loanable Funds Terminology
1. Demand for bonds = supply of loanable funds
2. Supply of bonds = demand for loanable funds

© 2004 Pearson Addison-Wesley. All rights reserved 5-10
Changes in Equilibrium Interest Rates
• Make the distinction between:
movement along a demand (or supply) curve and shifts in a demand (or supply) curve.

© 2004 Pearson Addison-Wesley. All rights reserved 5-11
Shifts in the Bond Demand Curve

© 2004 Pearson Addison-Wesley. All rights reserved 5-12
Factors that Shift the Bond Demand Curve
1. WealthA. Economy grows, wealth , Bd , Bd shifts out to right
2. Expected Return (expected i, and expected π)A. i in future, Re for long-term bonds , Bd shifts out to rightB. e , expected return of real assets (physical assets) , relative Re , Bd
shifts out to rightC. Expected return of other assets (ex. stocks) , Bd , Bd shifts out to
right3. Risk
A. Risk of bonds(volatile) , Bd , Bd shifts out to rightB. Risk of other assets , Bd , Bd shifts out to right
4. Liquidity (more people started trading bonds) A. Liquidity of Bonds , Bd , Bd shifts out to rightB. Liquidity of other assets , Bd , Bd shifts out to right

© 2004 Pearson Addison-Wesley. All rights reserved 5-13
Factors that Shift Demand Curve for Bonds

5-14
Shifts in the Bond Supply Curve
1. Profitability of Investment Opportunities
Business cycle expansion, investment opportunities , Bs , Bs shifts out to right
2. Expected Inflation
e , Bs , Bs shifts out to right
3. Government Activities
Deficits , Bs , Bs shifts out to right

© 2004 Pearson Addison-Wesley. All rights reserved 5-15
Factors that Shift the Bond Demand Curve
1. Profitability of Investment Opportunities
Business cycle expansion, investment opportunities , Bs , Bs shifts out to right
2. Expected Inflation
e , the real cost of borrowing , Bs , Bs shifts out to right
3. Government Activities
Deficits , Bs , Bs shifts out to right

© 2004 Pearson Addison-Wesley. All rights reserved 5-16
Factors that Shift Supply Curve for Bonds

5-17
Changes in e: the Fisher Effect
If e 1. Relative RETe ,
Bd shifts in to left
2. Bs , Bs shifts out to right
3. P , i

© 2004 Pearson Addison-Wesley. All rights reserved 5-18
Evidence on the Fisher Effect in the United States

5-19
Business Cycle Expansion
1. Wealth , Bd , Bd shifts out to right
2. Investment , Bs , Bs shifts out to right
3. If Bs shifts more than Bd then P , i

© 2004 Pearson Addison-Wesley. All rights reserved 5-20
Evidence on Business Cycles and Interest Rates

© 2004 Pearson Addison-Wesley. All rights reserved 5-21
Relation of Liquidity PreferenceFramework to Loanable Funds
Keynes’s Major Assumption
Two Categories of Assets in Wealth
Money
Bonds
1. Thus: Ms + Bs = Wealth
2. Budget Constraint: Bd + Md = Wealth
3. Therefore: Ms + Bs = Bd + Md
4. Subtracting Md and Bs from both sides:
Ms – Md = Bd – Bs
Money Market Equilibrium
5. Occurs when Md = Ms
6. Then Md – Ms = 0 which implies that Bd – Bs = 0, so that Bd = Bs and bond market is also in equilibrium (Walras Law).

© 2004 Pearson Addison-Wesley. All rights reserved 5-22
1. Equating supply and demand for bonds as in loanable funds framework is equivalent to equating supply and demand for money as in liquidity preference framework
2. Two frameworks are closely linked, but differ in practice because liquidity preference assumes only two assets, money and bonds, and ignores effects on interest rates from changes in expected returns on real assets (automobiles and houses)

© 2004 Pearson Addison-Wesley. All rights reserved 5-23
Liquidity Preference Analysis
Derivation of Demand Curve1. Keynes assumed money has i = 02. As i , relative RETe on money (equivalently, opportunity cost of money
) Md 3. Demand curve for money has usual downward slope
Derivation of Supply curve1. Assume that central bank controls Ms and it is a fixed amount2. Ms curve is vertical line
Market Equilibrium1. Occurs when Md = Ms, at i* = 15%2. If i = 25%, Ms > Md (excess supply): Price of bonds , i to i* = 15%3. If i =5%, Md > Ms (excess demand): Price of bonds , i to
i* = 15%

© 2004 Pearson Addison-Wesley. All rights reserved 5-24
Money Market Equilibrium

© 2004 Pearson Addison-Wesley. All rights reserved 5-25
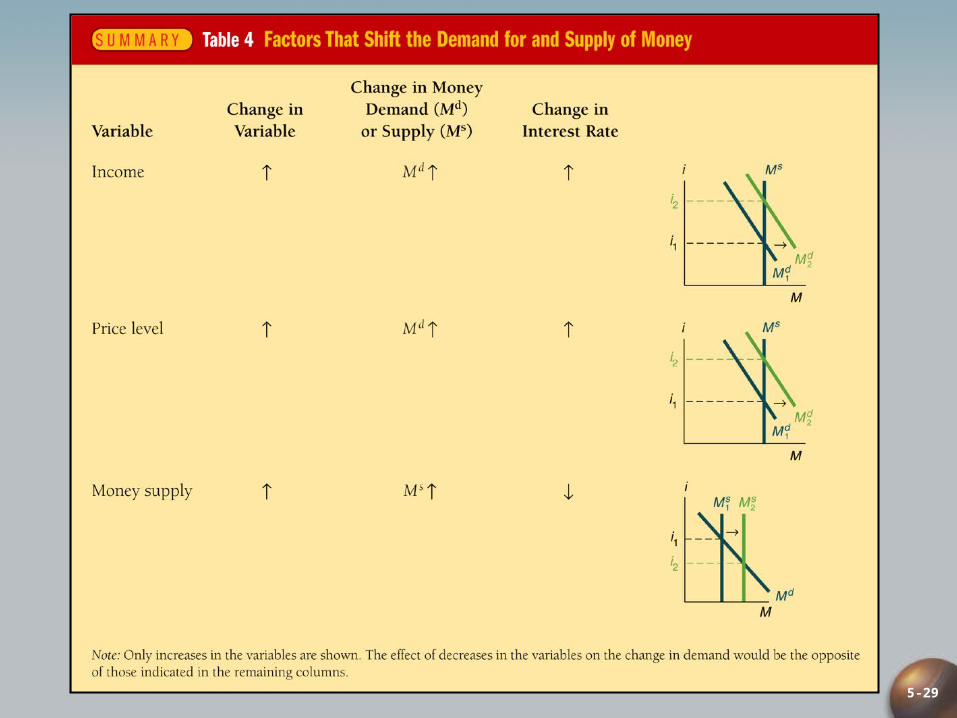
Shifts in the Demand for Money
• Income Effect
Economy expands, income rises, wealth increases, people will hold more money as a store of value and for transactions
• Price-Level Effect
people care about the amount of money they hold in real terms. When the price level rises, the same nominal quantity of money is no longer as valuable

© 2004 Pearson Addison-Wesley. All rights reserved 5-26
Rise in Income or the Price Level
1. Income , Md , Md shifts out to right
2. Ms unchanged
3. i* rises from i1 to i2

© 2004 Pearson Addison-Wesley. All rights reserved 5-27
Shifts in the Supply of Money
• Assume that supply of money is completely controlled by the central bank

© 2004 Pearson Addison-Wesley. All rights reserved 5-28
Rise in Money Supply
1. Ms , Ms shifts out to right
2. Md unchanged
3. i* falls from i1 to i
2
5-29

© 2004 Pearson Addison-Wesley. All rights reserved 5-30
Money and Interest Rates (Application, p.112)
Effects of money on interest rates
1. Liquidity Effect (everything else remaining equal)
Ms , Ms shifts right, i 2. Income Effect
Ms , Income , Md , Md shifts right, i 3. Price Level Effect
Ms , Price level , Md , Md shifts right, i 4. Expected Inflation Effect (a higher rate of money supply growth)
Ms , e , Bd , Bs , Fisher effect, i Effect of higher rate of money growth on interest rates is ambiguous
1. Because income, price level and expected inflation effects work in opposite direction of liquidity effect

5-31
Does Higher Money Growth Lower Interest Rates?

© 2004 Pearson Addison-Wesley. All rights reserved 5-32
Evidence on Money Growth and Interest Rates