CHAPTER 5 Single versus swarm detection of extracellular ...
21
5 CHAPTER 5 Single versus swarm detection of extracellular vesicles by flow cytometry Abstract Background: Microvesicles and exosomes are cell-derived vesicles and potential biomarkers for disease. Recently, the Scientific Standardization Committee col- laborative workshop of the International Society on Thrombosis and Haemostasis initiated standardization of vesicle detection by flow cytometry with polystyrene beads. Because polystyrene beads have different optical properties than vesicles, and because the mechanisms causing the detection signal are incompletely under- stood, there are contradictions between expected and observed results. Objectives: To develop a model with which to relate the detection signal of a flow cytometer to the diameter of vesicles and clarify observed discrepancies. Methods: We com- bined measurements of polystyrene and silica beads with an estimated refractive index of vesicles and performed Mie calculations of light scattering. Results: We established the relationship between measured light scattering and the diameter of vesicles. The Megamix gating strategy proposed by the Scientific Standard- ization Committee selects single vesicles and cells with diameters between 800 and 2,400 nm when applied on the forward-scattering detector of regular flow cy- tometers. Nevertheless, we demonstrated that, irrespective of the applied gating, multiple vesicles smaller than 220 nm or multiple 89 nm silica beads were counted as a single event signal at sufficiently high concentrations. Conclusions: Vesicle detection by flow cytometry is attributed to large single vesicles and swarm de- tection of smaller vesicles; that is, multiple vesicles are simultaneously illuminated by the laser beam and counted as a single event signal. Swarm detection allows the detection of smaller vesicles than previously thought possible, and explains the finding that flow cytometry underestimates the concentration of vesicles. This chapter has been published as: • E. van der Pol, M.J.C. van Gemert, A. Sturk , R. Nieuwland, and T.G. van Leeuwen. Single versus swarm detection of microparticles and exosomes by flow cytometry. J. Thromb. Haemost. 10(5), 919-930 (2012) 67
Transcript of CHAPTER 5 Single versus swarm detection of extracellular ...
5
CHAPTER 5
Single versus swarm detection of
extracellular vesicles by flow cytometry
Abstract
Background: Microvesicles and exosomes are cell-derived vesicles and potentialbiomarkers for disease. Recently, the Scientific Standardization Committee col-laborative workshop of the International Society on Thrombosis and Haemostasisinitiated standardization of vesicle detection by flow cytometry with polystyrenebeads. Because polystyrene beads have different optical properties than vesicles,and because the mechanisms causing the detection signal are incompletely under-stood, there are contradictions between expected and observed results. Objectives:To develop a model with which to relate the detection signal of a flow cytometerto the diameter of vesicles and clarify observed discrepancies. Methods: We com-bined measurements of polystyrene and silica beads with an estimated refractiveindex of vesicles and performed Mie calculations of light scattering. Results: Weestablished the relationship between measured light scattering and the diameterof vesicles. The Megamix gating strategy proposed by the Scientific Standard-ization Committee selects single vesicles and cells with diameters between 800and 2,400 nm when applied on the forward-scattering detector of regular flow cy-tometers. Nevertheless, we demonstrated that, irrespective of the applied gating,multiple vesicles smaller than 220 nm or multiple 89 nm silica beads were countedas a single event signal at sufficiently high concentrations. Conclusions: Vesicledetection by flow cytometry is attributed to large single vesicles and swarm de-tection of smaller vesicles; that is, multiple vesicles are simultaneously illuminatedby the laser beam and counted as a single event signal. Swarm detection allowsthe detection of smaller vesicles than previously thought possible, and explains thefinding that flow cytometry underestimates the concentration of vesicles.
This chapter has been published as:
• E. van der Pol, M.J.C. van Gemert, A. Sturk , R. Nieuwland, and T.G. vanLeeuwen. Single versus swarm detection of microparticles and exosomes by flowcytometry. J. Thromb. Haemost. 10(5), 919-930 (2012)
67

5
Chapter 5. Detection of extracellular vesicles by flow cytometry
5.1 Introduction
Microvesicles and exosomes are cell-derived vesicles present in body fluids thatcontribute to coagulation, inflammation, cellular homeostasis and survival, inter-cellular communication, and transport of waste materials [268, 215, 244]. The size,concentration, biochemical composition, and cellular origin of these biological vesi-cles contain clinically relevant information [30, 191, 245]. However, because of thesmall size of vesicles (30 nm to 1µm), they are below the detection range of manycurrently used techniques [233]. Throughout this chapter, we will use ‘vesicles’ asa generic term for all types of extracellular, biological vesicle.
Approximately 75 % of laboratories apply flow cytometry to detect vesiclesin clinical samples [178]. A flow cytometer guides cells and vesicles through alaser beam in a hydrodynamically focused fluid stream. One detector is placed inline with the laser beam, and measures the forward-scattered light (FSC). Otherdetectors measure the side-scattered light (SSC) and fluorescence intensity per-pendicular to the beam. Light scattering by vesicles is essential, as scattering isgenerally used as the trigger signal telling the instrument that a vesicle is present.
A difficulty with flow cytometry is that the relationship between the mea-sured light scattering and the diameter of vesicles is unknown, resulting in recentdiscussions about the standardization of vesicle detection [58, 210, 252] and inunexplained contradictions between the expected and observed measurement re-sults. For example, according to the literature, the smallest polystyrene beads thatcan be detected by commercial flow cytometers typically have a diameter between200 nm and 300 nm [58, 251, 225]. Because vesicles have a lower refractive indexthan polystyrene beads, they scatter light approximately 10-fold less efficientlythan polystyrene beads [58]. Consequently, the smallest single vesicles that aredetectable by flow cytometry must be larger than ∼ 500 nm. Using transmissionelectron microscopy (TEM) image analysis, we have recently shown that urinaryvesicles are smaller than 500 nm [233], so we would not expect these vesicles tobe detected by flow cytometry. Nevertheless, urinary vesicles are detectable byflow cytometry [318], although, from reference measurements with nanoparticletracking analysis and atomic force microscopy, we now know that flow cytometryunderestimates the concentration of vesicles by ∼ 1,000-fold [333, 124].
To resolve the contradictions in vesicle detection by flow cytometry, we will firstpresent measurements on polystyrene beads and silica beads of known diameter,concentration, and refractive index. Combined with Mie calculations of the opticalscattering power, this allows calibration of the flow cytometer, i.e. relating thedetected scattering power to the diameter of single polystyrene or silica beads. Onthat basis, and using an estimated refractive index, we assess the diameter rangeof the smallest detectable single vesicles. In addition, we show that 89 nm silicabeads, which have optical properties resembling those of vesicles, can be detectedby regular flow cytometry, albeit at a higher concentration than used to detectsingle beads. Using dilution series of silica beads and cell-free urine, we elucidatethe underlying mechanisms of vesicle detection.
68
5.2. Methods
5
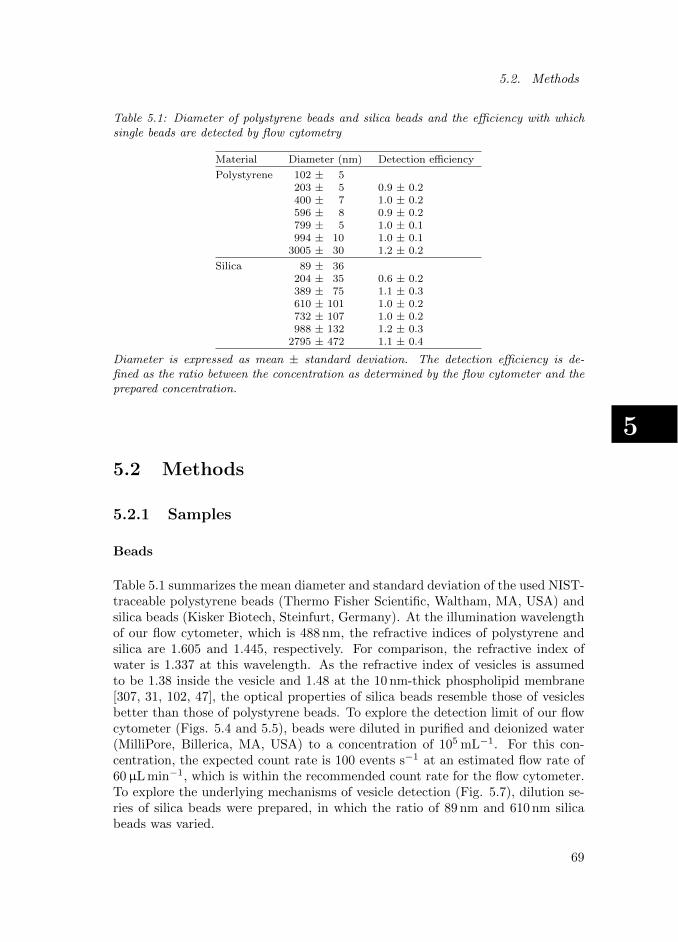
Table 5.1: Diameter of polystyrene beads and silica beads and the efficiency with whichsingle beads are detected by flow cytometry
Material Diameter (nm) Detection efficiency
Polystyrene 102 ± 5203 ± 5 0.9 ± 0.2400 ± 7 1.0 ± 0.2596 ± 8 0.9 ± 0.2799 ± 5 1.0 ± 0.1994 ± 10 1.0 ± 0.1
3005 ± 30 1.2 ± 0.2
Silica 89 ± 36204 ± 35 0.6 ± 0.2389 ± 75 1.1 ± 0.3610 ± 101 1.0 ± 0.2732 ± 107 1.0 ± 0.2988 ± 132 1.2 ± 0.3
2795 ± 472 1.1 ± 0.4
Diameter is expressed as mean ± standard deviation. The detection efficiency is de-fined as the ratio between the concentration as determined by the flow cytometer and theprepared concentration.
5.2 Methods
5.2.1 Samples
Beads
Table 5.1 summarizes the mean diameter and standard deviation of the used NIST-traceable polystyrene beads (Thermo Fisher Scientific, Waltham, MA, USA) andsilica beads (Kisker Biotech, Steinfurt, Germany). At the illumination wavelengthof our flow cytometer, which is 488 nm, the refractive indices of polystyrene andsilica are 1.605 and 1.445, respectively. For comparison, the refractive index ofwater is 1.337 at this wavelength. As the refractive index of vesicles is assumedto be 1.38 inside the vesicle and 1.48 at the 10 nm-thick phospholipid membrane[307, 31, 102, 47], the optical properties of silica beads resemble those of vesiclesbetter than those of polystyrene beads. To explore the detection limit of our flowcytometer (Figs. 5.4 and 5.5), beads were diluted in purified and deionized water(MilliPore, Billerica, MA, USA) to a concentration of 105 mL−1. For this con-centration, the expected count rate is 100 events s−1 at an estimated flow rate of60µL min−1, which is within the recommended count rate for the flow cytometer.To explore the underlying mechanisms of vesicle detection (Fig. 5.7), dilution se-ries of silica beads were prepared, in which the ratio of 89 nm and 610 nm silicabeads was varied.
69

5
Chapter 5. Detection of extracellular vesicles by flow cytometry
Vesicles
Cell-derived vesicles from human urine were used as a reference sample, becausevesicles can be easily isolated without substantial contamination [233]. Freshmorning urine from five overnight-fasting healthy male subjects was collected,pooled, and centrifuged in 50 mL Falcon tubes for 10 min at 180 g and 4 ◦C (Mikro200 R; Hettich, Tuttlingen, Germany) within 10 min after collection. The super-natant (45 mL) was collected and centrifuged for another 20 min at 1,550 g and4 ◦C to remove the remaining cells. Aliquots of the supernatant (40 mL) werefrozen in liquid nitrogen and stored at −80 ◦C. Samples were thawed on meltingice for 1 h, and centrifuged for 10 min at 1,550 g and 4 ◦C to remove precipitatedamorphous salts.
5.2.2 TEM
For TEM analysis, vesicles were isolated by ultracentrifugation 60 min at 154,000 gand 4 ◦C), and washed once in phosphate-buffered saline (PBS)-citrate. Next, vesi-cles were resuspended in 0.2 % paraformaldehyde (w/v). After fixation for 24 h,vesicles were allowed to adhere to formvar-carbon coated 300 mesh grids (Elec-tron Microscopy Sciences, Hatfield, PA, USA), stained with 1.75 % uranyl acetate(w/v), and imaged with a transmission electron microscope (CM-10; Philips, Eind-hoven, The Netherlands) at 100 kV. From 1,000 vesicles, the surface area wasdetermined by use of a custom-made Javascript with the Quick selection tool ofPhotoshop version 11.0.2 (Adobe Systems, San Jose, CA, USA). From the sur-face area, the diameter of each vesicle was calculated to create a size distribution.
5.2.3 Flow cytometry
FSC and SSC powers were measured for 1 min with a FACSCalibur (Becton Dick-inson, Franklin Lakes, NJ, USA) at a high flow rate (60µL min−1). The flowcytometer has a linearly polarized 15 mW argon-ion laser emitting at 488 nm. Thebeam is elliptically focused to a cross-sectional area of 22 × 66µm2, and at highflow rate the sample core diameter is 56µm [68]. Consequently, the effective beamvolume is 22 · π · 282 = 5.4 · 104 µm3 or 54 pL. The illumination intensity is∼ 1.4 · 107 W m−2 [114]. We selected SSC as the trigger signal to indicate to theinstrument that a vesicle or bead is present. The following detector settings wereused throughout this experiment. For SSC, the applied voltage was 400 V, thegain was 1, and the threshold was 0. For FSC, the amplification was 100, the gainwas 1, and the threshold was 0. As no threshold was applied, optical, electronicand fluidic noise contribute to a considerable noise background [271]. However, inmodern flow cytometers, both the dark current and stray light are electronicallysubtracted from the signal coming from the detector by the baseline restorer, re-sulting in a stable and relatively low noise background of < 10,000 counts min−1
in our case. To account for this remaining noise background, a background mea-surement was performed with purified and deionized water before and after each
70

5.2. Methods
5
Table 5.2: Parameters used for Mie calculations
Parameter Value
Refractive index: polystyrene 1.605Refractive index: silica 1.445Refractive index: water 1.337Refractive index: vesicle inside 1.38± 0.02Refractive index: vesicle at the membrane 1.48Vesicle membrane thickness (nm) 10Illumination wavelength (nm) 488Illumination intensity (W m−2) 1.4 · 107
Collection angle: FSC Becton Dickinson FACSCalibur (◦) 0.5−7Collection angle: SSC Becton Dickinson FACSCalibur (◦) 47−133Collection angle: FSC Apogee A40 (◦) 1−70Collection angle: FSC Beckman Coulter FC500 (◦) 2−16
The refractive indices are provided for room temperature, atmospheric pressure, and anillumination wavelength of 488 nm. FSC, forward-scattered light; SSC, side-scatteredlight.
measurement series. The average SSC and FSC histograms of these backgroundmeasurements were subtracted from each dataset.
5.2.4 Mie theory
The power of light scattered in a particular direction by a spherical particle, suchas a bead or a vesicle, is calculated by Mie theory, and involves the diameter andrefractive index of the particle, the refractive index of the surrounding medium,and the wavelength, polarization and intensity of light [40]. We selected Mietheory because, in contrast to Rayleigh scattering and Faunhofer diffraction, itis valid for any ratio of the diameter of the particle to the wavelength [233, 40].All Mie calculations in this chapter are based on the matlab scripts of Matzler[197], and are similar to the calculations of Fattaccioli et al. [97], but other freesoftware is online available [182]. Data processing was performed with matlab(v.7.9.0.529), and graphs were plotted with OriginPro (v.8.0724). As inputfor the Mie calculations, we used the parameters listed in Table 5.2. Here, weassumed that urine has a refractive index equal to that of water, and that vesiclesare spherical and have refractive indices of 1.38 ± 0.02 inside and 1.48 at the10 nm-thick phospholipid membrane [307, 31, 102, 47]. Our estimation of theinner refractive index of vesicles is based on the measured inner refractive index ofcells and bacteria [307]. As vesicles originate from their parent cell, we expectedthat vesicles would have an inner refractive index equal to that of their parent cell.
5.2.5 Flow cytometer calibration
Flow cytometry provides the detected scattering power in arbitrary units, implyingthat the relationship between the detected scattering power and the diameter of
71

5
Chapter 5. Detection of extracellular vesicles by flow cytometry
Flow cytometer
Mie calculation
P (a.u.)
P (mW)
Calibrationfactor
Flow cytometer P (a.u.)
Flow cytometer
Mie calculation
P (a.u.)
P (mW)
Calibrationfactor
known refractiveindex and diameter
unknown diameter
diameter estimated
A
B
C
?
Figure 5.1: From de-tected scattering powerto vesicle diameter. (A)The relationship betweenthe vesicle (circle) di-ameter and the detectedscattering power P inarbitrary units (a.u.)is unknown. (B) Frombeads (circle) with knowndiameter and refractiveindex, the scatteringpower P (a.u.) can bemeasured. In parallel,the true scattering powerP (mW) can be calcu-lated by Mie theory toobtain the calibrationfactor, which relatesthe detected scatteringpower to the calculatedscattering power. (C)By use of the calibrationfactor, it is possibleto convert the detectedscattering power of anyspherical particle to thescattering power andapply Mie calculationsto estimate the particlediameter.
72

5.3. Results
5
vesicles is unknown, as illustrated in Fig. 5.1A. To establish this relationship, wemeasured the relative power in arbitrary units (a.u.) and, in parallel, calculatedthe absolute power (mW) of light that scattered by beads of known diameterand refractive index in the direction of the detectors. Fig. 5.1B shows that thisapproach enables us to obtain a calibration factor that relates the detected tothe calculated scattering power. The calibration factor is thus a property of thedetector and the optical configuration of the instrument, and is independent of thesample. Fig. 5.1C shows that this calibration factor allows estimation of the truediameter of the particle. Note that the calculated scattering power depends on theestimated illumination intensity (Table 5.2). However, as the detected scatteringpower is fitted to the calculated scattering power by use of the calibration factor,the relationship between the detected scattering power and the diameter of vesiclesremains similar for any value of the illumination intensity.
5.2.6 Tunable Resistive pulse sensing
To estimate the concentration of vesicles in cell-free urine, tunable resistive pulsesensing (Izon qNano, Christchurch, New Zealand) was applied. The thawed cell-free urine was diluted 1:10 with PBS. At least 1,000 vesicles were counted ata pressure of 6.9 mbar, using both NP100A and NP400A nanopores, which areoptimized for the detection of particles with diameters ranging from 50 nm to200 nm and 200 nm to 800 nm, respectively.
5.3 Results
5.3.1 Flow cytometry detects vesicles smaller than 220 nm
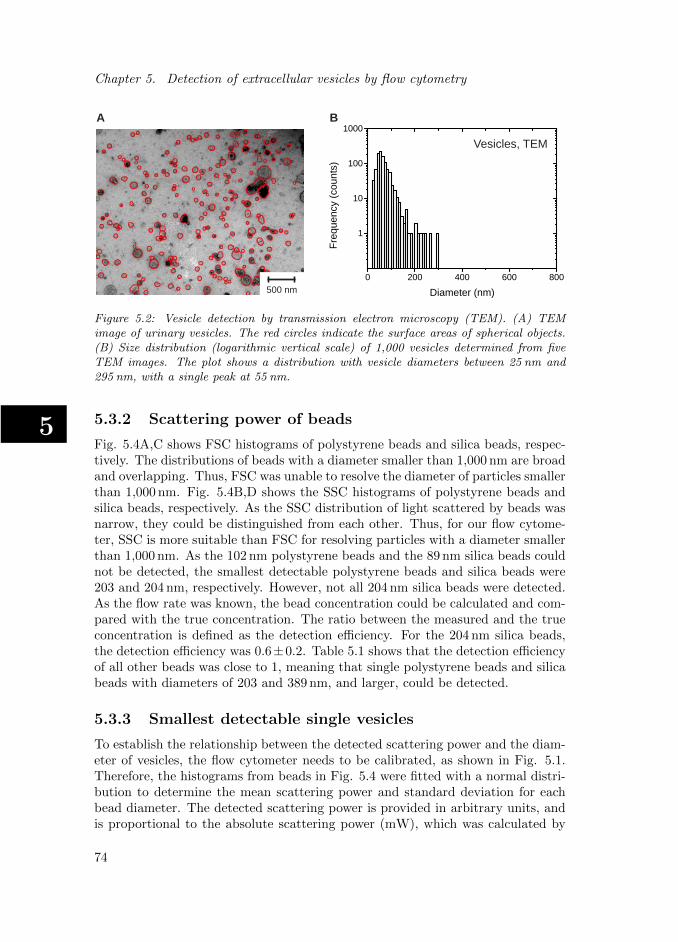
Fig. 5.2A shows a TEM image of vesicles from urine and Fig. 5.2B their deter-mined size distribution. The largest vesicles had a diameter of 295 nm. As thediameter of the smallest polystyrene beads that can be detected by commercialflow cytometers is typically between 200 nm and 300 nm [58, 251, 225], and becausevesicles have a lower refractive index than polystyrene beads, we would not expectthese urinary vesicles to be detected by flow cytometry.
Fig. 5.3A,B shows the FSC and SSC histograms of the same urine samplemeasured with flow cytometry. Both histograms show a peak, indicating thatvesicles were detected. To exclude the possibility that vesicles larger than 300 nmwere present, urine was subsequently filtered with a 220 nm filter (MilliPore) beforeanalysis. Fig. 5.3C,D shows that, after filtration, FSC and SSC histograms ofvesicles were still obtained, although at fewer counts per minute than with theunfiltered sample. Thus, in contrast to our expectations, flow cytometry detectedvesicles smaller than 220 nm.
73
5
Chapter 5. Detection of extracellular vesicles by flow cytometry
0 200 400 600 800
1
10
100
1000
Freq
uenc
y (c
ount
s)
Diameter (nm)
A B
Vesicles, TEM
500 nm
Figure 5.2: Vesicle detection by transmission electron microscopy (TEM). (A) TEMimage of urinary vesicles. The red circles indicate the surface areas of spherical objects.(B) Size distribution (logarithmic vertical scale) of 1,000 vesicles determined from fiveTEM images. The plot shows a distribution with vesicle diameters between 25 nm and295 nm, with a single peak at 55 nm.
5.3.2 Scattering power of beads
Fig. 5.4A,C shows FSC histograms of polystyrene beads and silica beads, respec-tively. The distributions of beads with a diameter smaller than 1,000 nm are broadand overlapping. Thus, FSC was unable to resolve the diameter of particles smallerthan 1,000 nm. Fig. 5.4B,D shows the SSC histograms of polystyrene beads andsilica beads, respectively. As the SSC distribution of light scattered by beads wasnarrow, they could be distinguished from each other. Thus, for our flow cytome-ter, SSC is more suitable than FSC for resolving particles with a diameter smallerthan 1,000 nm. As the 102 nm polystyrene beads and the 89 nm silica beads couldnot be detected, the smallest detectable polystyrene beads and silica beads were203 and 204 nm, respectively. However, not all 204 nm silica beads were detected.As the flow rate was known, the bead concentration could be calculated and com-pared with the true concentration. The ratio between the measured and the trueconcentration is defined as the detection efficiency. For the 204 nm silica beads,the detection efficiency was 0.6±0.2. Table 5.1 shows that the detection efficiencyof all other beads was close to 1, meaning that single polystyrene beads and silicabeads with diameters of 203 and 389 nm, and larger, could be detected.
5.3.3 Smallest detectable single vesicles
To establish the relationship between the detected scattering power and the diam-eter of vesicles, the flow cytometer needs to be calibrated, as shown in Fig. 5.1.Therefore, the histograms from beads in Fig. 5.4 were fitted with a normal distri-bution to determine the mean scattering power and standard deviation for eachbead diameter. The detected scattering power is provided in arbitrary units, andis proportional to the absolute scattering power (mW), which was calculated by
74

5.3. Results
5
0
20000
40000
60000
80000
Freq
uenc
y (c
ount
s m
in-1)
Power (a.u.)1 10 100 1000 10000
0
20000
40000
60000
80000
Freq
uenc
y (c
ount
s m
in-1)
Power (a.u.)1 10 100 1000 10000
0
20000
40000
60000
80000
Freq
uenc
y (c
ount
s m
in-1)
Power (a.u.)1 10 100 1000 10000
0
20000
40000
60000
80000
Freq
uenc
y (c
ount
s m
in-1)
Power (a.u.)1 10 100 1000 10000
A B
C D
Vesicles, FSC Vesicles, SSC
Vesicles, 0.22 µm filter, FSC Vesicles, 0.22 µm filter, SSC
Figure 5.3: Vesicle detection by flow cytometry. (A) Forward-scattered light (FSC) his-togram (logarithmic horizontal scale) of urinary vesicles. A flat peak is observed. In total,5.5 · 105 events were counted during 1 min. (B) Side-scattered light (SSC) histogram ofurinary vesicles. A single peak is observed. (C) FSC histogram of urinary vesicles filteredthrough a 220 nm filter. A flat peak is observed. In total, 5.7 · 104 events were countedduring 1 min. (D) SSC histogram of urinary vesicles filtered through a 220 nm filter. Asingle peak is observed. a.u., arbitrary units.
75

5
Chapter 5. Detection of extracellular vesicles by flow cytometry
2000
4000
6000
8000
Power (a.u.)
400 nm596 nm 799 nm
994 nm
Freq
uenc
y (c
ount
s m
in-1)
3005 nm
1 10 100 1000 100000
2000
4000
6000
8000
Power (a.u.)
203 nm
400 nm
596 nm
799 nm
994 nm
Freq
uenc
y (c
ount
s m
in-1)
3005 nm
1 10 100 1000 10000
0
2000
4000
6000
8000
Freq
uenc
y (c
ount
s m
in-1)
1 10 100 1000 10000
Power (a.u.)
389 nm 610 nm
732 nm
988 nm204 nm
2795 nm
0
2000
4000
6000
8000
204 nm
389 nm610 nm
732 nm988 nm
2795 nm
Freq
uenc
y (c
ount
s m
in-1)
1 10 100 1000 10000
Power (a.u.)
A B
DC
Polystyrene, FSC Polystyrene, SSC
Silica, FSC Silica, SSC
Figure 5.4: Forward-scattered light (FSC) and side-scattered light (SSC) histograms (log-arithmic horizontal scale) for polystyrene beads (A, B) and silica beads (C, D) of knowndiameters and at a concentration 1 · 105 mL−1. The FSC distributions from beads with adiameter smaller than 1,000 nm are broad and overlapping, whereas the SSC distributionsfor the same beads are narrow and can be distinguished from each other. a.u., arbitraryunits.
76
5.3. Results
5
0 500 1000 150010-7
10-6
10-5
10-4
10-3
Pow
er (m
W)
Diameter (nm)0 500 1000 1500
10-5
10-4
10-3
10-2
10-1
Pow
er (m
W)
Diameter (nm)
0 1000 2000 300010-4
10-3
10-2
10-1
100
Pow
er (m
W)
Diameter (nm)0 1000 2000 3000
10-7
10-6
10-5
10-4
10-3
10-2
Pow
er (m
W)
Diameter (nm) Polystyrene Mie calculation Silica Mie calculation Polystyrene data Silica data
Polystyrene Mie calculation Silica Mie calculation Vesicle Mie calculation Polystyrene data Silica data
A B
DC
FSC, beads SSC, beads
FSC, vesicles SSC, vesicles
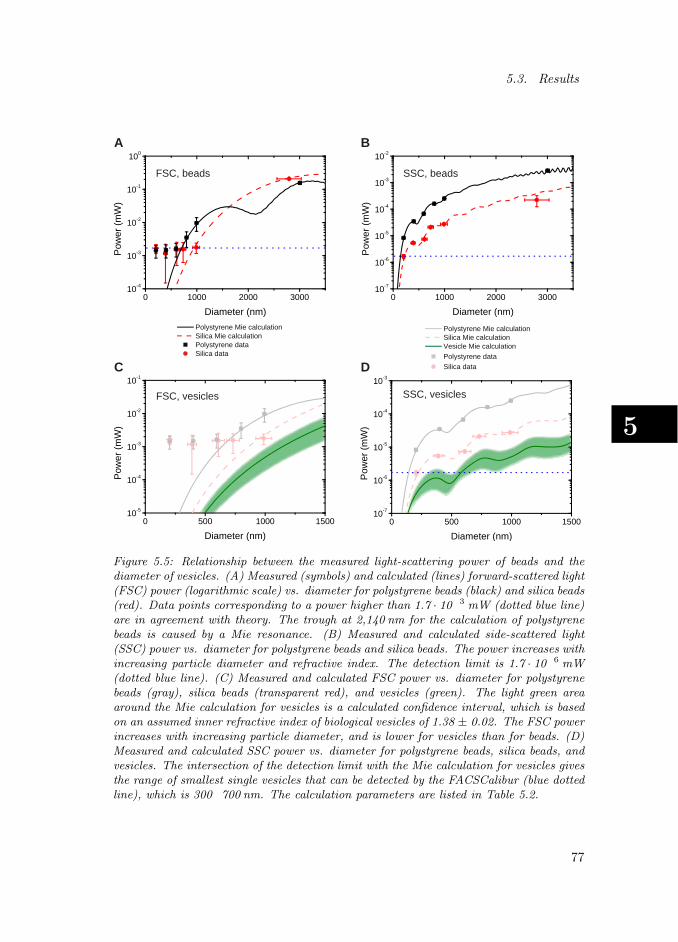
Figure 5.5: Relationship between the measured light-scattering power of beads and thediameter of vesicles. (A) Measured (symbols) and calculated (lines) forward-scattered light(FSC) power (logarithmic scale) vs. diameter for polystyrene beads (black) and silica beads(red). Data points corresponding to a power higher than 1.7 · 10� 3 mW (dotted blue line)are in agreement with theory. The trough at 2,140 nm for the calculation of polystyrenebeads is caused by a Mie resonance. (B) Measured and calculated side-scattered light(SSC) power vs. diameter for polystyrene beads and silica beads. The power increases withincreasing particle diameter and refractive index. The detection limit is 1.7 · 10� 6 mW(dotted blue line). (C) Measured and calculated FSC power vs. diameter for polystyrenebeads (gray), silica beads (transparent red), and vesicles (green). The light green areaaround the Mie calculation for vesicles is a calculated confidence interval, which is basedon an assumed inner refractive index of biological vesicles of 1.38 ± 0.02. The FSC powerincreases with increasing particle diameter, and is lower for vesicles than for beads. (D)Measured and calculated SSC power vs. diameter for polystyrene beads, silica beads, andvesicles. The intersection of the detection limit with the Mie calculation for vesicles givesthe range of smallest single vesicles that can be detected by the FACSCalibur (blue dottedline), which is 300� 700 nm. The calculation parameters are listed in Table 5.2.
77
5
Chapter 5. Detection of extracellular vesicles by flow cytometry
Mie theory. For our instrument, the calibration factors that relate the measuredto the calculated scattering power are 2.07 ·105 for the FSC detector and 1.26 ·106
for the SSC detector. Fig. 5.5A shows the measured and calculated FSC powervs. the diameter of polystyrene beads and silica beads. Data points correspondingto a power higher than 1.7 · 10−3 mW are in agreement with the Mie calculations.Some beads from which the scattered power was below 1.7·10−3 mW were detectedby FSC, but the observed power was not related to the size of the beads. Fig.5.5B shows the measured and calculated SSC power vs. diameter for polystyrenebeads and silica beads. The power increased with increasing particle diameter andrefractive index. The data are in excellent agreement with the Mie calculations,except for the 2,795 nm silica beads. We attribute the underestimation of thescattered power of 2,795 nm silica beads to a decreased refractive index resultingfrom porosity, as stated by the manufacturer. The effective refractive index of theporous 2,795 nm silica beads that matches with our measurement is 1.423 ratherthan 1.445. The power corresponding to the smallest detectable beads is definedas the detection limit, which is 1.7 · 10−6 mW, meaning that each single vesicle forwhich the SSC power was equal to or higher than 1.7 ·10−6 mW would be detected.
Now the diameter of the smallest detectable single vesicles by flow cytometrycan be assessed. Fig. 5.5C is a close-up of the lower part of Fig. 5.5A, extendedwith the calculated FSC power of vesicles. Note that the vesicles scatter lightless efficiently than beads, owing to their lower refractive index. As the exact re-fractive index of vesicles is unknown, the light green area represents an estimatedconfidence interval, which is based on an assumed inner refractive index of bio-logical vesicles of 1.38 ± 0.02. Fig. 5.5D is a close-up of the lower part of Fig.5.5B, extended with the calculated SSC power of vesicles. As the detection limitis 1.7 · 10−6 mW, the estimated diameter range of the smallest detectable singlevesicle is 300−700 nm, which contradicts our finding that vesicles smaller than220 nm can be detected by flow cytometry (Fig. 5.3).
5.3.4 Detection of vesicles smaller than 220 nm and 89 nmsilica beads
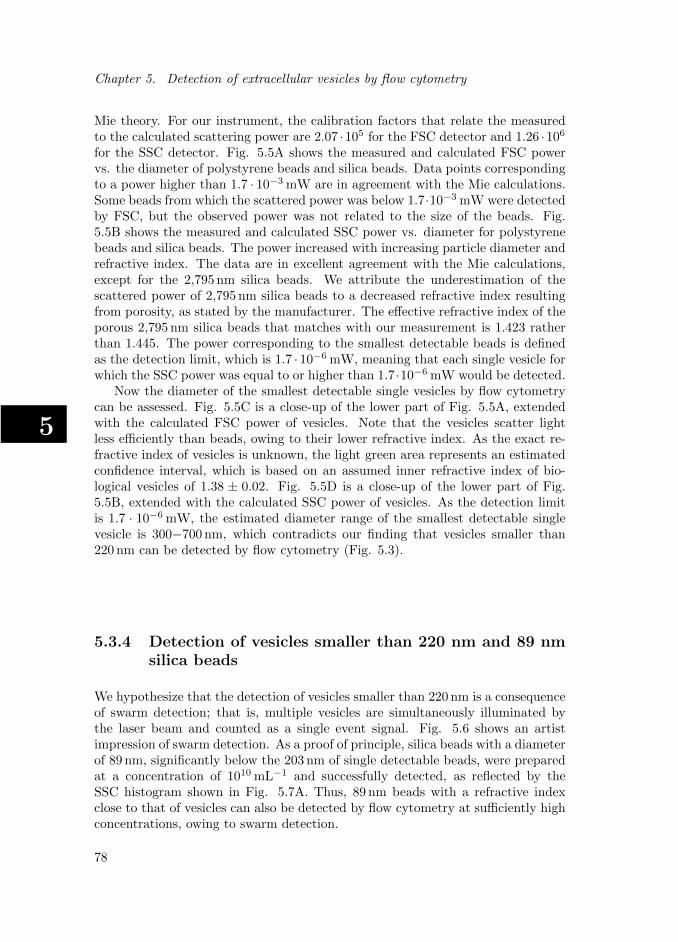
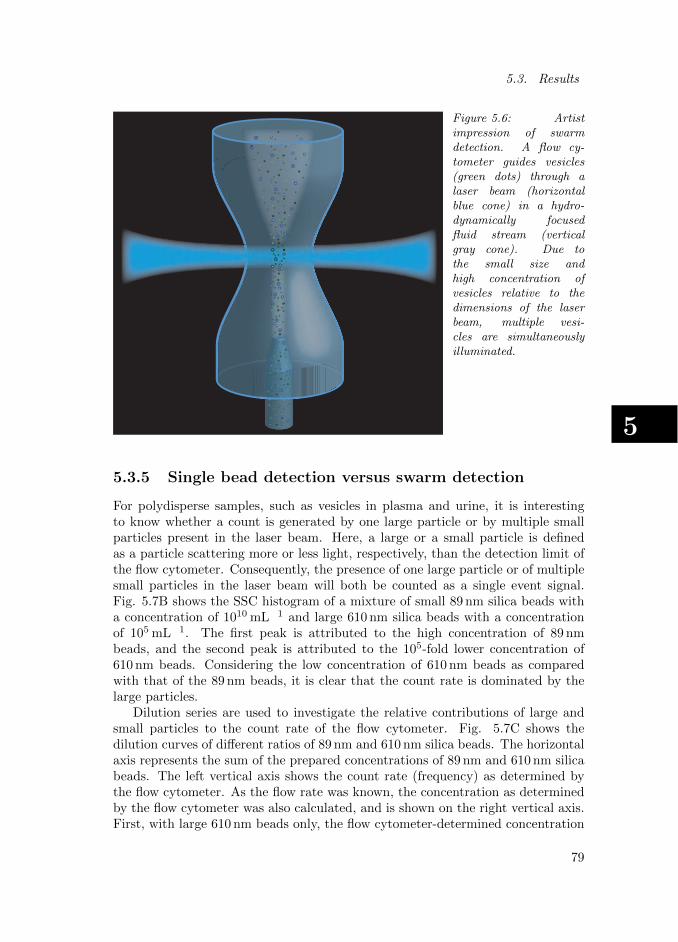
We hypothesize that the detection of vesicles smaller than 220 nm is a consequenceof swarm detection; that is, multiple vesicles are simultaneously illuminated bythe laser beam and counted as a single event signal. Fig. 5.6 shows an artistimpression of swarm detection. As a proof of principle, silica beads with a diameterof 89 nm, significantly below the 203 nm of single detectable beads, were preparedat a concentration of 1010 mL−1 and successfully detected, as reflected by theSSC histogram shown in Fig. 5.7A. Thus, 89 nm beads with a refractive indexclose to that of vesicles can also be detected by flow cytometry at sufficiently highconcentrations, owing to swarm detection.
78
5.3. Results
5
Figure 5.6: Artistimpression of swarmdetection. A flow cy-tometer guides vesicles(green dots) through alaser beam (horizontalblue cone) in a hydro-dynamically focusedfluid stream (verticalgray cone). Due tothe small size andhigh concentration ofvesicles relative to thedimensions of the laserbeam, multiple vesi-cles are simultaneouslyilluminated.
5.3.5 Single bead detection versus swarm detection
For polydisperse samples, such as vesicles in plasma and urine, it is interestingto know whether a count is generated by one large particle or by multiple smallparticles present in the laser beam. Here, a large or a small particle is definedas a particle scattering more or less light, respectively, than the detection limit ofthe flow cytometer. Consequently, the presence of one large particle or of multiplesmall particles in the laser beam will both be counted as a single event signal.Fig. 5.7B shows the SSC histogram of a mixture of small 89 nm silica beads witha concentration of 1010 mL�1 and large 610 nm silica beads with a concentrationof 105 mL�1. The first peak is attributed to the high concentration of 89 nmbeads, and the second peak is attributed to the 105-fold lower concentration of610 nm beads. Considering the low concentration of 610 nm beads as comparedwith that of the 89 nm beads, it is clear that the count rate is dominated by thelarge particles.
Dilution series are used to investigate the relative contributions of large andsmall particles to the count rate of the flow cytometer. Fig. 5.7C shows thedilution curves of different ratios of 89 nm and 610 nm silica beads. The horizontalaxis represents the sum of the prepared concentrations of 89 nm and 610 nm silicabeads. The left vertical axis shows the count rate (frequency) as determined bythe flow cytometer. As the flow rate was known, the concentration as determinedby the flow cytometer was also calculated, and is shown on the right vertical axis.First, with large 610 nm beads only, the flow cytometer-determined concentration
79

5
Chapter 5. Detection of extracellular vesicles by flow cytometry
103 105 107 109 1011 1013102
103
104
105
106
Filtered,undiluted
Freq
uenc
y (c
ount
s m
in-1)
Concentrationtunable resistive pulse sensing (particles ml-1)
Unfiltered,undiluted
104
105
106
107
Con
cent
ratio
n flow
cyt
omet
er (p
artic
les
ml-1
)
0
5000
10000
15000
89 nm, 1010 beads ml-1
Freq
uenc
y (c
ount
s m
in-1)
Power (a.u.)1 10 100 1000 10000
0
5000
10000
15000
Freq
uenc
y (c
ount
s m
in-1)
Power (a.u.)
89 nm, 1010 beads ml-1
610 nm, 105 beads ml-1
1 10 100 1000 10000
Silica, SSC
Cell-free urine Filtered cell-free urine Acquisition range
103 105 107 109 1011 1013102
103
104
105
106
Freq
uenc
y (c
ount
s m
in-1)
Concentrationprepared (particles ml-1)
104
105
106
107
Con
cent
ratio
n flow
cyt
omet
er (p
artic
les
ml-1
)
610 nm beads 610 nm and 89 nm beads (1/100) 610 nm and 89 nm beads (1/10,000) 610 nm and 89 nm beads (1/100,000) 89 nm beads Frequency attributed to detecting 610 nm beads only Iso 610 nm beads concentration Acquisition range
A B
Silica, SSC
C D
Silica, SSC Cell-free urine, SSC
Figure 5.7: Relative contributions of mechanisms underlying vesicle detection. Side-scattered light (SSC) histogram (logarithmic horizontal scale) for (A) 89 nm silica beadsat a concentration of 1 · 1010 mL−1, and (B) a mixture of 89 nm and 610 nm silica beadsat concentrations of 1 · 1010 mL−1 and 1 · 105 mL−1, respectively. (C) Frequency or countrate vs. total concentration (logarithmic scales) of 610 nm silica beads (diamonds), 89 nmsilica beads (squares), mixtures of 610 nm and 89 nm silica beads prepared at ratios of1:100 (green triangles), 1:10,000 (blue triangles), and 1:100,000 (circles), and (D) cell-free urine and cell-free urine filtered (arrow) through a 220 nm filter. The right verticalaxis shows the concentration as determined with the flow cytometer. Data points withinthe acquisition range (gray area) should be considered reliable. The error bars overlap withthe symbols and are omitted to improve legibility. The dashed horizontal lines indicatethe count rates corresponding to the detection of 610 nm silica beads at four differentconcentrations. The solid gray lines are exponential fits through data points with similarconcentrations of 610 nm silica beads. a.u., arbitrary units.
80

5.4. Discussion and conclusion
5
obviously equaled that of the prepared concentration, and, within the acquisitionrange (gray area), the relationship between count rate and concentration was linear(dark red diamonds). Second, after addition of 100 beads of 89 nm to each 610 nmbead, the flow cytometer-determined concentration remained similar to that of thesamples containing 610 nm beads only (dashed horizontal lines), meaning that, atthis concentration, the 89 nm beads had no influence on the count rate (greentriangles). Third, if we added 10,000 beads of 89 nm to each 610 nm bead, the flowcytometer-determined concentration increased by 40 %, on average, in comparisonwith the samples containing 610 nm beads only (blue triangles), and with additionof 100,000 beads of 89 nm to each 610 nm bead, the flow cytometer-determinedconcentration increased by 350 %, on average, in comparison with the samplescontaining 610 nm beads only (red circles). For the latter mixture, the relationshipbetween count rate and prepared concentration is non-linear, as indicated by theincreased slope, and the data overlap with those of the pure 89 nm beads (blacksquares), indicating that the count rate is dominated by the simultaneous presenceof multiple 89 nm beads in the laser beam.
5.3.6 Single vesicle detection versus swarm detection
Fig. 5.7D shows the dilution curves of cell-free urine and cell-free urine filteredthrough a 220 nm filter. With tunable resistive pulse sensing (data not shown), theconcentrations of vesicles in unfiltered and filtered cell-free urine were estimatedto be 3.0 · 1010 mL−1 and 1.6 · 1010 mL−1, respectively. For cell-free urine, therelationship between the count rate and the concentration is linear, meaning thatthe counts are predominantly caused by single large vesicles. However, the dilutioncurve of the filtered cell-free urine reveals that small vesicles also contribute to thecount rate (Fig. 5.7D). The relationship between count rate and concentration offiltered cell-free urine is non-linear, as indicated by the increased slope, confirmingthat the counts are caused by swarm detection.
5.4 Discussion and conclusion
We have developed a model that relates the measured light scattering power tothe diameter of single vesicles by combining measurements on polystyrene beadsand silica beads with Mie calculations. Two mechanisms for vesicle detection byflow cytometry can be derived from the results. First, a single vesicle is counted ifits diameter is larger than 300−700 nm, i.e. the smallest detectable single vesiclediameter estimated for our flow cytometer. Second, a swarm of multiple smallervesicles is counted as a single event signal if the power of light scattered by allvesicles that are simultaneously present in the laser beam exceeds the detectionlimit. For polydisperse samples, such as vesicles in plasma and urine, counts aregenerated by a combination of single particle and swarm detection.
If large and small particles are defined as particles scattering more or less lightthan the detection limit of the flow cytometer, single particle detection is caused by
81

5
Chapter 5. Detection of extracellular vesicles by flow cytometry
103 105 107 109 1011 1013102
103
104
105
106
Flow rate: High Medium LowFr
eque
ncy
(cou
nts
min
-1)
Concentrationprepared (particles ml-1)
104
105
106
107
Con
cent
ratio
n flow
cyt
omet
er (p
artic
les
ml-1
)
Figure 5.8: Flow rate dependency ofswarm detection. Frequency or countrate vs. total concentration of 89 nmsilica beads at high (63 µL min−1;squares), medium (37 µL min−1; cir-cles) and low (12 µL min−1; trian-gles) flow rates. The solid lines arelinear fits through the data points be-low the maximum acquisition range.The right vertical axis shows the con-centration as determined by the flowcytometer. Data points within the ac-quisition range (gray area) should beconsidered reliable. The error barsoverlap with the symbols. SSC, side-scattered light.
large particles only. As every large particle is counted (Table 5.1), the concentra-tion as determined by the flow cytometer equals the prepared concentration, anda linear relationship between count rate and prepared concentration is obtained,as demonstrated with the use of large 610 nm silica beads only (Fig. 5.7C).
Swarm detection, on the other hand, is caused by the detection of small parti-cles only. As multiple small particles have to be simultaneously present in the laserbeam to generate a single event signal, the flow cytometer-determined concentra-tion underestimates the real concentration, and the relationship between count rateand prepared concentration is non-linear. Although the diameters of the smallestdetectable single polystyrene and silica beads are 203 nm and 204 nm, respectively,we demonstrated that we could detect high concentrations of 89 nm silica beads(Fig. 5.7A) and vesicles filtered through a 220 nm filter (Fig. 5.3C,D), owing toswarm detection. For both samples, the flow cytometer-determined concentrationis more than 1,000-fold lower than the real concentration (Fig. 5.7C,D), and therelationship between count rate and concentration is non-linear. As the detectionlimit of the flow cytometer is 1.7 ·10−6 mW and the mean SSC powers of an 89 nmsilica bead and a urinary vesicle are 2.2 ·10−8 mW and 1.1 ·10−8 mW, respectively,at least 80 silica beads or 160 vesicles have to be simultaneously present in thelaser beam to generate a signal. For both samples, this requirement was fulfilled,as the estimated volume of the laser beam is 54 pL and the concentrations of silicabeads and vesicles are 1010 mL−1 and 1.6 · 1010 mL−1, respectively, so that, onaverage, 540 silica beads or 860 vesicles were simultaneously present in the beam.Fig. 5.8 shows the dilution curves of 89 nm silica beads for high, medium andlow flow rates. Within the acquisition range (gray area), the established concen-tration underestimates the prepared concentration, and the relationship betweencount rate and prepared concentration is non-linear. As a lower flow rate yields asmaller cross-sectional area of the sample stream and thus a smaller effective beamvolume [264], a higher concentration of 89 nm silica beads is required to generate
82

5.4. Discussion and conclusion
5
an event signal. Consequently, the dilution curves in Fig. 5.8 are shifted to theright with decreasing flow rates.
For samples containing a mixture of large and small particles, such as vesi-cles in plasma and urine, counts are generated by both single particle and swarmdetection. If the concentration of small particles is lower than the threshold forgeneration of a signal, the count rate is dominated by large particles, and a lin-ear relationship between count rate and concentration is obtained (Fig. 5.7C).However, if the concentration of small particles equals or exceeds the threshold forgeneration of a signal, the contribution of small and large particles to the countrate depends on the relative size and concentration of particles (Fig. 5.7C). Forcell-free urine, we have shown that small vesicles contribute to the count rate byusing a 220 nm filter. Without filtration, a fairly linear relationship between thecount rate and the concentration is obtained, indicating that large vesicles, i.e.vesicles larger than 300−700 nm, are present. Vesicles larger than 295 nm werenot observed by TEM imaging (Fig. 5.2), probably because the amount of im-aged vesicles did not represent the full population, and because the diameter wasaffected by preanalytic factors, such as centrifugation, staining, fixation, and ad-hesion [331]. Note that the concentration as determined by the flow cytometeris 1,000-fold lower than the concentration estimated with tunable resistive pulsesensing, which was observed when flow cytometry was compared with other, noveldetection methods [333, 124]. The presence of multiple vesicles in the laser beamexplains why the concentration is underestimated 1,000-fold, but, more impor-tantly, swarm detection allows the detection of smaller vesicles than previouslythought possible.
5.4.1 Sensitivity increases with collection angle
Although it is often thought that FSC should be used to determine the size ofvesicles [178, 58, 252, 296, 177], Fig. 5.4AD shows that, for our flow cytometer,the SSC detector is more sensitive and has a higher capability to resolve the sizeof beads than the FSC detector, as confirmed by other groups using instrumentswith a similar optical layout [264, 296, 90]. In this section, we will explain thisphenomenon. Fig. 5.9 shows the optical detection geometry of a flow cytometer(A) and how this affects the detection of light scattered by a cell (B), a microvesicle(C), or an exosome (D). Each cell, microvesicle or exosome is illuminated by a laserbeam with a constant intensity, which we estimate to be 1.4 ·107 W m−2. The FSCdetector is a photodiode that detects light which is scattered under an angle ofapproximately 0.5−7◦, depending on the setup of the instrument. To preventthe laser directly illuminating the FSC detector, both the laser beam itself andthe light scattered under an angle smaller than 0.5◦ are blocked by the so-calledobscuration bar, as indicated by the interruption in the red line. The SSC detectoris a photomultiplier tube, which is not only more sensitive than the photodiode ofthe FSC detector, but also detects scattered light over a much broader angle, i.e.47−133◦. The dashed blue lines inside the gray circular diagrams show how muchlight is scattered in each direction. Fig. 5.9B shows that a cell with a diameter of
83

5
Chapter 5. Detection of extracellular vesicles by flow cytometry
B C
ellC
Microvesicle
D E
xosome
illumination
1.4∙107 W
m-2
10-12
10-8
10-4
100
Pow
er (mW
)
SS
CFS
C
Total
10-12
10-8
10-4
100
SS
C
Total
FSC
Pow
er (mW
)10
-1210
-810
-410
0
Pow
er (mW
)
SS
CFS
C
Total
A O
ptical configuration flow cytom
eter
0°
SS
C
FSC
90°
1 µm1 µm
1 µm
Figu
re5
.9:
Op
tical
detectio
ngeo
metry
of
the
FA
CS
Ca
libur
an
dth
ea
ngu
lar
inten
sityd
istributio
no
fligh
tsca
tteredby
asin
glecell,
am
icrovesicle,
or
an
exoso
me.
(A)
Apa
rticle(bla
ckd
ot)
isillu
min
ated
bya
laser
beam
(blue
solid
arro
w).
Fo
rwa
rd-sca
tteredligh
t(F
SC
)a
nd
side-sca
ttereredligh
t(S
SC
)a
reco
llectedbetw
een0
.5◦
an
d7◦
(redlin
es)a
nd
between
47◦
an
d1
33◦
(greenlin
e),respectively.
Th
egra
ycircu
lar
dia
gram
ssh
ow
the
an
gula
rin
tensity
distribu
tion
(blue
da
shed
line)
of
perpend
icula
rlypo
larized
light
scattered
bya
cell(yello
wcircle)
with
dia
meter
5µ
m(B
),a
micro
vesicle(w
hite
circle)w
ithd
iam
eter5
00
nm
,a
nd
an
exoso
me
(black
do
t)w
ithd
iam
eter5
0n
m(C
).T
he
scatterin
ga
ngle
becom
esw
ider
for
decrea
sing
cello
rvesicle
dia
meters.
Th
eba
rp
lots
at
the
botto
msh
ow
the
pow
er(loga
rithm
icsca
le)sca
tteredin
all
directio
ns
(blue),
the
pow
ersca
tteredin
the
FS
Cd
irection
(red),
an
dth
epo
wer
scattered
inth
eS
SC
directio
n(green
).T
he
calcu
latio
npa
ram
etersa
relisted
inT
able
5.2
.
84

5.4. Discussion and conclusion
5
5µm scatters light predominantly in the forward direction, which is in the directionof the FSC detector. Hence, FSC is associated with cell size. Fig. 5.9C shows thata microvesicle with a diameter of 500 nm scatters light differently than a cell, i.e.mainly under an angle of 0−10◦. In comparison with the cell, the fraction of lightscattered in the direction of the FSC detector has decreased, whereas the fractionof light scattered in the direction of the SSC detector has increased. Fig. 5.9Dshows that an exosome with a diameter of 50 nm scatters light nearly isotropically.As a result, more light is scattered in the direction of the SSC detector than in thedirection of the FSC detector. As organelles are of a similar size as microvesiclesand exosomes, an increased SSC is commonly associated with the complex anatomyof cells. In fact, the SSC detector is optimized to detect scattering from multipleparticles smaller than the wavelength. Thus, to increase the sensitivity for vesicledetection, it is beneficial to select the detector with the largest collection angle.For most regular flow cytometers, this implies using the SSC detector.
5.4.2 Implications and limitations
Our model explains several recent observations regarding vesicle detection withflow cytometry. In an effort to standardize vesicle detection, the Scientific Stan-dardization Committee of the International Society on Thrombosis and Haemosta-sis (ISTH) proposed a protocol that used 500 nm and 900 nm polystyrene beadsfrom Megamix to define a vesicle size gate [178]. They observed that flow cytometer-determined concentrations of vesicles appeared to be consistent among instrumentsmeasuring FSC with a relatively wide solid angle (1−19◦; Beckman Coulter), butappeared to be inconsistent among instruments measuring FSC with a low solidangle (0.7−10◦; Becton Dickinson). The low collection angle makes the detectionlimit strongly dependent on the width of the obscuration bar, which is specificfor each individual instrument. As vesicle detection typically takes place near thedetection limit, the results differed among the Becton Dickinson instruments.
Chandler et al. applied the Megamix gating strategy to detect platelet micro-particles (PMPs) on the Apogee A40, which has an FSC collection angle of 1−70◦,and showed that mainly platelets, which have an average diameter of2,000−5,000 nm [322], were counted [58]. Unlike Chandler et al., Mullier et al.and Robert et al. [210, 252] could perfectly distinguish PMPs from platelets byusing the same gating strategy on their flow cytometers, which all had an FSCcollection angle below 19◦. To explain this discrepancy and to show that ourcalibration procedure is generally applicable, we have determined the calibrationfactors for the FSC detectors of the Apogee A40 and the Beckman Coulter FC500by using their data [58, 252]. Fig. 5.10A,B shows the diameters of single vesiclesas selected by the Megamix gating strategy for the Apogee A40 and FC500, re-spectively. The range of diameters of single vesicles gated on theApogee A40 is200 nm larger than the range gated on the FC500. Owing to the wider collectionangle of the Apogee A40 than of the FC500, the Apogee A40 is more sensitive tothe difference in refractive index between polystyrene beads and vesicles than theFC500. Nevertheless, single PMPs are not expected to appear in the gated range
85

5
Chapter 5. Detection of extracellular vesicles by flow cytometry
0 1000 2000 300010-5
10-4
10-3
10-2
10-1
100
Polystyrene Mie calculation
Vesicle Mie calculation
Polystyrene data Synthetic vesicle data
Pow
er (m
W)
Diameter (nm)0 1000 2000 3000
10-5
10-4
10-3
10-2
10-1
100
Polystyrene Mie calculation
Vesicle Mie calculation
Polystyrene data
Pow
er (m
W)
Diameter (nm)
Apogee A40 FC500
BA
Figure 5.10: Selected vesicle diameter range obtained by applying the Megamix gatingstrategy on the Apogee A40 vs. the FC500. (A) Measured (symbols) and calculated (lines)forward-scattered light (FSC) power (logarithmic scale) vs. diameter for polystyrene beads(black) and vesicles (circle), for the Apogee A40. The measured data points are adoptedfrom Chandler et al. [58]. The obtained calibration factor is 2.67 · 106. The Megamix gat-ing strategy would select single vesicles with a diameter between 1,000 nm and 2,700 nm.(B) Measured and calculated FSC power vs. diameter for polystyrene beads and vesiclesfor the FC500. The measured data points are adopted from Robert et al. [252]. Theobtained calibration factor is 5.18 · 104. The Megamix gating strategy would select singlevesicles with a diameter between 800 nm and 2,400 nm. The calculation parameters arelisted in Table 5.2.
86

5.4. Discussion and conclusion
5
for either the Apogee A40 or the FC500, as the measured PMP diameter is farbelow 500 nm [333, 124, 90]. Rather, it is the presence of multiple PMPs in thelaser beam that makes them detectable by flow cytometry. From reference mea-surements with novel methods, we know that the concentration of PMPs exceeds1010 mL−1 [90], which ensures that multiple vesicles are illuminated simultaneouslyand is sufficient to generate a single event signal.
For functional research on vesicles, the presence of multiple vesicles in thebeam may have major consequences. For example, different fluorescence signalscorresponding to a ‘single event signal’ may originate from multiple vesicles, eachcontaining a different antibody, which may explain the colocalization of granulo-cyte (CD66e) and platelet (CD61) markers on tissue factor-exposing vesicles [84].On the other hand, as all vesicles contribute to the signal, our findings explainwhy flow cytometry results often correlate with disease.
Our work may lead to a better understanding of vesicle detection by flow cy-tometry, increased sensitivity by optimizing the instrument-specific settings, andimprovements in the standardization of measurements between laboratories, whichinvolves at least four steps. First, the scattering power of beads should be mea-sured for the detector with the largest collection angle and highest sensitivity.Second, the scattering power of beads should be calculated specifically for theused detector by Mie theory. Third, the calibration factor should be determinedto quantify the detection signal. Fourth, a gate should be selected on the basisof the quantified optical power. For improved standardization, the relationshipbetween the detected scattering power from multiple vesicles, the volume of thelaser beam and the flow rate requires further investigation. For improved vesicledetection, we suggest modification of the hardware of the flow cytometer [276], andstudy of the refractive index of vesicles and the medium. In addition, as manystudies also use fluorescence to identify vesicles, we suggest performing a detailedanalysis on fluorescent beads, although many non-trivial practical and theoreticalproblems will have to be solved before a comparable study based on fluorescencecan be performed [233]. In spite of its limitations, flow cytometry will still haveto be the present method of choice, because we do not yet have validated methodsfor quantitative enumeration and establishment of the cellular source of vesicles.
In conclusion, we have established a model that relates the detected scatteringpower to the diameter of single vesicles. The gating strategy proposed by the ISTHScientific Standardization Committee collaborative workshop selects single vesiclesand cells with diameters between 800 nm and 2,400 nm when applied on the FSCdetector of regular flow cytometers. However, vesicle detection by regular flowcytometry relies on two different mechanisms: (1) detection of single, relativelylarge, vesicles that scatter more light than the detection limit, and (2) swarmdetection - that is, multiple relatively small vesicles are simultaneously illuminatedby the laser beam and counted as a single event signal. Swarm detection allowsthe detection of smaller vesicles than previously thought possible. It explainsthe finding that flow cytometry underestimates the concentration of vesicles, andit clarifies several observations published by the ISTH Scientific StandardizationCommittee collaborative workshop on vesicle detection.
87