
CHAPTER 5 RESEARCH METHODOLOGY 5.0 Summarystudentsrepo.um.edu.my/4606/9/Chapter_5.pdf · 5.0...
24
148 CHAPTER 5 RESEARCH METHODOLOGY 5.0 Summary This chapter describes the research methodology used to collect and analyze the data required to address the research questions and to test the hypothesized relationships developed in this study. The chapter begins with a discussion of the research design, followed by the population from which data will be collected and the approach used in sample selection. The chapter then continues with descriptions of the questionnaire design, data measurement and scaling. Next, the discussion centres on data collection methods, focusing on the mail survey. Finally, the choice methods of data analysis are discussed. 5.1 Research Design This research applies a quantitative survey methodology using self- administered survey questionnaires to collect data from a sample of SMEs involved in internationalization in Malaysia. According to Amaratunga et al. (2002) quantitative methods assist researchers to establish statistical evidence on the strengths of relationships between both exogenous and endogenous constructs. They also argued that the statistical results provide directions of relationships when combined with theory and literature. Furthermore, Cavana (2001) suggested that the
Transcript of CHAPTER 5 RESEARCH METHODOLOGY 5.0 Summarystudentsrepo.um.edu.my/4606/9/Chapter_5.pdf · 5.0...

148
CHAPTER 5
RESEARCH METHODOLOGY
5.0 Summary
This chapter describes the research methodology used to collect and analyze
the data required to address the research questions and to test the hypothesized
relationships developed in this study. The chapter begins with a discussion of the
research design, followed by the population from which data will be collected and
the approach used in sample selection. The chapter then continues with descriptions
of the questionnaire design, data measurement and scaling. Next, the discussion
centres on data collection methods, focusing on the mail survey. Finally, the choice
methods of data analysis are discussed.
5.1 Research Design
This research applies a quantitative survey methodology using self-
administered survey questionnaires to collect data from a sample of SMEs involved
in internationalization in Malaysia. According to Amaratunga et al. (2002)
quantitative methods assist researchers to establish statistical evidence on the
strengths of relationships between both exogenous and endogenous constructs. They
also argued that the statistical results provide directions of relationships when
combined with theory and literature. Furthermore, Cavana (2001) suggested that the

149
quantitative methods can be utilized to verify the hypotheses and provide strong
reliability and validity.
The key informants in this survey were the owners or the highest ranking
officers of the Malaysian SMEs, who were believed to be the most knowledgeable
about their firms’ characteristics, management style, international operations and
firms’ performance (Carpano et al., 1994; Roth, 1992; Roth and O’Donnell, 1996).
Data collected from this survey were analyzed using structural equation
modeling to examine associative relationships among the three main constructs: (1)
Determinants of internationalization such as entrepreneurial orientation, global
mindset, network relationships and government support; (2) internationalization; and
(3) firm performance.
5.2 Sample Selection Method
According to Hair et al. (2007) representative samples are normally obtained
by the pursuing a set of well-defined procedures, including: defining the target
population; selecting a sampling method; and determining a sample size. Thus, this
study used three main procedures for selecting the representative sample as
recommended by Hair et al. (2007).

150
5.2.1 Target Population
The study’s target populations are the SMEs in Malaysia that are involved in
internationalization. This research explores the three main industries, manufacturing,
service and agriculture by focusing on young and established firms, traditional, low-
technology and high-technology industries consistent with recommendation in the
literature for a greater diversity in the industry scope (Zahra et al., 1999) in the
emerging economies. The aim is to assess whether theoretical perspectives
developed in mature market contexts are valid in emerging economies and to obtain
clear international entrepreneurship patterns and outcomes.
This study employs the definition of SMEs provided by the National SME
Development Council (NSDC). Specifically, SMEs in Malaysia are defined as
follows:
a. Manufacturing sector: Sales turnover of less than RM25 million or full-time
employee of less than 150;
b. Services and other sectors: Sales turnover of less than RM5 million or full-
time employee of less than 50 (NSDC, 2010).
Details of the definitions according to the three categories namely, Micro, Small
and Medium, are presented in Table 3.1 in chapter 3.

151
Following the above definition of SMEs, this study used three main
comprehensive source of directories namely, the Federation of Malaysian
Manufacturers (FMM), SME Corporation Malaysia (SME Corp. Malaysia), and the
Malaysia External Trade Development Corporation (MATRADE) to identify
potential respondents of the SMEs in Malaysia that are involved in
internationalization.
SMEs that are involved in internationalization are defined as for profit companies
that engage in exporting, importing, licensing or outsourcing activities, franchising,
joint ventures and wholly owned subsidiaries. The percentage of a company’s total
sales from international operations, the percentage of a company’s profit from
international operations, the total number of a company’s international markets, and
the duration of the company’s involvement in international operations in 2010 were
used as a criterion to screen for firms that qualified for this study.
5.2.2 Sampling Method
The sampling frame for this study was created based on the three main
directories mentioned above that represent SMEs in Malaysia. The sampling frame’s
specific information comprises the companies’ names, factory and office addresses,
telephone and fax numbers, types of business, and contact names.

152
Probability sampling is used as the sampling method. In the probability
sampling method, stratified random sampling process is used to select the sample.
The selection of the sample was based on the criteria explained previously.
Stratified random sampling involves a process of stratification or
segmentation of SMEs in Malaysia, followed by the random selection of subjects
from each stratum. In this study, the population of 3,000 SMEs was segregated based
on the combination of criteria explained above. A total of 1,200 SMEs were selected
from the total of 3,000 SMEs. The selected 1,200 SMEs were used as the sample in
this study.
The unit of analysis for this study is the individual SMEs. The respondents
(the owners or the highest ranking officer) were identified on the basis of their job
title and position within the company (Vida et al., 2000). These people are assumed
to be knowledgeable and familiar with their company operations related to the issues
under investigation.
5.2.3 Sample Size
Determination of the sample size is influenced by several factors that must be
simultaneously taken into consideration. Among the factors are cost and time
constraints, variability of elements in the target population, required estimation

153
precision and whether the findings are to be generalized and , if so, to what degree of
confidence (Hair et al., 2007). In addition, there is always a trade-off between the
cost and time and large sample size. A larger sample size usually involves more
expenditure on the collecting and analyzing of data (Henry, 1990). Therefore, this
research must balance the trade-off of getting a satisfactory sample size within
budget and time constraints.
Roscoe (1975) suggested that sample sizes larger than 30 and less than 500
are appropriate for most research. If samples are to be segregated into subsamples;
(male/female, juniors/seniors, etc.) a minimum sample size of 30 for each category is
necessary and in multivariate research (including multiple regression analyses), the
sample size should be several times (preferably 10 times or more) as large as the
number of variables in the study. This suggestion was supported by Stutely (2003)
who suggested a minimum number of 30 for statistical analyses. Kent (2001) further
suggested that for any kind of quantitative analysis, a minimum of 100 cases was
needed. This would assist the researcher in getting a sensible statistical analysis and
more significant results. Thus, this study employs a sample size of 1,200 SMEs in
Malaysia which is considered sufficient for successful quantitative analysis.

154
5.3 Questionnaire Design
This section discusses the process of developing the questionnaire for the
study. It describes the development of the questionnaire beginning with its forward
and back translation, validation of the questionnaire and its pilot testing before the
questionnaire is finalized.
5.3.1 Questionnaire Development
Self-administered questionnaire was used to collect data from the SMEs in
Malaysia. The self-administered questionnaire was developed based on the Proposed
Research Model (figure 4.1) in Chapter four and on results of semi-structured
interviews conducted with five SMEs in Malaysia in June 2011.
The questionnaire was developed and presented into four sections containing
questions for related constructs. These sections were marked using headings to make
it easy for respondents to follow and answer the questions. Section one comprised
questions about the respondents’ company characteristics, in terms of entrepreneurial
orientation (25 items), global mindset (12 items), network relationships (11 items),
and government support (12 items). Section two required the respondents to assess
the extent of their firms’ involvement in internationalization (4 items). Section three
comprised questions about firm performance in terms of financial and non-financial
performance (14 items) while section four required the respondents to provide

155
general company information in terms of primary business area, annual total sales,
number of full-time employees, international business ventures, entry strategy,
duration of company experience in current industry, location of head office, form of
ownership and business status (9 items).
The Likert scale was selected over other scaling methods in this study. The
scale is considered the preferred scaling method for obtaining attitudinal information
(Fishbein and Ajzen, 1975), with respondents specifying their degree of agreement
or disagreement with each statement in the questionnaire. The Likert scale is most
suitable for this research context because it is a “subject-centered” scale specially
designed to scale respondents, instead of objects (McIver and Carmines, 1981). The
advantages of using Likert scales include ease of constructing the questionnaire, ease
of understanding the questions and also ease of administration (Malhotra, 2007).
Furthermore, Likert scales produce the most information by reducing the amount of
leniency (Meric, 1994).
A number of researches concerning the optimal number of scale-points, the
effects of the number of scale points, and the scales’ reliability and validity were
conducted in the past (Cicchetti et al., 1985; Lissitz and Green, 1975; Ramsay,
1973). While some researchers argued that a six-or seven-point Likert scale performs
best (Green and Rao, 1970; Ramsay, 1973), others suggested that a three-point Likert
scale was sufficient (Jacoby and Matell, 1971; Lunney, 1970).

156
For the purpose of this research the six-point Likert scale will be used to
measure each construct of the study. Scale response categories ranged from 1
(strongly disagree) to 6 (strongly agree). The use of the six-point Likert scale
provides a shorter scale to assist respondents to complete the questionnaire.
According to Hair et al. (2007), the need for a higher level of precision must be
balanced with the demands put on the respondents. Respondents must be practically
well educated to process the information associated with larger numbers of
categories. They observed that respondents that were exposed to scaling questions
less often could respond more simply to scales with fewer categories. As survey
research among SMEs in Malaysia is still new, especially in international
entrepreneurship, fewer Likert scale categories will most likely help respondents
understand the information required and this in turn will increase the response rate.
In addition, Harrison and McLaughlin (1993) argued that Likert-type scales
have a tendency to bias participants’ responses toward the centre point because
participants absolutely assume that the centre point is the normal or average. This
practice is particularly true in the Malaysian context as Malaysians are likely to favor
a middle path. Therefore, the six-point Likert scale was used in the questionnaire in
order to make respondents give specific opinions.
To establish the legitimacy of the research activity and gain the trust of the
respondents, the logo of University of Malaya was presented on the questionnaire’s

157
cover page. It also expressed commitment to send a summary of the results to
respondents by requesting their contact information at the end of the questionnaire.
5.3.2 Forward and Back Translation
English and Bahasa Malaysia versions of the questionnaire were developed
for this study. The questionnaire was originally developed in English and later
translated into Bahasa Malaysia using the backward translation method with
assistance from linguists from MARA University of Technology, Malaysia to reduce
bias and error. Differences and ambiguities were identified and corrected by the
translator. Only small minor corrections were required since the two versions were
relatively similar. Based on a vigilant translation and an independent back
translation, the Bahasa Malaysia version was considered equivalent to the original
English version.
5.3.3 Validation of the Questionnaire
Face validity of the questionnaire was conducted by two professors from the
International Islamic University of Malaysia, who are specialists in the area of
internationalization. Their comments on the content and wordings, modifying of the
scale items to suit the specific industry context and to assess the questions were vital.
Valuable feedback was given by the two professors and changes were made to the
questionnaire before it was finalized and used in the survey.

158
5.3.4 Pilot Test
The data collection process of the research usually begins with a pilot test.
According to Cooper and Schindler (2003) a pilot test is conducted to identify
weaknesses in questionnaire design and instrumentation and to provide proxy data
for the selection of a probability sample. Subjects of the pilot test were drawn from
the target population and the test was conducted in the same way as planned for the
final questionnaire. The respondents for the pilot study do not have to be statistically
selected.
Hence, the study conducted a pilot test using a sample of 30 SMEs in
Malaysia involved in internationalization. The sample was randomly selected from
the directories of the Federation of Malaysian Manufacturers (FMM), SME
Corporation Malaysia (SME Corp. Malaysia), and the Malaysia External Trade
Development Corporation (MATRADE). The main reason for conducting the pilot
test was to identify problems with the measurement items, questionnaire instructions
and the time required by the respondents to complete the questionnaire.
The questionnaires were sent through post to 30 SMEs in Malaysia. Eight
questionnaires were returned back with a response rate of 27 percent. The
Cronbach’s Alpha values for all the constructs ranged from 0.721 to 0.960, above the
commonly acceptable value of 0.70 suggested by Nunnally (1978). Descriptive
analyses showed that all measures had acceptable ranges and variances with no

159
evidence of item non-response and no evidence of misinterpretation of reverse or
negative worded items. In addition, the respondents were also contacted personally
by phone to obtain feedback as to whether the instructions and measurement items
were unclear, confusing, or redundant. Respondents were also asked to give their
opinions on the length of the questionnaires and the time required in completing the
questionnaire.
Subsequently, minor changes were made to the questionnaire. The final
questionnaire was approved by the thesis supervisor, Dr. Aida Idris and was believed
to be a simple, well presented data collection instrument that would generate data of
acceptable quality. A copy of the final questionnaire in English and Bahasa Malaysia
versions was attached in the appendix of this thesis.
5.3.5 Final Questionnaire
The final questionnaire contained eight pages, with confidentiality assurances
placed on the front page and at the end of the questionnaire. The overall results of the
study were offered to the respondents as an incentive for their participation in the
research.
The final questionnaire contained 87 items measuring seven constructs and
other questions related to the firm. Items used to measure the constructs were
160
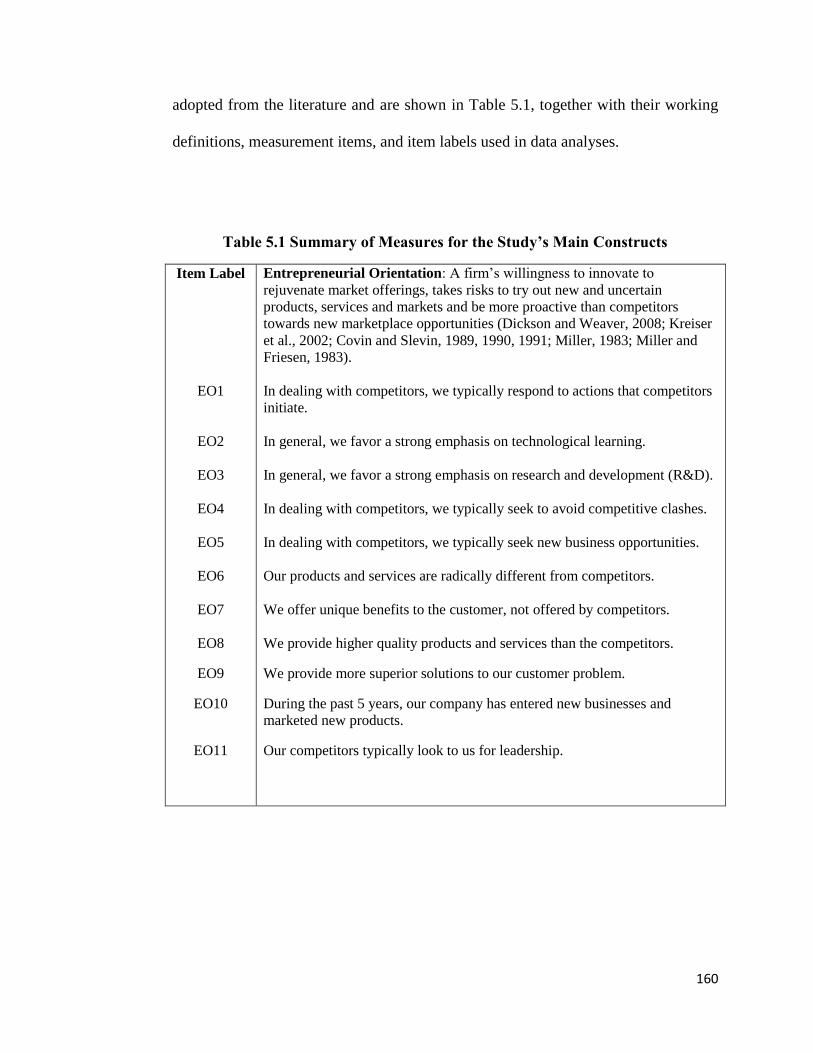
adopted from the literature and are shown in Table 5.1, together with their working
definitions, measurement items, and item labels used in data analyses.
Table 5.1 Summary of Measures for the Study’s Main Constructs
Item Label
EO1
EO2
EO3
EO4
EO5
EO6
EO7
EO8
EO9
EO10
EO11
Entrepreneurial Orientation: A firm’s willingness to innovate to
rejuvenate market offerings, takes risks to try out new and uncertain
products, services and markets and be more proactive than competitors
towards new marketplace opportunities (Dickson and Weaver, 2008; Kreiser
et al., 2002; Covin and Slevin, 1989, 1990, 1991; Miller, 1983; Miller and
Friesen, 1983).
In dealing with competitors, we typically respond to actions that competitors
initiate.
In general, we favor a strong emphasis on technological learning.
In general, we favor a strong emphasis on research and development (R&D).
In dealing with competitors, we typically seek to avoid competitive clashes.
In dealing with competitors, we typically seek new business opportunities.
Our products and services are radically different from competitors.
We offer unique benefits to the customer, not offered by competitors.
We provide higher quality products and services than the competitors.
We provide more superior solutions to our customer problem.
During the past 5 years, our company has entered new businesses and
marketed new products.
Our competitors typically look to us for leadership.

161
Table 5.1 Summary of Measures for the Study’s Main Constructs, continued
EO12
EO13
EO14
EO15
EO16
EO17
EO18
EO19
EO20
EO21
EO22
EO23
EO24
EO25
Compared to competitors, we are very often the first business to introduce
new products or services.
Compared to competitors, we are very often the first business to introduce
new operating technologies.
Compared to competitors, we are very often the first business to introduce
new administrative techniques.
We believe that combinations of strategies are necessary to achieve our
objectives.
We initiate actions to which other organizations respond.
We respond quickly to environmental changes.
We perceive new business opportunities more quickly than our competitors.
In general, we have a strong preference for low-risk projects with normal and
certain rates of return. (Reverse coded)
When faced with uncertain situations, we adopt a bold, independent posture
to exploit new opportunities.
We believe that because of the dynamic business environment, it is best to
explore the environment gradually through slow, incremental behavior.
(Reverse coded)
We have a strong proclivity or tendency for high-risk projects.
We are willing to make investments in projects that have uncertain outcomes.
We are willing to take higher risk in the exploration of new business
opportunities in the foreign markets.
We are willing to enter new foreign markets with high probability of failure
in an unknown competitive environment.

162
Table 5.1 Summary of Measures for the Study’s Main Constructs, continued
Item Label
GM1
GM2
GM3
GM4
GM5
GM6
GM7
GM8
GM9
GM10
GM11
GM12
Global Mindset: A firm’s or manager’s openness to and awareness of
cultural and market diversity and its predisposition towards a particular way
of approaching an international experience (Guy and Beaman, 2003; Gupta
and Govindarajan, 2002).
We almost never change our product or services features for our international
customers.
In our international business dealings, we believe that the “Malaysian Way”
is the best way.
Most of the time, we try to accommodate the special requests of our
international customers.
It is easy to adapt to unique behaviors and practices of foreigners, especially
when they are our customers.
We can adapt to special needs of customers in different countries.
Often the ways of our foreign customers are as good as or better than the
Malaysian ways.
Almost all products at our company must be adapted to meet special needs of
each foreign market.
We should not think of ourselves as just a Malaysian company but think of
ourselves as part of a “global community”.
Cultural values are actually quite similar around the world.
International business should be done according to universal standards and
practices, not according to standards and practices of one or two countries.
People around the world are much more similar than they are different.
We should make products or services that can serve a global market.

163
Table 5.1 Summary of Measures for the Study’s Main Constructs, continued
Item label
NR1
NR2
NR3
NR4
NR5
NR6
NR7
NR8
NR9
NR10
NR11
Network Relationships: A firm’s management team and employees’
relations with formal, informal and intermediary networks that enable a firm
to internationalize its business activities (Birley, 1985; Coviello and Martin,
1999; Coviello and Munro, 1995, 1997; Oviatt and McDougall, 2005; Zain
and Ng, 2006).
Our relationships with customers, distributors and suppliers, enable us to
access the resources controlled by other firms in the foreign markets.
Network relationships with customers, distributors and suppliers can open
new opportunities for our company in foreign markets.
Our relationships with customers, distributors, suppliers and competitors
assist us in entering foreign markets.
Our relationships with friends and family members assist us in entering
foreign markets.
Our relationships with brokers assist us in entering foreign markets.
We managed to cope positively with rapid technological changes from our
network relationships with customers, distributors and suppliers.
Network relationships with customers, distributors and suppliers provided a
way to maximize our adaptability to our foreign environment.
Networks facilitate and accelerate our company’s internationalization
process.
Network relationships with friends and family help us in managing
uncertainty risks in the foreign markets.
Network relationships with brokers help our company in the planning and
management of marketing in the foreign market.
We managed to integrate our communication structure in the foreign market
from our network relationships with brokers.

164
Table 5.1 Summary of Measures for the Study’s Main Constructs, continued
Item label
GS1
GS2
GS3
GS4
GS5
GS6
GS7
GS8
GS9
GS10
GS11
GS12
Government Support: Funding, policies and incentives, and contract and
projects in terms of financial and credit assistance, technical and training
assistance, extension and advisory services, marketing and market research,
and infrastructure supports that can assist individuals’ entrepreneurial efforts
(Smallbone and Welter, 2001; Spencer and Gomez, 2004; Doutriaux, 1998;
Harrison and Mason, 1988; Phillips, 1993; Reynolds, 1997; Abdullah, 1999).
Malaysian government policies assist our company in operating abroad.
We received financial and credit assistance from the government for our
international expansion.
Training and technical assistance from the government help our company
development in the foreign market.
We received marketing and market search assistance from the government
for our products and services promotions in international markets.
The government of Malaysia has provided infrastructure facilities for our
company’s growth and development.
Government support programmes on the extension and advisory services
improved our company’s product quality and design.
The Malaysian government supports our company by giving contracts or
projects in the foreign markets.
We received substantial subsidies from the government for our international
operations.
Our close relationship with the government supports our company’s growth
and development.
The government supports our company with an injection of soft loans to
assist us to trade out of our difficulties.
We received substantial tax subsidies from the government for our
international operations.
Our close relationships with the government enable us to control over
resources available in the international markets.

165
Table 5.1 Summary of Measures for the Study’s Main Constructs, continued
Item label
INT1
INT2
INT3
INT4
Internationalization: The process by which firms move from operating in
domestic markets to foreign markets by adapting the firms’ operations,
strategies, structures, and resources to the foreign environment in order to
achieve the firm’s objectives ( Calof and Beamish, 1995; Johanson and
Vahlne, 1990; Lehtinen and Penttinen, 1999; Ahokangas, 1998).
Please estimate the percentage of your company’s last year total sales from
international operations.
Please estimate the percentage of your company’s last year profit from
international operations.
Please indicate the total number of your company’s international markets.
Please estimate how long has your company been actively involved in
international operations?
Item label
NFP1
NFP2
NFP3
NFP4
NFP5
NFP6
NFP7
NFP8
Competitive Capability: A firm’s ability to deploy resources using
organizing processes and principles to achieve its strategic objectives (Kogut
and Zander, 1992).
Technological Learning: The process by which a technology-driven firm
creates, renews, and upgrades its latent and enacted capabilities based on its
explicit and tacit stock of resources (Carayannis and Alexander, 2002).
Our international experience has improved the overall quality of our products
or services.
Our international experience has reduced the cost of our products or services.
Our international experience has made this company a stronger needs
provider for all customers we serve.
Our international experience has given us an advantage over our domestic
competitors.
Our international experience has raised our overall standard of performance.
Our international experience has given us access to new production
technologies.
Our international experience has given us access to new product design
technologies.
Our international experience has increased our knowledge about many new
technologies

166
Table 5.1 Summary of Measures for the Study’s Main Constructs, continued
NFP9
NFP10
NFP11
Our international experience has changed our beliefs about the benefits of
possible new technologies.
Our international experience has increased our skills in using new
technologies.
Our international experience has made this company smarter in terms of its
operations.
Items in Table 5.1 above were treated as independent, mediating and dependent
variables in this study and described in the following sections.
5.3.6 Independent, Mediating and Dependent Variables
There are four main independent variables in this study which refer to the
determinants of internationalization comprising entrepreneurial orientation, global
mindset, network relationships, and government support. Entrepreneurial orientation
was operationalized on three dimensions, namely innovativeness, pro-activeness, and
risk-taking. Global mindset used three dimensions, being ethnocentric, polycentric,
and geocentric. Network relationships utilized three dimensions, being formal
relationships, informal relationships and intermediary relationships while the last
independent variable, government support, has three dimensions, being funding,
policies and incentives, and contracts and projects.

167
Internationalization was treated as a mediating variable with four
measurements, being the percentage of the company’s total foreign sales, the
percentage of the company’s foreign profit, total of the company’s international
markets, and the duration the company was involved in international operations.
The dependent variables of this study are firm performance, comprising
financial and non-financial performance. Financial performance was measured by
Return on Equity (ROE), Return on Assets (ROA) and sales growth. Non-financial
performance was operationalized on two dimensions, namely competitive capability
and technological learning.
5.4 Data Collection
The empirical data used to test the hypotheses in this study were drawn from
a mail survey. The data collection process was carried out by mailing a covering
letter explaining the purpose of the survey, a copy of the questionnaire and a postage
paid envelope to 1,200 SMEs in Malaysia via Pos Malaysia from August to
December, 2011. The letter was addressed to the owners or the highest ranking
officer of the Malaysian SMEs, who were believed to be the most knowledgeable
about their firms’ characteristics, management style, international operations, and
firms’ performance and the most qualified person to complete the questionnaire.

168
In order to increase the response rate, follow-up with the respondents were
planned at three stages:
i. Two weeks after the initial mailing - a follow-up e mail;
ii. Four weeks after the initial mailing - a new covering letter and
questionnaire; and
iii. Eight weeks after the initial mailing - a follow-up call, follow-up e
mail and a third covering letter and questionnaire.
This process was designed to increase participation from the respondents and to
maximize the response rate.
After almost four months, a total of 252 questionnaires were returned. Of the
1,200 questionnaires that were sent to the respondents, 21 questionnaires were
returned by the post office due to wrong addresses or the company had moved to
other places. Fifteen questionnaires were excluded from the samples due to several
reasons; four for return with no responses, three for incomplete responses and eight
for no international operations. The final 237 usable questionnaires were segregated
into three groups: (1) 122 questionnaires for the fast response group (received during
the first four weeks after mailing); (2) 87 questionnaires for the moderate response
group (received between four and eight weeks after mailing; and (3) 28
questionnaires for the late response group (received more than eight weeks after
mailing). The 237 complete questionnaires yielded a satisfactory effective response

169
rate of 20 percent and the sample was acceptable to conduct Structural Equation
Modeling for this study (Hair et al., 2006; Loehlin, 1992).
5.5 Method of Data Analysis
After initial data screening for missing data, outliers, and normality, two
statistical techniques were used to analyze the data. The Statistical Package for the
Social Science (SPSS) version 18 was used to analyze preliminary data and produce
descriptive analyses of the study such as means, standard deviations, and
frequencies. Structural Equation Modeling (SEM using AMOS 18) using
Confirmatory Factor Analysis (CFA) was utilized to estimate measurement models
for the study’s mains constructs. Items that were identified to be weak indicators
were removed from further analyses that focused on bivariate and multivariate
relationships indicated in Figure 4.1.
There are several advantages in using Structural Equation Modeling. First,
Structural Equation Modeling gives a systematic basis for evaluating the “fit” of the
proposed model to data using a χ² statistic and incremental fit indices such as the non
-normed fit index (NNFI) and comparative fit index (CFI). Furthermore, the absolute
fit index of Root Mean Square Error of Approximation (RMSEA) is practical for fit
assessment (MacCallum and Austin, 2000; Marsh et al., 1996). Structural Equation
Modeling also allows restricted models in the systematic constraint on the
relationships among observed indicators and latent constructs. In addition, Structural

170
Equation Modeling provides unbiased estimates for hypothesized factor loadings
with standard errors. It also gives a systematic evaluation of discriminant validity
through estimating correlations among theoretical constructs, and statistical testing
of each inter-construct correlation that is different from unity. Finally, Structural
Equation Modeling provides direct testing of measurement equivalence across
several contexts by constraining the factor loadings across contexts.
In this study, Structural Equation Modeling was conducted using a two-step
approach as recommended by Anderson and Gerbing (1988). The first step includes
the assessment of the measurement model and the second step includes the
assessment of the structural model. In the measurement model stage, two processes
were involved including the assessment of the unidimensionality, and followed by
the assessment of reliability and validity of the study’s main constructs.
After getting satisfactory measurements, the primary method of analysis used
was Structural Equation Modeling (AMOS 18) because the Proposed Research
Model in Figure 4.1 contains latent constructs measured by multiple indicators. As a
result, the Model needs both interdependence (confirmatory factor analysis) and
dependence (structural analysis) methods. Structural Equation Modeling puts forth
two advantages compared with conventional regression and causal path analyses.
First, the procedure permits individual and simultaneous tests of complex

171
multidimensional relationships and second, estimates structural relationships among
constructs that are free of measurement errors.
Confirmatory Factor Analysis and Structural Equation Modeling are based on
five assumptions namely (1) large sample size, (2) multivariate normality and
absence of outliers, (3) linear relationships, (4) absence of multicollinearity and
singularity, and (5) symmetrically distributed (and centered around zero) residuals
(Tabachnick and Fidell, 2001). In many cases, a sample size of about 200 is adequate
for small and medium models (Boomsma, 1982). Thus, the sample size of 237 is
adequate to conduct Structural Equation Modeling and at the same time, is large
enough to form conclusions for this study.
Rather than looking at the relationships between variables, researchers are
sometimes interested in finding the differences between two groups (Field, 2009). A
t-test is used to determine whether there is a significant difference between two sets
of scores (Coakes and Ong, 2011). In addition, a one-way analysis of variance
(ANOVA) is used to compare means of more than two groups or levels of
independent variables. This present study used a t-test to compare entrepreneurial
orientation, global mindset, network relationships, government support,
internationalization and performance of SMEs. In addition, a one-way analysis of
variance (ANOVA) is used to compare the industry, size; location and ownership
status of the SMEs in this study.