
CHAPTER 5: FLOOD RISKS The Flood Threat · CHAPTER 5: FLOOD RISKS Miriam Middelmann, Ken Granger,...
21
71 CHAPTER 5: FLOOD RISKS Miriam Middelmann, Ken Granger, Bruce Harper, Peter Baddiley and Terry Malone The Flood Threat A simple definition of flooding is water where it is not wanted (Chapman, 1994). Flooding occurs when the amount of water reaching the drainage network exceeds the amount of water which can be contained by the drainage channels and overflows out onto the floodplain. Several factors influence whether or not a flood occurs: • the total amount of rainfall falling over the catchment; • the geographical spread and concentration of rainfall over the catchment, i.e. the spatial variation; • rainfall intensity and duration, i.e. the temporal variation; • antecedent catchment and weather conditions; • ground cover; and, • the capacity of the drainage system to contain the water. The causes of flooding are highly variable and a complex set of factors influence whether or not flooding occurs in a catchment. Localised and/or flash flooding typically occurs where there is intense rainfall over a small sub- catchment which responds to rainfall in six hours or less. In urban or rural areas where drainage is poor, the risk of localised flooding is high under such circumstances. Widespread flooding and/or non- flash flooding (lasting for more than 24 hours), occurs following rainfall of high intensity or long duration over the whole or a large proportion of the catchment. Runoff is typically low in areas where the percentage of vegetation cover is high, as vegetated areas allow high infiltration until the earth is saturated. Where the ground is pre-saturated, such as following a long wet period, medium rainfall events can cause flooding as runoff begins almost immediately. Flood levels in urban areas quickly rise where the percentage of impermeable surfaces on the floodplain, such as buildings, roads and car parks, is high. On sloping concrete and bitumen surfaces, for example, runoff is immediate. Average recurrence interval (ARI) or annual exceedence probabilities (AEP) are statistical benchmarks used for flood comparison. ARI is the average value of the number of years between exceedances of flood events of a given magnitude (gauge height or discharge volume). AEP is the probability of a flood event of a given magnitude being equalled or exceeded in any one year. It has been estimated by Smith (1998) that more than 80% of the buildings at risk from flooding in Australia are located in Queensland and NSW, with Queensland having the highest average annual actual damages from flooding. The key difference between NSW and Queensland is the implementation of State-wide floodplain management regulations in the former. These regulations typically aim to preclude residential development in areas subject to flooding up to the 1% AEP (100 year ARI) level. In Queensland such regulations are left to individual local government authorities to establish. In the case of Mackay City the designated flood event adopted for planning purposes is set at the so-called Q50 (2% AEP) level (Smith ibid), which was initially estimated to be approximately the level of the 1958 flood of record. In his 1998 review of urban flooding risk in Queensland, Smith (ibid) found that, in the event of a 1% AEP flood, Mackay has the second greatest number of buildings at risk of being flooded in Queensland towns, with only the Gold Coast City Council area having more buildings at risk.
Transcript of CHAPTER 5: FLOOD RISKS The Flood Threat · CHAPTER 5: FLOOD RISKS Miriam Middelmann, Ken Granger,...

71
CHAPTER 5: FLOOD RISKS Miriam Middelmann, Ken Granger, Bruce Harper, Peter Baddiley and Terry Malone The Flood Threat A simple definition of flooding is water where it is not wanted (Chapman, 1994). Flooding occurs when the amount of water reaching the drainage network exceeds the amount of water which can be contained by the drainage channels and overflows out onto the floodplain. Several factors influence whether or not a flood occurs:
• the total amount of rainfall falling over the catchment; • the geographical spread and concentration of rainfall over the catchment, i.e. the spatial
variation; • rainfall intensity and duration, i.e. the temporal variation; • antecedent catchment and weather conditions; • ground cover; and, • the capacity of the drainage system to contain the water.
The causes of flooding are highly variable and a complex set of factors influence whether or not flooding occurs in a catchment. Localised and/or flash flooding typically occurs where there is intense rainfall over a small sub-catchment which responds to rainfall in six hours or less. In urban or rural areas where drainage is poor, the risk of localised flooding is high under such circumstances. Widespread flooding and/or non-flash flooding (lasting for more than 24 hours), occurs following rainfall of high intensity or long duration over the whole or a large proportion of the catchment. Runoff is typically low in areas where the percentage of vegetation cover is high, as vegetated areas allow high infiltration until the earth is saturated. Where the ground is pre-saturated, such as following a long wet period, medium rainfall events can cause flooding as runoff begins almost immediately. Flood levels in urban areas quickly rise where the percentage of impermeable surfaces on the floodplain, such as buildings, roads and car parks, is high. On sloping concrete and bitumen surfaces, for example, runoff is immediate. Average recurrence interval (ARI) or annual exceedence probabilities (AEP) are statistical benchmarks used for flood comparison. ARI is the average value of the number of years between exceedances of flood events of a given magnitude (gauge height or discharge volume). AEP is the probability of a flood event of a given magnitude being equalled or exceeded in any one year. It has been estimated by Smith (1998) that more than 80% of the buildings at risk from flooding in Australia are located in Queensland and NSW, with Queensland having the highest average annual actual damages from flooding. The key difference between NSW and Queensland is the implementation of State-wide floodplain management regulations in the former. These regulations typically aim to preclude residential development in areas subject to flooding up to the 1% AEP (100 year ARI) level. In Queensland such regulations are left to individual local government authorities to establish. In the case of Mackay City the designated flood event adopted for planning purposes is set at the so-called Q50 (2% AEP) level (Smith ibid), which was initially estimated to be approximately the level of the 1958 flood of record. In his 1998 review of urban flooding risk in Queensland, Smith (ibid) found that, in the event of a 1% AEP flood, Mackay has the second greatest number of buildings at risk of being flooded in Queensland towns, with only the Gold Coast City Council area having more buildings at risk.

72
The Pioneer River poses the only significant riverine flood threat in the study area. The other significant flood threat to Mackay is urban flash flooding caused by high intensity rainfalls, similar to that which occurred in Townsville in 1998, where channel capacity was exceeded. Urban drainage surcharge could typically occur in the lead-up to flooding from the river. Mackay is built largely on the estuary of the Pioneer River, the channel of which bisects the city. The area to the south of the River (Old Mackay) includes the Central Business District and residential areas that came under the jurisdiction of the former Mackay City Council. Old Pioneer includes the urban area north of the River that came under the former Pioneer Shire Council. The small communities of Mirani on the Pioneer River, and Finch Hatton on Cattle Creek, are also subject to flooding, but are outside the Mackay study area. The Pioneer catchment, which covers 1489 km2, is shown in Figure 5.1. The Pioneer River flows from the coastal ranges in an easterly direction towards the sea and its catchment has been described in terms of the following four regions by Gourlay and Hacker (1986, p. 9):
• Cattle Creek (29%); • Upper Pioneer River (53%); • Lower Pioneer River (12%); and, • Pioneer River estuary (6%).
Cattle Creek is one of the two major tributaries of the Pioneer River. Beginning in the Clarke Range, Cattle Creek rapidly loses altitude until reaching the valley floor. Its main tributaries are Cattle Creek North and Finch Hatton Creek which drain the highest parts of the catchment. Runoff tends to be more frequent in the Cattle Creek area than in the rest of the Pioneer catchment, as the area typically records the highest rainfall. Runoff is rapid, because descent from the ranges is steep. The main channel of this tributary runs very straight in a west-to-east direction. The Upper Pioneer River drains the area north of the confluence of Cattle Creek with the lower Pioneer River. Unlike the comparative straightness of Cattle Creek, the Upper Pioneer River follows a very winding course in largely rugged terrain. Blacks Creek is the main tributary of the Upper Pioneer River, with a large number of smaller tributaries flowing into Blacks Creek. Blacks Creek flows to the east until it meets the northerly flowing tributary of Stockyard Creek. At this point, the tributaries join to become the northerly flowing Upper Pioneer River. The Lower Pioneer River is the region downstream of the confluence of Cattle Creek with the Upper Pioneer River, near Mirani, to as far as Dumbleton Rocks. The course of this section is very straight, being confined by the distinct geological feature of the Pioneer lineament. The estuary section lies downstream of Dumbleton Rocks. Mean annual rainfall over the catchment totals between 800 mm and 1200 mm. Typically, rainfall episodes are short and intense, especially during the summer ‘cyclone season’ between late November and April. It is during this period that the Pioneer River is particularly prone to flooding. Historically, flood-producing high rainfalls have occurred most commonly between January and March, and are associated with tropical cyclones and other tropical rain depressions. The movement of the monsoon shear line southwards during summer also influences rainfall amounts during the summer period (Gourlay and Hacker, 1986, p. 15).
73
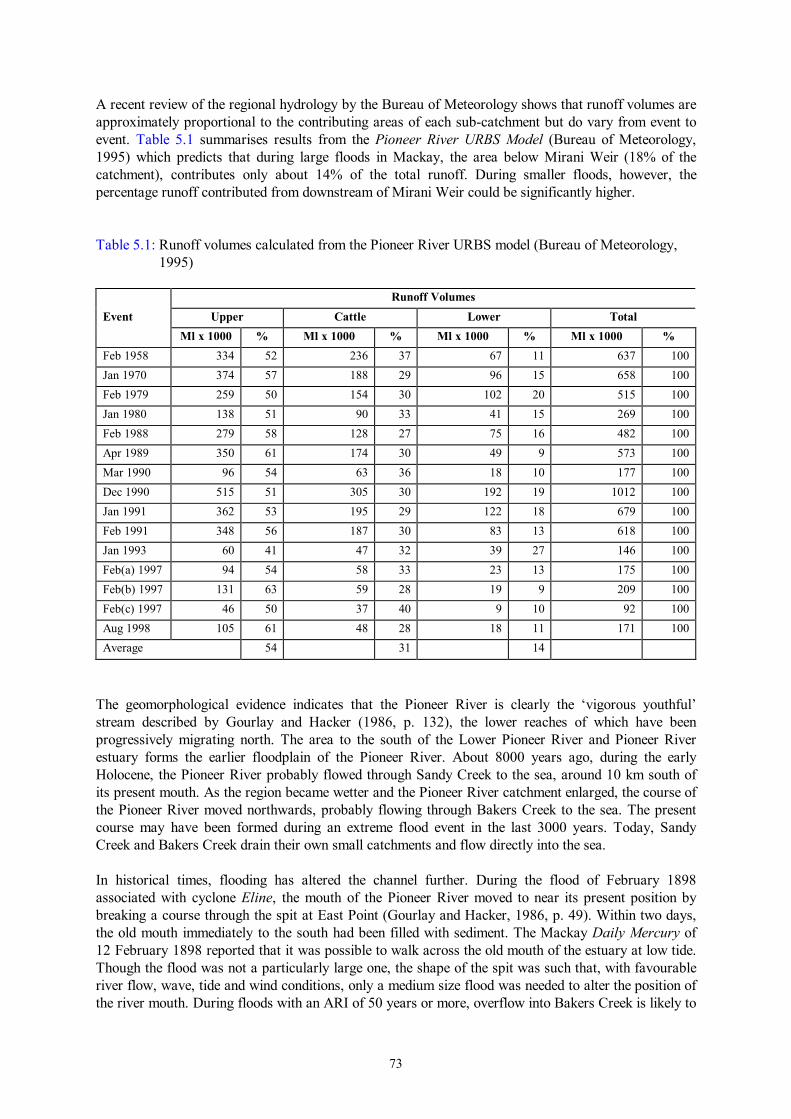
A recent review of the regional hydrology by the Bureau of Meteorology shows that runoff volumes are approximately proportional to the contributing areas of each sub-catchment but do vary from event to event. Table 5.1 summarises results from the Pioneer River URBS Model (Bureau of Meteorology, 1995) which predicts that during large floods in Mackay, the area below Mirani Weir (18% of the catchment), contributes only about 14% of the total runoff. During smaller floods, however, the percentage runoff contributed from downstream of Mirani Weir could be significantly higher. Table 5.1: Runoff volumes calculated from the Pioneer River URBS model (Bureau of Meteorology,
1995) Runoff Volumes Event Upper Cattle Lower Total Ml x 1000 % Ml x 1000 % Ml x 1000 % Ml x 1000 % Feb 1958 334 52 236 37 67 11 637 100Jan 1970 374 57 188 29 96 15 658 100Feb 1979 259 50 154 30 102 20 515 100Jan 1980 138 51 90 33 41 15 269 100Feb 1988 279 58 128 27 75 16 482 100Apr 1989 350 61 174 30 49 9 573 100Mar 1990 96 54 63 36 18 10 177 100Dec 1990 515 51 305 30 192 19 1012 100Jan 1991 362 53 195 29 122 18 679 100Feb 1991 348 56 187 30 83 13 618 100Jan 1993 60 41 47 32 39 27 146 100Feb(a) 1997 94 54 58 33 23 13 175 100Feb(b) 1997 131 63 59 28 19 9 209 100Feb(c) 1997 46 50 37 40 9 10 92 100Aug 1998 105 61 48 28 18 11 171 100Average 54 31 14
The geomorphological evidence indicates that the Pioneer River is clearly the ‘vigorous youthful’ stream described by Gourlay and Hacker (1986, p. 132), the lower reaches of which have been progressively migrating north. The area to the south of the Lower Pioneer River and Pioneer River estuary forms the earlier floodplain of the Pioneer River. About 8000 years ago, during the early Holocene, the Pioneer River probably flowed through Sandy Creek to the sea, around 10 km south of its present mouth. As the region became wetter and the Pioneer River catchment enlarged, the course of the Pioneer River moved northwards, probably flowing through Bakers Creek to the sea. The present course may have been formed during an extreme flood event in the last 3000 years. Today, Sandy Creek and Bakers Creek drain their own small catchments and flow directly into the sea. In historical times, flooding has altered the channel further. During the flood of February 1898 associated with cyclone Eline, the mouth of the Pioneer River moved to near its present position by breaking a course through the spit at East Point (Gourlay and Hacker, 1986, p. 49). Within two days, the old mouth immediately to the south had been filled with sediment. The Mackay Daily Mercury of 12 February 1898 reported that it was possible to walk across the old mouth of the estuary at low tide. Though the flood was not a particularly large one, the shape of the spit was such that, with favourable river flow, wave, tide and wind conditions, only a medium size flood was needed to alter the position of the river mouth. During floods with an ARI of 50 years or more, overflow into Bakers Creek is likely to
74
occur (DES, 2000). During major floods with an ARI of greater than 100 years, overflow into Sandy Creek is likely to occur at Mirani, into Baker’s Creek at Pleystowe (Ullman and Nolan, 1973), and to the north through North Mackay and Andergrove to Slade Bay. In the event of an extreme flood, therefore, it is possible that a new river mouth may be formed at Sandy Creek, Bakers Creek, or North Mackay, regardless of current flood mitigation works. The Pioneer River responds extremely quickly to flood rains, with lead times of between six and nine hours between heavy rainfall in the upper catchment to a rise in flood height at Mackay (Bureau of Meteorology, 1997). It is essential, therefore, that an adequate warning system be provided. The Bureau of Meteorology issues flood warnings for the Pioneer River in conjunction with the Pioneer River Improvement Trust using the Pioneer ALERT network. Installed in 1995, 1 mm increments in rainfall and 50 mm changes in river height are recorded and reported by radio to base station computers in Mackay and the Bureau’s Flood Warning Centre (FWC) in Brisbane. The FWC uses this information to predict river heights using hydrologic models. Predictions of flood heights at Mackay are issued three hourly. Flood warnings cease when no further rainfall is anticipated and flood levels fall to that of a minor flood level at the Mackay gauge. The Bureau of Meteorology’s brochure on Flood warning for the Pioneer River is included in Appendix I. Detailed interpretation of forecast flood levels, in terms of suburbs and streets expected to be inundated in the Mackay area, is provided by the Mackay City Council using advice from the Pioneer River Improvement Trust. The Mackay Flood Experience Floods are classified by the Bureau of Meteorology (1998) depending on the local gauge height (GH) and the resulting level of community impact as follows:
1. Minor flooding: This causes inconvenience such as closing of minor roads and the submergence of low level bridges.
2. Moderate flooding: This causes the inundation of low lying areas requiring the removal of stock and/or the evacuation of some houses. Main traffic bridges may be closed by floodwaters.
3. Major flooding: This causes inundation of large areas, isolating towns and cities. Major disruptions occur to road and rail links. Evacuation of many houses and business premises may be required. In rural areas widespread flooding of farmland is likely.
The Mackay gauge at Forgan Bridge (Plate 5.1), just upstream of the mouth of the Pioneer River, provides the most direct measurement of flood levels in the city reach of the estuary. At this gauge, a minor flood is deemed to commence at 6 m GH (3.06 m above the Australian Height Datum - AHD), a moderate flood at 6.9 m GH (3.96 m above AHD) and a major flood at 7.3 m GH (4.36 m above AHD). Floods at Mackay are tidally-affected to about 7.5 or 8.0 m at the Mackay gauge (Bureau of Meteorology, 1995). Mean high water spring tide reaches 5.3 m GH at the Mackay gauge, with the highest astronomical tide (HAT) reaching about 6.4 m GH. Therefore, floods below about 6.0 m on the Mackay gauge may not be distinguishable from tidal fluctuations at the gauge and downstream. The oldest flood gauge established on the Pioneer River was the Pleystowe Mill gauge, approximately 20 km upstream from the Pioneer River mouth. That gauge recorded flood levels from 1916 until 1978.

75
Though the Mackay gauge only came into operation in 1968, historical peak flood heights predating 1968 have been estimated for the Mackay gauge using data gathered from gauges upstream. Peak flood heights (either measured or estimated) for the Mackay gauge are shown in Figure 5.2. Twenty floods in the 115 year known record since 1884 are considered major floods (an average of one major flood every six years). A further ten floods are considered to be moderate flood events and ten floods are considered to be minor flood events, although there may be many more minor and moderate events which were not recorded. The two largest recorded riverine floods occurred in February 1958 and January 1918 and were very similar in height. The flood levels used here are those from the Bureau of Meteorology records which indicate that the 1958 flood was slightly higher at Forgan Bridge. The figures in Gourlay and Hacker (1986, p. 21) suggest that the 1918 flood was slightly higher. The estimated extent of flooding in February 1958 is shown in Figure 5.3 and is based on studies by McKay and Gourlay (1962) and Ullman and Nolan (1973). Neither source provides information with regard to flooding in 1958 in the vacant land of West Mackay or in the extended Sandfly Creek area, so the area flooded in the smaller 1946 flood was used to provide a minimum extent for the 1958 flood. The digital elevation model (DEM) was also used to estimate the extent of flooding south to the airport area and north to Slade Bay. The areas affected by flooding in 1958 are consequently, conservative estimates.
Figure 5.3: Extent of inundation during the February 1958 flood in Mackay

76
Peak flood height is estimated to have reached 9.14 m GH on the Mackay gauge at 8 am on the 18
February 1958. The flooding was associated with a rain depression. During the first 24 hours, 880 mm of rain was recorded at the Finch Hatton gauge on Cattle Creek, of which 530 mm fell in five hours (Gourlay and Hacker, 1986). Peak discharge is estimated at 11 000 cumecs using the rating curve from the Pioneer River URBS model (Bureau of Meteorology, 1995). Air, road and rail transport out of Mackay was blocked and shipping was disrupted (Daily Mercury, 18 February 1958). Damage to property was estimated at hundreds of thousands of pounds. Two people drowned and one was declared missing in the Cremorne area (Daily Mercury, 20 February 1958, Plate 5.2). The settlement of Foulden was declared a disaster area following the flood and its residents were forced to relocate permanently (Plate 5.3). The memories of one Foulden family are recorded in Appendix J and excerpts from The Daily Mercury of the major flood in 1958 are included in Appendix K. Memories of flooding in the Cremorne area are also included in Appendix J. Peak flood height for the flood in January 1918 was estimated as 8.86 m GH at Mackay on 23 January 1918 and peak discharge as 9500 cumecs. The flooding was associated with the unnamed Category 4 tropical cyclone that crossed the coast on 21 January 1918, bringing with it a storm tide that inundated the Mackay settlement to a level of approximately 5.34 m AHD (see Chapter 6, Appendix J and Appendix M for more details of this event). Heavy rains followed with 610 mm of rain falling in 24 hours. Severe river flooding reached its peak on 23 January. The total damage to property in Mackay was estimated at one million pounds and at least 30 lives were lost. Most of this loss, however, was caused by the storm tide and the severe winds associated with the cyclone. There was not much left to damage when the flood eventually hit. Other ‘major’ recorded floods include the floods of 1884, 1898, 1910, 1946, 1947, 1951, 1954, 1956, 1970, 1978, 1980, 1988, 1989, 1990 and 1991 (Plate 5.4). Another major flood occurred in April 1958, less than two months after the record flood. In 1979, two major floods occurred, six days apart, followed by a minor flood peak another two days later (Plate 5.5 and Plate 5.6). The flood of January 1970 with rainfall from Cyclone Ada is the third highest recorded flood. Peak flood height reached 8.76 m GH (approximately 8600 cumecs) at the Mackay gauge at 7 am on 19
January. Construction of a levee in 1965/66 prevented inundation in Nebo Road and Shakespeare Street, however, parts of River Street and Carlyle Street were inundated (Gourlay and Hacker, 1986, p. 69). South Mackay was also affected, with about two feet of water in Ready Street (John Dean, verbal communication, 2000). During the 1958, 1918 and 1970 floods, the area inundated extended into the North Mackay, Mackay Harbour, Slade Point and Andergrove areas (Ullman and Nolan, 1973). The fourth highest recorded flood occurred on 31 January 1884. Peak flood height is estimated as 8.3 m GH at Mackay. The flooding was associated with a tropical cyclone which hit Bowen (to the north of Mackay) on the preceding day. Flooding occurred in River and Victoria Streets, the Pioneer Bridge was partly washed away and farm machinery and cane lands were damaged. Buildings were destroyed in the River Estate (Gourlay and Hacker, 1986, p. 68). The sequence of flooding prior to the construction of the levees is described in Appendix L. Maps of both the 1946 and 1954 floods (8.04 m and 7.45 m GH at Mackay respectively) based on McKay and Gourlay (1962) and Ullman and Nolan (1973) have been developed to illustrate the variability of the extent of ‘major’ flooding in Mackay prior to the construction of the levee system. These are shown in Figure 5.4 and Figure 5.5.

77
Historical records indicate that, prior to mitigation works, even relatively minor flood events at Mackay caused some flood damage. In March 1921 and December 1927, for example, the Bureau of Meteorology’s Results of Rainfall Observations Made in Queensland (Supplementary Volume, 1940) states that inundation occurred in parts of Mackay. In January 1927, and again in January and February 1930, drowning deaths were associated with flooding. The widespread flooding in early 1930 was associated with a tropical cyclone which crossed the coast near Mossman (in Far North Queensland) on 20 January. This tropical cyclone recurved east of Mackay, with rainfall inundating low-lying areas of Mackay. Bridges and roads in the Mackay region were damaged, the harbour wall was severely damaged, and a bridge at Mirani was destroyed. Between 10 and 12 July 1933, heavy rainfall resulted in roads and bridges becoming submerged in the Mackay region (Bureau of Meteorology, 1940). The flooding extended over Central Queensland and was associated with a late-season cyclone, which recurved over Broad Sound and Rockhampton towards the southeast. Severe localised flooding occurred in 1963 in North Mackay in the area of the Gooseponds. Rainfall totalling 508 mm fell in 24 hours causing short term inundation (up to 76 mm) to 150 residential properties (Ullman and Nolan, 1973).

78
Figure 5.4: Extent of inundation during the March 1946 flood in Mackay
Figure 5.5: Extent of inundation during the February 1954 flood in Mackay
79
Flood mitigation works began in 1872 with the construction of training walls and embankments to protect the river banks being used as the town’s port (Gourlay and Hacker 1986, p. 60). Most of the stone training walls on both sides of the river were constructed between 1886 and 1923 (Gourlay and Hacker, 1986, Figure 4.9). It was not until after the major floods of 1958, however, that the construction of flood mitigation levees commenced. These were initially confined to the south bank (i.e. protecting the Old Mackay area), and were designed to withstand a flood of similar magnitude to the flood of February 1958 which was thought at the time to be approximately a Q50. Further levees were built in the late seventies through to the nineties on the northern and southern sides of the Pioneer River. The impact of small to medium floods in Mackay will be further reduced following the building of a levee around Sams Road and the proposed levee stage 1B/2. The location of existing and proposed levees is shown in Figure 5.6. A flood gate has also been constructed at the mouth of Sandfly Creek. When lowered, this gate reduces the flow of flood or storm tide water into Sandfly Creek and consequently into the urban area. It also converts the Sandfly Creek area into a flood detention basin for storm water runoff from part of Central and East Mackay. To overcome environmental concerns for the preservation of the mangrove communities along Sandfly Creek this flood gate is, under normal circumstances, left open. Council staff only close it when a flood warning is issued. Mackay City Council (1998a) has adopted a nominal ground level for planning of Q50 (a 2% AEP flood), which is lower than many Councils. Most communities in NSW, for example, have selected the 1% AEP as the flood planning level. Mackay City Council has, however, adopted minimum building floor levels for new buildings. This must be whichever is the higher of the estimated level of the 1 in 100 year flood event or the 1 in 100 year storm tide event plus allowance for a factor of safety and stormwater drainage freeboard (Mackay City Council 1998a). The amount of residual risk in Mackay is however high. Furthermore, as discussed later, these flood levels have recently been reviewed. What was previous believed to be an ARI of 50, for example, is actually closer to a 40 year ARI, so the protection afforded by the planning controls are not as effective as previously believed. Mackay River Flood Risk Scenarios The statistically reliable flood record for Mackay spans about 90 years and there are isolated data which extend the information for very severe floods back to 1884. During this time various mitigation works have altered the floodplain’s response to flooding and this has necessitated re-appraisal of the stage-discharge relationships. Also, rainfall records have been extended over time and space and the regional hydrology has been reassessed. Accordingly, estimates of flood recurrence intervals have changed over the years and several physical and numerical flood modelling studies have been undertaken (e.g. Cameron, McNamara and Partners, 1976; McKay, 1979; and Bureau of Meteorology, 1995). A ‘quasi two-dimensional’ hydraulic model of the Pioneer River has recently been developed by Hatch Associates (ex BHP Engineering) under a consultancy to the Department of Emergency Services (DES, 2000). That study provides updated estimates of the 2% and 1% AEP flood flows (50 and 100 year ARI) and also the PMF (probable maximum flood). The resulting modelled flood levels for Mackay are used here. However, we have extensively modified the flood extents (in consultation with Hatch Associates) to remove anomalies. The PMF is the statistically largest possible flood which can occur and is usually perceived as having an AEP of between 0.001 and 0.0001%. This is equivalent to an ARI of between 100 000 and one million years. The predicted levels of these floods at Forgan Bridge gauge are shown in Table 5.2 below. Table 5.2: Predicted Flood Levels at Forgan Bridge (DES 2000) AEP ARI Flood Level (%) (years) (m AHD)

80
2 50 7.12 1 100 7.49 PMF 8.33 Levee Overtopping The Mackay levees have been built to an average height of about the level of the 1958 flood which at the time was judged to be a Q50. However, the DES (2000) modelling study suggests an ARI of about 38 years for this event and concluded that the present levee may only provide protection for floods up to an ARI of approximately 30 years. This represents a levee crest elevation of about 6.7 m AHD near Canelands. Higher floods will then lead to overtopping of the levee and potentially to scouring which, depending on the magnitude of the event, may result in failure and breaching of parts of the system. In the overtopping scenario there will be localised areas of high flow velocity over or through the levee that will cause local scouring and erosion, significant damage to property and hazardous conditions for residents, making movement very difficult. The overflowing floodwaters would then seek alternative paths to the sea through natural creek systems and major drains, causing ponding and inundation in some areas as the flow increases. If the levee fails to retain a significant proportion of the flood then ultimately the inundation levels might be similar to those which would have occurred without the levee system in place. The DES (2000) study indicates that during a flood with a 2% AEP the levee would be overtopped initially at Canelands near Alligator Creek by about 0.6 m for several hundred metres. The levee in the vicinity of Forgan Bridge would then be overtopped by about 0.5 m and then the levee at Sandfly Creek by about 0.3 m. This assumes that the levee would remain intact during overtopping, while in reality the levee would be likely to suffer severe damage and could fail completely. The sudden influx of water as the levee is scoured and/or breached would raise water levels in the city significantly and could catch remaining people in the area unprepared. Movement of remaining people could be severely inhibited because of the high velocities, depending on location. A severe wind and/or storm tide event concurrently, or within 24 hours of riverine flooding would further increase community vulnerability. No studies have yet been done which fully assess the likely progression of such an event, however, the combination of such low level levees and rapid rise time of the Pioneer River make it likely that evacuations would need to commence well before the water reached the top of the levees in order to minimise the risk to human life and property damage or loss. Flood risk scenarios The total number of properties in the study area (see Figure 2.3) is 20 750. For the purposes of assessing the risk of inundation to buildings in Mackay during the 2% AEP, 1% AEP and PMF scenarios, those properties classified with a feature use of type “O” (open space) and type “Z” (miscellaneous features, e.g. car parks) are excluded in this assessment. Therefore, the actual total number of buildings in the Mackay study area is 20 672. References to the number of buildings affected by flooding refers to the number of properties which would be exposed to inundation and does not necessarily mean that there would be overfloor flooding unless specifically indicated. Depth of inundation, greater than one metre, has been modelled for the developed areas of North Mackay, Central Mackay, East Mackay and South Mackay for each of the scenarios. For the PMF scenario, depth of inundation greater than one metre has also been modelled for the Lagoons area

81
around West Mackay and the Gooseponds. Depth of inundation greater than two metres has been modelled for these areas during the PMF scenario except for the Gooseponds and the Lagoons area. Outside of these areas, the horizontal extent of inundation only is indicated. It is likely, therefore, that the area covered by water deeper than one metre, and the number of buildings affected by overfloor flooding is greater than indicated in these scenarios, particularly in the area of the Gooseponds and in the Lagoons area. Figure 5.7 shows the cumulative exposure to flood inundation in Mackay. Figure 5.8 shows the distribution of buildings with water overground by suburb for the three scenarios. Figure 5.9 shows overground flooding by suburb as a percent of the number of buildings in the suburb. Each scenario is described in more detail below.
0
2000
4000
6000
8000
10000
12000
2.0% AEP 1.0% AEP PMFAnnual exceedence probability
Num
ber o
f bui
ldin
gs e
xpos
ed
OvergroundOver floor >1m over floor
.
Figure 5.7: Cumulative exposure to flood inundation in Mackay

82
0
500
1000
1500
2000
2500
3000
Num
ber o
f pro
pert
ies
with
w
ater
ove
rgro
und
Ande
rgro
ve
Cen
tral M
acka
y
Cre
mor
ne
East
Mac
kay
Erak
ala
Foul
den
Gle
nella
Mac
kay
Har
bour
Mou
nt P
leas
ant
Nor
th M
acka
y
Oor
alea
Page
t
Rac
ecou
rse
Slad
e Po
int
Sout
h M
acka
y
Te K
owai
Wes
t Mac
kay
Suburb
2.0% AEP1.0% AEPPMF
Figure 5.8: Distribution of buildings with water overground by suburb for 2% AEP, 1% AEP and
PMF scenarios
0
10
20
30
40
50
60
70
80
90
100
Ove
rgro
und
flood
ing
as a
per
cent
of t
he
tota
l num
ber o
f bui
ldin
gs in
eac
h su
burb
Ande
rgro
ve
Cen
tral M
acka
y
Cre
mor
ne
East
Mac
kay
Erak
ala
Foul
den
Gle
nella
Mac
kay
Har
bour
Mou
nt P
leas
ant
Nor
th M
acka
y
Oor
alea
Page
t
Rac
ecou
rse
Slad
e Po
int
Sout
h M
acka
y
Te K
owai
Wes
t Mac
kay
Suburb
2.0% AEP1.0% AEPPMF
Figure 5.9: Overground flooding by suburb as a percent of buildings in the suburb for 2% AEP,
1% AEP and PMF scenarios A summary of building damage generated by the 2% (ARI = 50) and 1% AEP (ARI = 100) and PMF flood scenarios is shown in Table 5.3. The damage levels are assigned assuming that slight damage occurs when a property is inundated, moderate damage occurs when flood waters rise up to one metre above floor level and extensive damage occurs when flood waters rise over one metre above floor level.

83
This is intended to be indicative only. Slight damage may include damage to items stored below floor level (e.g. lawnmowers and tools) and fences. The damage level increases as soon as overfloor flooding occurs with damage to carpets, floor boards, chipboard, plasterboard etc. As water depth over floor increases, so does the risk of extensive damage and structural failure. Black (1975), for example, showed that building failure of weatherboard houses can occur when flood depth over floor level is more than one metre and water velocities are more than about 2 m/sec. At lower velocities and greater depths, and at higher velocities and lower depths building failure may also occur. The flood damage scenarios in Table 5.3 also assume that severe wind or storm tide associated with tropical cyclones does not precede flooding as in 1918 when many of the buildings were already damaged by the time the riverine flood occurred.
Table 5.3: Flood damage scenarios for buildings in Mackay
ARI Nil damage Slight
damage Moderate damage
Extensive damage
(yr) No. Bldg.
% of total
No. Bldg
% of total
No. Bldg
% of total
No. Bldg
% of total
50 13 065 75.8% 2395 11.6% 1980 9.6% 626 3.0% 100 10 748 70.5% 2276 11.0 % 2452 11.9% 1372 6.6 PMF 3923 51.1% 3451 16.7% 2875 13.9% 3774 18.3%
Q50 (2% AEP) flood: Spatial distribution of buildings affected by flooding: Figure 5.10 indicates the extent of inundation in Mackay during a flood with an estimated 2% AEP. Under this scenario, the levees would be overtopped by about 0.5 m and approximately 5000 (24%) of the buildings in Mackay would have water on the property and 176 km of road would be affected. Of the 29 suburbs in the Mackay study area, 12 suburbs (41%) would have buildings free from inundation.

84
Figure 5.10: Modelled extent of inundation for Mackay for a flood with a 2% AEP Modified from DES (2000) All of the buildings in the suburbs of Cremorne, East Mackay and Foulden would be affected, however, Foulden has only one building and Cremorne only 23 buildings respectively. On the other hand, South Mackay has approximately 1350 buildings affected, however, only 51% of the suburb is affected by flooding (see Figure 5.8 and Figure 5.9). Fifty percent of the suburbs affected by inundation would have less than ten percent of the buildings in the suburb affected. The greatest number of buildings affected lie in the suburbs of Central Mackay, South Mackay and East Mackay (28%, 27% and 22% respectively of the total number of buildings affected by inundation) (see Figure 5.8). Whilst the actual areal extent of inundation is slightly less on the southern side of the river (19.6 km2 compared to 23.1 km2), 80% of the buildings and 63% of the roads affected are on the southern side. Feature use distribution of buildings affected by inundation: Of the approximately 5000 or so buildings that would be affected, 76% would be houses, 8% would be blocks of flats and 10% would be buildings related to business. Only about 6% of properties affected would be buildings related to public safety, storage and transport, logistics, health services, power, water supply and sewerage utilities, telecommunications, accommodation, education, recreation, industry, community and government. These, however, form many of the key facilities. Key facilities affected: A number of key facilities would be affected. Those that would include:
• the North Mackay fire station;

85
• the Mackay City Council building (from which the local disaster coordination committee would operate); the Mackay fire station; the SES district headquarters; the ABC studios, the Tennyson Street substation, the Mackay electricity board, and the major food warehousing and cold store facilities in Central Mackay;
• the Mackay Base hospital and water treatment plant in West Mackay; • the Central Queensland helicopter rescue service, and the Mackay airport and aviation
depots in South Mackay; and, • the BP fuel depot and transport terminals in Mackay Harbour.
Depth of inundation and overfloor flooding: Approximately half of the 5001 properties inundated would have water over floor level (see Figure 5.7). Ten percent (1980 buildings) of the total number of buildings in Mackay (20 672) would have overfloor flooding of less than one metre. Three percent (626 buildings) of the total would have overfloor flooding of greater than one metre and are likely to suffer severe damage and/or structural failure. At least two key facilities would be affected by overfloor flooding. These would include the Central Queensland helicopter rescue service and the Mackay airport depot, both situated in South Mackay. Thirty-eight percent of houses, 45% of flats and 47% of businesses with properties affected by inundation would have overfloor flooding of less than one metre. Thirteen percent of houses, 13% of flats and 8% of businesses with properties affected by inundation would have overfloor flooding of greater than one metre. No account has been taken of the additional damage likely to be caused by localised high velocities as the levee is overtopped. Isolated properties: Approximately a further 1970 (10%) buildings would be isolated for a period by flooded and/or damaged roads. Of these, parts of Central Mackay, North Mackay and Mackay Harbour would be entirely isolated. Part of South Mackay would also be surrounded by floodwaters but is not developed. Parts of Slade Point would be isolated by floodwaters and ocean. Other suburbs would not be completely isolated by water, lying on the fringes of flooded areas, but could be isolated due to flooding of access roads. Of the buildings isolated by flooding there would be:
• 204 in Central Mackay including the Mackay ambulance station, the district police headquarters, the Mater hospital and many buildings related to business;
• 2 in Erakala, both residential; • 1 business in Glenella; • 82 in Mackay Harbour including the Mt Bassett weather station, the bulk fuel and gas
storage depots; the bulk ethanol and chemical storage tanks; the major sewage treatment plant; the grain silos, the sugar terminals, and other port and industrial facilities;
• 9 in Mount Pleasant, largely buildings related to business; • 362 in North Mackay, predominantly residential; • 1 house in Paget; • 12 in Racecourse, all residential; • 1249 in Slade Point, most of them residential; • 35 in South Mackay, predominantly residential but including the Mackay airport fire
station and the airport terminal; and, • 10 in West Mackay, all residential.
Q100 (1% AEP) flood: Spatial distribution of buildings affected by flooding: Figure 5.11 indicates the extent of inundation in Mackay during a flood with an estimated 1% AEP. Under this scenario, the levees would be overtopped

86
by about 1 m and approximately 6100 (30%) of the buildings in Mackay would have water on the property and 201 km of road would be affected. No additional suburbs would be affected compared to a 2% scenario.
Figure 5.11: Modelled extent of inundation for Mackay for a flood with a 1% AEP
Modified from DES (2000)
In addition to all the buildings in Cremorne, East Mackay and Foulden being affected (as in a 2% scenario), all the buildings in Central Mackay would also be exposed to inundation (see Figure 5.9). Only thirty-eight percent of the suburbs affected by inundation would have less than ten percent of the buildings in the suburb affected. The greatest number of buildings affected lie in the suburbs of South Mackay, Central Mackay, East Mackay and North Mackay (29%, 27%, 18% and 17% respectively of the total number of buildings exposed to inundation) (see Figure 5.8). Eighty percent of the buildings and 63% of the roads affected would be on the southern side of the river, though inundation would be slightly less on the southern side (21.7 km2 compared to 24.6 km2). Feature use distribution of buildings affected by inundation: Of the approximately 6100 or so buildings that would be affected, 76% would be houses, 7% would be blocks of flats and 10% would be buildings related to business. Only about 7% of properties affected would have buildings related to other feature uses.

87
Key facilities affected: The key facilities affected during a 2% AEP flood would be affected to a greater depth during a 1% AEP flood. However, a small number of additional key facilities would be affected including:
• the ambulance station; the district police headquarters; the Mackay telephone exchange;
and, the Mater hospital, all in Central Mackay; and, • the Mackay airport fire station in South Mackay.
Depth of inundation and overfloor flooding: Approximately 3820 buildings (62% of buildings affected) would have water over floor level (see Figure 5.7). Twelve percent (2452 buildings) of the total buildings in Mackay would have overfloor flooding of less than one metre. Seven percent (1372 buildings) of the total would have overfloor flooding of greater than one metre. At least eight key facilities would have water over floor level. These would include the fire station, ambulance station, the ABC studios, the Mater hospital and cold storage, all in Central Mackay; and, the Mackay airport and aviation depots and the Central Queensland helicopter service in South Mackay. Thirty-eight percent of houses, 45% of flats and 47% of businesses with properties affected by inundation would have overfloor flooding of less than one metre. Twenty-two percent of houses, 26% of flats and 21% of businesses with properties affected by inundation would have overfloor flooding of greater than one metre. No account has been taken of the additional damage likely to be caused by localised high velocities as the levee is overtopped. Isolated properties: Approximately a further 1590 (8%) buildings would be isolated for a period by flooded and/or damaged roads. Of these, parts of North Mackay and Mackay Harbour would be entirely isolated. A small part of South Mackay would also be surrounded by floodwaters but is undeveloped. Parts of Slade Point would be isolated by floodwaters and ocean. Other suburbs would not be entirely isolated by flooding as they lay on the fringes of flooded areas, but could be isolated by flooded access roads. Of the buildings isolated by flooding there would be:
• 13 in Andergrove, all residential; • 2 in Glenella, for business and storage; • 82 in Mackay Harbour including the Mt Bassett weather station, the bulk fuel and gas
storage depots; the bulk ethanol and chemical storage tanks; the major sewage treatment plant; the sugar terminals and grain silos and other port and industrial facilities;
• 188 in North Mackay, most of them residential; • 4 in Paget, predominantly business; • 9 in Racecourse, all residential; • 1247 in Slade Point, largely residential; • 5 in South Mackay including the Mackay airport terminal; • 1 house in Te Kowai; and, • 35 in West Mackay, residential but including the Mackay Base hospital.
The PMF Scenario: Spatial distribution of buildings affected by flooding: Figure 5.12 indicates the extent of inundation in Mackay during an estimated PMF. The extent to which the levees would be overtopped would vary along the city reach. Under this scenario, the levee would be overtopped by about 2 m near the intersection of Shakespeare Street and Nebo Road, by nearly 2 m at Milton Street near Canelands, by 0.6 m at River Street near Canelands, by 1.4 m in the city reach upstream of the Forgan Bridge and by

88
1 m in the city reach downstream of the Forgan Bridge. Approximately 10 100 buildings (49%) of the buildings in Mackay would have water on the property and 275 km of road would be affected.
Figure 5.12: Modelled extent of inundation for Mackay for a PMF
Modified from DES (2000)
The suburbs affected during a 1% AEP equivalent scenario would again be affected (and to a greater depth) during a PMF scenario, however, the suburb of Te Kowai would also be affected. During a PMF scenario, all the buildings in Central Mackay, Cremorne, East Mackay, Foulden and South Mackay would be affected. Ninety-nine percent (2444 buildings) would also be affected in West Mackay. North Mackay would have a large number of buildings affected (1360), though only 63% of the buildings in the suburb would be affected (see Figure 5.8 and Figure 5.9). Whilst the actual areal extent of inundation is very similar on the northern and southern sides of the Pioneer River (29.7 km2 on the north compared to 31.8 km2 on the south), 80% of the buildings and 65% of the roads affected would be on the southern side. Feature use distribution of buildings affected by inundation: Of the approximately 10 100 or so buildings that would be affected, 80% would be houses. That is, 45% of houses in Mackay would be exposed to inundation. Sixty-four percent of the blocks of flats in Mackay would be affected, and 87% of businesses. This would have a large impact on the local community, through permanent or temporary displacement, through disruption of supplies, and through temporary or permanent closure of local shops.

89
Though all the buildings other than residential and business only comprise 6% of the buildings affected, the number of people affected would extend to a much wider area than that directly affected by flooding. The worst affected (as a percentage of the total number of buildings in each type of feature use) are buildings associated with power utilities (92%), with only the Port substation unaffected. This could potentially cause power outage throughout the entire city. Eight-eight percent of buildings associated with doctors and health services would be affected. Only one of three hospitals would be flood free and nearly all nursing homes would be affected. This would have special implications for evacuations and place a large strain on the few unaffected services. Eighty-four percent of buildings associated with industry in Mackay would be affected. Seventy-eight percent of buildings associated with public safety would be affected. This would disrupt industry operations in Mackay and reduce the ability and speed with which the relevant services could provide emergency response. Key facilities affected: The key facilities affected during a 1% AEP flood would also be affected (and to a greater depth) during a PMF flood. However, additional key facilities would be affected including:
• the substation in Andergrove; • the substation and Ergon depot buildings in West Mackay; • the railway station in Paget; and, • the Mackay airport terminal and airport control tower in South Mackay.
Depth of inundation and overfloor flooding: Approximately 6650 buildings (65% of the number of buildings affected) would have water over floor level (see Figure 5.7). Fourteen percent (2875 buildings) of the total number of buildings in Mackay would have overfloor flooding of less than one metre. Eighteen percent (3774 buildings) would have overfloor flooding of greater than one metre and are likely to suffer severe damage or structural failure. At least fifteen key facilities would have water over floor level. These would include:
• the North Mackay fire station; • the Mater hospital, the Mackay ambulance station, the Mackay fire station, the SES
district headquarters, the district police headquarters, the Mackay City Council, the Mackay telephone exchange, the Mackay electricity board and the Tennyson Street substation, all in Central Mackay;
• the Mackay Base hospital and water treatment plant in West Mackay; and, • the Mackay airport and aviation depots, the Central Queensland helicopter rescue service,
and the Mackay airport fire station, all in South Mackay. Of these, at least nine key facilities would have water greater than 1.5 m over floor level and are likely to suffer severe damage or structural failure. These would include:
• the Mater Hospital, the Mackay fire station, the Mackay ambulance station, the ABC studios, and the Mackay electricity board and Tennyson Street substation, all in Central Mackay; and,
• the Mackay airport, the aviation depots, and the Central Queensland helicopter rescue service, all in South Mackay.
Twenty-eight percent of houses, 26% of flats and 35% of businesses with properties affected by inundation would have overfloor flooding of less than one metre. Thirty-five percent of houses, 54% of flats and 47% of businesses with properties affected by inundation would have overfloor flooding of greater than one metre.

90
No account has been taken of the additional damage likely to be caused by localised high velocities as the levee is overtopped. Isolated properties: Approximately a further 1540 buildings (7%) would be isolated for a period by flooded and/or damaged roads. Parts of North Mackay, Mackay Harbour and West Mackay would be entirely surrounded by water. Floodwaters and ocean would isolate parts of Slade Point. The small part of South Mackay that would be isolated, however, is as undeveloped. Other suburbs would not be entirely isolated by water as they lay on the fringes of flooded areas, but could be isolated by flooded access roads. Of the buildings isolated by flooding there would be:
• 228 in Andergrove, nearly all residential; • 1 business in Erakala; • 14 houses in Glenella; • 68 in Mackay Harbour, including the Mt Bassett weather station; the bulk fuel and gas
storage depots; the bulk ethanol and chemical storage tanks, the major sewage treatment plant; the grain silos, the sugar terminals, and other port and industrial facilities;
• 30 in Mount Pleasant, all residential; • 80 in North Mackay, residential and business; • 12 in Ooralea, including buildings used for business, residential and logistics; • 3 houses in Paget; • 4 houses in Racecourse; • 1086 in Slade Point, most of them residential; • 2 houses in Te Kowai; and, • 14 in West Mackay, largely business.
Scenario Uncertainty
The extents of the 2% and 1% AEP floods and the PMF are derived from DES (2000). Information on depth of inundation is limited to the developed areas of North Mackay, Central Mackay, East Mackay, South Mackay and West Mackay, and until more detailed water depth information is available, the number of buildings affected by overfloor flooding (and the depth of overfloor flooding where it occurs) will be uncertain. The absence of detailed velocity information also makes estimates of structural damage and danger to human life difficult to assess. Dam or weir failure There are no major dams in the Pioneer River catchment. The largest dam is the Teemburra Dam, with a catchment area of 66 km2 in the Upper Pioneer catchment. Dam Break Analysis (DBA) undertaken by the Department of Natural Resources (DNR, 1998) indicates that embankment failure caused by a PMF would not have a significant impact on Mackay, though would inundate parts of the townships of Mirani and Marian and Pleystowe Mill. This analysis, however, does not include any inflow from creeks below the dam to the junction with the Pioneer River itself. Therefore Mirani township, Marian township and Pleystowe Mill may be flooded to a greater depth than indicated by the DBA. PMF with dam failure is only 1.3 m below the rail bridge in Mackay and may be influenced by the tide. Unexpected dam failure not associated with flooding (for example caused by piping failure or an earthquake), would cause inundation only in Marian. Three weirs exist in the catchment, Mirani Weir, Marian Weir and Dumbleton Weir. Weir failure would not greatly affect Mackay, subject of course to tidal influence, though no DBA has, as yet, been undertaken by DNR (Bevan Faulkner, verbal communication, 2000).

91
Interpretation The number of buildings at risk from small to medium floods in Mackay has decreased through levee construction. Ongoing urbanisation on the flood plain, however, has increased the number of buildings vulnerable to flooding in an event that exceeds the current level of protection afforded by the levee system. Though such mitigation works can greatly reduce the risk to a community in one sense, they can also produce a misleading sense of security. Consequently, in the event of a large flood overtopping or breaching the levees (i.e. a flood with an ARI of 50 or higher), flood impact will be severely damaging. An effective flood warning system (as operated by the Bureau of Meteorology in conjunction with the City Council and Pioneer River Improvement Trust in Mackay) is therefore crucial to the provision of an adequate warning period for flood preparations and/or evacuation in flood prone areas, especially when a flood that is likely to exceed the height of the levees is predicted. Given the very limited warning time available for Mackay, considerable attention needs to be given by Council to detailed planning for the overtopping and possible failure of the levees. To be effective, this will require the involvement of the Mackay communities at risk.


![Flood mapping [v1.0] [131116] · rural settings. While detailed technical methodologies for calculating, modelling and mapping flood prone areas and flood risks are available in data-rich](https://static.fdocuments.in/doc/165x107/5f101b237e708231d447798c/flood-mapping-v10-131116-rural-settings-while-detailed-technical-methodologies.jpg)


