CHAPTER 5 FINITE ELEMENT ANALYSIS OF THE...
30
112 CHAPTER 5 FINITE ELEMENT ANALYSIS OF THE BUMPER BEAM The main purpose of bumper is to absorb shock in case of a collision. Several materials have been used to develop these shock-absorbing capabilities, such as steel, aluminium, glass mat thermoplastics and sheet molding compound. The purpose of this project is to design a bumper which is to improve crashworthiness of the bumper beam. Crashworthiness is the ability of the bumper beam to prevent occupant injuries in the event of an accident and this is achieved by minimizing the impact force during the collision. 5.1 STRATEGIC PARAMETERS The need for computer crash simulations with high degrees of fidelity and robustness is becoming increasingly important for use in parametric studies and early design analysis. The numerical simulations also enable new design concepts to be evaluated where there is a need to establish an optimum design with interaction between materials and structural forms. The main objective of this chapter is to investigate the ability of the non- linear FE code LS-DYNA (Hallquist 2003) to predict the response of the bumper beam system. The main focus is placed on accurate prediction of the observed system behaviour with respect to force-deformation characteristics and fracture modes.
Transcript of CHAPTER 5 FINITE ELEMENT ANALYSIS OF THE...

112
CHAPTER 5
FINITE ELEMENT ANALYSIS OF THE BUMPER BEAM
The main purpose of bumper is to absorb shock in case of a
collision. Several materials have been used to develop these shock-absorbing
capabilities, such as steel, aluminium, glass mat thermoplastics and sheet
molding compound. The purpose of this project is to design a bumper which
is to improve crashworthiness of the bumper beam. Crashworthiness is the
ability of the bumper beam to prevent occupant injuries in the event of an
accident and this is achieved by minimizing the impact force during the
collision.
5.1 STRATEGIC PARAMETERS
The need for computer crash simulations with high degrees of
fidelity and robustness is becoming increasingly important for use in
parametric studies and early design analysis. The numerical simulations also
enable new design concepts to be evaluated where there is a need to establish
an optimum design with interaction between materials and structural forms.
The main objective of this chapter is to investigate the ability of the non-
linear FE code LS-DYNA (Hallquist 2003) to predict the response of the
bumper beam system. The main focus is placed on accurate prediction of the
observed system behaviour with respect to force-deformation characteristics
and fracture modes.
113
There were four main strategic parameters being studied during the
test modelling. In the first step for metallic material it was necessary to know
the type of material can affect the impact specifications and what kind of
materials could be used as replacement in order to lower part weights. The
effect of module of elasticity and yield strength on impact behavior of bumper
beam was under investigation in this section. Secondly, the thickness, i.e.,
how the bumper beams thickness could affect the impact specifications.
Thirdly, the shape, i.e., how could small changes and modifications result in
easier manufacturing processes and lessening material volume without
lowering the impact strength. Finally, the impact condition, i.e., how the test
conditions other than the previously mentioned parameters could affect the
impact behaviour.
Steel and Aluminium structures with a specified thickness that did
not fail during the test depicted clearly that they are not suitable as bumper
beam structure due to increased weight. They increased the weight of the
structure by nearly 500% and 100%, respectively, in comparison with
composite bumper.
In the next step, the composite materials like GMT,LFRT and
KLFRT were used and studied to find the best impact behaviour. Here
KLFRT material was chosen for its outstanding results in mechanical and
thermal properties. The summarize, the objective of this research was to
develop and propose a natual fiber composite bumper, which could satisfy
following requirements:
1. Easy to manufacture by the shape. This was accomplished by
removing strengthening ribs of bumper.
2. Being economical by utilizing low-cost composite materials.

114
3. Achieving reduced weight compared to the metallic bumper.
4. Achieving improved or similar impact behavior compared to
the currently used metallic structure.
5.2 MECHANICAL PROPERTIES OF MATERIALS
Mechanical properties for the bumper materials are given below in
Table 5.1.The values of Steel, Aluminium, GMT and LFRT were taken from
literature review (Mahmood et al 2008) the KLFRT composite values were
taken from the graphs drawn for tensile and flexural testing.
Table 5.1 Mechanical properties of the bumper materials
Material
Young’s
modulus
(GPa)
Poisson
ratio
Yield
strength
(MPa)
Density
(kg/m3)
Steel 210 0.3 700 7850
Aluminium 70 0.33 480 2710
GMT 12 0.41 230 1280
LFRT 9 0.45 190 1200
KLFRT 8.5 0.42 220 1240
5.3 COMMON REINFORCING BUMPER BEAM CROSS
SECTION
The bumper cross section plays very important role in designing of
the bumper beam. The cross section area of the bumper has direct contact
with the impactor.The cross section decides the energy absorption of the
bumper materials.
115
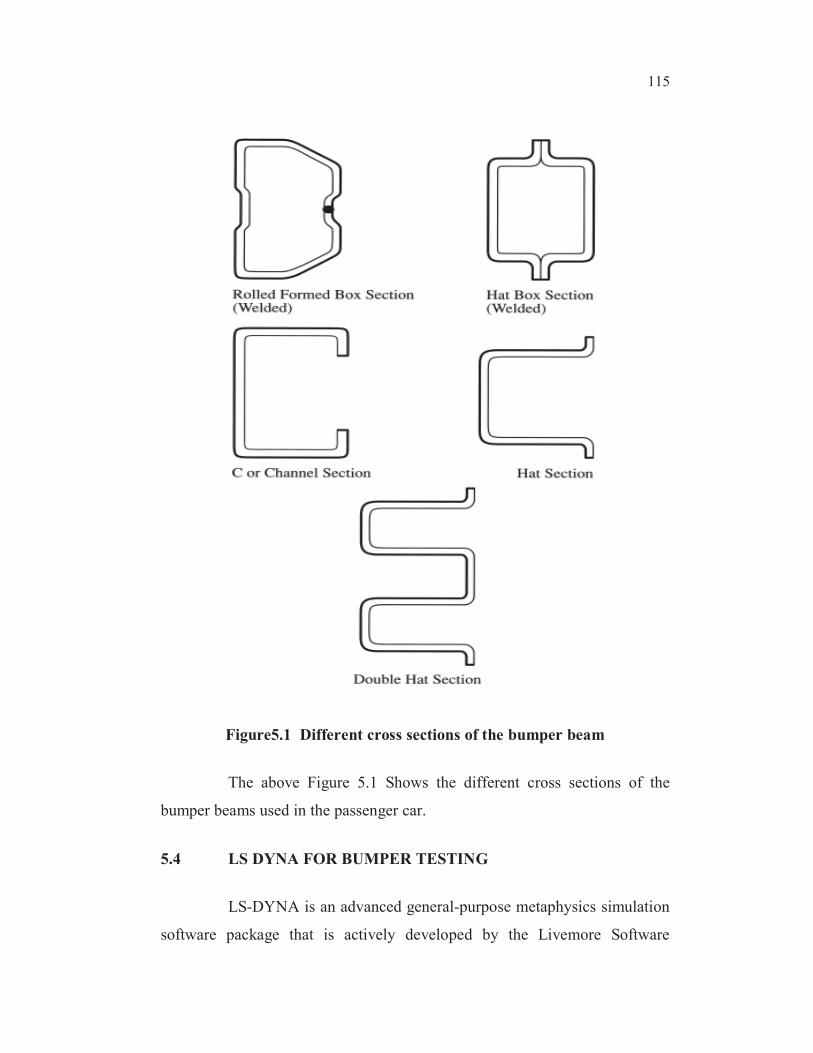
Figure5.1 Different cross sections of the bumper beam
The above Figure 5.1 Shows the different cross sections of the
bumper beams used in the passenger car.
5.4 LS DYNA FOR BUMPER TESTING
LS-DYNA is an advanced general-purpose metaphysics simulation
software package that is actively developed by the Livemore Software
116
Technology Corporation (LSTC). While the package continues to contain
more and more possibilities for the calculation of many complex, real world
problem, its origins and core-competency lie in highly nonlinear transient
dynamic Finite Element Analysis (FEA) using explicit time integration.
LS-DYNA is being used by the automobile, aerospace, construction, military,
manufacturing and bioengineering industries.
LS-DYNA is widely used by the automotive industry to analyze
vehicle designs. LS-DYNA accurately predicts a car’s behaviour in a
collision and the effects of the collision upon the car’s occupants. With
LS-DYNA automotive companies and their suppliers can test car designs
without having to tool or experimentally test a prototype, thus saving time
and expense.
A crash simulation is a virtual recreation of a destructive crash test
of a car using a computer simulation in order to examine the level of safety of
the car and its occupants. Crash simulations are used by automakers during
Computer-Aided Engineering (CAE) analysis for the crashworthiness in the
Computer-Aided Design (CAD) process of modelling new cars. During a
crash simulation, the kinetic energy, energy of motion, that a vehicle has
before the impact is transferred into deformation energy, mostly by plastic
deformation (plasticity) of the car body material (Body in White), at the end
of the impact.
Data obtained from a crash simulation indicate the capacity of the
car body structure to protect the occupants during a collision (and also
pedestrians hit by a car) against injury. Important results are the deformations
(for example, steering wheel intrusions) of the occupant space (driver,
passenger) and the decelerations (for example, head acceleration) felt by
them, which must fall below threshold values fixed in legal car safety
regulations. To model real crash tests, today’s crash simulations include

117
virtual models of crash test dummies and passive safety devices (seat belts,
airbags, shock absorbing dash boards.etc.).
Thus the basic concept of the existing bumper systems, the type of
materials and the effect of different cross section used in bumper system were
studied. Software required for modelling, meshing and analyzing the bumper
beam such as Hypermesh and LS Dyna were utilised.
5.4.1 Explicit Simulations
Only explicit crash simulations were performed in this study.
However, implicit dynamic simulations of the bumper beam-longitudinal
system can also be performed but the convergence becomes critical due to the
number of contact definitions, which requires lot of simulation time (Kokkula
et al 2003). The simulations were performed on a single Linux processor.
LSDYNA uses a central difference operator for time integration, requiring a
limitation on the time-step size. To obtain numerical stability during the crash
simulations, the time-step size is typically in the order of one microsecond.
All the simulations were executed with a variable time-step. It is also possible
to execute the simulations with a fixed time-step, which generally has the
potential of yielding large errors in analyses including inertia effect.
5.5 DEVELOPMENT OF BUMPER BEAM FOR THE FEA
SIMULATIONS
5.5.1 Specification of the bumper
As initially a chosen passenger car bumper beam in analysis.
Material used in bumper beam- steel
Outside to outside - 1070mm
118
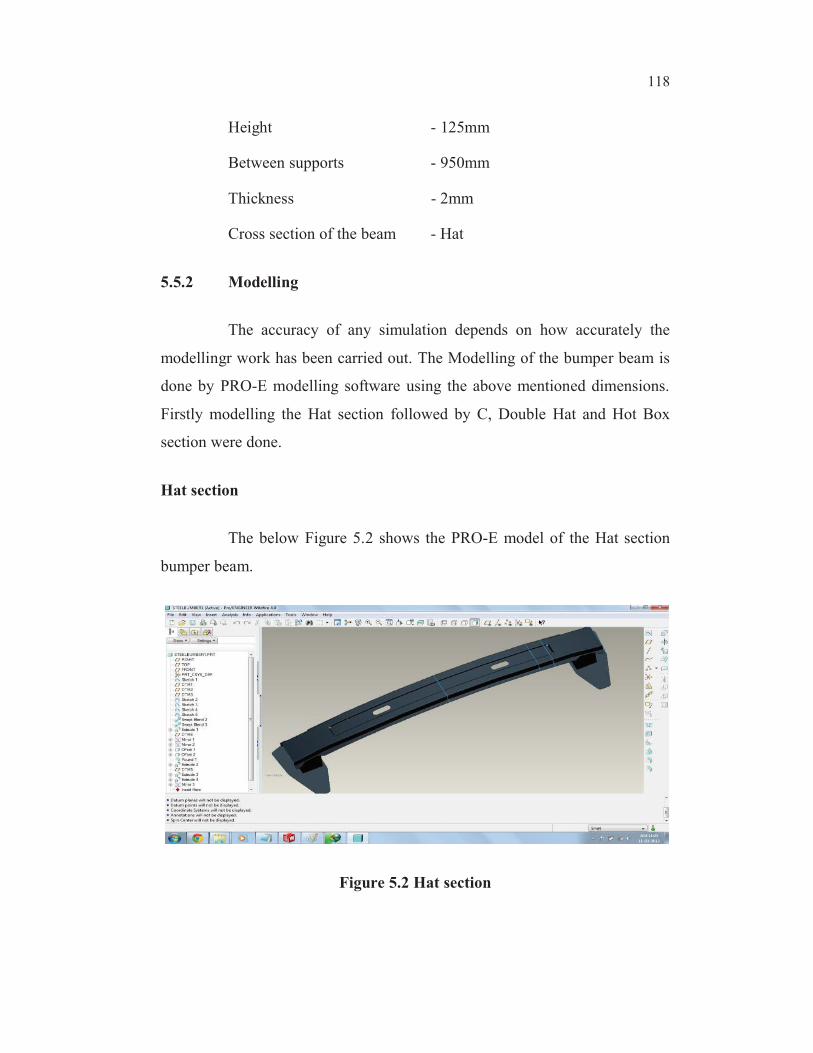
Height - 125mm
Between supports - 950mm
Thickness - 2mm
Cross section of the beam - Hat
5.5.2 Modelling
The accuracy of any simulation depends on how accurately the
modellingr work has been carried out. The Modelling of the bumper beam is
done by PRO-E modelling software using the above mentioned dimensions.
Firstly modelling the Hat section followed by C, Double Hat and Hot Box
section were done.
Hat section
The below Figure 5.2 shows the PRO-E model of the Hat section
bumper beam.
Figure 5.2 Hat section

119
C section
The below Figure 5.3 shows the PRO-E model of the C section
bumper beam.
Figure5.3 C section
Double Hat section
The belowFigure5.4 shows the PRO-E model of the Double Hat
section bumper beam.
Figure 5.4 Double hat section

120
Hot Box section
The belowFigure5.5 shows the PRO-E model of the Hat section
bumper beam. Efforts were taken in constructing the model of the bumper
beam as similar as possible to the reality. The bumper beam and all other
components in the system was modelled and meshed in order to make a
precise model using PRO E and HYPER MESH. Thus the dimensions of the
bumper used in the passenger car were measured and using the PRO-E
software the model of the bumper beam was designed for the different cross
section.
Figure 5.5 Hot box section
5.6 DEVELOPMENT OF FEA MODEL FOR THE BUMPER
BEAMS
5.6.1 Meshing
The conventional model which was developed in PRO-E software
has to be meshed for analysis of crash. For this HYPERMESH software is
used. Altair Hypermesh is a high-performance finite element pre-processor
that provides a highly interactive and visual environment to analyze product
121
design performance. With the broadest set of direct interfaces to commercial
CAD and CAE systems, Hypermesh provides a proven, consistent analysis
platform.
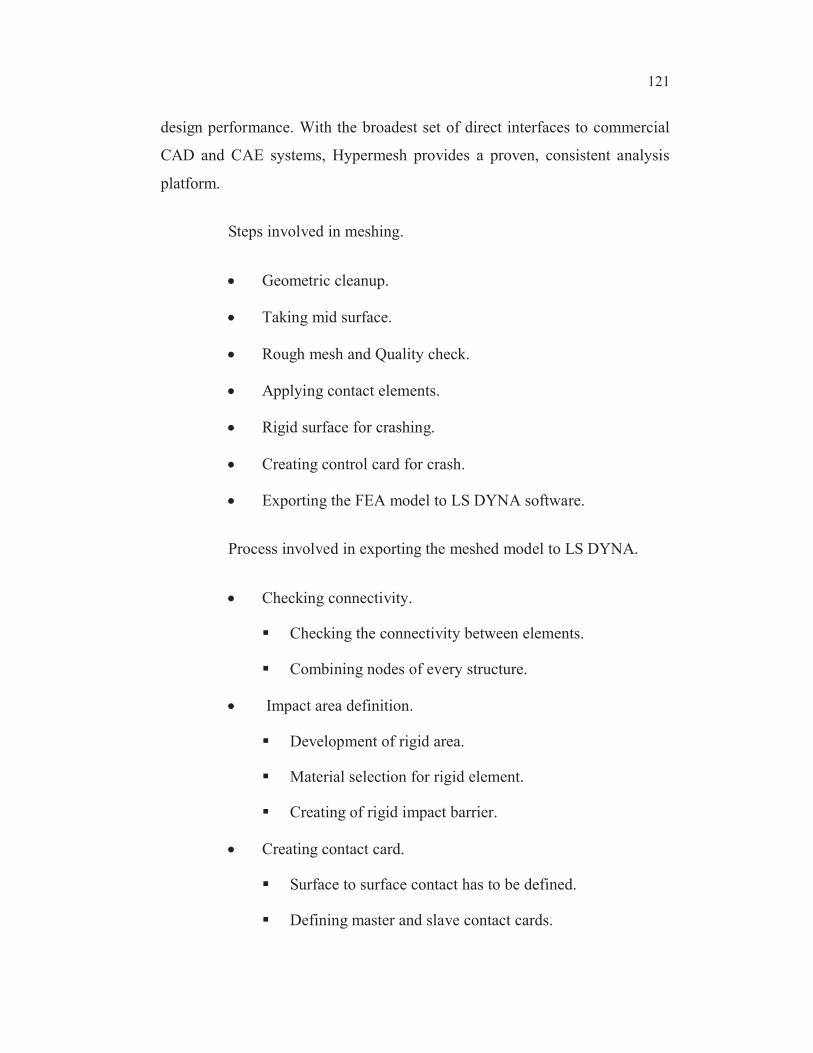
Steps involved in meshing.
Geometric cleanup.
Taking mid surface.
Rough mesh and Quality check.
Applying contact elements.
Rigid surface for crashing.
Creating control card for crash.
Exporting the FEA model to LS DYNA software.
Process involved in exporting the meshed model to LS DYNA.
Checking connectivity.
Checking the connectivity between elements.
Combining nodes of every structure.
Impact area definition.
Development of rigid area.
Material selection for rigid element.
Creating of rigid impact barrier.
Creating contact card.
Surface to surface contact has to be defined.
Defining master and slave contact cards.

122
Defining AUTOMOTIVE option.
Velocity of contact cards has to be defined.
Velocity of particular nodes has to be mentioned.
Control Energy Development.
To obey cube rebound theory.
Shell element and solid element internal energy definition.
Defining Control output.
Result frequency has to be defined.
Control termination.
Defining end time of the impact or process.
Number of cycles to be defined.
5.6.2 Boundary Conditions
The below Figure5.6 shows the boundary conditions of the bumper
beam in Hypermesh software.
Figure5.6 Meshedmodel of bumper and impactor

123
The gap between the impactor and bumper beam is 50mm.
Bumper beam - MAT24 PIECEWISE_LINEAR_PLASTICITY
Impactor - MAT 20 RIGID MATERIALS
Mesh element size -10
Each side 10 elements are constrained i.e., all degrees of freedom
were arrested.
The meshed model is imported to LS DYNA software for crash
analysis. The conditions are
Velocity of the impact barrier was 48 kmph for FMVS standard and
68 kmph for IIHS standard.
Crash type : frontal impact.
Obstruction : rigid barrier.
Simulation time : 12 ms.
The bumper beam will have some residual stresses because of the
stretch bending operation; these stresses will try to relax elastically, when the
stretch-bending tools are removed, to reach an equilibrium state. The elastic
recovery of stresses corresponds to an unloading phase; in general implicit
codes are more effective to represent this phase, see Mercer et al
(1995).Hence, an implicit spring back simulation was performed. The spring
back analysis was performed on the dynain1file obtained at the end of stretch
bending operation. It was observed from the simulation that there was a
shortening along the length of the bumper beam in the axial direction Thus
the model created in PRO-E were into Hypermesh, using mesh tool the
models were fine meshed and input parameters for the analysis the bumper
beam were given and run using LS Dyna software.

124
5.7 DEVELOPMENT OF MATHEMATICAL MODEL FOR THE
FRONTAL IMPACT
The simulation results which has been developed has to be
validated. But the experimental tests are very expensive and time consuming
to do a detailed work on this project. So there are some other ways to validate
the model.An alternate way to achieve the proposed result is to develop a
numerical model for the bumper and pendulum system for frontal collisions.
5.7.1 Quasi- Static Impact
Perhaps one of the most fundamental questions regarding the
analysis of this type of impact is whether transient, dynamic analysis is
necessary. The previous test experience discussed here suggests at non-linear
material and geometric behaviour is significant. If transient dynamic defects
also must be included also, the analysis should be very burdensome. To assess
this issue, some simple spring-mass models were employed.
The first model considered with regards to these basic questions is
shown in Figure 5.6.The pendulum is modeled simply as a rigid solid of mass
M with an initial velocity of V. Otherwise, the car is modeled as a rigid solid
of equivalent mass M. However, the stiffness of the bumper beam is included
in the model as a spring of stiffness K. This stiffness can be identified either
experimentally or analytically. From the mechanics of materials, the stiffness
of the beam is K= 48EI/L³ when the external loads applied on its center. Here
the E is the Young’s modulus of the materials, I is the moment of inertia and
L the total length of the bumper beam.
125
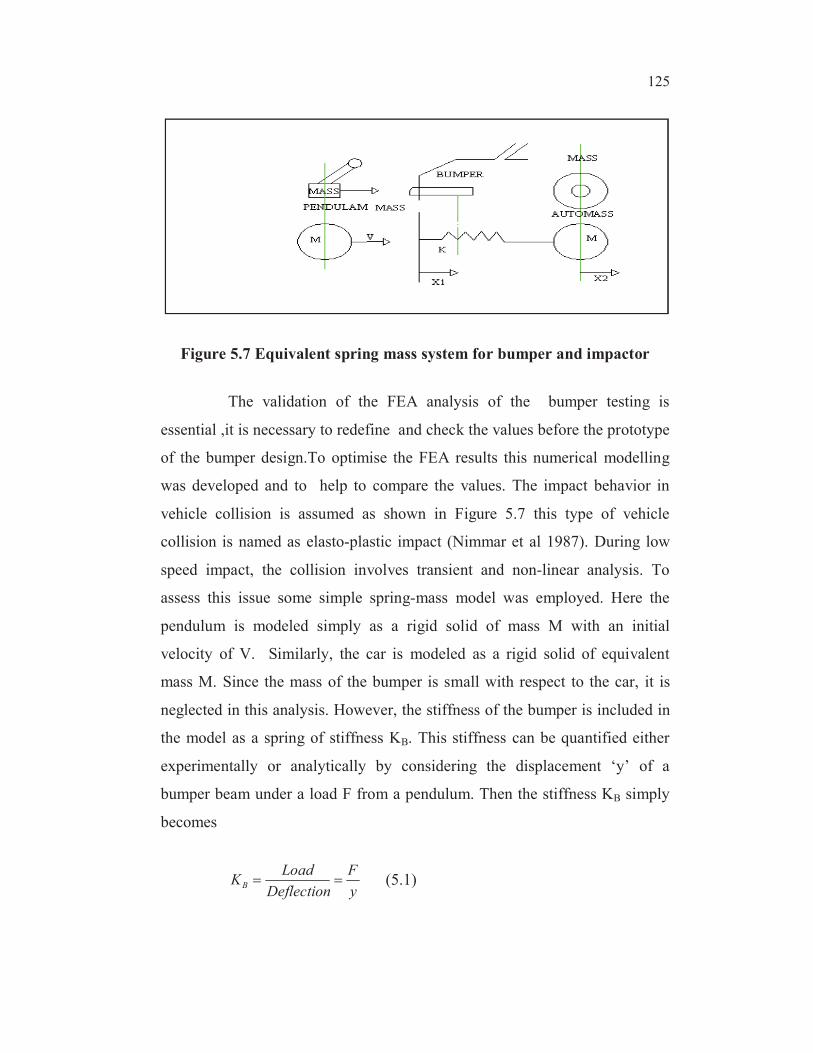
Figure 5.7 Equivalent spring mass system for bumper and impactor
The validation of the FEA analysis of the bumper testing is
essential ,it is necessary to redefine and check the values before the prototype
of the bumper design.To optimise the FEA results this numerical modelling
was developed and to help to compare the values. The impact behavior in
vehicle collision is assumed as shown in Figure 5.7 this type of vehicle
collision is named as elasto-plastic impact (Nimmar et al 1987). During low
speed impact, the collision involves transient and non-linear analysis. To
assess this issue some simple spring-mass model was employed. Here the
pendulum is modeled simply as a rigid solid of mass M with an initial
velocity of V. Similarly, the car is modeled as a rigid solid of equivalent
mass M. Since the mass of the bumper is small with respect to the car, it is
neglected in this analysis. However, the stiffness of the bumper is included in
the model as a spring of stiffness KB. This stiffness can be quantified either
experimentally or analytically by considering the displacement ‘y’ of a
bumper beam under a load F from a pendulum. Then the stiffness KB simply
becomes
y
F
Deflection
LoadKB (5.1)

126
The governing differential equations for the dynamic system
described in Figure 5.7 are
0)( 211 xxKxM B (5.2)
0)( 212 xxKxM B (5.3)
and the initial conditions are
0)0(1x (5.4)
Vx )0(1 (5.5)
0)0(2x (5.6)
0)0(2x (5.7)
Solution of this set of simultaneous linear equations leads to
tV
tV
x 2sin222
1(5.8)
tV
tV
x 2sin222
2(5.9)
where t and stands for time and angular velocity respectively,
M
KB (5.10)
A number of very important conclusions can be drawn from
Equations (5.8) and (5.9). An expression for the total force exerted by the
pendulum on the bumper for Equation (5.11) can be derived as

127
2t (5.11)
)( 21 xxKF B (5.12)
tMK
VF B 2sin2
(5.13)
2max
MKVF B (5.14)
In addition, the impact event terminates when the force goes to zero
and that “Total impact duration, S” can be expressed from Equation (5.13).
2S (5.15)
The information contained in Equations (5.14) and (5.15) is
important from a number of standpoints. The Equation (5.14) defines a
structural load in terms of the mass and velocity of the pendulum. Such loads
are necessary for the application of detailed finite element analyses.
Furthermore, the variation of this structural load can now be clearly defined
for different impact velocities and automobile masses. This is essential for the
consideration of impact response at different velocities and design for
application on automobiles of varying sizes. As the impact event takes place,
the pendulum velocity gradually decreases from V to 0 while the automobile
velocity increases.
As a result the bumper does not absorb all the kinetic energy of the
pendulum. Instead, some of the kinetic energy is transferred to kinetic energy
of the car. The “Maximum energy absorbed, U” by the bumper during the
impact can be defined as
128
2
max21 ])[(2
1xxKU B
(5.16)
22
max
4
1
2
1MV
K
FU
B
(5.17)
The principle of energy conservation in elastic impact is used; the
kinetic energy before impact is conserved and converted to elastic energy and
the kinetic energy of the impactor and the automobile at its maximum
deflection, i.e.,
2
2
2
2
2
max21
2
12
1
2
1])[(
2
1
2
1MVmVxxKmV B
(5.18)
Finally the KB is the spring constant of the beam,
3
48
L
EIKB (5.19)
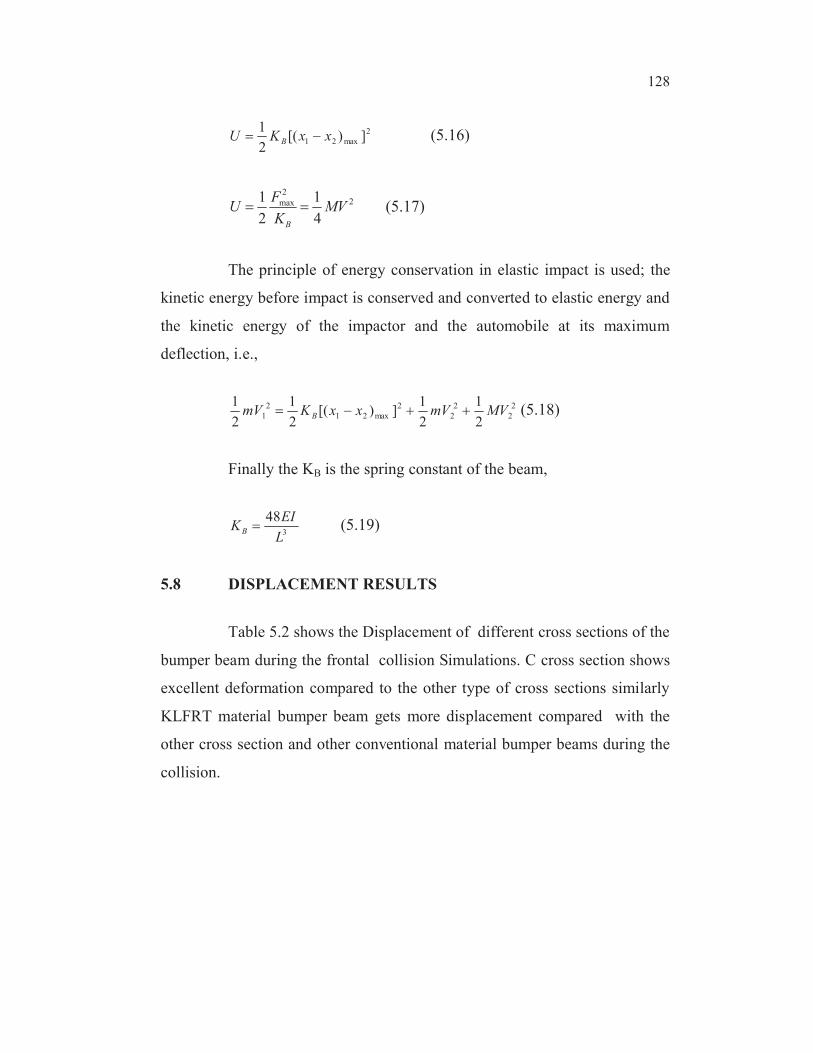
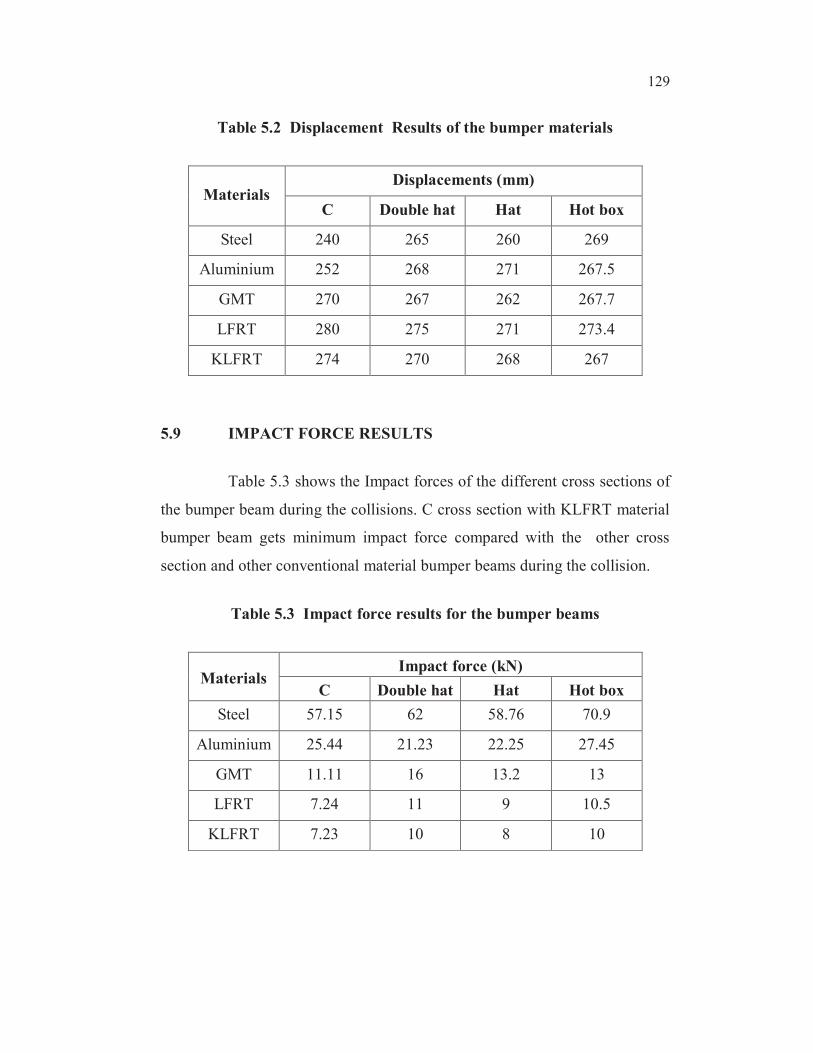
5.8 DISPLACEMENT RESULTS
Table 5.2 shows the Displacement of different cross sections of the
bumper beam during the frontal collision Simulations. C cross section shows
excellent deformation compared to the other type of cross sections similarly
KLFRT material bumper beam gets more displacement compared with the
other cross section and other conventional material bumper beams during the
collision.
129
Table 5.2 Displacement Results of the bumper materials
MaterialsDisplacements (mm)
C Double hat Hat Hot box
Steel 240 265 260 269
Aluminium 252 268 271 267.5
GMT 270 267 262 267.7
LFRT 280 275 271 273.4
KLFRT 274 270 268 267
5.9 IMPACT FORCE RESULTS
Table 5.3 shows the Impact forces of the different cross sections of
the bumper beam during the collisions. C cross section with KLFRT material
bumper beam gets minimum impact force compared with the other cross
section and other conventional material bumper beams during the collision.
Table 5.3 Impact force results for the bumper beams
MaterialsImpact force (kN)
C Double hat Hat Hot box
Steel 57.15 62 58.76 70.9
Aluminium 25.44 21.23 22.25 27.45
GMT 11.11 16 13.2 13
LFRT 7.24 11 9 10.5
KLFRT 7.23 10 8 10

130
5.10 ENERGY DISTRIBUTIONS
FEA simulations make it possible to understand how the energy has
been distributed in the system with the progress of deformation. The energy
distributions were taken from the LSDYNA by the usage of GLSTAT options
and the energy curves were analysed for bumper materials .
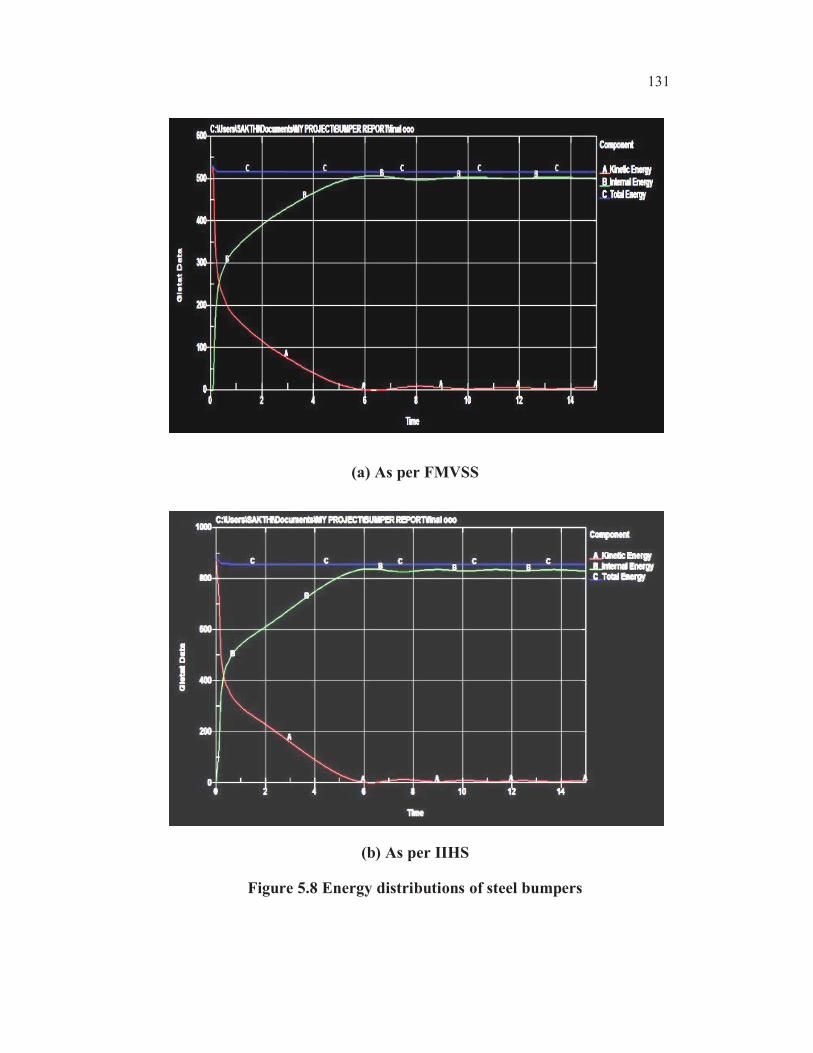
5.10.1 Steel Bumper
From the Figure 5.8(a-b) the energy distribution of the steel bumper
was analysed and conventional steel material showed good energy absorption
during collisions.
5.10.2 Aluminium Bumper
Similarly from the Figure 5.9(a-b)the energy distribution of the
aluminium was plotted.Even the light weighted aluminium bumps good and
stores more energy.
5. 10.3 LFRT Bumper
Figure 5.10 (a-b) and 5.11 (a-b) the energy absorption of the
thermoplastic bumper beams were studied and it has challenging energy
absorbing capacity equal to the conventional materials and having advantage
of the light weight compared to steel and aluminium.
131
(a) As per FMVSS
(b) As per IIHS
Figure 5.8 Energy distributions of steel bumpers

132
(a) As per FMVSS
(b) As per IIHS
Figure 5.9 Energy distributions of aluminium bumper

133
(a) As per FMVSS
(b) As per IIHS
Figure 5.10 Energy absorption of LFRT

134
5.10.4 KLFRT Bumper
Kinetic energy and linear momentum are conserved; this can be
clearly observed in above diagrams. As seen, the car begins to obtain kinetic
energy at the same time as the impactor loses it. The results revealed that for a
given amount of deformation the predicted energy absorbed by the natural
composite KLFRT was higher with the currently available material models in
LS-DYNA.
(a)FMVSS
(b)IIHS
Figure 5.11 Energy distributions of KLFRT bumper
135
Energy conservation time of Steel, Aluminium, GMT,LFRT and
KLFRT material according to the FMVS standard and also according to the
IIHS Standard are shown
in Figures 5.8 (a-b) to 5.11(a-b). From these graphs it was found that KLFRT
bumper had more kinetic energy from impactor transfer to the bumper within a
short time compare to other material bumper beam.
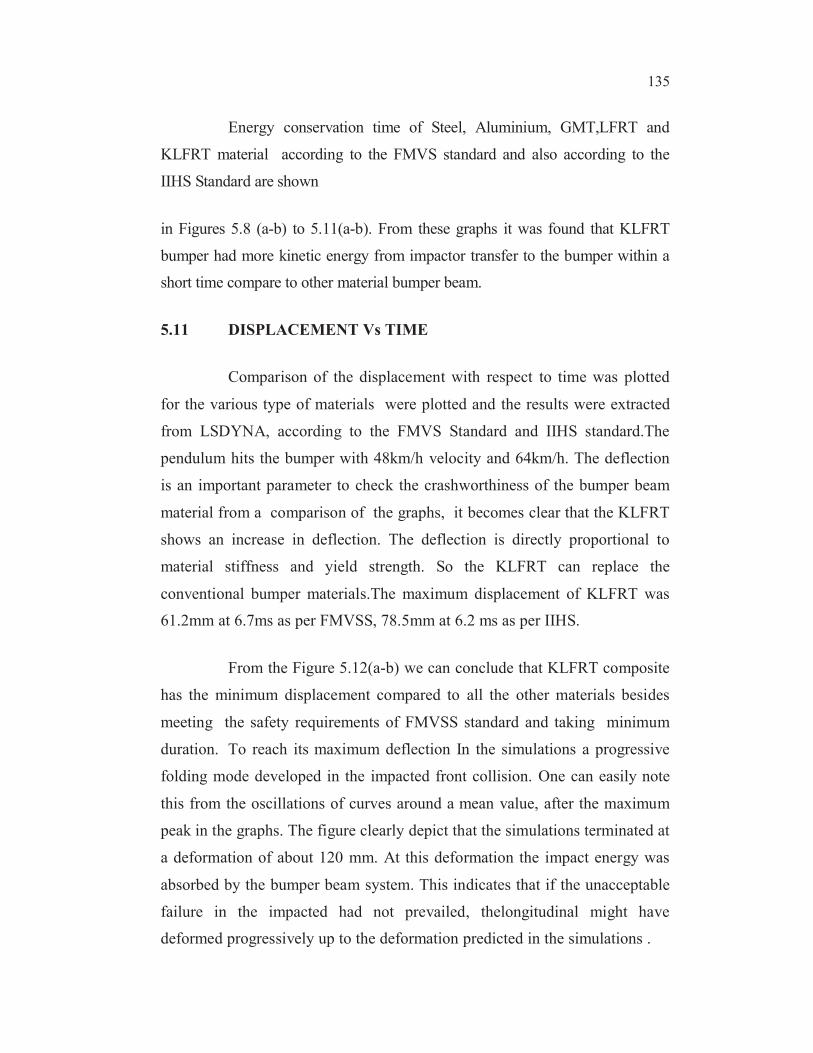
5.11 DISPLACEMENT Vs TIME
Comparison of the displacement with respect to time was plotted
for the various type of materials were plotted and the results were extracted
from LSDYNA, according to the FMVS Standard and IIHS standard.The
pendulum hits the bumper with 48km/h velocity and 64km/h. The deflection
is an important parameter to check the crashworthiness of the bumper beam
material from a comparison of the graphs, it becomes clear that the KLFRT
shows an increase in deflection. The deflection is directly proportional to
material stiffness and yield strength. So the KLFRT can replace the
conventional bumper materials.The maximum displacement of KLFRT was
61.2mm at 6.7ms as per FMVSS, 78.5mm at 6.2 ms as per IIHS.
From the Figure 5.12(a-b) we can conclude that KLFRT composite
has the minimum displacement compared to all the other materials besides
meeting the safety requirements of FMVSS standard and taking minimum
duration. To reach its maximum deflection In the simulations a progressive
folding mode developed in the impacted front collision. One can easily note
this from the oscillations of curves around a mean value, after the maximum
peak in the graphs. The figure clearly depict that the simulations terminated at
a deformation of about 120 mm. At this deformation the impact energy was
absorbed by the bumper beam system. This indicates that if the unacceptable
failure in the impacted had not prevailed, thelongitudinal might have
deformed progressively up to the deformation predicted in the simulations .
136
(a) Fmvs Standard
(b) IIHS Standard
Figure 5.12 Displacement vs time

137
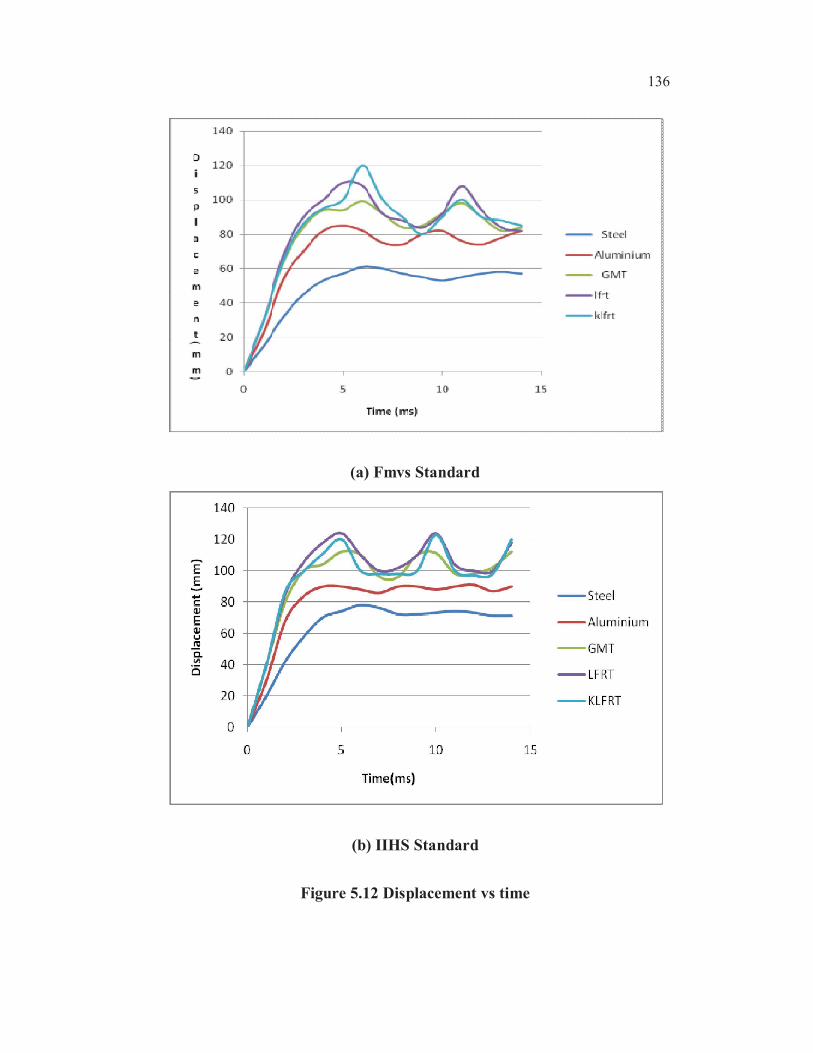
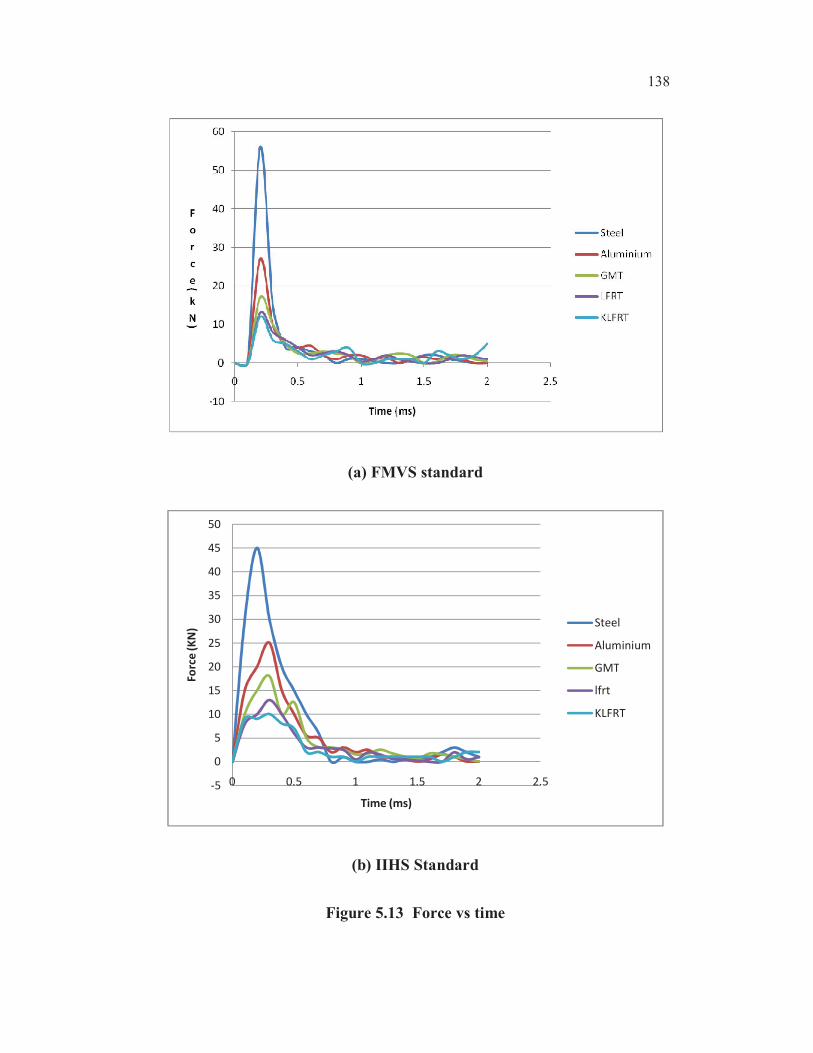
5.12 IMPACT FORCE VS TIME
The bumper beam frontal impact obtained maximum permanent
deformation when the impactor was stopped, i.e. when all the impact energy
was absorbed. In the simulations the impact energy is converted to plastic
work by bending and stretching of the bumper beam as well as crushing the
longitudinal at the impacted end and also bending of the non-impacted
longitudinal. In the initial stage of crushing, the active longitudinal members
locally squeezes and the stretch-bent bumper beam starts to flatten so that the
upper and lower flanges of the bumper beam will experience compression and
tension, respectively.
The impact analysis between the pendulum and the frontal bumper
during low speed crash involves transient and non-linear conditions which
lead to an elasto-plastic impact. During this low speed crash, the bumper
system should not have any crash or failure to prove the FMVSS.. The impact
force calculation relates to deceleration of impactor due to the after effects of
the bumper and the car. The impactor was assumed to be rigid material and
the bumper beam was made of metallic and composite material. The
distribution of the impact load is irregular along the area of collision to get the
maximum deflection.
To compare the differences among impact forces, the impactor
inertia force plays major role. From the Figure 5.12 (a-b) the impact force for
GMT, LFRT and KLFRT is notable as these have the lowest value with a
slightly longer time interval due to low rigidity of the same. Comparing with
the conventional materials the thermoplastic materials give more absorption
of impact energy which leads to the safety of the vehicle.The results shows
that natural fiber composite bumper can reduce the impact of collision with
higher performance and can successfully replace Steel, Aluminum, GMT ,
SMC and LFRT. The impact duration for the natural fiber reinforced
composite was the shortest compared to Steel, Aluminum, GMT and SMC.
138
(a) FMVS standard
(b) IIHS Standard
Figure 5.13 Force vs time
-5
0
5
10
15
20
25
30
35
40
45
50
0 0.5 1 1.5 2 2.5
Fo
rce
(KN
)
Time (ms)
Steel
Aluminium
GMT
lfrt
KLFRT
139
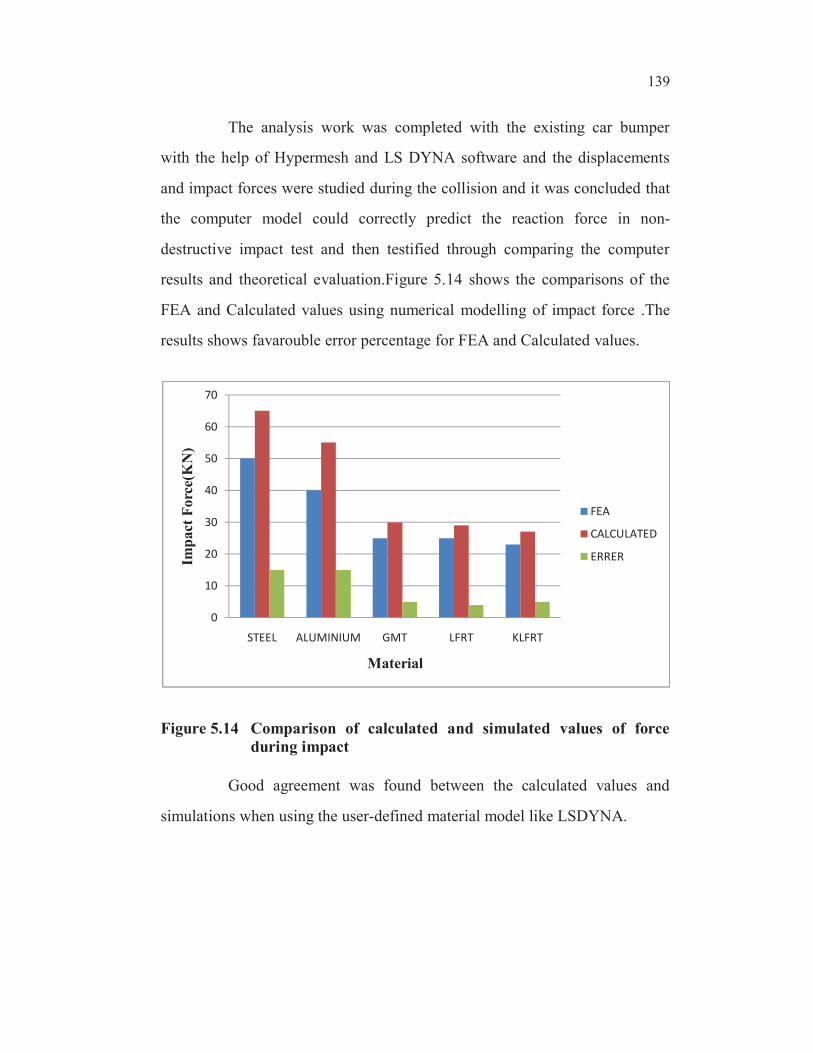
The analysis work was completed with the existing car bumper
with the help of Hypermesh and LS DYNA software and the displacements
and impact forces were studied during the collision and it was concluded that
the computer model could correctly predict the reaction force in non-
destructive impact test and then testified through comparing the computer
results and theoretical evaluation.Figure 5.14 shows the comparisons of the
FEA and Calculated values using numerical modelling of impact force .The
results shows favarouble error percentage for FEA and Calculated values.
Figure 5.14 Comparison of calculated and simulated values of force
during impact
Good agreement was found between the calculated values and
simulations when using the user-defined material model like LSDYNA.
0
10
20
30
40
50
60
70
STEEL ALUMINIUM GMT LFRT KLFRT
Imp
act
Forc
e(K
N)
Material
FEA
CALCULATED
ERRER
140
The displacements of the bumper beam were studied and it clearly
depicts that as the C section with natural fiber composite bumper beam get
more deflection during the collision compare to the other conventional
material bumper beam.The impact forces of the bumper beam were studied
and it clearly depicts that as the C section with the natural fiber composite
bumper beam get minimum force during the collision compare to the other
conventional material bumper beam.
5.13 SUMMARY
In this chapter Finite element modellingr of the bumper testing
during frontal collision was performed according to FMVSS and IIHSS
standards.Initially the bumper specification was taken from standard
passenger car bumper beam and modelled using PRO -E software. Thus the
dimensions of the bumper used in the passenger were measured and using the
PRO-E software the model of the bumper beam was designed for the different
cross sections like C,hat section,double hat section and hot box section.the
materials used for bumpers were Steel,Aluminium,GMT,LFRT and KLFRT.
The natural fiber composite were included for checking of the
crashworthiness of the material as bumper beam. The modelling and meshing
were done by using hypermesh and the analysis was done by LS
DYNA.During the testing of the frontal impact the regulations were
considered for impact pendulum testing.From the results the C section beam
shows better energy absorption and good crashworthiness compared to the
other cross sections. Similarly, the materials were optimised for displacement
and impact force for which the KLFRT reacts good as like the other bumper
material.
141
The natural fiber composites were found to have good absorption
of energy during frontal collisions and better crashworthiness equal to the
conventional bumper materials.