Chapter 5 Capital Budgeting - its.caltech.edurosentha/courses/BEM103/Readings/JWCh05.pdf · 5-2...
23
Chapter 5 Capital Budgeting Road Map Part A Introduction to finance. Part B Valuation of assets, given discount rates. • Fixed-Income securities. • Common stocks. • Real assets (capital budgeting). Part C Determination of risk-adjusted discount rates. Part D Introduction to derivatives. Main Issues • NPV Rule • Cash Flow Calculations • Alternatives to NPV Rule
-
Upload
truongnguyet -
Category
Documents
-
view
248 -
download
1
Transcript of Chapter 5 Capital Budgeting - its.caltech.edurosentha/courses/BEM103/Readings/JWCh05.pdf · 5-2...
Chapter 5
Capital Budgeting
Road Map
Part A Introduction to finance.
Part B Valuation of assets, given discount rates.
• Fixed-Income securities.
• Common stocks.
• Real assets (capital budgeting).
Part C Determination of risk-adjusted discount rates.
Part D Introduction to derivatives.
Main Issues
• NPV Rule
• Cash Flow Calculations
• Alternatives to NPV Rule

Chapter 5 Capital Budgeting 5-1
1 NPV Rule
A firm’s business involves capital investments (capital budgeting),
e.g., the acquisition of real assets. The objective is to increase
the firm’s current market value. Decision reduces to valuing real
assets, i.e., their cash flows.
Let the cash flow of an investment (a project) be
{CF 0, CF 1, · · · , CF t}.
Its current market value is
NPV = CF 0 +CF 1
1+r1+ · · · + CF t
(1+rt)t.
This is the increase in firm’s market value by the project.
Investment Criteria:
1. For a single project, take it if and only if its NPV is positive.
2. For many independent projects, take all those with positive
NPV.
3. For mutually exclusive projects, take the one with positive and
highest NPV.
Fall 2006 c©J. Wang 15.401 Lecture Notes

5-2 Capital Budgeting Chapter 5
In order to compute the NPV of a project, we need to analyze
1. Cash flows
2. Discount rates
3. Strategic options.
We focus on cash flow here and return to discount rate (Part C)
and strategic options (Part D) later.
15.401 Lecture Notes c©J. Wang Fall 2006

Chapter 5 Capital Budgeting 5-3
2 Cash Flow Calculations
Main Points:
1. Use cash flows, not accounting earnings.
2. Use after-tax cash flows.
3. Use cash flows attributable to the project (compare firm value
with and without the project):
• Use incremental cash flows.
• Forget sunk costs: bygones are bygones.
• Include investment in working capital as capital expendi-
ture.
• Include opportunity costs of using existing facilities.
Fall 2006 c©J. Wang 15.401 Lecture Notes

5-4 Capital Budgeting Chapter 5
In what follows, all cash flows are attributable to the project.
CF = [Project Cash Inflows] − [Project Cash Outflows]
= [Operating Revenues]
− [Operating Expenses without depreciation]
− [Capital Expenditures]
− [Taxes].
Defining operating profit by
Operating Profit = Operating Revenues
− Operating Expenses w/o Depreciation
Let τ denote the “effective” tax rate. The income taxes are
[Taxes] = (τ)[Operating Profit] − (τ) × [Depreciation].
Accounting depreciation affects cash flows because it reduces the
company’s tax bill.
Then
CF = (1−τ)[Operating Profits] − [Capital Expenditures]
+ (τ)[Depreciation].
15.401 Lecture Notes c©J. Wang Fall 2006
Chapter 5 Capital Budgeting 5-5
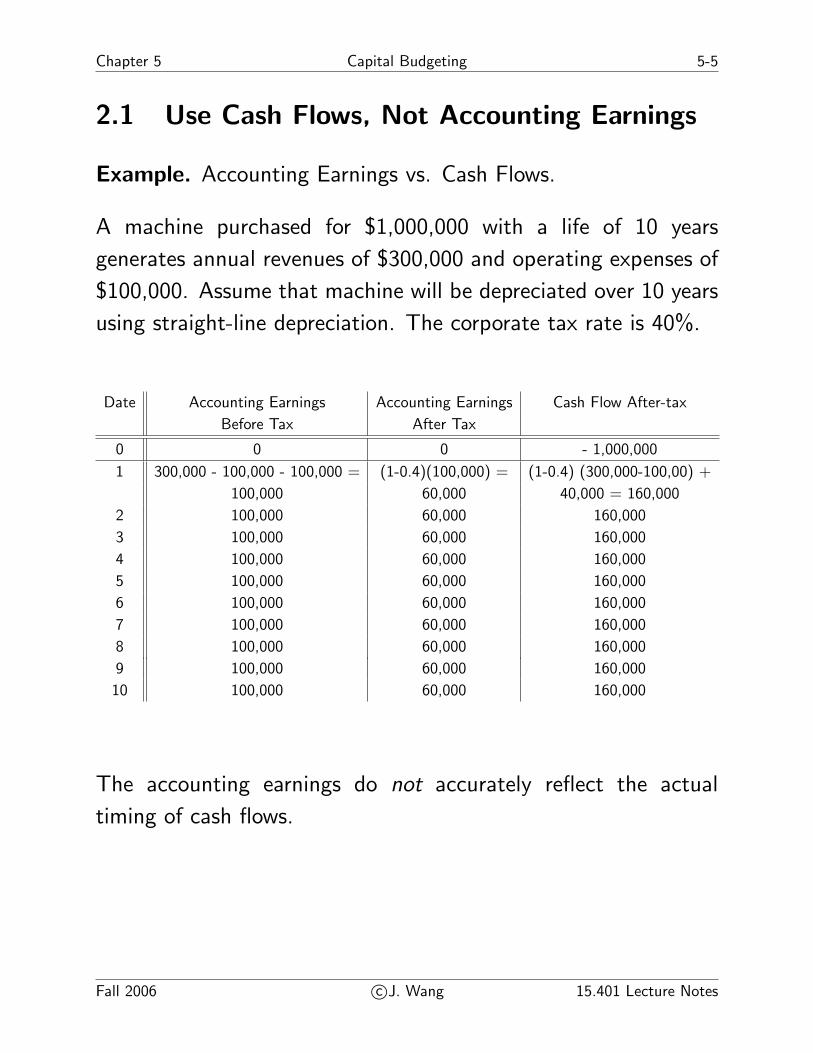
2.1 Use Cash Flows, Not Accounting Earnings
Example. Accounting Earnings vs. Cash Flows.
A machine purchased for $1,000,000 with a life of 10 years
generates annual revenues of $300,000 and operating expenses of
$100,000. Assume that machine will be depreciated over 10 years
using straight-line depreciation. The corporate tax rate is 40%.
Date Accounting Earnings Accounting Earnings Cash Flow After-tax
Before Tax After Tax
0 0 0 - 1,000,000
1 300,000 - 100,000 - 100,000 = (1-0.4)(100,000) = (1-0.4) (300,000-100,00) +
100,000 60,000 40,000 = 160,000
2 100,000 60,000 160,000
3 100,000 60,000 160,000
4 100,000 60,000 160,000
5 100,000 60,000 160,000
6 100,000 60,000 160,000
7 100,000 60,000 160,000
8 100,000 60,000 160,000
9 100,000 60,000 160,000
10 100,000 60,000 160,000
The accounting earnings do not accurately reflect the actual
timing of cash flows.
Fall 2006 c©J. Wang 15.401 Lecture Notes

5-6 Capital Budgeting Chapter 5
2.2 Use After-tax Cash Flows
Example. Consider the following project (the cash flow is in
thousands of dollars and tax rate is 50%):
Year 0 1 2 3 4 5
Invest 500
Operating CF 0 100 300 300 300
Depreciation 100 100 100 100 100
Income -100 0 200 200 200
Tax -50 0 100 100 100
After-tax CF -500 50 100 200 200 200
PV at 10% -500 45.45 82.64 150.26 136.60 124.18
NPV = +39.13.
15.401 Lecture Notes c©J. Wang Fall 2006

Chapter 5 Capital Budgeting 5-7
2.3 Investment In WC Is A Capital Expenditure
Typically, there are timing differences between the accounting
measure of earnings (Sales - Cost of Goods Sold) and cash flows.
Working Capital (WC) = Inventory + A/R − A/P.
Changes in Working Capital
• Inventory: Cost of goods sold includes only the cost of items
sold. When inventory is rising, the cost of goods sold under-
states cash outflows. When inventory is falling, cost of goods
sold overstates cash outflows.
• Accounts Receivable (A/R): Accounting sales may reflect sales
that have not been paid for. Accounting sales understate cash
inflows if the company is receiving payment for sales in past
periods.
• Accounts Payable (A/P) – conceptually the reverse of A/R.
Fall 2006 c©J. Wang 15.401 Lecture Notes
5-8 Capital Budgeting Chapter 5
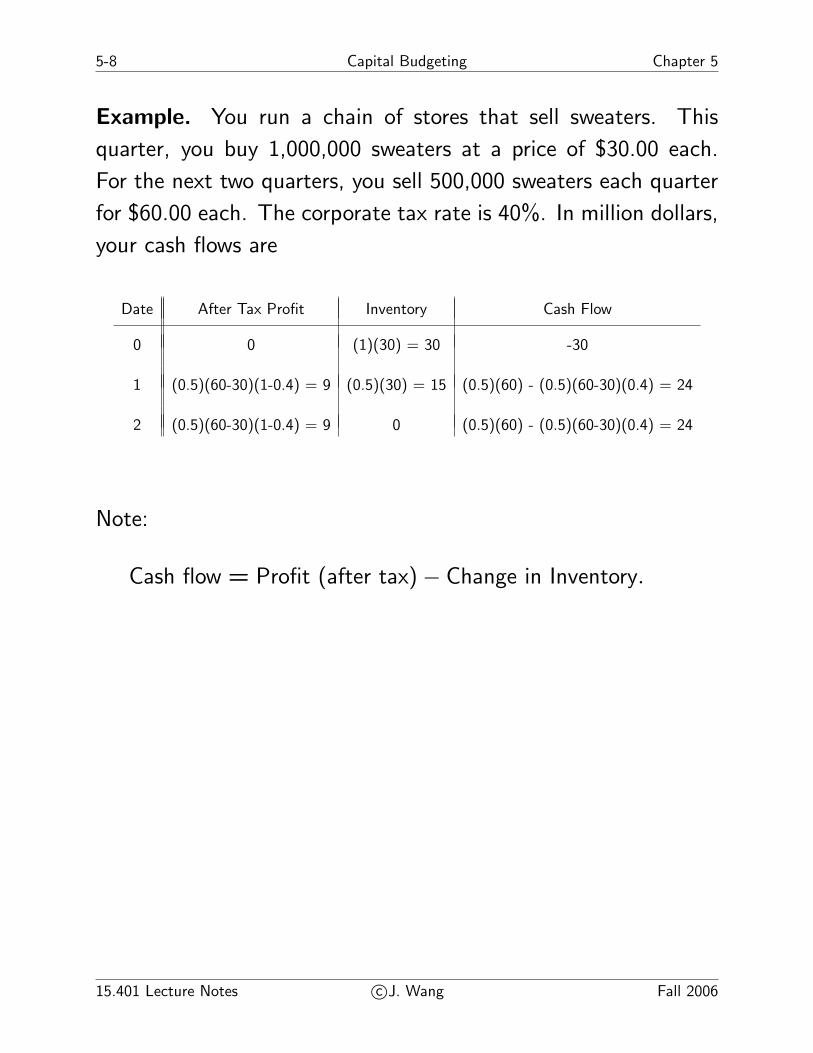
Example. You run a chain of stores that sell sweaters. This
quarter, you buy 1,000,000 sweaters at a price of $30.00 each.
For the next two quarters, you sell 500,000 sweaters each quarter
for $60.00 each. The corporate tax rate is 40%. In million dollars,
your cash flows are
Date After Tax Profit Inventory Cash Flow
0 0 (1)(30) = 30 -30
1 (0.5)(60-30)(1-0.4) = 9 (0.5)(30) = 15 (0.5)(60) - (0.5)(60-30)(0.4) = 24
2 (0.5)(60-30)(1-0.4) = 9 0 (0.5)(60) - (0.5)(60-30)(0.4) = 24
Note:
Cash flow = Profit (after tax) − Change in Inventory.
15.401 Lecture Notes c©J. Wang Fall 2006

Chapter 5 Capital Budgeting 5-9
2.4 Use Market Valuation
Example. Reopen King Solomon’s mine:
• Initial investment $39.2 M
• Capacity 0.1 million oz for a life of 1year
• Production cost $200 per oz
• Current gold price P0 = $400 per oz
• Forecasted gold price growth 5% by bearish manager
• Discount rate 10%.
NPV using the forecast:
NPV = −39.2 +(0.1)(420)
1.10= −$1million.
However, gold pays no dividend. Thus, P0 = PV (P1) and
NPV = −Investment + PV (Payoff))
= −39.2 + PV (0.1 × P1)
= −39.2 + 40 = +$0.8million.
Use today’s gold price.
Fall 2006 c©J. Wang 15.401 Lecture Notes

5-10 Capital Budgeting Chapter 5
Example (Gromb). MSW Inc. is considering the introduction of
a new product: Turbo-Widgets (TW).
• TW were developed at an R&D cost of $1M over past 3 years
• New machine to produce TW would cost $2M
• New machine lasts for 15 years, with salvage value of $50,000
• New machine can be depreciated linearly to $0 over 10 years
• TW need to be painted; this can be done using excess capacity
of the painting machine, which currently runs at a cost of
$30,000 (regardless of how much it is used)
• Operating cost: $40,000 per year
• Sales: $400,000, but cannibalization would lead existing sales
of regular widgets to decrease by $20,000
• Working Capital (WC): $250,000 needed over the life of the
project
• Tax rate: 34%
• Opportunity cost of capital: 10%.
Question: What is the project’s NPV (i.e., should MSW go ahead
with the production of TW)?
15.401 Lecture Notes c©J. Wang Fall 2006

Chapter 5 Capital Budgeting 5-11
1. Initial investment includes capital expenditure and WC
2. R&D expense is a sunk cost
3. Depreciation is $2M/10 = $0.2M for first 10 years
4. Project should not be charged for painting-machine time
5. Project should be charged for cannibalization of regular widget
sales
6. Salvage value is fully taxable since the book value at the end
of year 10 is $0 (the machine cost has been fully depreciated).
The cash flows (in thousand dollars) are
Year Cash Flow
0 - (2000+250) = -2250
1-10 (400-40-20)(1-0.34) + (200)(0.34) = 292.4
11-14 (400-40-20)(1-0.34) = 224.4
15 224.4 + (50)(1-0.34) + 250 = 507.4
NPV = −$57,617.
Fall 2006 c©J. Wang 15.401 Lecture Notes

5-12 Capital Budgeting Chapter 5
3 Project Interaction
• Often we have to decide on more than one project.
• For mutually independent projects, we just apply the NPV rule
to each one of them.
• For projects dependent of each other (e.g., mutually exclusive—
accepting one rules out the others), we have to compare their
NPVs.
Example. Potential demand for your product is projected to
increase over time. If you start the project early, your competitors
will catch up with you faster, by copying your idea. Your
opportunity cost of capital is 10%. Denoting by FPV the project’s
NPV at the time of introduction, we have:
Year to Start FPV % Change in FPV NPV
1 100 – 91
2 120 20 99
3 138 15 104
4 149 8 102
Before year 4, the return to waiting is larger that the opportunity
cost of capital, 10%. As long as the growth rate of FPV remains
below 10% after year 4, it is best to wait and introduce at the
end of year 3.
15.401 Lecture Notes c©J. Wang Fall 2006

Chapter 5 Capital Budgeting 5-13
4 Alternatives to NPV
In practice, investment rules other than NPV are also used:
• Payback Period
• Profitability Index (PI)
• Internal Rate of Return (IRR)
Firms use these rules because they were used historically and they
may have worked (in combination with common sense) in the
particular cases encountered by these firms.
These rules sometimes give the same answer as NPV, but in
general they do not. We should be aware of their shortcomings
and use NPV whenever possible.
The bottom line is:
The NPV rule dominates these alternative rules.
Fall 2006 c©J. Wang 15.401 Lecture Notes

5-14 Capital Budgeting Chapter 5
4.1 Payback Period
Definition: Payback period is the minimum s so that
CF 1 + CF 2 + · · · + CF s ≥ −CF 0 = I0
In words, s is the minimum length of time such that the sum of
cash flows from a project is positive.
Decision Criterion Using Payback Period
• For independent projects: Accept if s is less than or equal to
some fixed threshold t∗.
• For mutually exclusive projects: Among all the projects having
s ≤ t∗, accept the one that has the minimum payback period.
Example. Let t∗ = 3. Consider the two independent projects
with the following cash flows (in thousands):
CF0 CF1 CF2 CF3 CF4 CF5 CF6 t∗Project 1 -100 20 40 30 10 40 60 4
Project 2 -100 10 10 80 5 10 10 3
Decision: Accept Project 2.
15.401 Lecture Notes c©J. Wang Fall 2006

Chapter 5 Capital Budgeting 5-15
Problems with Payback Period
• It ignores cash flows after the payback period.
• It ignores discounting.
Example. (Continued.) Suppose that the appropriate discount
rate is a constant 10% per period. Then
NPV 1 = 39,315 and NPV 2 = −7,270.
But we accepted project 2 and not project 1!
Discounted Payback Period
Taking into account appropriate discounting, we have the dis-
counted payback period:
Definition: Discounted payback period is the minimum t∗ so that
CF 1
1 + r+
CF 2
(1 + r)2+ · · · + CF t∗
(1 + r)t∗ ≥ −CF 0
where r is the discount rate.
Problem: It still ignores the cash flows after the discounted
payback period.
Fall 2006 c©J. Wang 15.401 Lecture Notes

5-16 Capital Budgeting Chapter 5
4.2 Internal Rate of Return (IRR)
IRR is the number that satisfies
0 = CF 0 +CF 1
(1 + IRR)+
CF 2
(1 + IRR)2+ · · · CF t
(1 + IRR)t.
Decision Criterion Using IRR
• For independent projects: Accept a project if its IRR is greater
than some fixed IRR∗, the threshold rate.
• For mutually exclusive projects: Among the projects having
IRR’s greater than IRR∗, accept one with the highest IRR.
Example Consider the following mutually exclusive projects:
CF0 CF1 CF2 CF3 CF4 CF5 CF6Project 1 -100 20 40 30 10 40 60
Project 2 -100 10 10 80 5 10 10
Then, IRR1 = 21% and IRR2 = 7%.
IRR rule leads to the same decisions as NPV if
1. Cash outflow occurs only at time 0
2. Only one project is under consideration
3. Opportunity cost of capital is the same for all periods
4. Threshold rate is set equal to opportunity cost of capital.
15.401 Lecture Notes c©J. Wang Fall 2006

Chapter 5 Capital Budgeting 5-17
Problems with IRR
1. Non-existence of IRR
CF0 CF1 CF2Project 1 -105 250 -150
Project 2 105 -250 150
No IRR exists for these two projects.
2. Multiple IRR’sCF0 CF1 CF2 CF3
Project 1 -500,000 1,575,000 -1,653,750 578,815
Project 2 -500,000 1,605,000 -1,716,900 612,040
IRR1 = 7% and IRR2 =
⎧⎪⎨⎪⎩
4%
7%
10%
-80
-60
-40
-20
0
20
40
0 0.02 0.04 0.06 0.08 0.1
Discount rate
NPV
NPV of Project 1 NPV of Project 2
Fall 2006 c©J. Wang 15.401 Lecture Notes

5-18 Capital Budgeting Chapter 5
3. Project ranking using IRR for mutually exclusive projects:
(a) Projects of different scales:
CF0 CF1 IRR NPV at 10%
Project 1 -10,000 20,000 100% 8,181.82
Project 2 -20,000 36,000 80% 12,727.27
A way around this problem is to use incremental CF:
• See if lower investment (project 1) is a good idea
• See if incremental investment (project 2) is a good idea.
CF0 CF1 IRR NPV at 10%
Project 1 -10,000 20,000 100% 8,181.82
Project 2 -20,000 36,000 80% 12,727.27
Project 2-1 -10,000 16,000 60% 4,545.45
(b) Projects with different time patterns of cash flows:
CFt 0 1 2 3 4 5 ETC IRR NPV at 10%
Project 1 -90 60 50 40 0 0 · · · 33.0% 35.92
Project 2 -90 18 18 18 18 18 · · · 20.0% 90.00
Project 2-1 0 -42 -32 -22 18 18 · · · 15.6% 54.08
15.401 Lecture Notes c©J. Wang Fall 2006

Chapter 5 Capital Budgeting 5-19
4.3 Profitability Index
Definition: Profitability Index (PI) is the ratio of the present value
of future cash flows and the initial cost of a project:
PI =PV
−CF 0=
PV
I0.
Decision Criterion Using PI
• For independent projects: Accept all projects with PI greater
than one (this is identical to the NPV rule)
• For mutually exclusive projects: Among the projects with PI
greater than one, accept the one with the highest PI.
Problems with PI
PI gives the same answer as NPV when
(1) There is only one cash outflow, which is at time 0
(2) Only one project is under consideration.
PI scales projects by their initial investments. The scaling can
lead to wrong answers in comparing mutually exclusive projects.
CF0 CF1 IRR NPV at 10% PI at 10%
Project 1 -1,000 2,000 100% 818.18 1.82
Project 2 -2,000 3,600 80% 1,272.73 1.64
Project 2-1 -1,000 1,600 60% 454.55 1.45
Fall 2006 c©J. Wang 15.401 Lecture Notes

5-20 Capital Budgeting Chapter 5
4.4 The Practice of Capital Budgeting
Comparison of Methods Used by Large U.S. and Multinational Firms
Large U.S. Firms MultinationalsPercentage Using
Each MethodUse as
Primary MethodUse as
Secondary Method
Payback Period 80.3% 5.0% 37.6%
IRR 65.5 65.3 14.6
NPV 67.6 16.5 30.0
Other - 2.5 3.2
Historical Comparison of Primary use ofVarious Capital Budgeting Techniques
1959 1964 1970 1975 1977 1979 1981
Payback Period 34% 24% 12% 15% 9% 10% 5.0%
IRR 19 38 57 37 54 60 65.3
NPV - - - 26 10 14 16.5
IRR or NPV 19 38 57 63 64 74 81.8
Source: S. Ross, R. Westerfield, and B. Jordon, Essentials of Corporate Finance, Irwin,
1996.)
15.401 Lecture Notes c©J. Wang Fall 2006

Chapter 5 Capital Budgeting 5-21
5 Other Issues in Capital Budgeting
1. Competitive Response:
• CF forecasts should consider responses of competitors.
2. Capital Rationing.
3. Sources of Positive-NPV Projects:
• Short-run competitive advantage (right place at right time)
• Long-run competitive advantage
- patent
- technology
- economies of scale, etc.
• Noise.
Fall 2006 c©J. Wang 15.401 Lecture Notes

5-22 Capital Budgeting Chapter 5
6 Homework
Readings:
• BMA Chapters 5, 6, 10, 11.
Assignment:
• Case write-up on capital budgeting: Acid Rain.
15.401 Lecture Notes c©J. Wang Fall 2006