Chapter 5 A Comparative Study on the Optical Limiting...
14
Chapter 5 A Comparative Study on the Optical Limiting Properties of different Nano Spinel Ferrites using Z-scan Technique This chapter describes the investigations on the optical limiting properties of five different spinel ferrites, NiFe2O4, Ni0.5Zn0.5Fe2O4, ZnFe2O4, Ni0.5Co0.5Fe2O4 and CoFe2O4, with an average particle size of 9 nm. The optical limiting properties were investigated using the open aperture Z-scan technique. The obtained nonlinearity fits to a two-photon like absorption process. Except for NiFe2O4, the observed nonlinearity has contributions from excited state absorption. The optical limiting response is also studied against particle size and the nonlinearity is found to increase with increasing particle size, within the range of our investigations. On comparing the optical limiting properties, ZnFe2O4 is found to be a better candidate for the optical limiting applications.
Transcript of Chapter 5 A Comparative Study on the Optical Limiting...

Chapter 5
A Comparative Study on the
Optical Limiting Properties of
different Nano Spinel Ferrites
using Z-scan Technique
This chapter describes the investigations on the optical limiting properties of
five different spinel ferrites, NiFe2O4, Ni0.5Zn0.5Fe2O4, ZnFe2O4,
Ni0.5Co0.5Fe2O4 and CoFe2O4, with an average particle size of 9 nm. The
optical limiting properties were investigated using the open aperture Z-scan
technique. The obtained nonlinearity fits to a two-photon like absorption
process. Except for NiFe2O4, the observed nonlinearity has contributions
from excited state absorption. The optical limiting response is also studied
against particle size and the nonlinearity is found to increase with
increasing particle size, within the range of our investigations. On
comparing the optical limiting properties, ZnFe2O4 is found to be a better
candidate for the optical limiting applications.

136
5.1 Introduction
Advances in the development of new communication methods
and new sources of radiation, particularly optical power sources, such
as lasers had resulted in research oriented towards the protection
from exposure to such sources [1]. An ideal optical limiter should be
transparent to low energy laser pulses and opaque at high energies,
so that it can protect human eyes and optical sensors from intense
laser radiation. Over the years, various materials, such as inorganics,
organics, organometallics and semiconductors have been studied for
their optical limiting performances [2-4].
Recently, nanomaterials have drawn significant attention as
optical limiters [5]. Optical power limiting is operated through the
nonlinear optical processes of nanomaterials. However, the great
potentials of nanomaterials as optical power limiters have just begun
to be recognized.
Control of the nonlinear properties by means of an external
stimulus, such as magnetic field presents remarkable applications.
Huang et al. have theoretically evaluated the tunability of nonlinear
optical properties by an external magnetic field [6]. Several magnetic
materials are reported to have good nonlinear optical absorption
characteristics [7-9].
The ferrite nanoparticles have been a subject of much interest,
because of their unusual optical [13, 14], electrical [15, 16] and
magnetic properties [17, 18], which often differ from the bulk. The
optical limiting properties of NiFe2O4 nanoparticles have been
reported [19]. However, optical limiting properties of other spinel
ferrite nanoparticles are not studied yet. In this paper, we report the
optical nonlinearity of five different spinel ferrite nanosystems,

137 Nonlinear Optical Study
NiFe2O4, Ni0.5Zn0.5Fe2O4, ZnFe2O4, Ni0.5Co0.5Fe2O4 and CoFe2O4, upon
illumination of nanosecond laser pulses at 532 nm. These systems
have a very high shelf life and remarkable thermal stability, which are
important requirements for sustainable use with intense lasers. In
fact, it is the physical and chemical stability of ferrites, which is an
important attribute for an optical limiter, which prompted us to
investigate their optical limiting properties. To the best of our
knowledge, this is the first report, where the optical limiting
properties of spinel ferrites are compared.
5.2 Experimental
Nano spinel ferrites with five different compositions, NiFe2O4,
Ni0.5Zn0.5Fe2O4, ZnFe2O4, Ni0.5Co0.5Fe2O4 and CoFe2O4, with an average
particle size of 9 nm were synthesized by the sol-gel method, as
described in previous chapters. In addition, NiFe2O4 nanosystems of
two different particle sizes were synthesized by changing the PVA to
total metal ions ratio to 2 and 1 (named as NFO2 and NFO1
respectively). The particle size obtained for these samples are 20 nm
and 25 nm respectively. The UV–Vis absorption spectra of the samples
were recorded using spectrophotometer (Shimadzu UV-1800) at room
temperature.
Open aperture Z-scan [20] experiment was used to measure the
nonlinear transmission of the powder samples suspended in ethylene
glycol. Here, a laser beam is used for sample excitation and its
propagation direction is considered as the Z-axis. The beam is
focused using a convex lens and the focal point is taken as Z = 0. The
beam has maximum energy density at the focus, which will
symmetrically reduce towards either side of it on the Z-axis. In the
experiment, the sample is scanned along the Z-axis and the

138
corresponding transmissions are measured. The position-
transmission curve thus obtained is the open aperture Z-scan curve.
From this curve, the nonlinear absorption coefficient of the sample
can be calculated.
The intensity dependent linear absorption coefficient, α(I) can
be written in terms of linear absorption coefficient, α and two photon
absorption coefficient, β as
( )I Iα α β= + (5.1)
The irradiance at the exit surface of the sample can be written as
0( , , )( , , )
1 ( , , )
l
r
I z r tz r t
q z r teI
α−
=+
(5.2)
where ( , , ) ( , , )effeff
q z r t I z r t Lβ= (5.3)
effL is the effective length and is given in terms of sample length, l
and α0 by the relation
1l
eff
eLα
α
−
−= (5.4)
The total power transmitted, P(z,t) is obtained by integrating
equation (5.2) over z and r and is given by
0
1
0
ln 1 ( , )( , ) ( )
( , )
lz t
P z t tz t
qeP q
α−
+
= (5.5)
P1( t)and q0(z, t) are given by the equations 2
0 0
1
( )( )
2
effI t LtP
πω= (5.6)
0
0
2
0
( )( , )
1
eff effI t Lq z t
zz
β=
+
(5.7)

139 Nonlinear Optical Study
For a pulse of Gaussian temporal profile, equation (5.5) can be
integrated to give the transmission as
( )2
0
0
( ) ln 1 tCT z q e dt
q π
+∞
−
−∞
= +∫
(5.8)
For 0 1q < this transmittance can be expressed in terms of peak
irradiance in a summation form as,
[ ]
( )
0
320
( ,0)( , 1)
1
m
m
q zT z S
m
∞
=
−= =
+∑
(5.9)
The nonlinear absorption coefficient of the sample is obtained by
fitting the experimental data to equation (5.8).
Since the sample sees different laser intensities at each position,
this position dependent transmission can be easily scaled to its
intensity dependent transmission. For instance, for an incident
Gaussian beam of wavelength λ, the beam radius at position z is
given by ( ) ( ) ( )1/2
2
0 0 1 /z z zω ω = +
where ω(0) is the focal spot
radius and z0 is the Rayleigh range given by ( )( )2
0 /π ω λ . Therefore,
knowing the energy of laser pulse, the input laser fluence and
intensity can be calculated for each z value. Our automated z-scan
setup used a precision stepper motor controlled translation stage to
move the sample along the z- direction. The sample taken in a 1 mm
cuvette was translated along the beam axis through the focal region
over a distance much longer than the Rayleigh range. The sample
suspensions were prepared such that all of them had the same linear
transmittance of 52% at 532 nm. Of the two pyroelectric energy
probes (Rj7620, Laser Probe Inc.) used, one monitored the input
energy, while the other monitored the transmitted energy through the
sample. The frequency-doubled output (532 nm) of a Q-switched

140
Nd:YAG laser (Minilite, Continuum Inc.) was used for exciting the
samples. The temporal pulse width of the laser pulses was 5 ns
(FWHM). The laser pulse energy used for the experiments was 100
μJ. The pulses were fired in the “single shot” mode, allowing
sufficient time between successive pulses to avoid accumulative
thermal effects in the sample.
5.3 Results and Discussions
5.3.1 Optical Absorption Study
The optical absorption spectra of the samples are shown in Figure
5.1. A well developed maximum in the spectrum of NiFe2O4 at 745 nm
is probably caused by 3A2g to 3T1g(F) transition of Ni2+ octahedrally
coordinated by O2-ions [21, 22].
Figure 5.1. Optical absorption spectra of (a) NiFe2O4, (b) ZnFe2O4, (c)
Ni0.5Zn0.5Fe2O4, (d) Ni0.5Co0.5Fe2O4 and (e) CoFe2O4.
The band gap, Eg was determined from the expression for the
absorption coefficient near the band edge, given by the equation,
( )gnh A h Eα ν ν= − where hν is the photon energy, A is a constant and
α is the linear absorption coefficient [23]. Exponent, n depends on the

141 Nonlinear Optical Study
type of transition and n = ½ or 3/2 for direct allowed and direct
forbidden transitions, while n = 2 or 3 for indirect allowed and
indirect forbidden transitions. For all the samples, the best fit of 1
( ) nhα ν versus hν was obtained for n = ½. Thus, the Eg values are
determined by extrapolating the linear portion of the (αhν)2 versus hν
plot to the point α = 0 and are given in Table 5.1.
Table 5.1. Band gap energy of spinel ferrites calculated from Tauc plot.
Sample Band gap (eV)
NiFe2O4 2.54
ZnFe2O4 1.94
Ni0.5Zn0.5Fe2O4 1.45
Ni0.5Co0.5Fe2O4 1.06
CoFe2O4 1.18
5.3.2 Nonlinear Absorption Study
Figure 5.2 shows the optical limiting curves obtained for the
samples Ni0.5Zn0.5Fe2O4, Ni0.5Co0.5Fe2O4 and CoFe2O4. Figure 5.3 is
similar figures for ZnFe2O4 nanoparticles at different input laser
energy. The curves for NiFe2O4 samples of three different particle
sizes are shown in Figure.5.4. The Z-scan curves obtained for all these
samples are numerically fitted to the nonlinear transmission equation
for a TPA process [24] given by equation (5.8).
The obtained values of the nonlinear absorption coefficient (β) are
presented in Table 5.2. From the absorption spectra, it is obvious that
all the samples show some absorption at 532 nm (Figure. 5.1),
complementing the linear transmission of 52% of the samples.
Therefore, the β values given in Table 5.2 should be considered as
effective values. To put the obtained values in perspective, previous
measurements using the same excitation wavelength and laser pulse

142
width have given the two photon absorption coefficient values of
1.9×10⁻⁹ m/W for CdS quantum dots [25], 1.5×10⁻¹⁰ m/W for Ag2Te
nanowires [26], 3.28×10⁻¹¹ m/W for C60 [27] and 2×10-12 m/W for Cu
nanocomposite glass [28]. Thus, spinel ferrites could be a potential
candidate for optical limiting applications.
Figure 5.2. Nonlinear absorption in samples (a) CoFe2O4, (b) Ni0.5Co0.5Fe2O4
and (c) Ni0.5Zn0.5Fe2O4. Insets show the corresponding open aperture Z-scan
curves. Circles are data points and solid lines are numerical fits using
equation (5.8).

143 Nonlinear Optical Study
Figure 5.3. Nonlinear absorption in ZnFe2O4 sample for input laser energies
of (a) 40 μJ, (b) 60 μJ, (c) 80 μJ and (d) 100 μJ. Insets show the
corresponding open aperture Z-scan curves. Circles are data points and solid
lines are numerical fits using equation (5.8).
In the present case, both the excitation photon energy (2.33 eV)
and the bandgap of ferrites fulfill the one-photon absorption
requirement ( )gh Eν > except for NiFe2O4. TPA process takes place,
when the laser energy is larger than half of the band gap of the
material2
gEhν
>
. Hence, it is very likely that excited state
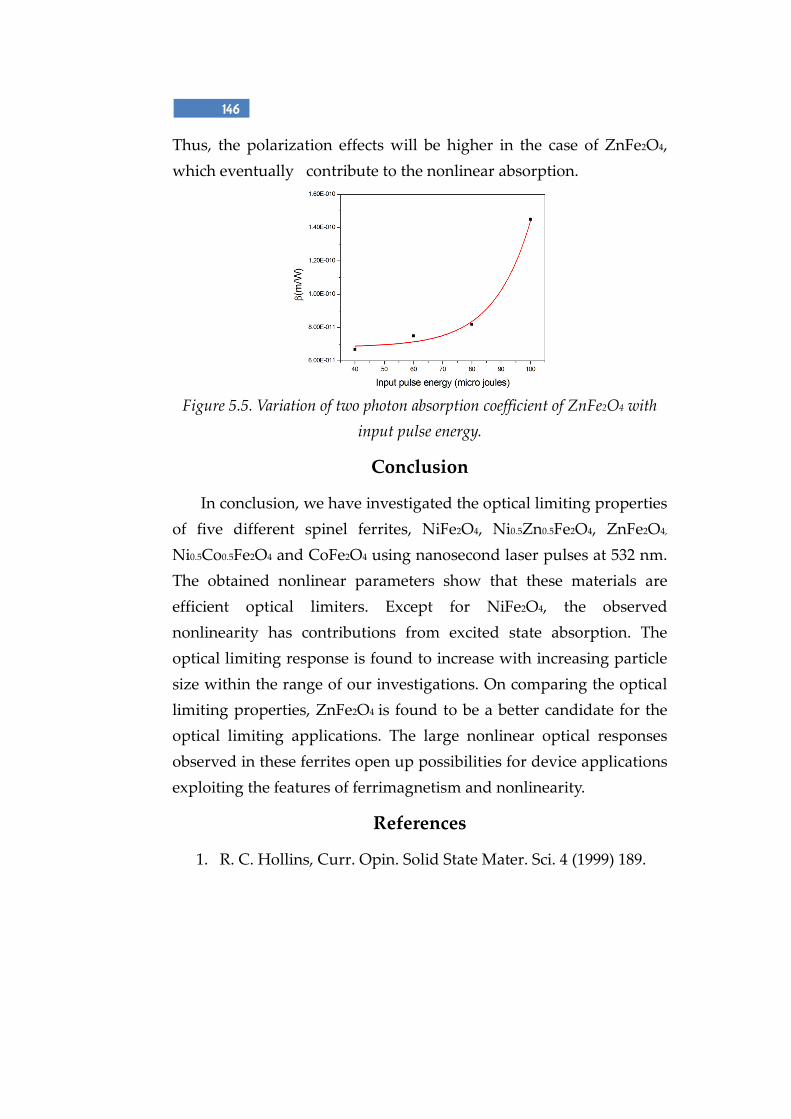
absorption is acting in the present case. For a detailed understanding
of the contributions from excited state absorption, we have performed
the Z-scan measurements at different pulse energies for ZnFe2O4
(Figure 5.3). The β values thus obtained are plotted against laser pulse
energies (Figure 5.5). It is noted that the β value is increasing

144
substantially, as the input laser pulse energy increases beyond 80 μJ.
Thus at higher energies, β becomes a nonlinear function of pulse
energy indicating the occurrence of higher order nonlinear processes
such as free-carrier absorption.
Figure 5.4. Nonlinear absorption in NiFe2O4 samples of three different
particle sizes (a) 25 nm, (b) 20 nm and (c) 9 nm. Insets show the
corresponding open aperture Z-scan curves. Circles are data points and solid
lines are numerical fits using equation (5.8).
In order to determine the effect of particle size on the optical
limiting response of the spinel ferrites, the Z-scan measurements were
performed on NiFe2O4 samples of three different particle sizes (Figure
5.4). The β values thus obtained are shown in Table 5.2 and are found
to be size-dependent. A similar size-dependent enhancement of
nonlinear optical properties has been observed in CuCl nanocrystals
[29] and ZnO nanocolloids [30].
145 Nonlinear Optical Study
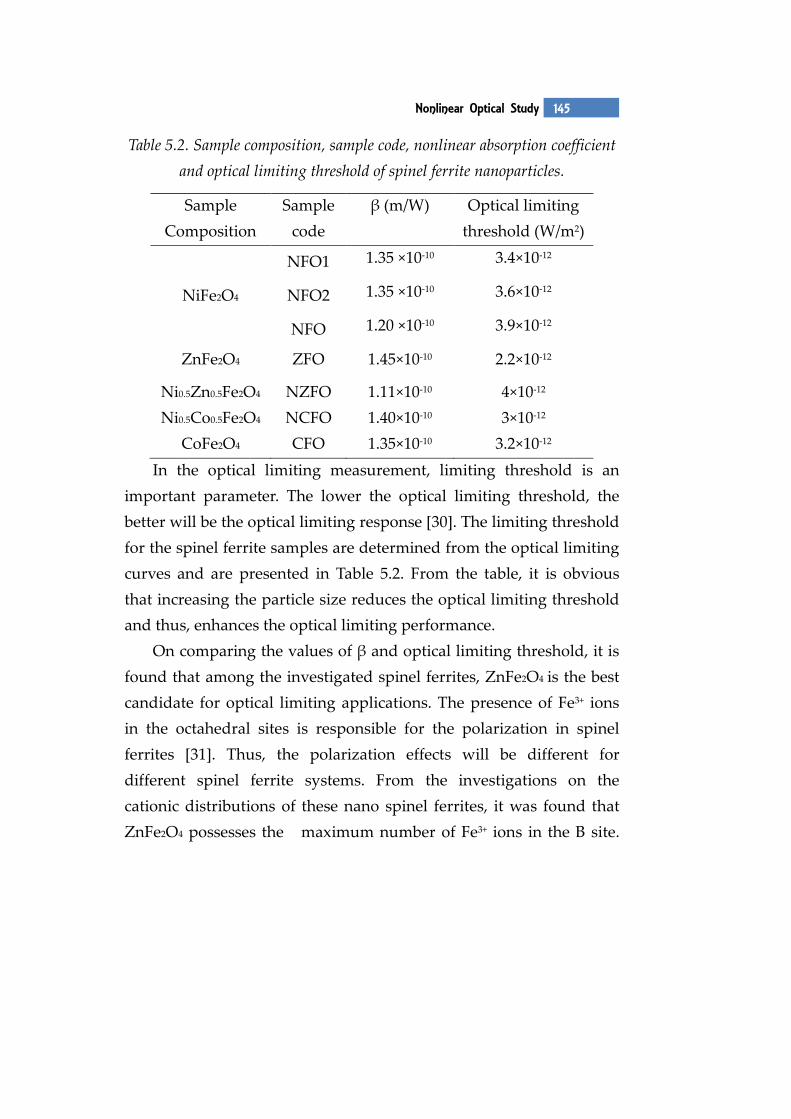
Table 5.2. Sample composition, sample code, nonlinear absorption coefficient
and optical limiting threshold of spinel ferrite nanoparticles.
Sample
Composition
Sample
code
β (m/W) Optical limiting
threshold (W/m2)
NiFe2O4
NFO1 1.35 ×10⁻¹⁰ 3.4×10⁻¹²
NFO2 1.35 ×10⁻¹⁰ 3.6×10⁻¹²
NFO 1.20 ×10⁻¹⁰ 3.9×10⁻¹²
ZnFe2O4 ZFO 1.45×10⁻¹⁰ 2.2×10⁻¹²
Ni0.5Zn0.5Fe2O4 NZFO 1.11×10⁻¹⁰ 4×10-12
Ni0.5Co0.5Fe2O4 NCFO 1.40×10⁻¹⁰ 3×10-12
CoFe2O4 CFO 1.35×10⁻¹⁰ 3.2×10⁻¹²
In the optical limiting measurement, limiting threshold is an
important parameter. The lower the optical limiting threshold, the
better will be the optical limiting response [30]. The limiting threshold
for the spinel ferrite samples are determined from the optical limiting
curves and are presented in Table 5.2. From the table, it is obvious
that increasing the particle size reduces the optical limiting threshold
and thus, enhances the optical limiting performance.
On comparing the values of β and optical limiting threshold, it is
found that among the investigated spinel ferrites, ZnFe2O4 is the best
candidate for optical limiting applications. The presence of Fe3+ ions
in the octahedral sites is responsible for the polarization in spinel
ferrites [31]. Thus, the polarization effects will be different for
different spinel ferrite systems. From the investigations on the
cationic distributions of these nano spinel ferrites, it was found that
ZnFe2O4 possesses the maximum number of Fe3+ ions in the B site.
146
Thus, the polarization effects will be higher in the case of ZnFe2O4,
which eventually contribute to the nonlinear absorption.
Figure 5.5. Variation of two photon absorption coefficient of ZnFe2O4 with
input pulse energy.
Conclusion
In conclusion, we have investigated the optical limiting properties
of five different spinel ferrites, NiFe2O4, Ni0.5Zn0.5Fe2O4, ZnFe2O4,
Ni0.5Co0.5Fe2O4 and CoFe2O4 using nanosecond laser pulses at 532 nm.
The obtained nonlinear parameters show that these materials are
efficient optical limiters. Except for NiFe2O4, the observed
nonlinearity has contributions from excited state absorption. The
optical limiting response is found to increase with increasing particle
size within the range of our investigations. On comparing the optical
limiting properties, ZnFe2O4 is found to be a better candidate for the
optical limiting applications. The large nonlinear optical responses
observed in these ferrites open up possibilities for device applications
exploiting the features of ferrimagnetism and nonlinearity.
References
1. R. C. Hollins, Curr. Opin. Solid State Mater. Sci. 4 (1999) 189.

147 Nonlinear Optical Study
2. J. Wang, W. J. Balu, J. Opt. A: Pure Appl. Opt. 11 (2009)
0244001.
3. I. R. Whittall, A. M. Mcdonagh, M. G. Humphrey, M. Samoc,
Adv. Organomet. Chem. 43 (1998) 349.
4. W. Jia, E. P. Douglas, F. Guo, W. Sun, Appl. Phys. Lett. 85
(2004) 6326.
5. Y. Sun, J. E. Riggs, K. B. Henbest, R. B. Martin, J. Nonlinear
Opt. Phys. Mater. 9, (2000) 481.
6. J. P. Huang, K. W. Yu, Appl. Phys. Lett. 86 (2005) 041905.
7. J. Chen, X. Chen, S. Pu, Z. Di, Y. Xia, Opt. Commun. 276 (2007)
268.
8. S. S. Nair, J. Thomas, C. S. S. Sandeep, M. R. Anantharaman, R.
Philip, Appl. Phys. Lett. 92 (2008) 171908.
9. T. N Narayanan, C. S. S. Sandeep, M. M. Shaijumon, P. M.
Ajayan, R. Philip, M. R. Anantharaman, Nanotechnology 20
(2009) 285702.
10. M. Sugimoto, J. Am. Ceram. Soc. 82 (1999) 269.
11. I. Safarik, M. Safarikova, in: H. Hofmann, Z. Rahman, U.
Schubert (Eds.), Magnetic Nanoparticles and Biosciences, In
Nanostructured Materials, London: Springer, 2002
12. T. Pannaparayil, R. Marande, S. Komarneni, S. G. Sankar, J.
Appl. Phys. 64 (1988) 5641.
13. M. Sultan, R. Singh, J. Appl. Phys. 105 (2009) 07A512.
14. E. Hasmonay, J. Depeyrot, M. H. Sousa, F. A. Tourinho, J. C.
Bacri, R. Perzynski, J. Magn. Magn. Mater. 201 (1999) 195.
15. R. S. Devan, Y. D. Kolekar, B. K. Chugule, J. Phys.: Condens.
Mater. 18 (2006) 9809.
16. T. Tsutaoka, J. Appl. Phys. 93 (2003) 2789.

148
17. H. H. Hamdeh, J. C. Ho, S. A. Oliver, R. J. Willey, G. Oliveri, G.
Busca, J. Appl. Phys. 81 (1997) 1851.
18. M. Kaiser, S. S. Ata-Allah, Mater. Res. Bull. 44 (2009) 1249.
19. K. Sridharan, M. Agarwal, J. Philip, T. Endo, R. Philip, Trans.
Mater. Res. Soc. Jpn. 35 (2010) 159.
20. M. Sheik-Bahae, A. A. Said, T. H. Wei, D. J. Hagan, E. W. Van
Stryland, IEEE J. Quantum Electron. 26 (1990) 760.
21. J. A. Duffy, Bonding, Energy Levels and Bands in Inorganic
Solids, 1st ed., London: Longman, 1990.
22. C. L. Huang, E. Matijevic, Solid State Ionics 84 (1996) 249.
23. J. Tauc, Amorphous and Liquid Semiconductors, 1st ed., New
York: Plenum Press, 1974.
24. R. L. Sutherland, Handbook of Nonlinear optics, 2nd ed., New
York : Marcel Dekker, 2003.
25. P. Kurian , K. Sathiyamoorthy, C. Vijayan, C. S. S. Sandeep, R.
Philip, Nano Res. Lett. 2 (2007) 561.
26. C.S. S. Sandeep, A.K. Samal, T. Pradeep, R. Philip, Chem. Phys.
Lett. 485 (2010) 326.
27. J. Wang, W. J. Blau, J. Phys. Chem. C 112 (2008) 2298.
28. B. Karthikeyan, M. Anija, C.S. S. Sandeep, T.M. M. Nadeer, R.
Philip, Opt. Commun. 281 (2008) 2933.
29. T. Kataoka, T. Tokizaki, A. Nakamura, Phys. Rev. B 48 (1993)
2815.
30. L. Irimpan, V. P. N. Nampoori, P. Radhakrishnan, B. Krishnan,
A. Deepthy, J. Appl. Phys. 103 (2008) 033105.
31. K M Batoo, Physica B 406 (2011) 382.