Chapter 4shodhganga.inflibnet.ac.in/bitstream/10603/8325/12/12_chapter 4.pdf · dielectric...
55
Chapter 4 Microstructural, dielectric and spectroscopic properties of Li 2 O–Nb 2 O 5 –ZrO 2 –SiO 2 glass system crystallized with V 2 O 5 Li 2 O–Nb 2 O 5 –ZrO 2 –SiO 2 glasses mixed with different concentrations of V 2 O 5 were crystallized. The samples were characterized by XRD, SEM and DTA techniques. The SEM pictures indicated that the samples contain well defined and randomly distributed crystal grains. The X-ray diffraction studies have revealed the presence of ZrV 2 O 7 , ZrSi 24 O 50 , LiV 3 O 8 , Li 2 V 2 O 5 , LiVO 3 , Li 2 ZrO 3 , NbVO 5 , LiNbO 3 , Nb 6 V 2 O 19 , Nb 2 V 2 O 9 , Li 2 SiO 3 and ZrSiO 4 crystalline phases in these samples. Optical absorption, ESR and photoluminescence spectral studies on these samples have indicated that a considerable proportion of vanadium ions do exist in V 4+ state in addition to V 5+ state and the redox ratio seems to be increasing with increase in the concentration of crystallizing agent V 2 O 5 . The infrared spectral studies have pointed out the existence of conventional SiO 4 , ZrO 4 , NbO 6 , V=O structural units in the glass ceramic network. The study of dielectric properties suggested a decrease in the insulating character of the glass ceramics with increase in the crystallizing agent. A.C. conductivity in the high temperature region seems to be connected mainly with the polarons involved in the process of transfer from V 4+ V 5+ ions.
Transcript of Chapter 4shodhganga.inflibnet.ac.in/bitstream/10603/8325/12/12_chapter 4.pdf · dielectric...
Chapter 4
Microstructural, dielectric and spectroscopic properties of Li2O–Nb2O5–ZrO2–SiO2 glass system crystallized with V2O5
Li2O–Nb2O5–ZrO2–SiO2 glasses mixed with different concentrations of
V2O5 were crystallized. The samples were characterized by XRD, SEM and DTA
techniques. The SEM pictures indicated that the samples contain well defined and
randomly distributed crystal grains. The X-ray diffraction studies have revealed
the presence of ZrV2O7, ZrSi24O50, LiV3O8, Li2V2O5, LiVO3, Li2ZrO3, NbVO5,
LiNbO3, Nb6V2O19, Nb2V2O9, Li2SiO3 and ZrSiO4 crystalline phases in these
samples. Optical absorption, ESR and photoluminescence spectral studies on
these samples have indicated that a considerable proportion of vanadium ions do
exist in V4+ state in addition to V5+ state and the redox ratio seems to be
increasing with increase in the concentration of crystallizing agent V2O5. The
infrared spectral studies have pointed out the existence of conventional SiO4,
ZrO4, NbO6, V=O structural units in the glass ceramic network. The study of
dielectric properties suggested a decrease in the insulating character of the glass
ceramics with increase in the crystallizing agent. A.C. conductivity in the high
temperature region seems to be connected mainly with the polarons involved in
the process of transfer from V4+V5+ ions.
Microstructural, dielectric and spectroscopic properties of Li2O–Nb2O5–ZrO2–SiO2 glass system crystallized with V2O5
4.1. Introduction
Niobium mixed lithium silicate glasses containing transition metal ions have been
the subject of an increasing academic and technological interest as mentioned in
the earlier chapter. These glasses find a wide range of applications, such as glass
fibers and optical lenses [1, 2], as electrodes [3], for radioactive waste
immobilization [4], in hermetic sealing of metallic and ceramic materials [5] and
as glass planar optical waveguides fabricated by using the sol gel and dip coating
technique [6]. The addition of Nb2O5 bestows the base glass to possess electro
chromic and electro-optical properties. Earlier investigations on spectroscopic
properties of different niobate glasses indicated that Nb ions participate in the
glass network with NbO4 and NbO6 structural units [7-9]. In the glass ceramics
containing Li2O and Nb2O5, there is a possibility for the formation of LiNbO3
crystal phases which exhibit ferroelectric properties [10] and makes the material
for the potential applications in optoelectronics, acoustic-optics.
The addition of ZrO2 to niobium silicate glasses is expected to increase the
electrical resistivity and chemical inertness. In a number of earlier investigations,
it was also established that the inclusion of ZrO2 in silicate glasses causes a
substantial hike in the refractive index, decreases the cut–off wavelength and
reduces the photochromism of the glass [11, 12]. In view of these qualities ZrO2
containing silicate glasses find variety of applications, such as thermal barrier
161
coating, optical filters, laser mirrors and alternative gate dielectrics in
microelectronics.
When compared with the glass materials, glass ceramics are expected to
have several advantages like good mechanical, electrical and thermal properties,
high chemical durability and low coefficient of thermal expansion with no crack
growth inside. Hence, a considerable interest is attached in this connection to the
studies on crystallization of the glass materials and its bearing on the physical
properties. Catalysts generally used for controlled crystallization processes, giving
rise to enormous numbers of nucleation centers in the original glass are, gold,
silver, platinum or the oxides of transition metals like Ti, Cr, Mn, Ce, V, Fe, Co,
Ni etc. The crystallization of Li2O–Nb2O5–ZrO2–SiO2 glasses with V2O5 is an
added advantage for the simple reason that the presence of vanadium ions makes
the material to exhibit semiconducting behavior with the electrical conductivity
>10−3 to 10−5 (ohm cm)−1 due to electron hopping between V4+ to V5+ ions [13].
V2O5 containing glasses are being extensively used in memory and switching
devices. The crystallization of these materials, further leads to the formation of
Li2V2O5 crystal grains in which vanadium ions present in V4+ state. Presence of
such complexes facilitate to accelerate the rate of hopping of electron between V4+
and V5+ ions which ultimately lead to the enhancement of conductivity. The
process of hopping of the electrons between V4+ and V5+ ions in the presence of
larger concentrations of mobile cations like lithium ions is highly interesting and
162
useful to investigate in the multi component glass ceramic systems like Li2O–
Nb2O5–ZrO2–SiO2 in view of huge technological importance of this material.
In spite of the fact, that there are some studies available on silicate glasses
and glass ceramics containing vanadium ions [14, 15], still there is a lot of scope
to probe this ion in SiO2 based glass ceramics (by means of dielectric studies)
especially when they are mixed with incipient glass formers like ZrO2 and Nb2O5.
Further, the investigation on dielectric properties coupled with spectroscopic
studies not only helps in assessing the insulating character but also expected to
shed the light on many aspects, such as the geometry of various structural units of
glass network, the character of chemical bonds of dopant transition metal ions
[16–19].
The objective of the present investigation is to have a comprehensive
understanding over the topology and valence states of vanadium ions in (30-x)
Li2O–10Nb2O5–5ZrO2–55SiO2: xV2O5 (0 ≤ x ≤ 1.0) glass ceramic network by a
systematic study of dielectric (over a wide range of frequency and temperature)
and spectroscopic properties and to use results of these studies to throw some light
on the structural aspects and the insulating character of the material.
The contents of the paper are as follows: section 1 presents the technology
of the sample preparation and the details of experimental techniques adopted for
the sample characterization. In section 2 the results of characterization studies viz.,
electron microscopy, X-ray diffraction, Energy dispersive spectroscopy (EDS)
analysis and differential thermal analysis (DTA), are presented. Section 3 is
163
devoted to the presentation of the studies on physical properties including
dielectric and spectroscopic properties (viz., optical absorption,
photoluminescence, electron spin resonance (ESR) and infrared (IR) spectra). In
the discussion part, principal influence of valence states of vanadium ion and its
environment on physical properties is presented.
4.2 Brief review of the previous work on the glasses containing vanadium ions
The studies as such on vanadium containing silicate glasses are limited. However
in this review, the studies on different glass systems including some silicate
glasses containing vanadium ions, has been described briefly.
Agarwal et al. [20] have recently reported the electron paramagnetic
resonance studies of vanadyl doped alkali niobium borate glasses. In this study it
was observed that the tetragonality of V4+O6 complex decreases with increasing
concentration of Nb2O5. Lin-Hua et al. [21] have recently reported electron
paramagnetic resonance spectra of vanadyl doped zinc phosphate glass. In this
study the compressed defect structure of V4+ center is discussed in detail. Kerkouri
et al. [22] have reported spectroscopic studies and the structural aspects of V2O5-
CdO-P2O5 glasses. In their study it was reported that the glasses containing more
than 20% of V2O5, the VO4 and VO5 structural units with V–O–V bridges were
formed in the glass network. Gouda et al. [23] have investigated the effect of
replacing vanadium by Cu2+ ion on the dc-electrical conductivity () and I–V
characteristics of (V2O5)0.7(GeO2)0.3(CuO)x glasses. In this report the electrical
164
conduction is interpreted on the basis of electrons hopping from reduced to
unreduced vanadium and/or cupper ions. Behzad et al. [24] have studied the
conductivity of 50P2O5–xV2O5–(50–x)Li2O glass system as a function of
temperature and composition. Isothermal variation of conductivity as a function of
composition of this study showed a minimum for a molar ratio x near 20. Probable
mechanisms for decrease of conductivity with decrease of vanadium oxide
concentration were explained in detail. Ali and Ezz-Eldin [25] have studied some
physical properties of the lithium disilicate (Li2Si2O5) glasses doped with different
ratios of V2O5 before and after gamma-rays irradiation. The observed variations in
the physical properties with the change in the concentration of V2O5 were
correlated with the changes in internal glass network. Abd El-Aal and Afifi [26]
have reported the elastic properties of vanadium tellurite glasses, 65TeO2–(35-
x)V2O5–xCuO, with different compositions of copper at room temperature by
ultrasonic methods. Khattak et al. [27] have studied X-ray photoelectron
spectroscopy (XPS) and magnetic susceptibility studies of vanadium phosphate
glasses. From the analysis of the results of these studies, the authors have
proposed a glass structure model consisting of a mixture of vanadate phosphate
phases that include V2O5, VOPO4, (VO)2P2O7, VO(PO3), and V(PO3)3 with the
abundance of orthophosphate (PO4)3- units increasing with increasing vanadium
content. In another report [28] these authors have also reported the results of X-ray
photoelectron spectroscopy (XPS) of vanadium tellurite glasses. Quantitative
165
analysis of the results of these studies has indicated that there is a change of TeO4
to TeO3 upon V2O5 addition.
Bogomolova et al. [29] have reported electron paramagnetic resonance
studies of V4+ ions in lanthanum-aluminosilicate glasses. From the detailed
analysis of EPR spectra it was concluded that in the samples containing low
content of La2O3 lanthanum acts predominately as modifying ion where as in glass
with a high La2O3 concentration lanthanum gradually occupies a glass forming site
in the network. Saddeek [30] has recently reported FTIR and elastic properties by
ultrasonic methods on MoO3–V2O5–PbO glasses. The observed compositional
dependence of the elastic moduli was interpreted in terms of the effect of MoO3 on
the coordination number of the vanadate units. A good correlation was observed
between the experimentally determined elastic moduli and those computed
according to the Makishima-Mackenzie model. Feng [31] has reported detailed
theoretical studies of the optical and EPR spectra for vanadyl ions in alkaline-earth
aluminoborate glasses. In this study the Optical spectra and electron paramagnetic
resonance (EPR), g and A factors of calcium aluminoborate glasses (CaAB): VO2+
are calculated using a complete diagonalization (of the energy matrix) process.
Good agreement between the theoretical values and experimental results attributed
effectiveness of the CDP method for theoretical studies of optical and EPR spectra
of 3d1 (or V4+) ions in glasses. Shapaan et al. [32] have investigated hyperfine
structure and electric transport properties of vanadium iron phosphate glasses and
interpreted the results with the aid of the data on Mössbauer spectroscopy.
166
Increase of V2O5 content, resulted the increase in dc conductivity while the
activation energy was found to decrease. The observed increase of dielectric
constant () with increasing V2O5 content was attributed to the increase in the
deformation of glass network. Kartashov and Vysloukh [33] have investigated the
propagation of laser beams in SiO2-VO2 nanocomposite waveguides with thermo-
optical nonlinearity. These studies have indicated that the large modifications of
the absorption coefficient as well as notable changes of the refractive index of VO2
nanoparticles embedded into the SiO2 host media that accompany the
semiconductor-to-metal phase transition. At the end they have concluded that such
changes may lead to optical limiting in the near-IR wave range.
Sung et al. [34] have investigated a variety of thermal properties of P2O5–
V2O5–ZnO/B2O3 glasses that include glass transition temperature, dilatometer
softening point and coefficient of thermal expansion, and aqueous durability. From
these studies it was observed that the aqueous durability was improved through the
addition of some additives such as Al2O3 and TiO2. ElBatal et al. [35] have
prepared V2O5-doped sodium phosphate glasses of various compositions and
studied various spectroscopic properties that include UV-vis and infrared, Raman
and electron spin resonance. In this study the changes observed in UV-vis and
infrared spectral data were discussed in relation to the structural evolution caused
by the change in the V2O5 content or glass composition. Kim et al. [36] have
investigated the local structures of the boron and vanadium sites in the ternary
xV2O5–B2O3–yNa2O glass by means of magic angle spinning (MAS) nuclear
167
magnetic resonance (NMR) techniques. In this study it was observed that with
increasing x, the mole ratios of the BO3 and BO4 structures were enhanced, as
were the quadrupole asymmetry parameters for the BO3 structures, while the
quadrupole coupling constants for the sites were reduced. Moawad et al. [37] have
investigated dc conductivity the mixed electronic-ionic conduction in 0.5[xAg2O–
(1–x)V2O5]–0.5TeO2 glasses. In this study it was observed that the mechanism of
dc conductivity changes from predominantly electronic to ionic within the
30Ag2O40 range. Taibi et al. [38] have investigated the influence of the
V2O5/Sb2O3 substitution on the physical properties of the (70–x)Sb2O3–xV2O5–
30K2O glasses. From these studies the authors have suggested that there is a
change in the coordination number of the vanadium cations in relation to the
network topology. Farah [39] has studied the relationship between glass
composition and optical basicity by redox analysis of vanadium in Na2O and CaO
based Al2O3–SiO2 glasses/melts. In this study it was found that the V4+/V5+
equilibrium was more affected by a change in the calculated optical basicity
compared with that of the V3+/V4+ in both sodium and calcium silicate series.
However, Alumina saturation from the crucible did not affect the calculated
optical basicity of the sodium silicate glasses, although there was a change in the
corresponding redox ratios. The results were compared using different
experimental parameters and were found to be useful in glass production and
extractive metallurgy of vanadium.
168
Vedeanu et al. [40] have investigated structural changes induced by CuO
and V2O5 in the phosphate glass network by means of Raman spectroscopy. In this
study it was observed that at higher concentrations of V2O5 a strong
depolymerization of the phosphate network was taking place. Kumar et al. [41]
have reported thermal and electrical properties of tellurium-based glasses doped
with vanadium and vanadium-cobalt oxides. From the thermal properties the
authors have estimated that the thermal stability, fragility and glass-forming
tendency of the glass system. The results of dc conductivity have been analyzed in
the light of Mott's small polaron hopping (SPH) and Mott's and Greave's variable
range hopping (VRH) models. Kundu et al. [42] have investigated effect of V2O5
on structural, physical and electrical properties of bismuth borate glasses. In this
study the dc conduction was found to increase with increase in vanadium content
and the mechanism was explained in terms of polaron hopping. Rao et al. [43]
have reported dielectric dispersion in Li2O–MoO3–B2O3 glass system doped with
V2O5. The observed dielectric relaxation effect was analyzed quantitatively by
pseudo Cole-Cole plot method and the spreading of relaxation times was
established. Li et al. [44] have studied the effect of lanthanum on structure of
vanadate-phosphate glass by means of Fourier infrared spectroscopy, Raman
spectroscopy and nuclear magnetic resonance. The analysis of these results have
indicated that vanadium existed in the glass in the form of (VO3)n single chains,
(V2O8)n zigzag chains, VO4 branches and groups. Rada et al. [45] have
investigated the effect of the introduction of vanadium pentaoxide on structural
169
changes in phospho-tellurite glasses containing gadolinium ions. In these studies it
was found that the addition of V2O5 resulted in gradual depolymerization of the
phosphate chains and formation of short phosphate units in the glass network.
Ardelean et al. [46] reported the EPR study of V2O5–P2O5–Li2O glass system. In
this study it was found that at high V2O5 content, the vanadium hyperfine structure
disappears and only the broad line could be observed in the spectra. Spin
Hamiltonian parameters g||, g⊥, A||, A⊥, dipolar hyperfine coupling parameters, P,
and Fermi contact interaction parameters, K, have been calculated. The
composition dependence of line widths of the first two absorptions from the
parallel band and of the broad line characteristic to the cluster formations was also
discussed in detail.
Al-Assiri [47] has studied electrical properties of vanadium-copper-
phosphate glasses. In this study the dc conductivity was found to increase while
the activation energy is found to decrease with the increase of the V2O5 content.
Further, it was reported that the dc conductivity in these glasses is electronic in
nature and depends strongly upon the average distance, R, between the vanadium
ions. Tian et al. [48] have investigated the effect of V2O5 content on the phase-
transformation and the microstrctural development in the SiO2–MgO–Al2O3–K2O–
V2O5–F glass by XRD, SEM and EPMA measurements. In this study it was found
that the incorporation of V2O5 leads to the precipitation of mullite (Al6Si2O13)
crystalline phases at lower temperatures. Further, it was reported that although the
types of crystalline phases, which are formed as mullite and mica, were less
170
influenced by V2O5 contents, the morphology, volume fraction and sizes of
crystals were dependent sensitively on the V2O5 content. Hager [49] has reported
the region of glass formation of ternary V2O5–BaF2–RF (RF=LiF, NaF and mixed
NaF–LiF) and has also measured a variety of physical parameters that include
density, molar volume, characteristic temperatures, average thermal expansion
coefficient, , and specific heat, Cp. In this study it was observed that the glass-
transition temperature, Tg, decreased by increase of RF while thermal expansion, ,
and specific heat, Cp, near Tg were increased. Jung et al. [50] have carried out
NMR investigations on PbO–B2O3 glasses containing V2O5 and they have
calculated the ratio of BO4 and BO3 units as a function of V2O5 concentration.
Mekki et al. [51] have investigated the magnetic properties of vanadium-sodium
silicate glasses. Ferrari et al. [52] have probed the effect of V2O5 on the
crystallization of CaO–ZrO2–SiO2 glasses. Abd El-Moneim [53] has carried out
DTA and IR spectra of vanadium tellurite glasses. Hoppe et al. [54] have reported
the details on structure of vanadium tellurite glasses by using neutron and X–ray
diffraction. Cozar et al. [55] have studied the IR and EPR studies on some lithium
borate glasses with vanadium ions. Salim et al. [56] have carried out X–ray
photoelectron spectroscopy and magnetization studies of iron–vanadium
phosphate glasses. Khattak et al. [57] have studied X–ray photoelectron
spectroscopy (XPS) and magnetic properties of copper-vanadium phosphate
glasses. Krasowski et al. [58] have measured electrical conductivity of silver
171
vandate glasses. Maria-Camelja et al. [59] have investigated the ionic and
electronic conductivity of P2O5–V2O5–Na2O glasses.
Sudarsan et al. [60] have carried out a study on the structural aspects of
V2O5–P2O5–B2O3 glasses by using MAS NMR and IR spectral studies. Sega et al.
[61] have studied the electrical conduction in V2O5–NiO–TeO2 glasses. Mori et al.
[62] have discussed the conduction phenomenon in V2O5–Sb–TeO2 glasses on the
basis of small polaron hopping model. Rajendran et al. [63] have carried out
ultrasonic investigations in V2O5–PbO glasses containing BaTiO3. Simockova et
al. [64] have investigated complex impedance response of V2O5–P2O5 glasses.
Takahashi et al. [65] have investigated the structure of AgI–Ag2O–V2O5 glasses.
Moustafa et al. [66] have reported the spectroscopic studies of semiconducting
barium vandate glasses doped with iron oxide. Attos et al. [67] have investigated
the structure of borovanadate glasses by Raman spectroscopy. Murawski et al.
[68] has investigated the dielectric relaxation in semiconducting glasses. Seth et al.
[69] have studied the EPR study of vanadyl ion in CoO–PbO–B2O3 glasses.
Prakash et al. [70] have carried out the EPR study of vanadyl ion in CoO-PbO-
B2O3 glasses. Amano et al. [71] have studied the electrical properties of Sb2O3–
CaO–V2O5 glasses and glass ceramics. Bogomolova et al. [72] have investigated
the role of V2O5 on the structure of fluoro germanate glasses using ESR
measurements. Yoko et al. [73] have studied the IR and NMR spectral studies on
lead vanadate glasses. Ghosh et al. [74] have reported the spectral studies of
binary iron vanadate glasses. Gupta et al. [75] reported the influence of V4+ ion
172
concentration on the EPR spectra of vanadate glasses. Adams et al. [76] have
studied the silver ion conductivity during the crystallization of AgI–Ag2O–V2O5
glasses. Dimitrov et al. [77] have analyzed V2O5–GeO2–Bi2O3 glass structure by
IR spectra.
4.3 Characterization
The detailed compositions of the glasses used in the present study are as follows:
V0: 30.0Li2O–10Nb2O5–5ZrO2–55SiO2
V1: 29.9Li2O–10Nb2O5–5ZrO2–55SiO2: 0.1V2O5
V3: 29.7Li2O–10Nb2O5–5ZrO2–55SiO2: 0.3V2O5
V5: 29.5Li2O–10Nb2O5–5ZrO2–55SiO2: 0.5V2O5
V8: 29.2Li2O–10Nb2O5–5ZrO2–55SiO2: 0.8V2O5
V10: 29.0Li2O–10Nb2O5–5ZrO2–55SiO2: 1.0V2O5
4.3.1 Physical parameters
From the measured values of the density and average molecular weight M
of the samples, various other physical parameters such as vanadium ion
concentration Ni, mean vanadium ion separation ri, polaron radius rp in Li2O–
Nb2O5–ZrO2–SiO2: V2O5 glass ceramic samples are computed and presented in
Table 4.1.
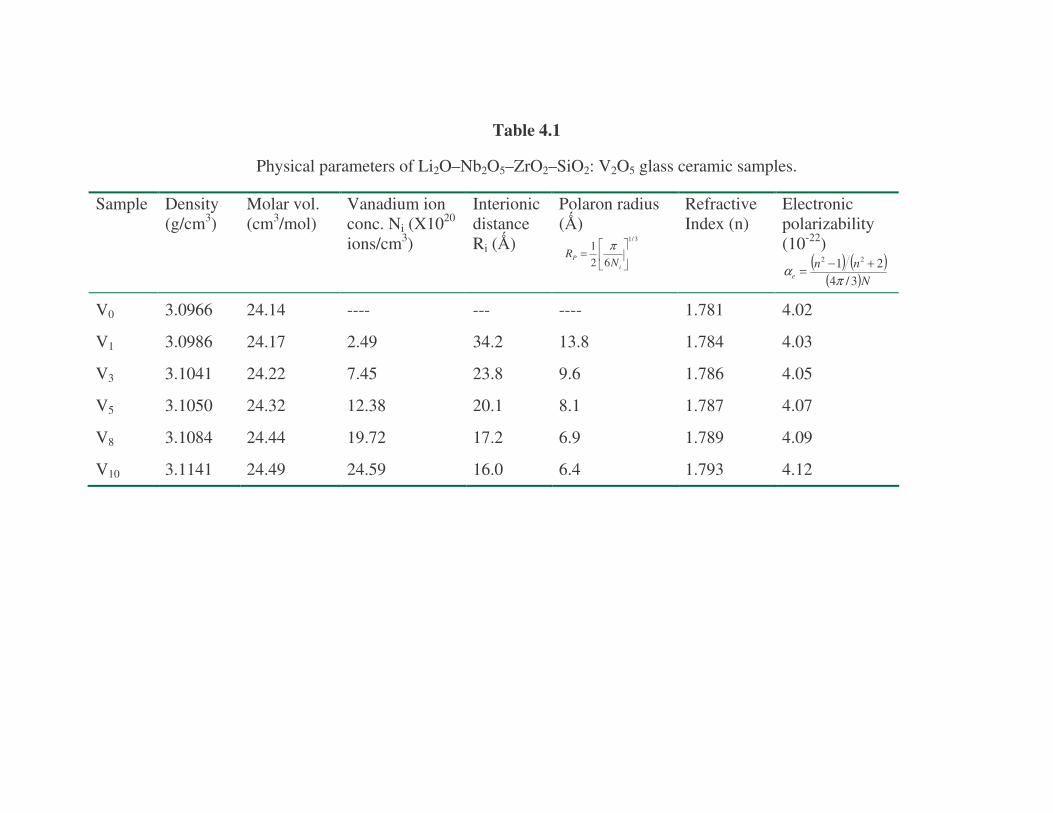
Table 4.1
Physical parameters of Li2O–Nb2O5–ZrO2–SiO2: V2O5 glass ceramic samples.
Sample Density (g/cm3)
Molar vol. (cm3/mol)
Vanadium ion conc. Ni (X1020 ions/cm3)
Interionic distance Ri ()
Polaron radius () 3/1
621
=
iP N
Rπ
Refractive Index (n)
Electronic polarizability (10-22)
( ) ( )( )N
nne 3/4
21 22
πα +−=
V0 3.0966 24.14 ---- --- ---- 1.781 4.02
V1 3.0986 24.17 2.49 34.2 13.8 1.784 4.03
V3 3.1041 24.22 7.45 23.8 9.6 1.786 4.05
V5 3.1050 24.32 12.38 20.1 8.1 1.787 4.07
V8 3.1084 24.44 19.72 17.2 6.9 1.789 4.09
V10 3.1141 24.49 24.59 16.0 6.4 1.793 4.12

4.3.2 Scanning electron microscopy
The scanning electron microscopy (SEM) pictures of some of the samples
investigated are presented in Fig. 4.1. The pictures of pre-crystallized glasses
exhibited virtually no crystallinity. The SEM pictures of crystallized Li2O–Nb2O5–
ZrO2–SiO2: V2O5 samples clearly suggests the presence of some structured species
on the surface of the glasses (Figs. 4.1 (a & b)). The chemical makeup of the
samples is analyzed using energy dispersive spectra (EDS); the analysis indicated
the presence of Li, Nb, Zr, Si, V and O elements in various crystalline phases (Fig.
4.1 (c)). The X–ray map for vanadium ions in one of the glass ceramics (viz., V8)
is presented in Fig. 4.1(c). The maps indicate a reasonably uniform distribution of
the vanadium ions in the entire glass ceramic material. The maps of other samples
also exhibited the similar behaviour.
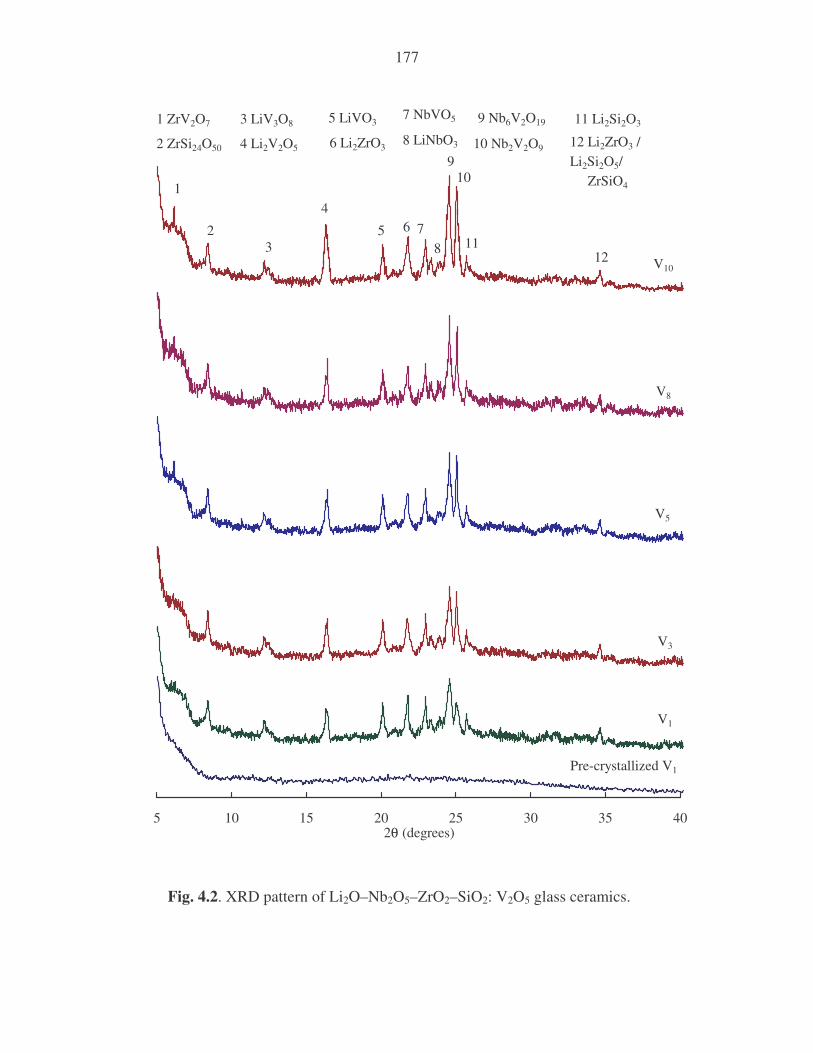
4.3.3 X-ray diffraction
X-ray diffraction studies (Fig. 4.2) indicate the possible formation of
several primary crystalline phases containing the multiple combination of
elements viz., Si, Zr, V, Li, Nb, and O [78]. However, in the context of presence
of mixture of several complex crystalline phases, it is difficult to conclude
quantitatively about the exact species present and the nature of the crystalline
phases. The crystalline phases indicated in Fig. 4.2 are of most possible ones but it
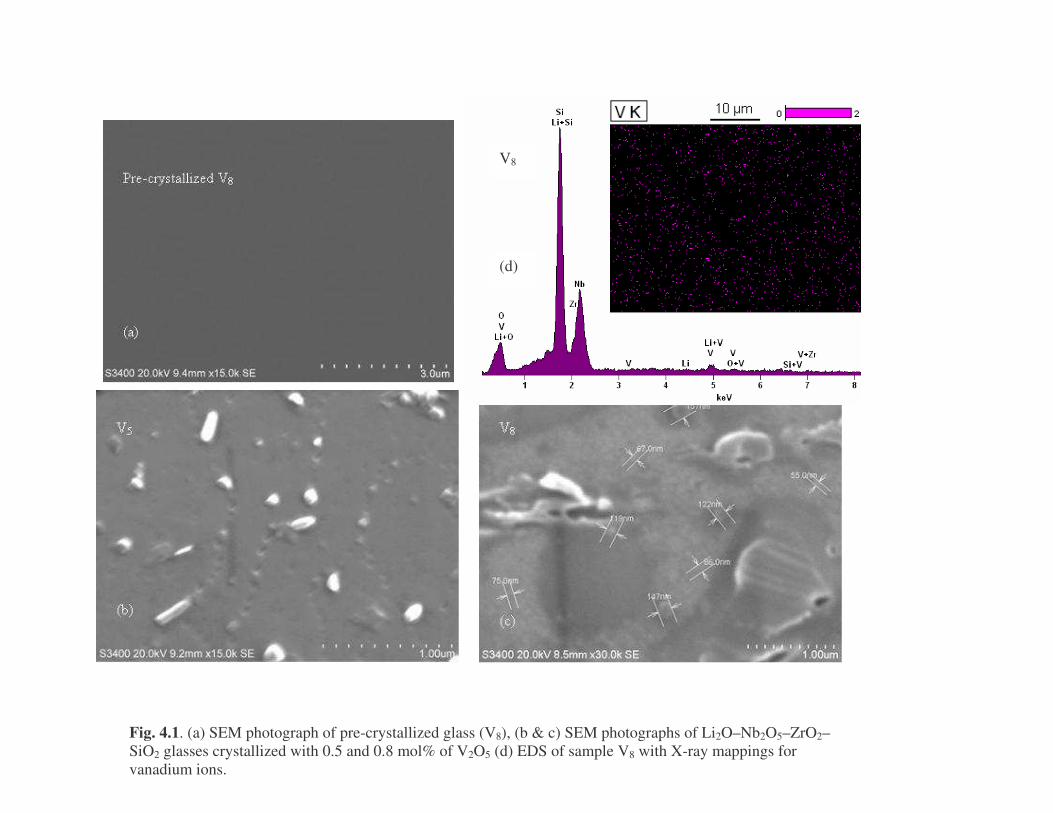
Fig. 4.1. (a) SEM photograph of pre-crystallized glass (V8), (b & c) SEM photographs of Li2O–Nb2O5–ZrO2–SiO2 glasses crystallized with 0.5 and 0.8 mol% of V2O5 (d) EDS of sample V8 with X-ray mappings for vanadium ions.
V8
(d)
requires more qualitative analysis which is beyond the scope of the objective of
this paper.
The V2O5 rich areas in the samples may enhance the reactivity of V2O5 ion
with the other oxides that precipitate as a high density of fine V2O5 rich crystals.
The tiny crystals formed in the samples act as heterogeneous nuclei for the
crystallization of the remaining glass. The diffraction data also indicate the
possibility that, in these samples vanadium exists in V4+ state in addition to V5+
state.
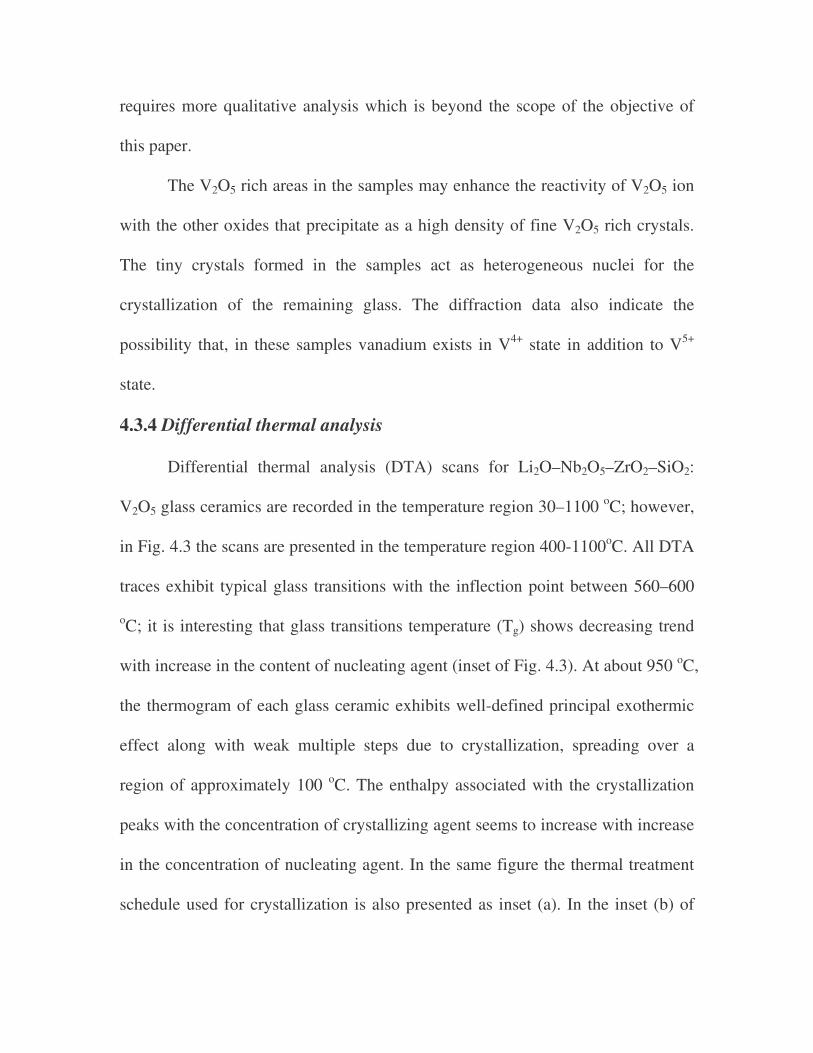
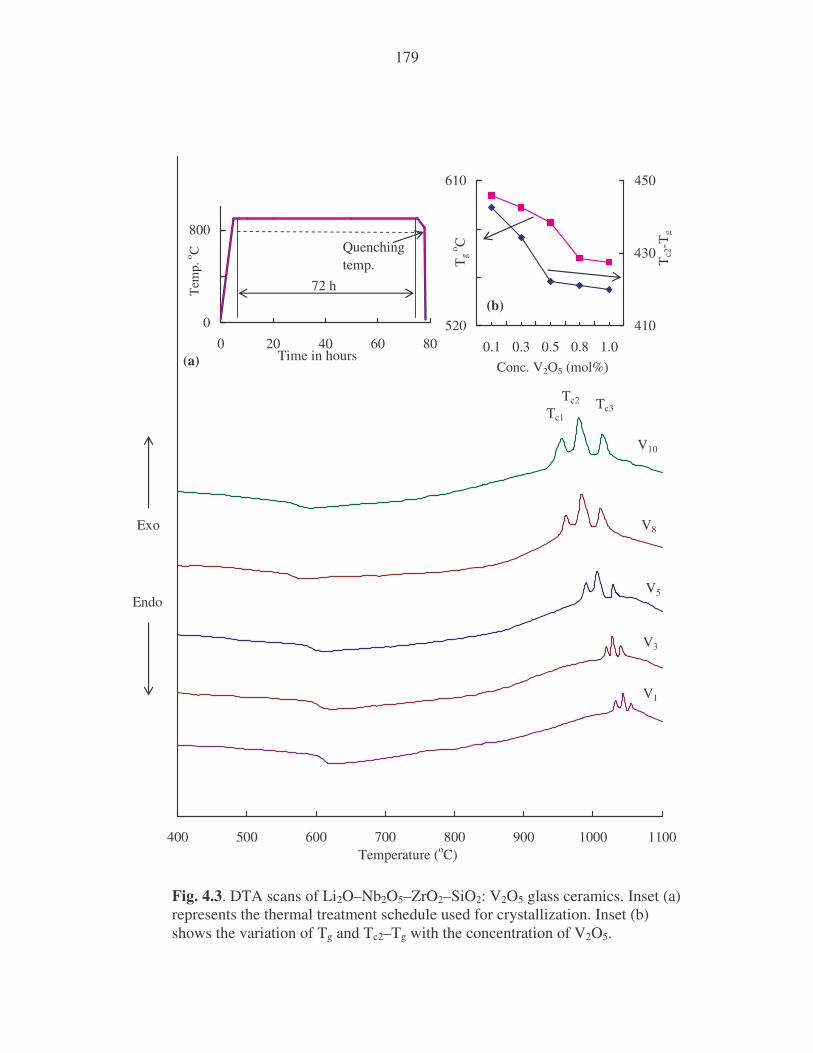
4.3.4 Differential thermal analysis
Differential thermal analysis (DTA) scans for Li2O–Nb2O5–ZrO2–SiO2:
V2O5 glass ceramics are recorded in the temperature region 30–1100 oC; however,
in Fig. 4.3 the scans are presented in the temperature region 400-1100oC. All DTA
traces exhibit typical glass transitions with the inflection point between 560–600
oC; it is interesting that glass transitions temperature (Tg) shows decreasing trend
with increase in the content of nucleating agent (inset of Fig. 4.3). At about 950 oC,
the thermogram of each glass ceramic exhibits well-defined principal exothermic
effect along with weak multiple steps due to crystallization, spreading over a
region of approximately 100 oC. The enthalpy associated with the crystallization
peaks with the concentration of crystallizing agent seems to increase with increase
in the concentration of nucleating agent. In the same figure the thermal treatment
schedule used for crystallization is also presented as inset (a). In the inset (b) of
177
5 10 15 20 25 30 35 40
1
2 58
763
4
910
11
3 LiV3O8
4 Li2V2O5
5 LiVO3
6 Li2ZrO3
7 NbVO5
8 LiNbO3
9 Nb6V2O19
10 Nb2V2O9 12 Li2ZrO3 / Li2Si2O5/ ZrSiO4
11 Li2Si2O31 ZrV2O7
2 ZrSi24O50
12
2θ (degrees)
Pre-crystallized V1
V1
V3
V5
V8
V10
Fig. 4.2. XRD pattern of Li2O–Nb2O5–ZrO2–SiO2: V2O5 glass ceramics.

178
Fig. 4.3, the variation of the difference TC2–Tg (where TC2 is the principal
crystallization peak temperature) with the concentration of nucleating agent are
also presented; this parameter is observed to decrease with the content of V2O5
Thus the results of characterization by XRD, SEM and DTA techniques
unambiguously reveals that the thermal treatment for prolonged times with
different concentrations of V2O5 caused the conversion of Li2O–Nb2O5–ZrO2–
SiO2 glass samples into glass ceramics with entrenchment of fine crystals of
different phases.
4.4 Results
4.4.1 Infrared spectrum
The IR spectrum (Fig. 4.4) of V2O5 free Li2O–Nb2O5–ZrO2–SiO2 glass ceramics
exhibited conventional bands due to Si−O−Si (linkages between SiO4 tetrahedral
units) asymmetric and symmetric vibrations at about 1020 cm−1 and at about 800
cm−1 respectively. More specifically, the symmetrical band is designated as
bending mode of bridging oxygen perpendicular to Si–Si axis within the Si−O−Si
plane [79]. A feeble band at about 980 cm-1 attributed to the vibrations of Si–O–Zr
linkages is also located in the spectrum of this glass [80]; in the same region, the
vibrational frequency due to Si−OH stretchings [6, 81] is also expected. A band
correlated to Si−O−Si / O−Si−O bending modes is also located at about 475 cm−1.
The spectra also exhibited two significant bands at about 530 and 700 cm-1 due to
Zr–O–Zr vibrations of ZrO4 structural units. The niobate groups have also
179
400 500 600 700 800 900 1000 1100Temperature (oC)
V1
V3
V5
V8
V10
Exo
Endo
Tc2Tc1
Tc3
520
610
0.1 0.3 0.5 0.8 1.0410
430
450
Tg
o C
Conc. V2O5 (mol%)
Tc2
-Tg
(b)0
800
0 20 40 60 80
72 h
Time in hours
Tem
p. o C Quenching
temp.
(a)
Fig. 4.3. DTA scans of Li2O–Nb2O5–ZrO2–SiO2: V2O5 glass ceramics. Inset (a) represents the thermal treatment schedule used for crystallization. Inset (b) shows the variation of Tg and Tc2–Tg with the concentration of V2O5.
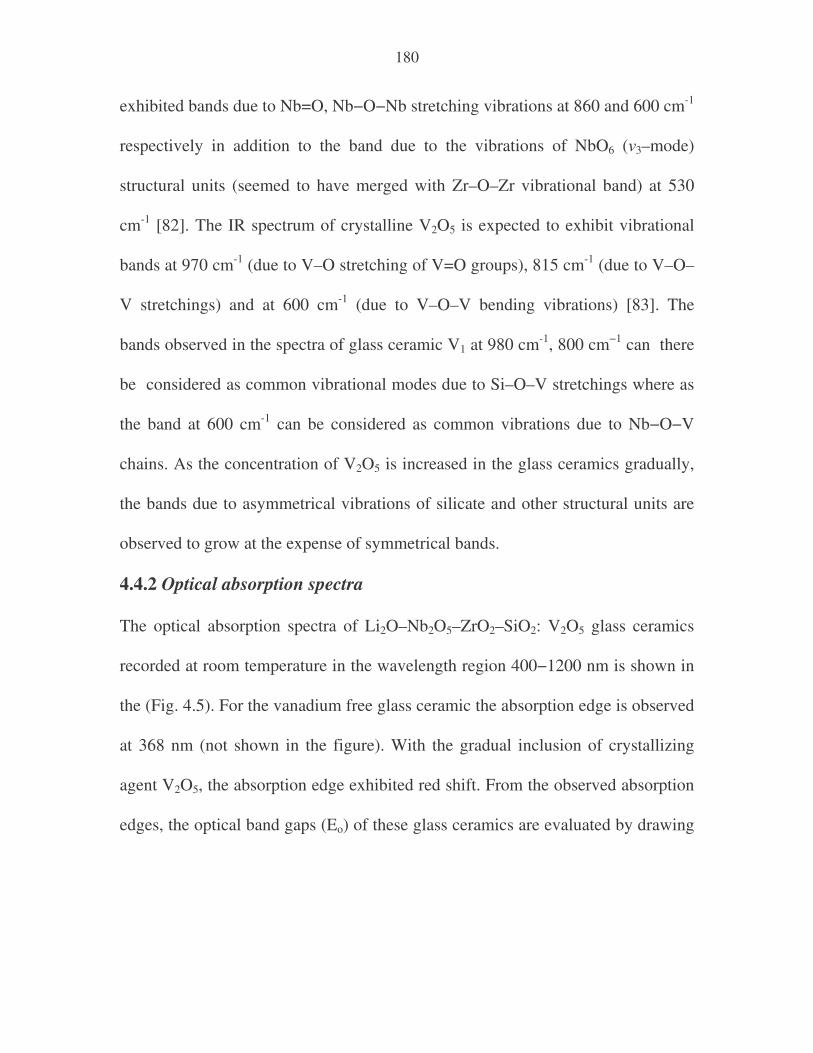
180
exhibited bands due to Nb=O, Nb−O−Nb stretching vibrations at 860 and 600 cm-1
respectively in addition to the band due to the vibrations of NbO6 (3–mode)
structural units (seemed to have merged with Zr–O–Zr vibrational band) at 530
cm-1 [82]. The IR spectrum of crystalline V2O5 is expected to exhibit vibrational
bands at 970 cm-1 (due to V–O stretching of V=O groups), 815 cm-1 (due to V–O–
V stretchings) and at 600 cm-1 (due to V–O–V bending vibrations) [83]. The
bands observed in the spectra of glass ceramic V1 at 980 cm-1, 800 cm−1 can there
be considered as common vibrational modes due to Si–O–V stretchings where as
the band at 600 cm-1 can be considered as common vibrations due to Nb−O−V
chains. As the concentration of V2O5 is increased in the glass ceramics gradually,
the bands due to asymmetrical vibrations of silicate and other structural units are
observed to grow at the expense of symmetrical bands.
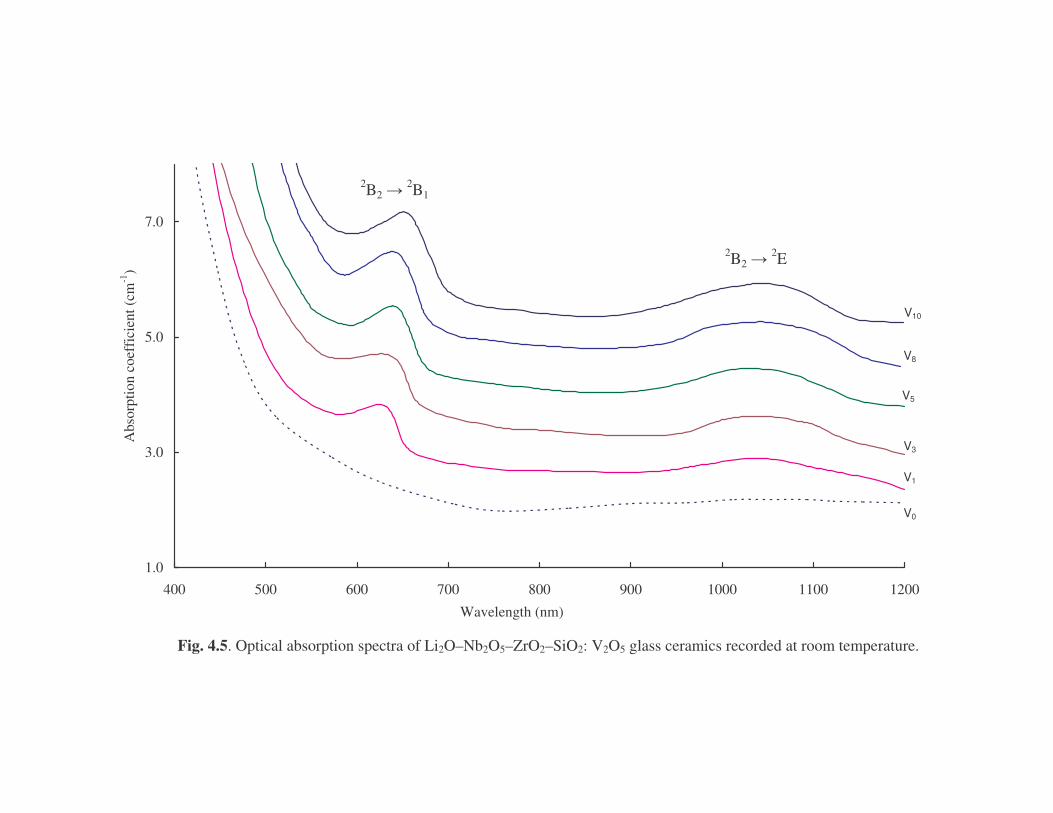
4.4.2 Optical absorption spectra
The optical absorption spectra of Li2O–Nb2O5–ZrO2–SiO2: V2O5 glass ceramics
recorded at room temperature in the wavelength region 400−1200 nm is shown in
the (Fig. 4.5). For the vanadium free glass ceramic the absorption edge is observed
at 368 nm (not shown in the figure). With the gradual inclusion of crystallizing
agent V2O5, the absorption edge exhibited red shift. From the observed absorption
edges, the optical band gaps (Eo) of these glass ceramics are evaluated by drawing
400500
600700
800900
10001100
1200
Si-O-Siassymetric stretching
Si-O-Zr / V=O units
Nb=O units
Si-O-Si Symmetric stretching/
V-O-V chains
Zr-O-Zr units/NbO6 otahedral units
Nb-O-Nb / V-O-V bending
NbO6/Zr-O-Zr
Si-O-Si rocking bands
Wavenum
ber (cm-1)
Transmittance %
V0
V8
V5
V3
V1
V10
Fig. 4.4. IR spectra of L
i2 O–N
b2 O
5 –ZrO
2 –SiO2 : V
2 O5 glass ceram
ics
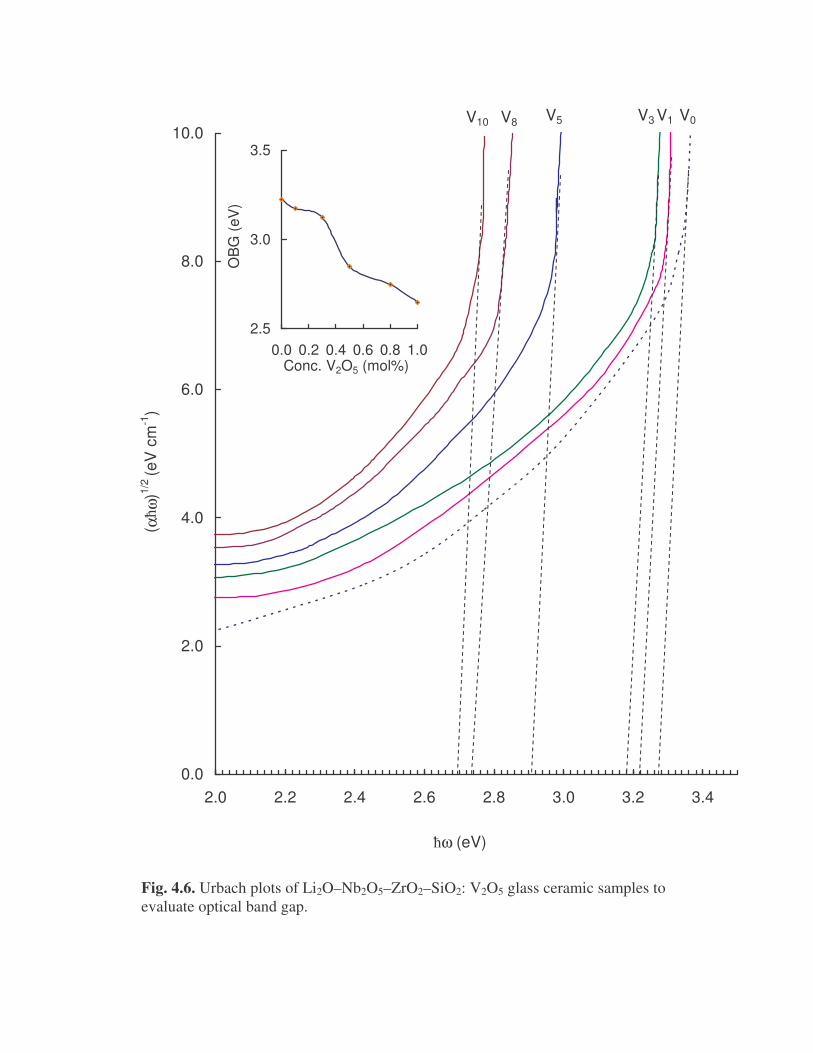
Urbach plots between ( ) ωωα vs2/1 (Fig. 4.6); from the extrapolation of the linear
portion of these plots, the values of optical band gap (Eo) are obtained and
presented in Table 4.2. The value of Eo is found to be the lowest for the glasses
crystallized with 1.0 mol% of V2O5. The spectrum of glass ceramic sample V1
exhibited two broad absorption bands with the meta-centers at 634 and 1040 nm
attributed to 2B22B1 and 2B2
2E transitions of VO2+ ions [84]. A continuous
increase of absorption under these bands is observed with the content of V2O5 in
the glass ceramic.
Table 4.2
Absorption band positions and optical band gaps of Li2O–Nb2O5–ZrO2–SiO2 glasses crystallized with various concentrations of V2O5
Band positions (nm) Sample
Cut off wavelength
(nm) 2B22B1
2B22E
Optical band gap
(E0) eV
V0 380 - - 3.23
V1 382 634 1041 3.18
V3 385 638 1054 3.13
V5 422 659 1062 2.85
V8 445 661 1069 2.75
V10 455 663 1070 2.65
1.0
3.0
5.0
7.0
400 500 600 700 800 900 1000 1100 1200
Wavelength (nm)
Abs
orpt
ion
coef
fici
ent (
cm-1
)
V0
V1
V3
V5
V8
V10
2B2 2B1
2B2 2E
Fig. 4.5. Optical absorption spectra of Li2O–Nb2O5–ZrO2–SiO2: V2O5 glass ceramics recorded at room temperature.
0.0
2.0
4.0
6.0
8.0
10.0
2.0 2.2 2.4 2.6 2.8 3.0 3.2 3.4
( α ω
)1/2
(eV
cm
-1)
ω (eV)
V0V3V5V8V10
2.5
3.0
3.5
0.0 0.2 0.4 0.6 0.8 1.0Conc. V2O5 (mol%)
OB
G (
eV)
V1
Fig. 4.6. Urbach plots of Li2O–Nb2O5–ZrO2–SiO2: V2O5 glass ceramic samples to evaluate optical band gap.
185
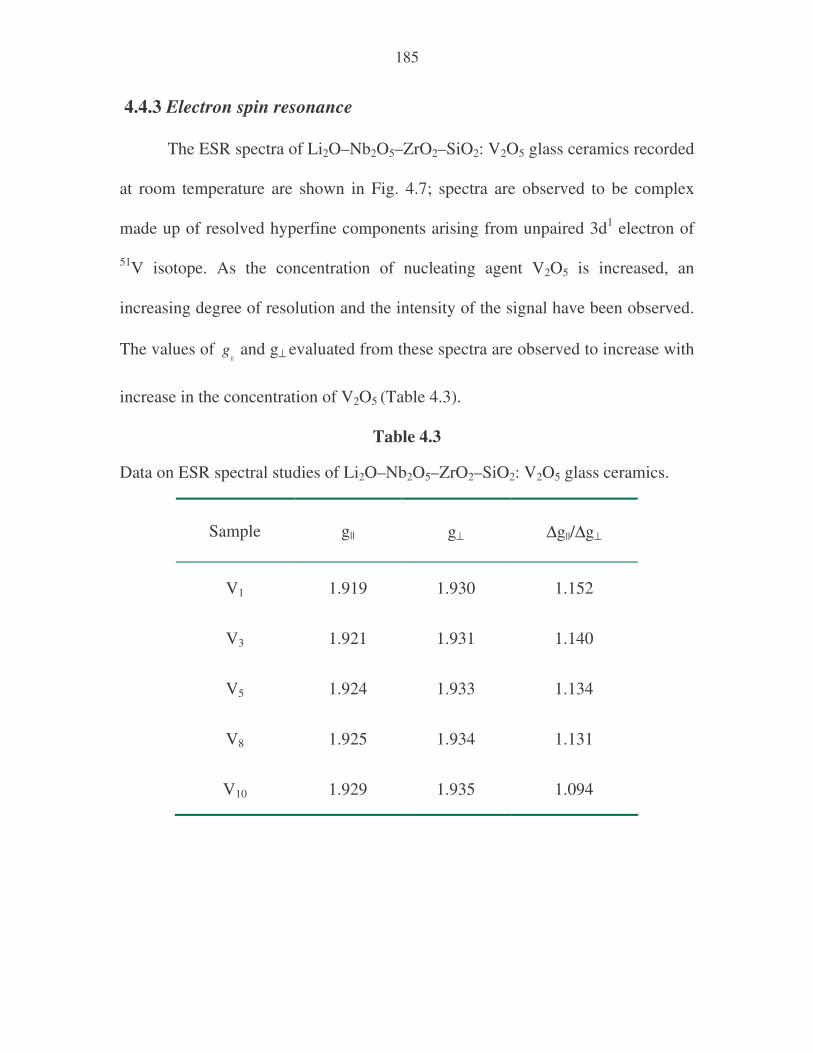
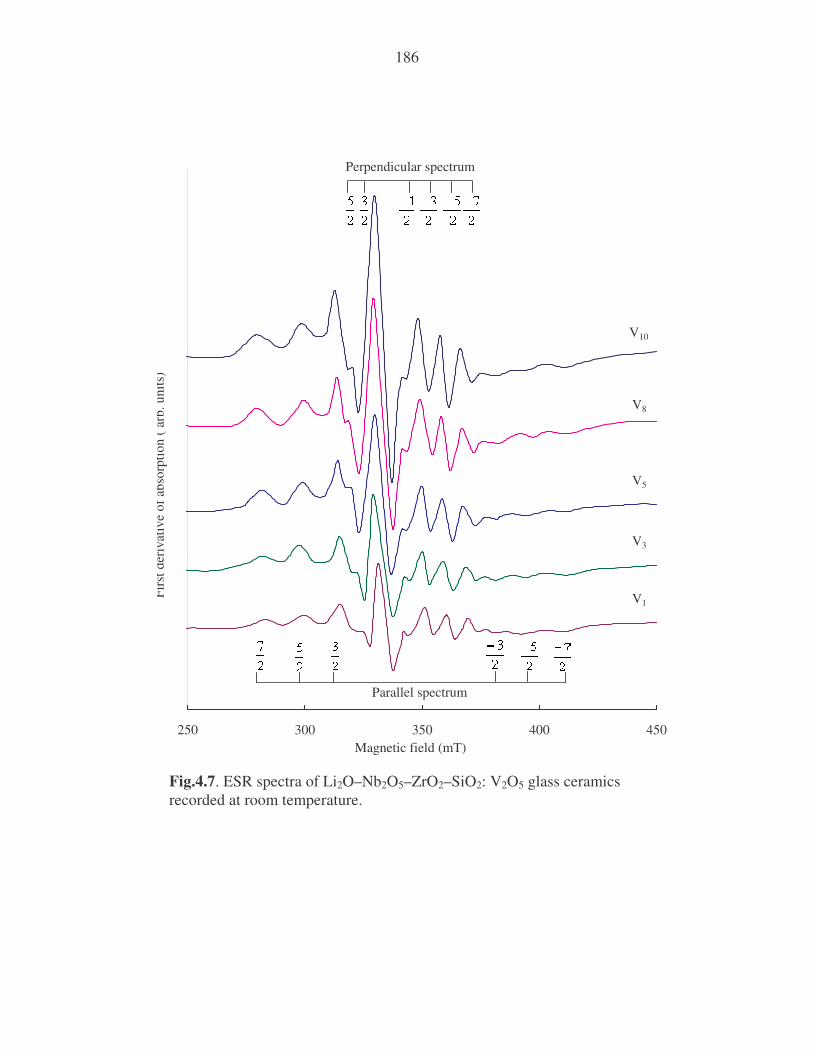
4.4.3 Electron spin resonance
The ESR spectra of Li2O–Nb2O5–ZrO2–SiO2: V2O5 glass ceramics recorded
at room temperature are shown in Fig. 4.7; spectra are observed to be complex
made up of resolved hyperfine components arising from unpaired 3d1 electron of
51V isotope. As the concentration of nucleating agent V2O5 is increased, an
increasing degree of resolution and the intensity of the signal have been observed.
The values of ||
g and g⊥ evaluated from these spectra are observed to increase with
increase in the concentration of V2O5 (Table 4.3).
Table 4.3
Data on ESR spectral studies of Li2O–Nb2O5–ZrO2–SiO2: V2O5 glass ceramics.
Sample g|| g⊥ ∆g||/∆g⊥
V1 1.919 1.930 1.152
V3 1.921 1.931 1.140
V5 1.924 1.933 1.134
V8 1.925 1.934 1.131
V10 1.929 1.935 1.094
186
250 300 350 400 450
V1
V3
V5
V8
V10
Magnetic field (mT)
Firs
t der
ivat
ive
of a
bsor
ptio
n ( a
rb. u
nits
)
.Perpendicular spectrum
Parallel spectrum
Fig.4.7. ESR spectra of Li2O–Nb2O5–ZrO2–SiO2: V2O5 glass ceramics recorded at room temperature.
187
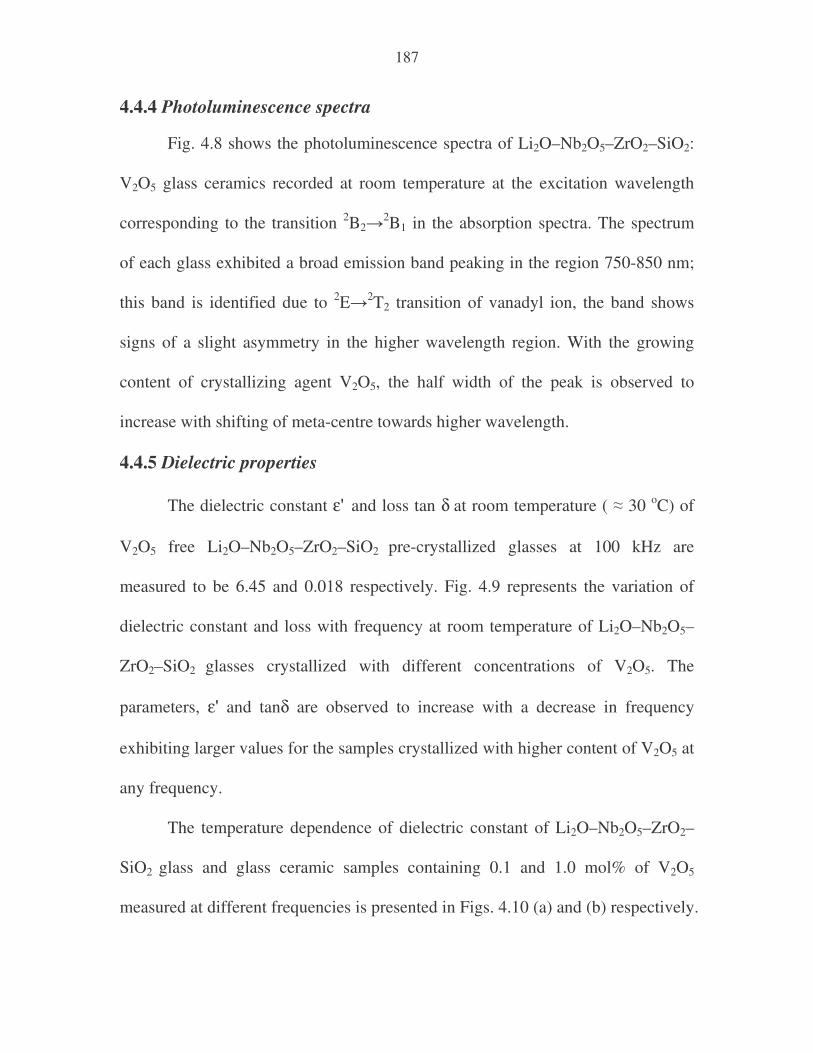
4.4.4 Photoluminescence spectra
Fig. 4.8 shows the photoluminescence spectra of Li2O–Nb2O5–ZrO2–SiO2:
V2O5 glass ceramics recorded at room temperature at the excitation wavelength
corresponding to the transition 2B22B1 in the absorption spectra. The spectrum
of each glass exhibited a broad emission band peaking in the region 750-850 nm;
this band is identified due to 2E2T2 transition of vanadyl ion, the band shows
signs of a slight asymmetry in the higher wavelength region. With the growing
content of crystallizing agent V2O5, the half width of the peak is observed to
increase with shifting of meta-centre towards higher wavelength.
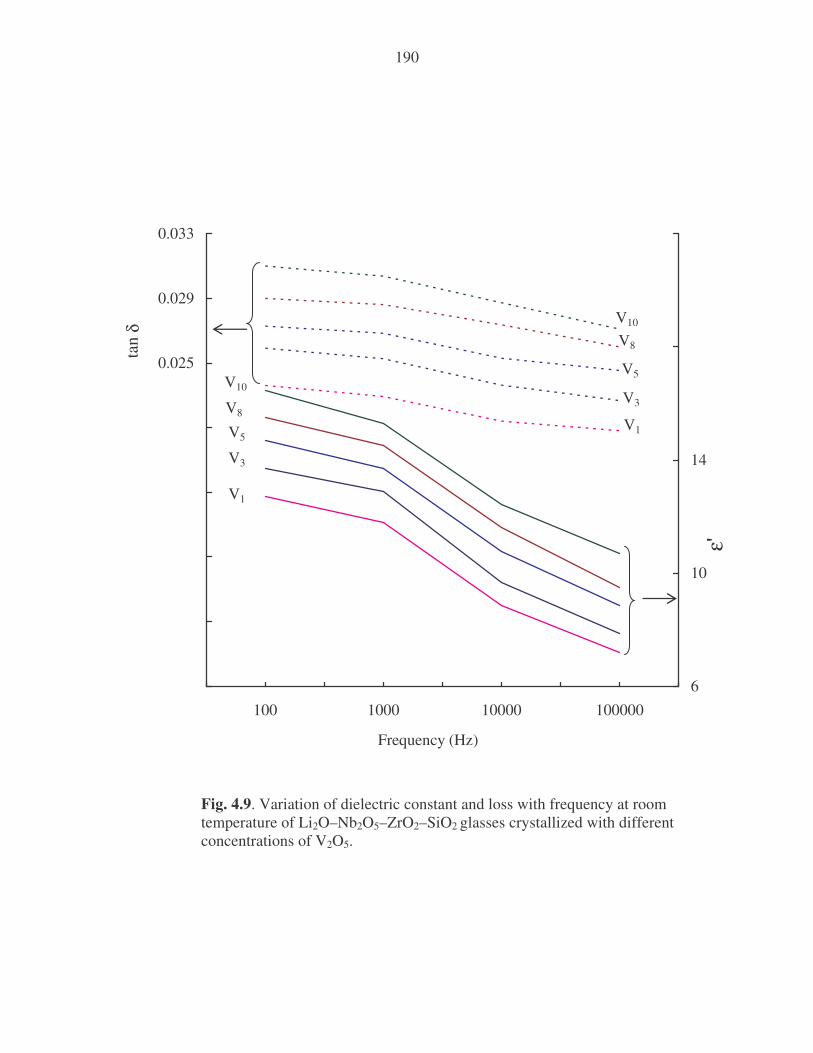
4.4.5 Dielectric properties
The dielectric constant ε' and loss tan δ at room temperature ( 30 oC) of
V2O5 free Li2O–Nb2O5–ZrO2–SiO2 pre-crystallized glasses at 100 kHz are
measured to be 6.45 and 0.018 respectively. Fig. 4.9 represents the variation of
dielectric constant and loss with frequency at room temperature of Li2O–Nb2O5–
ZrO2–SiO2 glasses crystallized with different concentrations of V2O5. The
parameters, ε' and tanδ are observed to increase with a decrease in frequency
exhibiting larger values for the samples crystallized with higher content of V2O5 at
any frequency.
The temperature dependence of dielectric constant of Li2O–Nb2O5–ZrO2–
SiO2 glass and glass ceramic samples containing 0.1 and 1.0 mol% of V2O5
measured at different frequencies is presented in Figs. 4.10 (a) and (b) respectively.
188
700 750 800 850Wavelength (nm)
Lum
inio
us in
tens
ity (a
.u.)
2E 2T2
V1
V3
V5
V8
V10
Fig. 4.8. Photoluminescence spectra of Li2O–Nb2O5–ZrO2–SiO2: V2O5 glass ceramics excited at wavelength corresponding to the transition 2B2
2B1
recorded at room temperature.
189
The close look of these figures clearly suggests that the rate of increase of ε with
temperature is higher for the glass ceramic samples when compared with that of
pre–crystallized glass samples. Further, the comparison of these data for the
samples crystallized with different concentrations of V2O5 (Fig. 4.10(c)) clearly
suggest that for the samples crystallized with higher concentrations of V2O5. ε'
increases with temperature at faster rates. The dielectric properties both constant
and loss were measured in the temperature range 30-300 oC while heating and
cooling. During this process no hysteresis loss is observed.
A comparison plot of variation of tan δ with temperature, measured at a
frequency of 10 kHz for Li2O–Nb2O5–ZrO2–SiO2 glasses crystallized with
different concentrations of V2O5 are presented in Fig. 4.11. The inset of this figure
represents the temperature dependence of tanδ for the sample V3 at different
frequencies. These curves have exhibited distinct maxima; with increase in
frequency the temperature maximum of tanδ shifts towards higher temperatures
and with increase in temperature, the frequency maximum shifts towards higher
frequencies, indicating the relaxation character of dielectric losses in these glass
ceramics. From these curves, it is also observed that the region of relaxation shifts
towards lower temperatures (with broadening of relaxation peaks and increasing
value of (tan δ)max) with increase in the concentration of the nucleating agent. The
effective activation energy Wd for the dipoles evaluated from these plots, is found
to decrease gradually with increase in the concentration of the
190
0.005
0.009
0.013
0.017
0.021
0.025
0.029
0.033
100 1000 10000 1000006
10
14
18
22
Frequency (Hz)ε'
tan
δ
V1
V3
V5
V10
V8V1
V3
V5
V10
V8
Fig. 4.9. Variation of dielectric constant and loss with frequency at room temperature of Li2O–Nb2O5–ZrO2–SiO2 glasses crystallized with different concentrations of V2O5.

191
5
10
15
20
25
30
0 50 100 150 200 250 300
Series3
Series4
Temperature (oC)
0
20
40
60
80ε'
1 kHz
1 kHz
10 kHz
10 kHz
100 kHz
100 kHz
(b)
Pre-crystallized V1
Crystallized V1
1 kHz
10 kHz
100 kHz
ε'
10
30
50
70
0 100 200 300Temperature (oC)
ε'
V1
V3
V5
V10
V8
(c)
(a)
Fig. 4.10. The temperature dependence of dielectric constant of Li2O–Nb2O5–ZrO2–SiO2 glass and glass ceramic samples containing (a) 0.1 and (b) 1.0 mol% V2O5 measured at different frequencies (c) comparison of dielectric constant of Li2O–Nb2O5–ZrO2–SiO2 glass ceramics crystallized with different concentrations of V2O5.
192
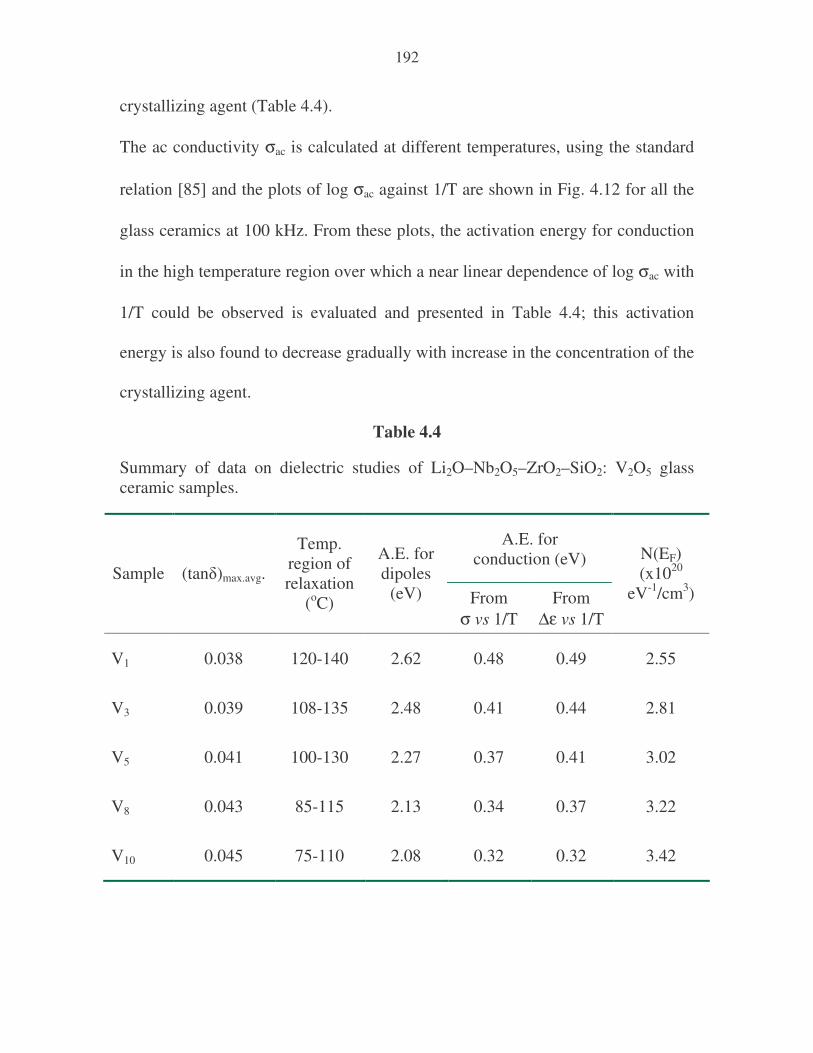
crystallizing agent (Table 4.4).
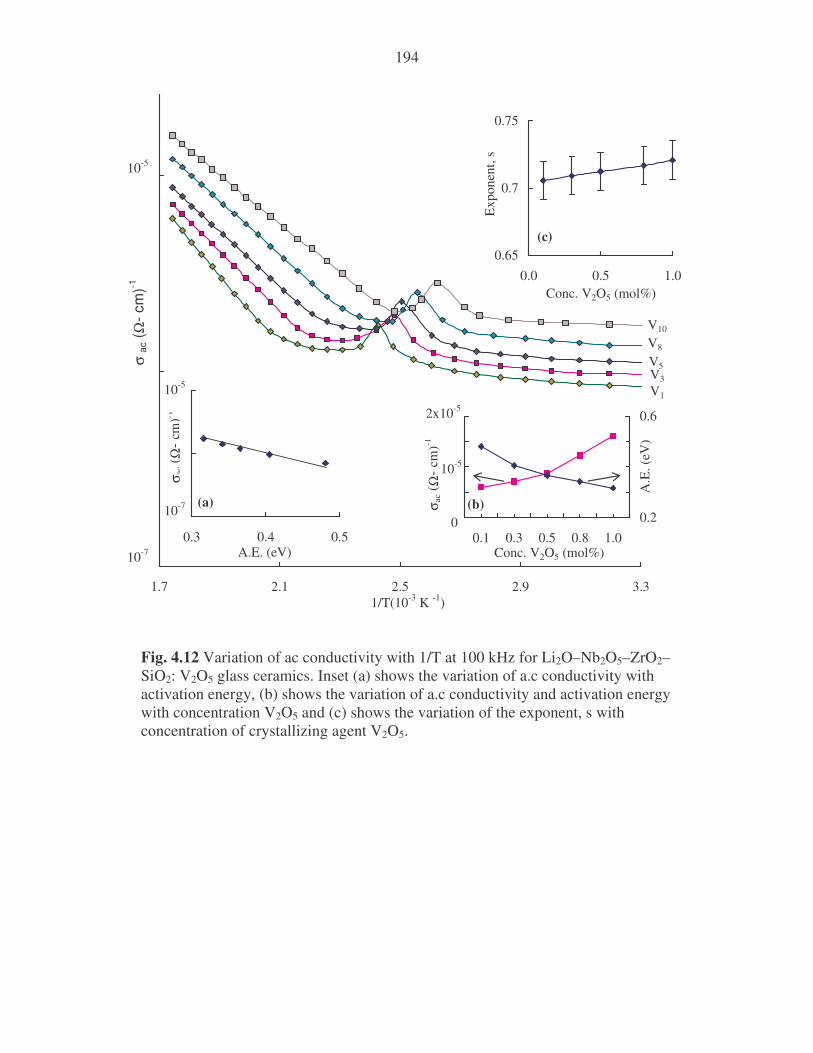
The ac conductivity σac is calculated at different temperatures, using the standard
relation [85] and the plots of log σac against 1/T are shown in Fig. 4.12 for all the
glass ceramics at 100 kHz. From these plots, the activation energy for conduction
in the high temperature region over which a near linear dependence of log σac with
1/T could be observed is evaluated and presented in Table 4.4; this activation
energy is also found to decrease gradually with increase in the concentration of the
crystallizing agent.
Table 4.4
Summary of data on dielectric studies of Li2O–Nb2O5–ZrO2–SiO2: V2O5 glass ceramic samples.
A.E. for conduction (eV)
Sample (tan)max.avg.
Temp. region of relaxation
(oC)
A.E. for dipoles
(eV) From σ vs 1/T
From ∆ε vs 1/T
N(EF) (x1020
eV-1/cm3)
V1 0.038 120-140 2.62 0.48 0.49 2.55
V3 0.039 108-135 2.48 0.41 0.44 2.81
V5 0.041 100-130 2.27 0.37 0.41 3.02
V8 0.043 85-115 2.13 0.34 0.37 3.22
V10 0.045 75-110 2.08 0.32 0.32 3.42

193
0.00
0.04
0.08
0.12
0.16
0 100 200 300
Temperature (oC)
Tan
δ
0.00
0.05
0.10
0.15
0 100 200 300
Temperature (oC)
Tan
δ
100 kHz
10 kHz
1 kHz
V1
V3
V5
V10
V8
Fig. 4.11 Comparison plot of variation of tan δ with temperature, measured at a frequency of 10 kHz for Li2O–Nb2O5–ZrO2–SiO2 glasses crystallized with different concentrations of V2O5. Inset shows the variation of Tan δ with temperature at different frequencies for the sample V3.
194
1.7 2.1 2.5 2.9 3.3
σ ac
( Ω- c
m)-1
1/T(10-3 K -1)
V1
V3
V5
V10
V8
0.1 0.3 0.5 0.8 1.00.2
0.6σ a
c (Ω
- cm
)-1
Conc. V2O5 (mol%)
(b)
2x10⁻⁵
10-5
0
A.E
. (eV
)
0.3 0.4 0.5A.E. (eV)
σ ac (
Ω- c
m)-1
(a)10-7
10-5
10-5
10-7
0.65
0.7
0.75
0.0 0.5 1.0
Exp
onen
t, s
Conc. V2O5 (mol%)
(c)
Fig. 4.12 Variation of ac conductivity with 1/T at 100 kHz for Li2O–Nb2O5–ZrO2–SiO2: V2O5 glass ceramics. Inset (a) shows the variation of a.c conductivity with activation energy, (b) shows the variation of a.c conductivity and activation energy with concentration V2O5 and (c) shows the variation of the exponent, s with concentration of crystallizing agent V2O5.

195
4.5 Discussion
Among various constituents of Li2O–Nb2O5–ZrO2–SiO2: V2O5 glass
ceramics, SiO2 is one of the most common glass-formers and participates in the
glass network with tetrahedral [SiO4/2]0 units and all the four oxygens in SiO4
tetrahedral are shared. On addition of modifiers like Li2O and vanadyl ions, the Si–
O–Si linkage is broken and form Si–O− termination. Thus, the structure is
depolymerised or modified. The modification, results in the formation of meta,
pyro and ortho-silicates in the order: [SiO4/2]0, [SiO3/2O]−, [SiO2/2O2]2−,
[SiO1/2O3]3− and [SiO4]
4− which are designated as Q4, Q3, Q2, Q1 and Q0,
respectively [86].
Nb2O5 belongs to the intermediate class of glass forming oxides; it is an
incipient glass network former and as such does not readily form the glass due to
the fact that the Nb–O bonds in Nb2O5 polyhedron, are highly rigid when
compared with those in the conventional glass forming oxides like B2O3, GeO2 but
does participate in the glass forming in the presence of modifiers like Li2O. In the
glasses containing Nb2O5, the niobium ions are often incorporated into the glass
matrix as NbO6 octahedra with well resolved features. This is also quite clear from
the IR spectra. The band observed in the spectral region 850-860 cm-1 is an
indicative of the presence of isolated NbO6 distorted octahedra with one terminal
(non-bridging) Nb–O bond [87]; secondly the band at 700 cm-1 is the suggestive of
formation of chains composed by corner shared NbO6 octahedra and yet, another
band observed at 600 cm-1 reveals the formation of a three-dimensional (3D)

196
network by less distorted corner shared NbO6 octahedra [88]. The close look at
various band positions in the IR spectra points out that the linkages of the type
Nb–O–Zr, Nb–O–V are also quite possible in these glass ceramics. Zirconium ions
in general do participate in the glass network with ZrO4 structural units and
alternate with SiO4 structural units and also forms the linkages with NbO6 units as
mentioned above.
The entry of Li+ ions, may modify these linkages as per the following relations:
Nb-O-Zr + Li2O Nb-O-Li+ + Zr-O-Li+
Si-O-Zr + Li2O Si-O-Li+ + Zr-O-Li+.
As a consequence we expect, there is a disruption in the SiO4 and ZrO4 tetrahedral
linkages with the creation of number of dangling bonds and non-bridging oxygens
in the glass ceramic.
Vanadium ions are expected to exist mainly in V5+ states in the Li2O–
Nb2O5–ZrO2–SiO2: V2O5 glass ceramic. However, during the melting, annealing
and crystallization processes it is quite certain for the following redox equilibrium
to take place:
2V5++O2- 2V4++1/2 O2
The V5+ ions take part network forming positions with VO5 structural units
(in fact in the IR spectra a band due to the vibrations of V=O groups in VO5
trigonal bipyramids is observed at about 978 cm-1) and form linkages of the type
V–O–Si (with SiO4) and V–O–Zr (with ZrO4 structural units). The V4+ ions form
vanadyl complexes (VO2+), act as modifiers and distort the glass network similar
197
to lithium ions. In this type of glass ceramics there is also a possibility to reduce a
small fraction of V5+ ions to diamagnetic V3+ ions [89].
The progressive introduction of crystallizing agent V2O5 caused a slight
increase in the density (or decrease in molar volume) of the glass ceramic. The
degree of structural compactness, the modification of the geometrical
configuration of the glassy network, the size of the micro-crystals formed, changes
in the coordination of the glass forming ions and the fluctuations in the dimensions
of the interstitial holes are the some of the factors that are responsible for the
observed fluctuations in the density.
The formation of Li2V2O5, Nb6V2O19, Nb2V2O9 crystalline phases detected
from the XRD studies emphasizes the presence of vanadium ions in V4+ state in
addition to V5+ state in these glass ceramics. The relative increase in the intensity
of the diffraction peaks due to these crystallites also indicates an increasing
concentration of vanadyl complexes with the increase in the concentration of
nucleating agent in the glass matrix.
The appearance of peaks due to multiple exothermic effects in the DTA
pattern advocates the presence of different phases of crystallization in the samples.
The crystallization in the glass samples may take place following the surface and
bulk nucleations. The general shape of the crystallization peak in DTA curves
reflects the variation of enthalpy. The observed increase in value of enthalpy (area
under the crystallization peaks) with increase in the nucleating agent suggests that
198
the crystallization starts initially inside the material and expands to the surface
gradually [90].
On the basis of energy level scheme provided by Ballhausen and Gray [84],
for molecular orbitals of VO2+ (3d1) ion in a ligand field of C4v symmetry situated
in an octahedral field with tetragonal distortion, three bands corresponding to the
2B22B1 (∆ ), 2B22E (∆||) and 2B22A1 transitions were predicted in the
absorption spectra. In the spectra of the investigated glass ceramics, only the first
two bands are observed. As the content of the nucleating agent V2O5 continues to
increase, a gradual growth of these bands with a slight shift of the meta-centre
towards higher wavelength could clearly be seen; this observation is an evocative
of increase in the rate of reduction of V5+ ions to VO2+ (vanadyl) ions in the glass
ceramic. Further, the optical activation energy associated with 2B2→2B1 is
decreased from 1.95 (sample V1) to 1.85 eV (sample V10) with the increase in the
content of crystallizing agent; this is clearly a characteristic signal of inter valence
transfer or a polaronic type of absorption. This is possible when the associated
electrons are trapped at shallow sites within the main band gap with smaller wave-
function radii; in terms of polaronic perception, this kind of situation is only
possible if the local potential fluctuation is small as compared to the transfer
integral, j. A small overlap between electronic wavefunctions (corresponding to
adjacent sites) due to strong disorder is contributive to polaron formation. So from
the polaronic viewpoint, the electron delivered by the impurity atom at the V5+ site
converts this into a lower valence state V4+, and at the next stage, the trapped
199
electron at this V4+ site is transferred to the neighboring new V5+ site by absorbing
a photon energy. Thus the optical absorption in the glass ceramic samples is
dominated by polaronic transfer between the V4+ and V5+ species [91].
The VO2+ ions are expected to participate in the depolymerisation of the
glass ceramic network, create more bonding defects and non-bridging oxygens
(NBOs) as mentioned earlier. With the increase in concentration of vanadyl ions in
the glass ceramic network, a large number of donor centers are created, and
subsequently, the excited states of localized electrons originally trapped on V4+
sites begin to overlap with the empty 3d states on the neighboring V5+ sites, and as
a result, the impurity or polaron band becomes more extended into the main band
gap. This new polaronic development might have shifted the absorption edge to
the lower energy (Table 4.2) which leads up to a significant shrinkage in the band
gap as the concentration of V2O5 is increased. Further, it may be worth mentioning
here that the interactions between the ligand preliminary 2pO delocalized states
and the highly localized d-levels of the vanadium ions might also contribute to
such charge transfer.
Excitation of Li2O–Nb2O5–ZrO2–SiO2: V2O5 glass ceramic samples with
the wavelength corresponding to 2B22B1, resulted a broad emission band (Fig.
4.8). Since the wavelength of this band is close to the maximum of the band
2B22E, this band is attributed to 2E2T2 transition of V4+ ions; the emission
band is relatively broad and structure less. With increase in the concentration of
V2O5, the intensity of the peak is observed to increase with a red shift. The shift of
200
this PL peak, the shape and the structured nature of the PL emission band are a
signature of shallow levels with an electron–phonon coupling. The distortion of
the luminescence band in the lower energy side is probably due to the reabsorption
by V3+ ions if any in the glass network [92]. Overall the increase in the intensity of
the band with increase in the concentration of V2O5 suggests the increasing
presence of vanadyl ions in the glass ceramic samples.
The ESR spectra observed for the titled glass ceramics by and large
resembles the spectra of previously studied glasses [13, 14]. The spectra consist of
the well-resolved hyperfine structure with eight components of the electron-
nuclear interactions (corresponding to eight values of nuclear magnetic quantum
numbers: MI = –7/2, –5/2, . . . , +7/2 in accordance with selection rules ∆MI = 0
and ∆Ms = ±1. The variations in the ESR line-shape and the intensity in the other
glass systems have been previously explained by a number of investigators on the
basis of variations in the concentration of V4+ ions. In the present case also, the
change in the V4+/Vtot ratio seems to be one of the reasons for the variations in the
line-shape. Additionally other factors mentioned below will also contribute for
such variations in the spectra. In the glass ceramic samples the jumping frequency
of the charge carriers (V4+V5+) is proportional to exp(–W/kT) [93], where
W=1/2 WD + WH; in this, WD is the mean energy difference between adjacent
vanadium sites due to the disordered nature of the glass ceramic and WH is the
activation energy for the, hopping process of the polarons between two identical
sites. In the case of samples containing low content of V2O5, it is possible to
201
suppose that the leading term is WD, and that the jumping rate of the polaron is
low; this fact, together with the relative low concentration of the paramagnetic
species accounts for the weak ESR signal in samples V1 and V2. It may be noted
here that though the jumping frequency of polarons depends on temperature, this
dependence is hardly expected in the present case [94]. The quantitative analysis
of ESR results indicates that the ratio ⊥
∆∆ gg||
is observed to decrease (Table 4.3)
gradually with concentration of V2O5, indicating an increasing degree of distortion
(elongation) of the VO6 octahedron.
Recollecting the data on dielectric properties of Li2O–Nb2O5–ZrO2–SiO2:
V2O5 glass ceramics, with the gradual increase of V2O5, the values of ', tan δ and
σac are found to increase at any frequency and temperature and the activation
energy for a.c conduction is observed to decrease; this observation indicates an
increase in the space charge polarization owing to the enhanced degree of disorder
in the glass network. In other words, as the concentration of V2O5 is increased in
the glass network, there is a growing presence of V4+ ions in the glass network (as
is evidenced from the spectroscopic studies); these ions similar to Li+ ions disrupt
the glass network by creating dangling bonds and non-bridging ions The defects
thus produced create easy path ways for the migration of charges that would build
up space charge polarization leading to the increase in the dielectric parameters as
observed [95, 96].
202
The variation of ' with temperature can be connected to frequency through
modified Debye equation as reported earlier [97]. A plot of log (') against 1/T
(where is the difference between dielectric constant at any temperature T and
that at room temperature) at 1 kHz for all the glasses in the high temperature
region is shown in Fig. 4.13; the graphs obtained are straight lines in the high
temperature region. The computed activation energies are furnished in Table 4.4;
this value is practically the same as the activation energy for ac conduction in the
same temperature region for these glass ceramics. This seems to suggest that the
charge carriers responsible for change in ' and ac with temperature in this
temperature region are the same.
The variation of dielectric loss with the temperature for Li2O–Nb2O5–ZrO2–
SiO2: V2O5 glass ceramics exhibited the relaxation character. Earlier studies on
variety of glasses containing d1 ions like W5+, Cr5+, Mo5+, Ti3+ etc., showed that
these ions contribute to the dielectric relaxation effects [15–18]; hence, the
observed relaxation effects in the present glass ceramic samples can safely be
attributed to V4+ ions. The increase in the breadth and the intensity of the
relaxation peaks also supports the view point that there is a gradual increase in the
concentration of vanadyl ions (which participate in the relaxation effects) with
increase of content of V2O5 in these glass ceramics. Such variations of loss tangent
with the temperature also indicate that there is a spreading of relaxation times of
dipoles; this may be understood due to experience of an approximately random
potential energy on diffusing through the distorted structure of Li2O–Nb2O5–

203
ZrO2–SiO2: V2O5 glass ceramic network by the dipoles [98]. The decreasing value
of activation energy for dipoles with increase in the content of the crystallizing
agent V2O5 (Table 4.4), suggests an increasing degree of freedom for dipoles to
orient in the field direction.
1
10
100
1.75 1.85 1.95 2.05 2.15
1/T(10-3 , K-1)
∆ε'
V1
V3
V5
V10
V8
Fig. 4.13 Plot of log (') vs 1/T.
204
When a plot is made between log σ(ω) vs activation energy for conduction (in the
high temperature region) a near linear relationship is observed (inset (a) of Fig.
4.12); this observation suggests that the conductivity enhancement is directly
related to the thermally stimulated mobility of the charge carriers in the high
temperature region. The increase of conductivity and decrease in activation energy,
with V2O5 content (inset (b) of Fig. 4.12) is observed for the studied glass
ceramics; a number of independent earlier studies have confirmed that such
behavior represents the hopping process of conduction. In the present context, the
decreasing electronic hopping distance between V4+ and V5+ ions can be assumed
to be responsible for increase of conductivity with the content of V2O5. However,
the contribution from the movement of lithium ions to the increase in the
conduction should also be taken into consideration. This type of composition
dependence of conductivity is quite conventional in the glasses containing
monovalent cations like Li+ and transition metal ions like vanadium. The
conductivity is observed to increase slowly with increase in the concentration of
V2O5 up to 0.3 mol% and beyond this concentration the conductivity is observed
to increase at a faster rate (inset (b) of Fig. 4.12). The polarons involved in the
process of transfer from V4+ to V5+, are attracted by the oppositely charged Li+
ions. This cation-polaron pair moves together as a neutral entity. As expected, the
migration of this pair inhibits the net displacement of the charge and hence a lower
magnitude of increase of conductivity could be observed in the samples containing
low concentration of V2O5.
205
The frequency response of real part of ac conductivity is normally
described by power law dependence with s as exponent:
10],)/(1[)(' <≤+= sscdc ωωσωσ (4.1)
ωC is the characteristic macroscopic relaxation frequency
Within the framework of the linear-response theory, the frequency-dependent
conductivity can be related to
dtetrkTHnq ti
R
c ωωωσ −∞
−=0
222
)(6
)( (4.2)
where q is the charge, nc is the mobile ion density, )(2 tr is the mean square
displacement of the mobile ions and HR is the Haven ratio (lies in between 0.2 and
1.0) [99] which represents the degree of correlation between successive hops. A
more detailed description of the frequency response of ac conductivity can be
found in Ref [100].
At short times, when the mean square displacement )(2 tr of ions is small then it
is ~ t1-s, the ion transport is characterized by the non-random forward-backward
hopping process, under these conditions Eq. (4.1) modifies to
σ (ω) ∝ ωs
The variation of the exponent (obtained by plotting log σ (ω) vs ω) is slightly
increased with increasing content of crystallizing agent V2O5 (inset (c) of Fig.
4.12). Such increase suggests that dimensionality of conduction space increases in
proportion to the content of V2O5 in the glass ceramic [101, 102].
206
The a.c conductivity in the low temperature region (where the conductivity
is nearly temperature independent) can be understood based on quantum
mechanical tunneling model. Based on Austin and Mott’s model (quantum
mechanical tunneling model) [103], the density of the energy states near the Fermi
level, N(EF), at nearly temperature independent region of the conductivity (low
temperature) is evaluated using
σ(ω) = (π/3)e2KT [N(EF)]2 α-5ω [ ln(νo/ω) ]4 (4.3)
where α is the electronic wavefunction decay constant (obtained by plotting log
σac against inter ionic distance Ri) and νph ~ 5x10¹² Hz, ν0 is the phonon frequency,
and presented in the Table 4.4. The value of N(EF) is found to increase gradually
from the sample V1 to V10, indicating a growing degree of disorder with increase
in the content of V2O5 in the glass network.
Our observations on dielectric parameters of Li2O–Nb2O5–ZrO2–SiO2:
V2O5 glass ceramics as mentioned earlier, indicate, the rate of increase of
tan (which is inversely proportional to breakdown strength [85]) with
temperature is increasing with the content of V2O5. Thus the experiments on
dielectric properties of these glass ceramics also reveal that there is a decrease in
the dielectric breakdown strength with increase in the concentration of
crystallizing agent V2O5. These revelations are also consistent with the view that
there is a gradual increase in the concentration of V4+ ions that act as modifiers
and decrease the insulating strength of the glass ceramic samples.
207
4.6 Conclusions
Multi component Li2O–Nb2O5–ZrO2–SiO2 glasses have been crystallized
with different concentrations of V2O5 as nucleating agent. The characterization of
the samples by SEM, XRD and DTA techniques have indicated that the samples
contain well defined and randomly distributed grains of different crystalline
phases. The IR spectral studies indicated that the glass ceramic samples contains
various structural units with the linkages of the type Si-O-Si, Nb−O−Nb, Zr–O–Zr,
Si–O–V, Nb−O−V; the increasing content of V2O5 in the glass ceramics seemed to
have weakened such linkages. The analysis of the results of optical absorption,
ESR and photoluminescence spectra of the studied glass ceramics have indicated
that a considerable proportion of vanadium ions do exist in V4+ state in addition to
V5+ state, and the redox ratio increases with increase in the concentration of
crystallizing agent V2O5. The analysis of the results of dielectric studies has
suggested a decrease in the insulating character with increase in the crystallizing
agent of these samples. A.C. conductivity in the high temperature region seems to
be connected mainly with the polarons involved in the process of transfer from V4+
to V5+. The low temperature (or the nearly temperature independent) part of
conductivity could be explained on the basis of quantum mechanical tunneling
model.
208
References
[1] A.A. Lipovskii, Y. Kaganovskii, V.G. Melehin, D.K. Tagantsev, O.V. Yanush, J. Non–Cryst. Solids 354 (2008) 1245.
[2] C.H. Song, M. Kim, H.W. Choi, Y.H. Kim, Y.S. Yang, J. Kor. Phys. Soc. 55 (2009) 846.
[3] T. Honma, D. Oku, T. Komatsu, Solid State Ionics 180 (2009) 1457.
[4] I.W. Donald, B.L. Metcalfe, R.N.J. Taylor, J. Mater. Sci. 32 (1997) 5851.
[5] T.L. White, W.D. Bostic, C.T. Lson, C.R. Schaich Work Shop on Vitrification of Low Level Waste: The Process and Potential, San Antonio, TX, USA, 1995.
[6] R.R. Goncalves, J.J. Guimaraes, J.L. Ferrari, L.J.Q. Maia, S.J.L. Ribeiro, J. Non–Cryst. Solids 354 (2008) 4846–4851.
[7] K. Fukumi, S. Sakka, J. Mater. Sci. 23 (1988) 2819.
[8] L.F. Santos, L. Wondraczek, J. Deubener, R.M. Almeida, J. Non-Cryst. Solids 353 (2007) 1875.
[9] N. Krishna Mohan, G. Sahaya Baskaran, N. Veeraiah, Phys. Stat. Solidi (a) 203 (2006) 2083.
[10] M.A. Valente, C.C. Silva, A.S.B. Sombra, M.P.F. Graça, J. Non-Cryst. Solids 356 (2010) 800.
[11] S. Banijamali, B.E. Yekta, H.R. Rezaie, V.K. Marghussian, Thermochim. Acta 488 (2009) 60.
[12] R. R. Gonçalves, Y. Messaddeq, A. Chiasera, Y. Jestin, M. Ferrari, S.J.L. Ribeiro, Thin Solid Films 516 (2008) 3094.
[13] I. Nicula, E. Culea, I. Lupsa, J. Non-Cryst. Solids 79 (1986) 325.
[14] Y. Li, K. Liang, J. Cao, B. Xu, J. Non-Cryst. Solids 356 (2010) 502.
[15] S. Mukherjee, A.K. Pal, J. Phys. : Cond. Matt. 20 (2008) 255202.
[16] A. Gajovi, A. Šanti, I. Djerdj, N. Tomaši, A. Moguš-Milankovi, D. Sheng Su, J. Alloys Compd. 479 (2009) 525.
209
[17] K. Sambasiva Rao, M. Srinivasa Reddy, V. Ravikumar, N. Veeraiah, Mater. Chem. Phys. 111 (2008) 283.
[18] J. Byung-Hae, H. Seong-Jin, K. Hyung-Sun, J. Eur. Cer. Soc. 25 (2005) 3187.
[19] G. Murali Krishna, B. Anila Kumari, M. Srinivasa Reddy, N. Veeraiah, J. Solid State Chem. 180 (2007) 2747.
[20] A. Agarwal, A. Sheoran, S. Sanghi, V. Bhatnagar, S.K. Gupta, M. Arora, Spectrochim. Acta - Part A 75 (2010) 964.
[21] X. Lin-Hua, Z. Guo-Ping, Q. Min, Physica B 405 (2010) 2213.
[22] N. Kerkouri, M. Et-Tabirou, A. Chahine, A. Mazzah, M.C. Dhamelincourt, M. Taibi, J. Optoelectr. Adv. Mater. 12 (2010) 1030
[23] M.E. Gouda, H. Khodair, M.G. El-Shaarawy, Mater. Chem. Phys. 120 (2010) 608.
[24] H. Behzad, M.H. Hekmatshoar, M. Mirzayi, M. Azmoonfar, Ionics 15 (2009) 647.
[25] S.A.E., Ali, F.M. Ezz-Eldin, Nucl. Instr. Meth. Phys. Res., Sec. B 268 (2010) 49.
[26] N.S. Abd El-Aal, H.A. Afifi, Archiv. Acoust. 34 (2009) 641.
[27] G.D. Khattak, A. Mekki, L.E. Wenger, J. Non-Cryst. Solids 355 (2009) 2148.
[28] A. Mekki, G.D. Khattak, L.E. Wenger, J. Electr. Spectr. Rel. Phen. 175 (2009) 21.
[29] L.D. Bogomolova, V.A. Zhachkin, T.K. Pavlushkina, Glass Ceram. 66 (2009) 168.
[30] Y.B. Saddeek, Phil. Mag. 89 (2009) 2305.
[31] W.L. Feng, Phil. Mag. 89 (2009) 1391.
[32] M. Shapaan, E.R. Shabaan, A.G. Mostafa, Physica B 404 (2009) 2058.
[33] Y.V. Kartashov, V.A. Vysloukh, Opt. Lett. 34 (2009) 1228.
[34] W. Sung, J. Won, J. Lee, H. Kim, Mol. Cryst. Liq. Cryst. 499 (2009) 234.
210
[35] F.H. ElBatal, Y.M. Hamdy, S.Y. Marzouk, Mater. Chem. Phys. 112 (2008) 991.
[36] S.H. Kim, O.H. Han, J.P. Kang, S.K. Song, Bull. Korean Chem. Soc. 30 (2009) 608.
[37] H.M.M. Moawad, H. Jain, R. El-Mallawany, J. Phys. Chem. Solids 70 (2009) 224.
[38] Y. Taibi, M. Poulain, R. Lebullenger, L. Atoui, M. Legouera, J. Optoelectr. Adv. Mater. 11 (2009) 34.
[39] H. Farah, J. Am. Ceram. Soc. 91 (2008) 3915.
[40] N. Vedeanu, O. Cozar, I. Ardelean, B. Lendl, D.A. Magdas, Vibr. Spectr. 48 (2008) 259.
[41] M.P. Kumar, T. Sankarappa, A.M. Awasthi, Physica B 403 (2008) 4088.
[42] V. Kundu, R.L. Dhiman, D.R. Goyal, A.S. Maan, J. Optoelectr. Adv. Mater. 10 (2008) 2765.
[43] L. Srinivasa Rao, M. Srinivasa Reddy, M. Rami Reddy, N. Veeraiah, J. Alloys Compd. 464 (2008) 472.
[44] C. Li, Y. Huang, Z. Cui, X. Gao, Z. Gu, J. Chin. Ceram. Soc. 36 (2008) 1288.
[45] S. Rada, M. Culea, M. Rada, E. Culea, J. Mater. Sci. 43 (2008) 6122.
[46] I. Ardelean, O. Cozar, N. Vedeanu, D. Rusu, C. Andronache, J. Mater. Sci. 18 (2007) 963.
[47] M.S. Al-Assiri, Physica B 403 (2008) 2684.
[48] Q.B. Tian, Y. Wang, X.T. Yue, Y.S. Yin, Mater. Sci. Tech. 16 (2008) 543.
[49] I.Z. Hager, Mater. Chem. Phys. 109 (2008) 365.
[50] J.K. Jung, S.K. Song, T.H. Noh, O.H. Han, J. Non-Cryst. Solids 270 (2000) 97.
[51] A. Mekki, G.D. Khattak, D. Holland, M. Chikhota, L.E. Wenger, J. Non-Cryst. Solids 318 (2003) 20.
211
[52] A.M. Ferrari, C. Leonelli, G.C. Pellacani, C. Siligardi, J. Non-Cryst. Solids 315 (2003) 77.
[53] Abd EI-Moneim, Mater. Chem. Phys. 73 (2002) 318.
[54] U. Hoppe, E. Yousef, C. Russel, J. Neuefeind, A.C. Hannon, Solid State Commun.,123 (2002) 273.
[55] O. Cozar, I. Ardelean, I. Bratu, V. Simon, C. Craciun , L. David, C. Cefan, J. Mol. Struct. 563 (2001) 421.
[56] M.A. Salim, P.S. Fodor, L.E. Wenger, J. Non-Cryst. Solids 85 (2001)195.
[57] G.D. Khattak, M.A. Salim, L.E. Wenger, A.H. Gilani, J. Non-Cryst. Solids 262 (2000) 66.
[58] K. Krasowski, M. Wasiucionek, Phys. Stat. Solidi (a) 181 (2000)157.
[59] Maria-Cameljaungureanu, Michri Levy, Jeal-louis Souquet, J. Ceramics. Silikaty 44 (2000) 81.
[60] V. Sudarsan, S.K. Kulshreshtha, J. Non-Cryst. Solids 258 (1999) 20.
[61] K. Sega, H. Kasai, H. Sakata, Mater. Chem. Phys. 53 (1998) 28.
[62] H. Mori, H. Matsuno, H. Sakata, J. Non-Cryst. Solids 276 (2000) 78.
[63] V. Rajendranan, N. Palanivelu, D.K. Modak and B.K. Chaudhuri, Phys. Stat. Solidi (a) 180 (2000) 467.
[64] J. Simockova, P. Miklos, V. Saly, J. Acta Phys. Slovaca, 50 (2000) 685.
[65] H. Takahashi, Y. hakai, Y. Morii, Solid State Ionics 90 (1996) 125.
[66] Y.M. Moustafa, I.A. Gohar, A.A. Megahed and E.L. Mansour, Phys. Chem. Glasses 38 (1997) 92.
[67] O. Attos, M. Massot, M. Aspomoza, J. Non-Cryst. Solids 210 (1997) 163.
[68] L. Murawski, R.J. Barczynski, J. Non-Cryst. Solids 196 (1996) 275.
[69] V.P. Seth, D. Prakash, P. Chand, J. Non-Cryst. Solids 204 (1996) 46.
[70] D. Prakash, V.P. Seth, I. Chand, Prem Chand, J. Non-Cryst. Solids 204 (1995) 46
[71] M. Amano, K. Suzuki, H. Sakata, J. Mater. Sci. 32 (1997) 4325.
212
[72] L.D. Bogomolva, N.A. Krasilnikova, V.L. Bogdanov, V.D. Khalilev, J. Non- Cryst. Solids 188 (1995) 130.
[73] T. Yoko, S. Hayakawa, S. Sakka, J. Non-Cryst. Solids 183 (1995) 73.
[74] A. Ghosh, S. Mandal, S. Hazra, D. Dass, J. Non-Cryst. Solids 183 (1995) 317.
[75] S. Gupta, A. Mansingh, J. Non-Cryst. Solids 181 (1995) 58.
[76] S. Adams, K. Hariharan, J. Maier, Solid State Ionics 75 (1995) 193.
[77] V. Demitrov, Y. Dimitriev, A. Montenero, J. Non-Cryst. Solids 180 (1994) 51.
[78] Powder Diffraction File, Alphabetical Index, Inorganic Compounds 2003, Published by JCPDS – International Centre for Diffraction Data, Newtown Square, PA. 19073.
[79] M. Nakamura, Y. Mochizuki, K. Usami, Y. Itoh, T. Nozaki, Sol. State Commun. 50 (1984) 1079.
[80] T. Uma, M. Nogami, J. Membr. Sci. 334 (2009) 123.
[81] H. Aguiar, J. Serra, P. González, B. León, J. Non-Cryst. Solids 355 (2009) 475.
[82] Y. Yu, X. Wang, Y. Cao, X. Hu, Appl. Surf. Sci. 172 (2001) 260.
[83] Y. Gandhi, N. Venkatramaiah, V. Ravikumar, N. Veeraiah, Physica B 404 (2009) 1450.
[84] J. Ballhausen, H.B. Gray, Inorg. Chem. 1 (1962) 111.
[85] B. Tareev, Physics of dielectric Materials, (Mir Publishers, Moscow, 1979).
[86] K.J. Rao, Structural Chemistry of Glasses (Elsevier, Amsterdam, 2002).
[87] T.V. Bocharova, A.N. Vlasova, G.O. Karapetyan, A.M. Mironov, Inorg. Mater. 46 (2010) 74.
[88] T. Cardinal, E. Fargin, G. Le Flem, S. Leboiteux, J. Non-Cryst. Solids 222 (1997) 228.
[89] C.H. Chung, J.D. Mackenzie, J. Non-Cryst. Solids 42 (1980) 357.

213
[90] A. Marotta, A. Buri, F. Branda, J. Mater. Sci. 16 (1981) 341.
[91] O. Cozar, D.A. Magdas, I. Ardelean J. Non-Cryst. Solids 354 (2008) 1032.
[92] W. Ryba-Romanowski, S. Golab, G. Dominiak-Dzik, M. Berkowski J. Alloys Compd. 288 (1999) 262.
[93] N.F. Mott, J. Non-Cryst. Solids 1 (1968) 1.
[94] F. Momo, A. Sotgiu, E. Baiocchi, M. Bettinelli, A. Montenero J. Mat 17 (1982) 3221.
[95] Y. Gandhi, K.S.V. Sudhakar, T. Satyanarayana, N. Veeraiah, Mater. Chem. Phys. 120 (2010) 89.
[96] T. Satyanarayana, I.V. Kityk, M. Piasecki, P. Bragiel, M.G. Brik, Y. Gandhi, N. Veeraiah, J. Phys. – Cond. Matt. 21 (2009) 245104.
[97] D.K. Durga, N. Veeraiah, J. Mater. Sci. 36 (2001) 5625.
[98] S.R. Elliott, Physics of Amorphous Materials (Longman, Essex, 1990).
[99] H. Kahnt, J. Non-Cryst. Solids 203 (1996) 225.
[100] K. Funke, R.D. Banhatti, S. Brückner, C. Cramer, C. Krieger, A. Mandanici, C. Martiny and I. Ross, Phys. Chem. Chem. Phys. 4 (2002) 3155.
[101] D.L. Sidebottom, Phys. Rev. Lett. 83 (1999) 983.
[102] S. Bhattacharya, A. Ghosh, Phys. Rev. B 70 (2004) 172203.
[103] I.G. Austin, N.F. Mott, Adv. Phys. 18 (1969) 41.


![Indian Constitutional Law Review [ISSN: 2456-8325] Edition V …iclrq.in/editions/jul18/Art6.pdf · Indian Constitutional Law Review [ISSN: 2456-8325] Edition V [July 2018] Published](https://static.fdocuments.in/doc/165x107/5f81a2116ed8d010624d4b00/indian-constitutional-law-review-issn-2456-8325-edition-v-iclrqineditionsjul18art6pdf.jpg)


![Indian Constitutional Law Review [ISSN: 2456-8325] …iclrq.in/editions/jul18/Art3.pdfIndian Constitutional Law Review [ISSN: 2456-8325] Edition V [July 2018] Published by Agradoot](https://static.fdocuments.in/doc/165x107/5e757292f8b9e5405c52d8c6/indian-constitutional-law-review-issn-2456-8325-iclrqineditionsjul18art3pdf.jpg)