Chapter 4.5: Transportation 4.5.1 INTRODUCTION
41
4.5-1 Chapter 4.5: Transportation 4.5.1 INTRODUCTION This chapter evaluates the traffic, parking, transit, and pedestrian conditions for areas potentially affected by the Preferred Alternative. There have been a number of changes in the study area since the 2006 FEIS including changes in the transportation network, existing traffic volumes and traffic patterns, planned development projects, as well as changes in the No Build development for the Farley Complex. The purpose of this chapter is to assess the potential transportation impacts of the Project, taking the changes that have occurred since the 2006 FEIS into account and comparing conditions with the proposed Project to those conditions described in the 2006 FEIS, which concluded that the Project contemplated at that time would not result in any unmitigated significant adverse impacts to traffic, parking, transit, and pedestrian conditions in the respective study areas. OVERVIEW OF TRANSPORTATION ANALYSES IN THE 2006 FEIS As described in Chapter 3, “Project Alternatives,” an FEIS was issued in 2006 pursuant to SEQRA for the Farley/Moynihan Project. The 2006 FEIS included detailed analyses of several technical areas, including: traffic, parking, transit and pedestrians. The transportation analyses in this EA are based in part on the 2006 FEIS analyses and reflect the refined design for Moynihan Station, changes to the Project, and changes to background and future conditions since the 2006 FEIS. 2006 FEIS EXISTING CONDITIONS For the transportation related technical area, the 2006 FEIS provided a description of existing conditions for the year 2005, as well as an assessment of conditions in the future both without and with the previously proposed Project. Much of the baseline analysis of existing conditions reflected the original data gathering and surveys conducted for the Hudson Yards Rezoning and Redevelopment Plan (Hudson Yards project) Final Generic EIS (FGEIS), which was based on a 2003 existing conditions analysis year. The 2003 baseline data was updated to 2005 conditions (the time when work on the EIS was initiated) by including background travel growth and incorporating trip generation for several development projects that were under construction at that time. 2006 FEIS FUTURE WITHOUT THE PREVIOUSLY PROPOSED PROJECT In the 2006 FEIS, the future without the Project was assessed for 2010 and 2015 analysis years using existing conditions as a baseline and adding to it changes known or expected to be in place at various times in the future, including future development projects. When the 2006 FEIS was completed, the Farley Complex was still owned by the USPS. The USPS had already initiated the consolidation of mail processing to the Morgan Facility, and, if the then proposed Project did not go forward, it was anticipated that USPS would continue to
Transcript of Chapter 4.5: Transportation 4.5.1 INTRODUCTION
4.5-1
Chapter 4.5: Transportation
4.5.1 INTRODUCTION
This chapter evaluates the traffic, parking, transit, and pedestrian conditions for areas potentially affected by the Preferred Alternative. There have been a number of changes in the study area since the 2006 FEIS including changes in the transportation network, existing traffic volumes and traffic patterns, planned development projects, as well as changes in the No Build development for the Farley Complex. The purpose of this chapter is to assess the potential transportation impacts of the Project, taking the changes that have occurred since the 2006 FEIS into account and comparing conditions with the proposed Project to those conditions described in the 2006 FEIS, which concluded that the Project contemplated at that time would not result in any unmitigated significant adverse impacts to traffic, parking, transit, and pedestrian conditions in the respective study areas.
OVERVIEW OF TRANSPORTATION ANALYSES IN THE 2006 FEIS
As described in Chapter 3, “Project Alternatives,” an FEIS was issued in 2006 pursuant to SEQRA for the Farley/Moynihan Project. The 2006 FEIS included detailed analyses of several technical areas, including: traffic, parking, transit and pedestrians. The transportation analyses in this EA are based in part on the 2006 FEIS analyses and reflect the refined design for Moynihan Station, changes to the Project, and changes to background and future conditions since the 2006 FEIS.
2006 FEIS EXISTING CONDITIONS
For the transportation related technical area, the 2006 FEIS provided a description of existing conditions for the year 2005, as well as an assessment of conditions in the future both without and with the previously proposed Project. Much of the baseline analysis of existing conditions reflected the original data gathering and surveys conducted for the Hudson Yards Rezoning and Redevelopment Plan (Hudson Yards project) Final Generic EIS (FGEIS), which was based on a 2003 existing conditions analysis year. The 2003 baseline data was updated to 2005 conditions (the time when work on the EIS was initiated) by including background travel growth and incorporating trip generation for several development projects that were under construction at that time.
2006 FEIS FUTURE WITHOUT THE PREVIOUSLY PROPOSED PROJECT
In the 2006 FEIS, the future without the Project was assessed for 2010 and 2015 analysis years using existing conditions as a baseline and adding to it changes known or expected to be in place at various times in the future, including future development projects.
When the 2006 FEIS was completed, the Farley Complex was still owned by the USPS. The USPS had already initiated the consolidation of mail processing to the Morgan Facility, and, if the then proposed Project did not go forward, it was anticipated that USPS would continue to
Moynihan Station Development Project
4.5-2
optimize mail processing operations and development opportunities without the Project. For the No Build analysis in the 2006 FEIS, it was assumed that the USPS would continue to occupy about 650,100 square feet, or just under half the space in the Farley Complex. The uses would have been comprised roughly of the same 265,000 square feet of the USPS retail and office facilities included in the Project’s reasonable worst-case development scenario, along with approximately 400,000 square feet of space for administrative and mail sorting uses. The potential commercial component at the Farley Complex had been assumed to be 436,000 square feet of office space and 248,000 square feet of retail space in the No Build condition.
2006 FEIS FUTURE WITH THE PREVIOUSLY PROPOSED PROJECT
The 2006 FEIS examined two future build years, 2010 and 2015. For purposes of transportation related analyses, the 2006 FEIS assessed two reasonable worst-case development scenarios for the proposed Project. Scenario 1 included the development of Moynihan Station in Phase I by 2010 and the Phase II development of a commercial overbuild at the Farley Complex by 2015. Scenario 2 included the development of Moynihan Station in Phase I by 2010 and the Phase II development of a residential or mixed-use building on the Development Transfer Site, which would be constructed concurrently with Phase I and completed by 2010. The Scenario 2 development analyzed in the 2006 FEIS is essentially the same as the current Preferred Alternative with respect to its development program. Therefore, it is the one used for comparison purposes in this chapter.
Traffic and Parking
A traffic level of service (LOS) analysis was undertaken in 2006, following the guidelines and methodologies outlined in the CEQR Technical Manual, as discussed in Chapter 4.0 “Analytical Framework.” The 2006 FEIS analysis used the most current version of Highway Capacity Manual software, and impacts were determined using CEQR Technical Manual impact criteria. Within the traffic study area, the 2006 FEIS identified significant adverse traffic impacts at 12 intersection locations during one or more analysis hours for the 2010 Build condition. An analysis of the weekday AM, midday, PM and Saturday midday peak hours concluded that there would be traffic impacts at 4, 4, 4, and 11 intersections, respectively. To fully mitigate these impacts, standard mitigation measures were identified for all the project-generated impacts. The 2006 FEIS concluded that the Project, as contemplated at that time, would not result in any unmitigated significant adverse traffic impacts. No significant adverse parking impacts were identified.
Transit and Pedestrians
The 2006 FEIS included a level of service (LOS) analysis for transit and pedestrians that followed the guidelines methodologies outlined in the CEQR Technical Manual. The transit and pedestrian analysis for the proposed Project for the 2010 Build conditions found that there would not be any significant adverse subway impacts. However, the 2006 FEIS concluded that there would be impacts at 14 pedestrian analysis locations. All of the identified adverse impacts could be fully mitigated with standard mitigation measures.
PREFERRED ALTERNATIVE LAND USE COMPONENTS
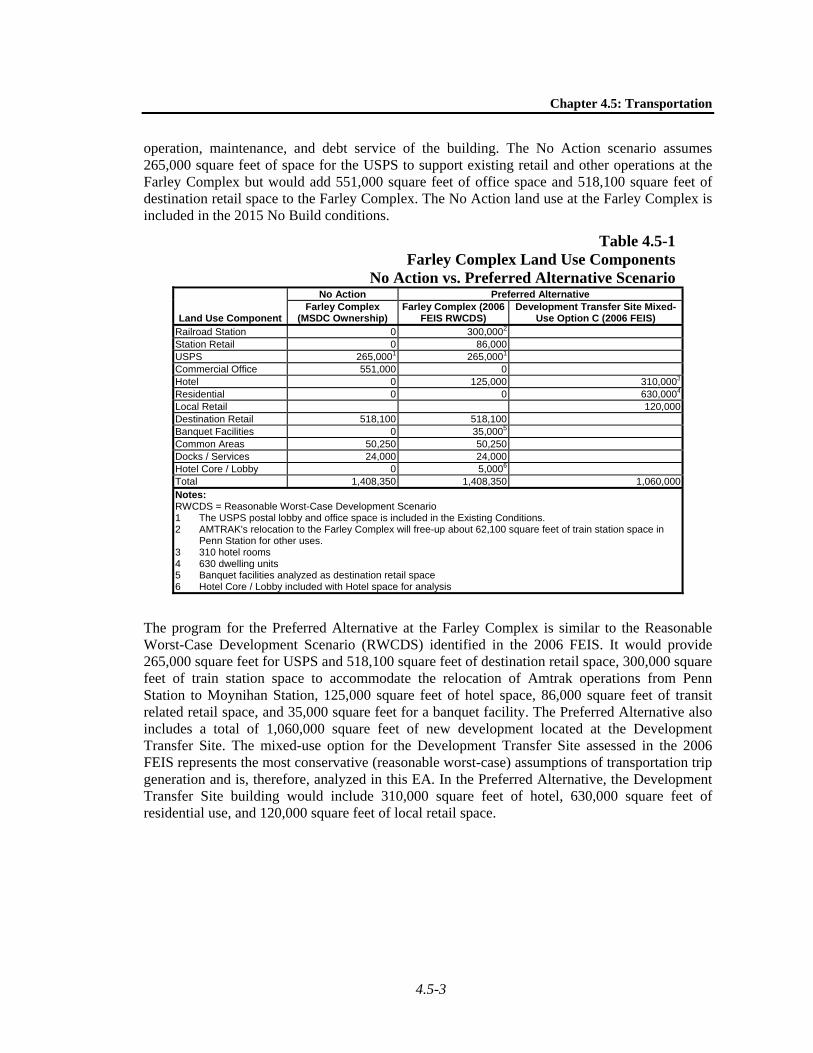
Table 4.5-1 shows the land use components for the Preferred Alternative under two development options, a No Action and a Preferred Alternative scenario. Under the No Action scenario, it is anticipated that some redevelopment would occur at the Farley Complex in order to support the
Chapter 4.5: Transportation
4.5-3
operation, maintenance, and debt service of the building. The No Action scenario assumes 265,000 square feet of space for the USPS to support existing retail and other operations at the Farley Complex but would add 551,000 square feet of office space and 518,100 square feet of destination retail space to the Farley Complex. The No Action land use at the Farley Complex is included in the 2015 No Build conditions.
Table 4.5-1Farley Complex Land Use Components
No Action vs. Preferred Alternative Scenario
Land Use Component
No Action Preferred Alternative Farley Complex
(MSDC Ownership) Farley Complex (2006
FEIS RWCDS) Development Transfer Site Mixed-
Use Option C (2006 FEIS) Railroad Station 0 300,0002 Station Retail 0 86,000USPS 265,0001 265,0001
Commercial Office 551,000 0 Hotel 0 125,000 310,0003
Residential 0 0 630,0004
Local Retail 120,000 Destination Retail 518,100 518,100 Banquet Facilities 0 35,0005
Common Areas 50,250 50,250 Docks / Services 24,000 24,000 Hotel Core / Lobby 0 5,0006
Total 1,408,350 1,408,350 1,060,000 Notes: RWCDS = Reasonable Worst-Case Development Scenario 1 The USPS postal lobby and office space is included in the Existing Conditions. 2 AMTRAK's relocation to the Farley Complex will free-up about 62,100 square feet of train station space in
Penn Station for other uses. 3 310 hotel rooms 4 630 dwelling units 5 Banquet facilities analyzed as destination retail space 6 Hotel Core / Lobby included with Hotel space for analysis
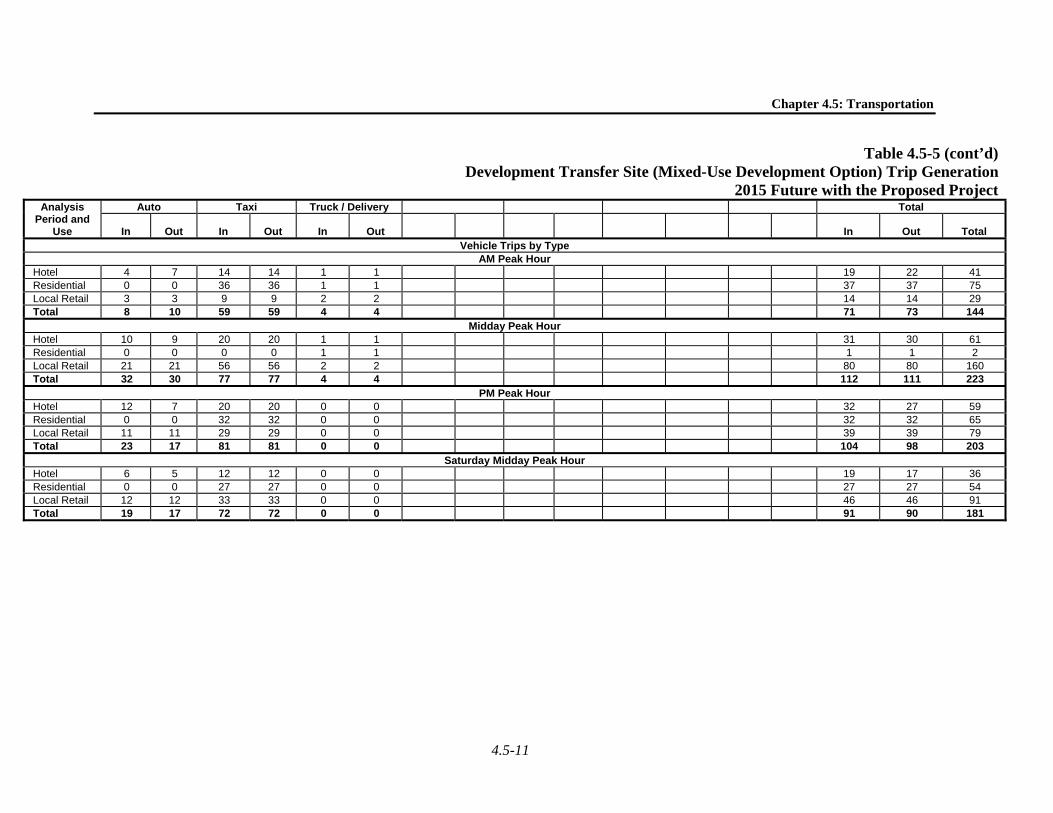
The program for the Preferred Alternative at the Farley Complex is similar to the Reasonable Worst-Case Development Scenario (RWCDS) identified in the 2006 FEIS. It would provide 265,000 square feet for USPS and 518,100 square feet of destination retail space, 300,000 square feet of train station space to accommodate the relocation of Amtrak operations from Penn Station to Moynihan Station, 125,000 square feet of hotel space, 86,000 square feet of transit related retail space, and 35,000 square feet for a banquet facility. The Preferred Alternative also includes a total of 1,060,000 square feet of new development located at the Development Transfer Site. The mixed-use option for the Development Transfer Site assessed in the 2006 FEIS represents the most conservative (reasonable worst-case) assumptions of transportation trip generation and is, therefore, analyzed in this EA. In the Preferred Alternative, the Development Transfer Site building would include 310,000 square feet of hotel, 630,000 square feet of residential use, and 120,000 square feet of local retail space.
Moynihan Station Development Project
4.5-4
4.5.2 TRAVEL DEMAND PROJECTIONS
TRIP GENERATION PROCEDURES
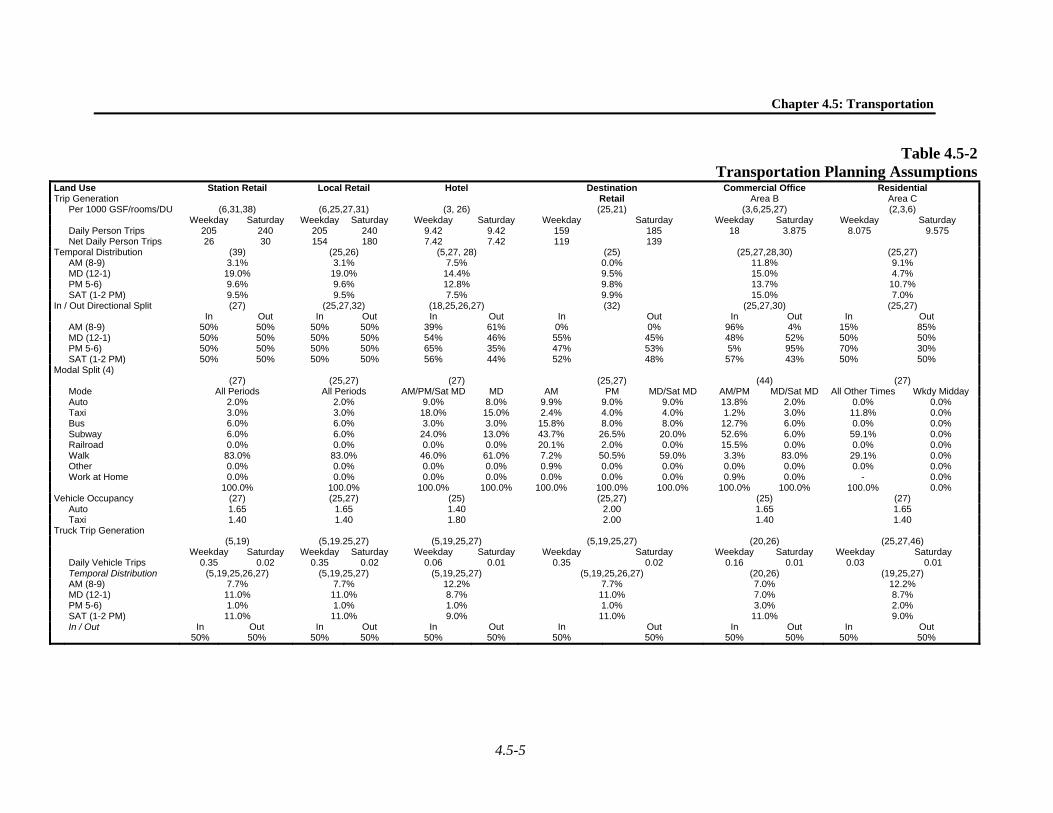
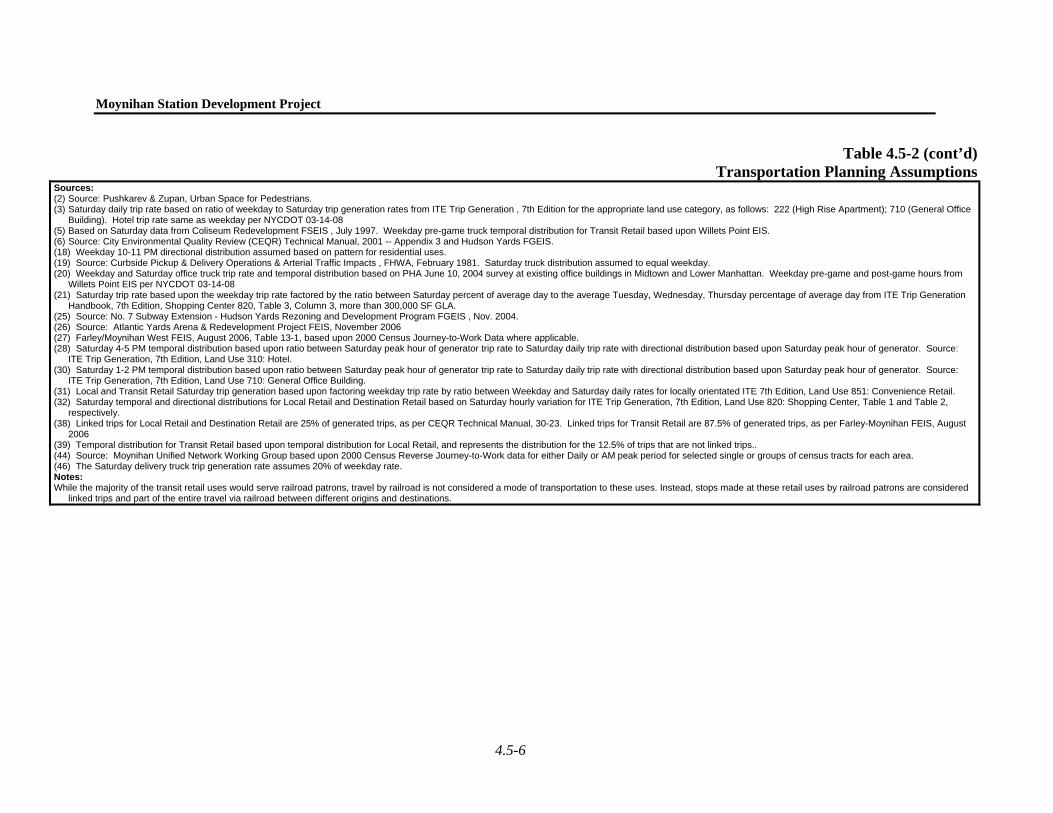
The approach used to determine trip generation followed CEQR Technical Manual guidelines. The transportation planning assumptions shown in Table 4.5-2 are based upon the 2009 Western Rail Yards (WRY) FEIS1. The assumptions used for that project were developed through an inter-agency working group that included the DCP, New York City Department Of Transportation, Hudson Yards Development Corp (HYDC), the Metropolitan Transportation Authority agencies, NJT, and PANYNJ. The working group also included participation from several consultant firms representing various proposed development projects in West Midtown Manhattan, including the Expanded Moynihan Project, a previous variation of the Project that was studied in 2007-2008 and is not currently being pursued. The 2009 WRY FEIS was utilized as the basis of the transportation and traffic planning assumptions of this EA. The WRY traffic study area encompasses the entire traffic network of the Project and it was developed in 2008-2009, making it a practical and suitable source for the analysis in this EA.
TRIP GENERATION ESTIMATES
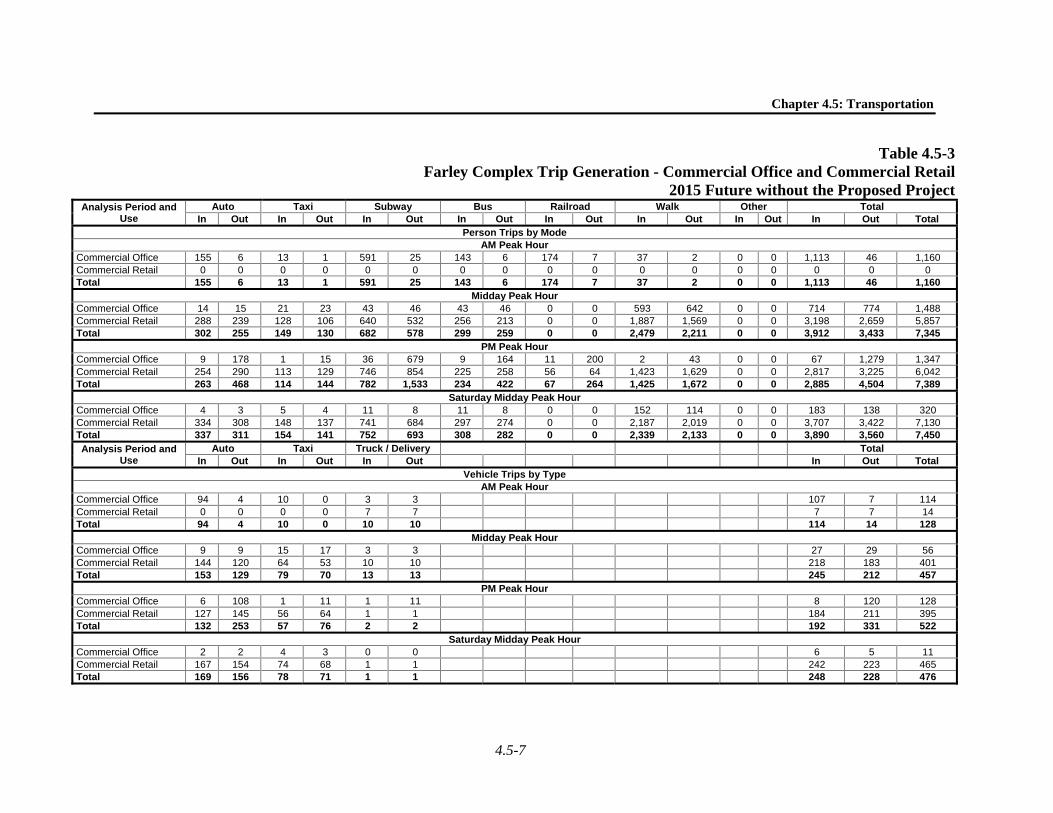
Trip rates developed for specific land uses are based upon the above referenced transportation planning assumptions. The net daily person trip rate per 1,000 gross square feet of development floor area is used for each land use category, which takes into account linked trips with more than one purpose. The resulting trips by mode and analysis hour are summarized in Tables 4.5-3 (2015 No Build–Farley Complex); Table 4.5-4 (2015 Preferred Alternative–Farley Complex), and Table 4.5-5 (2015 Preferred Alternative–Development Transfer Site).
4.5.3 TRAFFIC
TRAFFIC STUDY AREA
The traffic study area has 39 analysis intersections bounded by 35th Street to the north, 28th Street to the south, Sixth Avenue/Broadway to the east, and Tenth Avenue to the west. The study area and the analysis intersections for the current Project are the same as those analyzed in the 2006 FEIS (see Figure 4.5-1).
METHODOLOGY
Traffic volumes reported in the 2006 FEIS for the 2005 Existing, 2010 No Build, and 2010 Build were compared with the corresponding estimated traffic volumes for the 2008 Existing, 2015 No Build, and 2015 Build conditions for the current Project. This included comparing traffic volumes along two screenlines and a cordon line around the study area perimeter, as well as at individual intersection approaches. Any notable volume changes are identified in this analysis and their traffic related implications are discussed.
1 The 2009 WRY FEIS is available at http://www.nyc.gov/html/dcp/html/env_review/western_rail_yard.shtml
Chapter 4.5: Transportation
4.5-5
Table 4.5-2Transportation Planning Assumptions
Land Use Station Retail Local Retail Hotel Destination Commercial Office Residential Trip Generation Retail Area B Area C Per 1000 GSF/rooms/DU (6,31,38) (6,25,27,31) (3, 26) (25,21) (3,6,25,27) (2,3,6) Weekday Saturday Weekday Saturday Weekday Saturday Weekday Saturday Weekday Saturday Weekday Saturday Daily Person Trips 205 240 205 240 9.42 9.42 159 185 18 3.875 8.075 9.575 Net Daily Person Trips 26 30 154 180 7.42 7.42 119 139 Temporal Distribution (39) (25,26) (5,27, 28) (25) (25,27,28,30) (25,27) AM (8-9) 3.1% 3.1% 7.5% 0.0% 11.8% 9.1% MD (12-1) 19.0% 19.0% 14.4% 9.5% 15.0% 4.7% PM 5-6) 9.6% 9.6% 12.8% 9.8% 13.7% 10.7% SAT (1-2 PM) 9.5% 9.5% 7.5% 9.9% 15.0% 7.0% In / Out Directional Split (27) (25,27,32) (18,25,26,27) (32) (25,27,30) (25,27) In Out In Out In Out In Out In Out In Out AM (8-9) 50% 50% 50% 50% 39% 61% 0% 0% 96% 4% 15% 85% MD (12-1) 50% 50% 50% 50% 54% 46% 55% 45% 48% 52% 50% 50% PM 5-6) 50% 50% 50% 50% 65% 35% 47% 53% 5% 95% 70% 30% SAT (1-2 PM) 50% 50% 50% 50% 56% 44% 52% 48% 57% 43% 50% 50% Modal Split (4) (27) (25,27) (27) (25,27) (44) (27) Mode All Periods All Periods AM/PM/Sat MD MD AM PM MD/Sat MD AM/PM MD/Sat MD All Other Times Wkdy Midday Auto 2.0% 2.0% 9.0% 8.0% 9.9% 9.0% 9.0% 13.8% 2.0% 0.0% 0.0% Taxi 3.0% 3.0% 18.0% 15.0% 2.4% 4.0% 4.0% 1.2% 3.0% 11.8% 0.0% Bus 6.0% 6.0% 3.0% 3.0% 15.8% 8.0% 8.0% 12.7% 6.0% 0.0% 0.0% Subway 6.0% 6.0% 24.0% 13.0% 43.7% 26.5% 20.0% 52.6% 6.0% 59.1% 0.0% Railroad 0.0% 0.0% 0.0% 0.0% 20.1% 2.0% 0.0% 15.5% 0.0% 0.0% 0.0% Walk 83.0% 83.0% 46.0% 61.0% 7.2% 50.5% 59.0% 3.3% 83.0% 29.1% 0.0% Other 0.0% 0.0% 0.0% 0.0% 0.9% 0.0% 0.0% 0.0% 0.0% 0.0% 0.0% Work at Home 0.0% 0.0% 0.0% 0.0% 0.0% 0.0% 0.0% 0.9% 0.0% - 0.0% 100.0% 100.0% 100.0% 100.0% 100.0% 100.0% 100.0% 100.0% 100.0% 100.0% 0.0% Vehicle Occupancy (27) (25,27) (25) (25,27) (25) (27) Auto 1.65 1.65 1.40 2.00 1.65 1.65 Taxi 1.40 1.40 1.80 2.00 1.40 1.40 Truck Trip Generation (5,19) (5,19.25,27) (5,19,25,27) (5,19,25,27) (20,26) (25,27,46) Weekday Saturday Weekday Saturday Weekday Saturday Weekday Saturday Weekday Saturday Weekday Saturday Daily Vehicle Trips 0.35 0.02 0.35 0.02 0.06 0.01 0.35 0.02 0.16 0.01 0.03 0.01 Temporal Distribution (5,19,25,26,27) (5,19,25,27) (5,19,25,27) (5,19,25,26,27) (20,26) (19,25,27) AM (8-9) 7.7% 7.7% 12.2% 7.7% 7.0% 12.2% MD (12-1) 11.0% 11.0% 8.7% 11.0% 7.0% 8.7% PM 5-6) 1.0% 1.0% 1.0% 1.0% 3.0% 2.0% SAT (1-2 PM) 11.0% 11.0% 9.0% 11.0% 11.0% 9.0% In / Out In Out In Out In Out In Out In Out In Out 50% 50% 50% 50% 50% 50% 50% 50% 50% 50% 50% 50%
Moynihan Station Development Project
4.5-6
Table 4.5-2 (cont’d)Transportation Planning Assumptions
Sources: (2) Source: Pushkarev & Zupan, Urban Space for Pedestrians. (3) Saturday daily trip rate based on ratio of weekday to Saturday trip generation rates from ITE Trip Generation , 7th Edition for the appropriate land use category, as follows: 222 (High Rise Apartment); 710 (General Office
Building). Hotel trip rate same as weekday per NYCDOT 03-14-08 (5) Based on Saturday data from Coliseum Redevelopment FSEIS , July 1997. Weekday pre-game truck temporal distribution for Transit Retail based upon Willets Point EIS. (6) Source: City Environmental Quality Review (CEQR) Technical Manual, 2001 -- Appendix 3 and Hudson Yards FGEIS. (18) Weekday 10-11 PM directional distribution assumed based on pattern for residential uses. (19) Source: Curbside Pickup & Delivery Operations & Arterial Traffic Impacts , FHWA, February 1981. Saturday truck distribution assumed to equal weekday. (20) Weekday and Saturday office truck trip rate and temporal distribution based on PHA June 10, 2004 survey at existing office buildings in Midtown and Lower Manhattan. Weekday pre-game and post-game hours from
Willets Point EIS per NYCDOT 03-14-08 (21) Saturday trip rate based upon the weekday trip rate factored by the ratio between Saturday percent of average day to the average Tuesday, Wednesday, Thursday percentage of average day from ITE Trip Generation
Handbook, 7th Edition, Shopping Center 820, Table 3, Column 3, more than 300,000 SF GLA. (25) Source: No. 7 Subway Extension - Hudson Yards Rezoning and Development Program FGEIS , Nov. 2004. (26) Source: Atlantic Yards Arena & Redevelopment Project FEIS, November 2006 (27) Farley/Moynihan West FEIS, August 2006, Table 13-1, based upon 2000 Census Journey-to-Work Data where applicable. (28) Saturday 4-5 PM temporal distribution based upon ratio between Saturday peak hour of generator trip rate to Saturday daily trip rate with directional distribution based upon Saturday peak hour of generator. Source:
ITE Trip Generation, 7th Edition, Land Use 310: Hotel. (30) Saturday 1-2 PM temporal distribution based upon ratio between Saturday peak hour of generator trip rate to Saturday daily trip rate with directional distribution based upon Saturday peak hour of generator. Source:
ITE Trip Generation, 7th Edition, Land Use 710: General Office Building. (31) Local and Transit Retail Saturday trip generation based upon factoring weekday trip rate by ratio between Weekday and Saturday daily rates for locally orientated ITE 7th Edition, Land Use 851: Convenience Retail. (32) Saturday temporal and directional distributions for Local Retail and Destination Retail based on Saturday hourly variation for ITE Trip Generation, 7th Edition, Land Use 820: Shopping Center, Table 1 and Table 2,
respectively. (38) Linked trips for Local Retail and Destination Retail are 25% of generated trips, as per CEQR Technical Manual, 30-23. Linked trips for Transit Retail are 87.5% of generated trips, as per Farley-Moynihan FEIS, August
2006 (39) Temporal distribution for Transit Retail based upon temporal distribution for Local Retail, and represents the distribution for the 12.5% of trips that are not linked trips.. (44) Source: Moynihan Unified Network Working Group based upon 2000 Census Reverse Journey-to-Work data for either Daily or AM peak period for selected single or groups of census tracts for each area. (46) The Saturday delivery truck trip generation rate assumes 20% of weekday rate. Notes: While the majority of the transit retail uses would serve railroad patrons, travel by railroad is not considered a mode of transportation to these uses. Instead, stops made at these retail uses by railroad patrons are considered
linked trips and part of the entire travel via railroad between different origins and destinations.
Chapter 4.5: Transportation
4.5-7
Table 4.5-3Farley Complex Trip Generation - Commercial Office and Commercial Retail
2015 Future without the Proposed ProjectAnalysis Period and
Use Auto Taxi Subway Bus Railroad Walk Other Total
In Out In Out In Out In Out In Out In Out In Out In Out TotalPerson Trips by Mode
AM Peak Hour Commercial Office 155 6 13 1 591 25 143 6 174 7 37 2 0 0 1,113 46 1,160 Commercial Retail 0 0 0 0 0 0 0 0 0 0 0 0 0 0 0 0 0 Total 155 6 13 1 591 25 143 6 174 7 37 2 0 0 1,113 46 1,160
Midday Peak Hour Commercial Office 14 15 21 23 43 46 43 46 0 0 593 642 0 0 714 774 1,488 Commercial Retail 288 239 128 106 640 532 256 213 0 0 1,887 1,569 0 0 3,198 2,659 5,857 Total 302 255 149 130 682 578 299 259 0 0 2,479 2,211 0 0 3,912 3,433 7,345
PM Peak Hour Commercial Office 9 178 1 15 36 679 9 164 11 200 2 43 0 0 67 1,279 1,347 Commercial Retail 254 290 113 129 746 854 225 258 56 64 1,423 1,629 0 0 2,817 3,225 6,042 Total 263 468 114 144 782 1,533 234 422 67 264 1,425 1,672 0 0 2,885 4,504 7,389
Saturday Midday Peak Hour Commercial Office 4 3 5 4 11 8 11 8 0 0 152 114 0 0 183 138 320 Commercial Retail 334 308 148 137 741 684 297 274 0 0 2,187 2,019 0 0 3,707 3,422 7,130 Total 337 311 154 141 752 693 308 282 0 0 2,339 2,133 0 0 3,890 3,560 7,450
Analysis Period and Use
Auto Taxi Truck / Delivery TotalIn Out In Out In Out In Out Total
Vehicle Trips by TypeAM Peak Hour
Commercial Office 94 4 10 0 3 3 107 7 114 Commercial Retail 0 0 0 0 7 7 7 7 14 Total 94 4 10 0 10 10 114 14 128
Midday Peak Hour Commercial Office 9 9 15 17 3 3 27 29 56 Commercial Retail 144 120 64 53 10 10 218 183 401 Total 153 129 79 70 13 13 245 212 457
PM Peak Hour Commercial Office 6 108 1 11 1 11 8 120 128 Commercial Retail 127 145 56 64 1 1 184 211 395 Total 132 253 57 76 2 2 192 331 522
Saturday Midday Peak Hour Commercial Office 2 2 4 3 0 0 6 5 11 Commercial Retail 167 154 74 68 1 1 242 223 465 Total 169 156 78 71 1 1 248 228 476

Moynihan Station Development Project
4.5-8
Table 4.5-4. Farley Complex Trip Generation
2015 Future with the Proposed Project Analysis Period and
Use Auto Taxi Subway Bus Railroad Walk Other Total
In Out In Out In Out In Out In Out In Out In Out In Out Total Person Trips by Mode
AM Peak Hour Train Station 2 9 13 65 45 33 22 13 0 0 24 10 0 0 106 130 236 Station Retail 1 1 1 1 2 2 2 2 0 0 29 29 0 0 35 35 69 Hotel 2 4 5 8 7 10 1 1 0 0 12 20 0 0 27 42 70 Commercial Retail 0 0 0 0 0 0 0 0 0 0 0 0 0 0 0 0 0 Banquet Facilities 1 1 1 2 2 3 0 0 0 0 3 5 0 0 8 12 19 Hotel Core / Lobby 0 0 0 0 0 0 0 0 0 0 1 1 0 0 1 2 3 Total 6 15 20 76 56 49 25 17 0 0 69 65 0 0 176 221 397
Midday Peak Hour Train Station 2 2 14 18 11 9 11 4 0 0 4 2 0 0 42 35 77 Station Retail 4 4 6 6 13 13 13 13 0 0 176 176 0 0 212 212 425 Hotel 6 5 11 9 9 8 2 2 0 0 44 37 0 0 72 61 134 Commercial Retail 288 239 128 106 640 532 256 213 0 0 1,887 1,569 0 0 3,198 2,659 5,857 Banquet Facilities 2 1 3 3 3 2 1 1 0 0 12 10 0 0 20 17 37 Hotel Core / Lobby 0 0 0 0 0 0 0 0 0 0 2 2 0 0 3 2 5 Total 302 252 163 143 676 564 282 232 0 0 2,125 1,797 0 0 3,547 2,988 6,535
PM Peak Hour Train Station 10 2 56 16 42 44 42 16 0 0 18 22 0 0 168 100 268 Station Retail 2 2 3 3 6 6 6 6 0 0 89 89 0 0 107 107 215 Hotel 7 4 14 7 19 10 2 1 0 0 36 19 0 0 77 42 119 Commercial Retail 254 290 113 129 746 854 225 258 56 64 1,423 1,629 0 0 2,817 3,225 6,042 Banquet Facilities 2 1 4 2 5 3 1 0 0 0 10 5 0 0 22 12 33 Hotel Core / Lobby 0 0 1 0 1 0 0 0 0 0 1 1 0 0 3 2 5 Total 275 299 190 158 819 918 277 282 56 64 1,577 1,765 0 0 3,195 3,487 6,681
Saturday Midday Peak Hour Train Station 2 2 14 18 11 9 11 4 0 0 4 2 0 0 42 35 77 Station Retail 2 2 4 4 7 7 7 7 0 0 102 102 0 0 123 123 245 Hotel 4 3 7 6 9 7 1 1 0 0 18 14 0 0 39 31 70 Commercial Retail 334 308 148 137 741 684 297 274 0 0 2,187 2,019 0 0 3,707 3,422 7,130 Banquet Facilities 1 1 2 2 3 2 0 0 0 0 5 4 0 0 11 9 19 Hotel Core / Lobby 0 0 0 0 0 0 0 0 0 0 1 1 0 0 2 1 3 Total 343 316 175 166 772 710 316 286 0 0 2,317 2,141 0 0 3,923 3,620 7,544

Chapter 4.5: Transportation
4.5-9
Table 4.5-4. (cont’d) Farley Complex Trip Generation
2015 Future with the Proposed Project Analysis Period and
Use Auto Taxi Truck / Delivery Total
In Out In Out In Out In Out Total Vehicle Trips by Type
AM Peak Hour Train Station 1 6 47 47 0 0 48 53 101 Station Retail 0 0 1 1 1 1 2 2 5 Hotel 2 3 3 4 0 0 5 7 12 Commercial Retail 0 0 0 0 7 7 7 7 14 Banquet Facilities 0 1 1 1 0 0 1 2 3 Hotel Core / Lobby 0 0 0 0 0 0 0 0 0 Total 4 10 51 53 9 9 64 72 136
Midday Peak Hour Train Station 1 1 16 16 0 0 17 17 34 Station Retail 3 3 5 5 2 2 9 9 18 Hotel 4 4 6 5 0 0 10 9 19 Commercial Retail 144 120 64 53 10 10 218 183 401 Banquet Facilities 1 1 2 1 0 0 3 3 5 Hotel Core / Lobby 0 0 0 0 0 0 0 0 1 Total 153 128 92 81 12 12 257 220 478
PM Peak Hour Train Station 7 1 37 37 0 0 44 38 82 Station Retail 1 1 2 2 0 0 4 4 8 Hotel 5 3 8 4 0 0 13 7 20 Commercial Retail 127 145 56 64 1 1 184 211 395 Banquet Facilities 1 1 2 1 0 0 4 2 5 Hotel Core / Lobby 0 0 0 0 0 0 1 0 1 Total 142 151 106 109 1 1 249 261 510
Saturday Midday Peak Hour Train Station 1 1 16 16.00 0 0 17 17 34 Station Retail 1 1 3 3 0 0 4 4 8 Hotel 3 2 4 3 0 0 6 5 12 Commercial Retail 167 154 74 68 1 1 242 223 465 Banquet Facilities 1 1 1 1 0 0 2 1 3 Hotel Core / Lobby 01 0 0 0 0 0 0 0 0 Total 173 159 98 91 1 1 271 251 522

Moynihan Station Development Project
4.5-10
Table 4.5-5 Development Transfer Site (Mixed-Use Development Option) Trip Generation
2015 Future with the Proposed Project Analysis
Period and Use
Auto Taxi Subway Bus Railroad Walk Other Total
In Out In Out In Out In Out In Out In Out In Out In Out Total Person Trips by Mode
AM Peak Hour Hotel 6 9 12 19 16 25 2 3 0 0 31 48 0 0 67 105 173 Residential 0 0 8 47 41 233 0 0 0 0 20 114 0 0 69 394 463 Local Retail 6 6 9 9 17 17 17 17 0 0 238 238 0 0 286 286 573 Total 12 15 29 74 74 275 19 20 0 0 289 401 0 0 423 785 1,208
Midday Peak Hour Hotel 14 12 27 23 23 20 5 5 0 0 109 93 0 0 179 152 331 Residential 0 0 0 0 0 0 0 0 0 0 0 0 0 0 0 0 0 Local Retail 35 35 53 53 105 105 105 105 0 0 1,457 1,457 0 0 1,756 1,756 3,511 Total 49 47 80 76 129 125 111 110 0 0 1,566 1,550 0 0 1,934 1,908 3,842
PM Peak Hour Hotel 17 9 34 19 46 25 6 3 0 0 88 47 0 0 191 103 294 Residential 0 0 45 19 225 97 0 0 0 0 111 48 0 0 381 163 544 Local Retail 18 18 27 27 53 53 53 53 0 0 736 736 0 0 887 887 1,774 Total 35 27 106 64 324 174 59 56 0 0 935 831 0 0 1,459 1,153 2,613
Saturday Midday Peak Hour Hotel 9 7 17 14 23 18 3 2 0 0 44 35 0 0 97 76 173 Residential 0 0 25 25 125 125 0 0 0 0 61 61 0 0 211 211 422 Local Retail 21 21 30 31 62 62 62 62 0 0 852 852 0 0 1,026 1,026 2,052 Total 29 27 73 69 210 205 64 63 0 0 957 948 0 0 1,334 1,313 2,647
Chapter 4.5: Transportation
4.5-11
Table 4.5-5 (cont’d) Development Transfer Site (Mixed-Use Development Option) Trip Generation
2015 Future with the Proposed Project Analysis
Period and Use
Auto Taxi Truck / Delivery Total
In Out In Out In Out In Out Total Vehicle Trips by Type
AM Peak Hour Hotel 4 7 14 14 1 1 19 22 41 Residential 0 0 36 36 1 1 37 37 75 Local Retail 3 3 9 9 2 2 14 14 29 Total 8 10 59 59 4 4 71 73 144
Midday Peak Hour Hotel 10 9 20 20 1 1 31 30 61 Residential 0 0 0 0 1 1 1 1 2 Local Retail 21 21 56 56 2 2 80 80 160 Total 32 30 77 77 4 4 112 111 223
PM Peak Hour Hotel 12 7 20 20 0 0 32 27 59 Residential 0 0 32 32 0 0 32 32 65 Local Retail 11 11 29 29 0 0 39 39 79 Total 23 17 81 81 0 0 104 98 203
Saturday Midday Peak Hour Hotel 6 5 12 12 0 0 19 17 36 Residential 0 0 27 27 0 0 27 27 54 Local Retail 12 12 33 33 0 0 46 46 91 Total 19 17 72 72 0 0 91 90 181
Moynihan Station Development Project
4.5-12
A comprehensive screening analysis was used to identify intersections where potential adverse traffic impacts could occur. Three separate pre-defined conditions were used to screen the 39 intersections within the traffic study area using two sets of threshold criteria for the No Build and incremental Build conditions, respectively. This approach recognized that travel patterns in the study area have changed since the 2006 FEIS; some intersections previously affected by the Project analyzed for the 2010 Build year in the 2006 FEIS may no longer be so affected, while other intersections may experience impacts from the current plan in the 2015 Build year that did not previously occur.
An HCS capacity and level of service analysis was then performed for the intersections identified through this screening analysis. Standard traffic impact criteria from the CEQR Technical Manual were used to compare the 2015 future No Build and 2015 Build conditions to determine whether there would be a significant adverse traffic impact on intersection approaches being analyzed.
Where adverse impacts were found among the 12 intersections identified to have traffic impacts in the 2006 FEIS, the previous mitigation measures are first tested to see whether they would be adequate to mitigate the current impacts. If not, additional standard, low-cost, easily implementable mitigation was developed. Where other intersections were found to experience adverse traffic impacts by the current plan in the 2015 Build year that were not previously identified, a similar approach was used to develop standard mitigation measures. The traffic analysis concluded with a summary of the current findings for the 2015 Build year as compared with the traffic related findings for the 2010 Build year reported in the 2006 FEIS.
EXISTING CONDITIONS
CHANGES TO THE ROADWAY NETWORK
The following summarizes the changes to the roadway network in the study area that have occurred since completion of the 2006 FEIS:
34th Street Reconfiguration and Bus Priority Treatment—West 34th Street between Fifth Avenue and Ninth Avenue has been reconfigured from two through traffic lanes in each direction to one through lane in the eastbound direction and two through lanes in the westbound direction. The curb lane in each direction along 34th Street is designated as a bus only lane throughout the Project study area. Bus lanes are in operation on weekdays with hours of operation varying by roadway segment. West of Eighth Avenue, the bus lanes operate during the AM and PM peak periods from 7-10 AM and 4-7 PM. East of Eighth Avenue, the bus lanes operate during a 12 hour period, between 7 AM and 7 PM. Bus lanes can be used by other vehicles only to make a right turn.
Bicycle Lanes—A bicycle lane has been striped along Eighth Avenue for the entire portion of the study area, and along Ninth Avenue, a portion of which extends into the study area between the southern limit at West 28th Street and West 31st Street. A bicycle lane has also been constructed on Broadway as part of the Broadway Mall, described below.
Broadway Mall—Broadway between West 33rd Street and West 26th Street has been reconfigured to provide a parking / loading lane along the west curb, one travel lane, and a parking or turn lane in the roadway median with a bicycle lane along the east curb. The southbound vehicular capacity has been reduced from two or three lanes to one lane.
Chapter 4.5: Transportation
4.5-13
Parking Regulations—Changes were made to parking regulations throughout the study area in order to improve traffic circulation and partially offset the effects of the Bus Priority Lanes along 34th Street and other roadway changes.
The most important change affecting traffic circulation in the study area has been the reconfiguration of West 34th Street, including the implementation of the 34th Bus Priority Lanes, which increased person movement capacity along the corridor but reduced vehicular capacity. As a consequence, existing vehicular volumes along 34th Street have generally declined with some vehicles diverting to other east-west streets both within and outside the study area. The Broadway Mall has reduced vehicular capacity on Broadway resulting in a shift of traffic to Seventh Avenue in the study area, and to Fifth Avenue outside the study area.
CHANGES IN EXISTING TRAFFIC VOLUMES
Existing volumes in the study area were compared for 2005 and 2008 to determine traffic trends. The 2005 volumes are based on the 2006 FEIS and the 2008 volumes were obtained from the 2009 WRY FEIS. The 2008 traffic counts were collected in November of that year following the implementation of the 34th Street Bus Priority/Transitway project, described above.
To compare prior and current traffic volumes, both screenline and cordon line comparisons were taken. A screenline analysis compares 2006 FEIS and 2008 traffic as it crosses a specific line, set on a north-south and east-west axis.
A cordon line analysis compares the total traffic volume entering and leaving the project area, a “cordoned off” boundary line.
Screenline Analysis
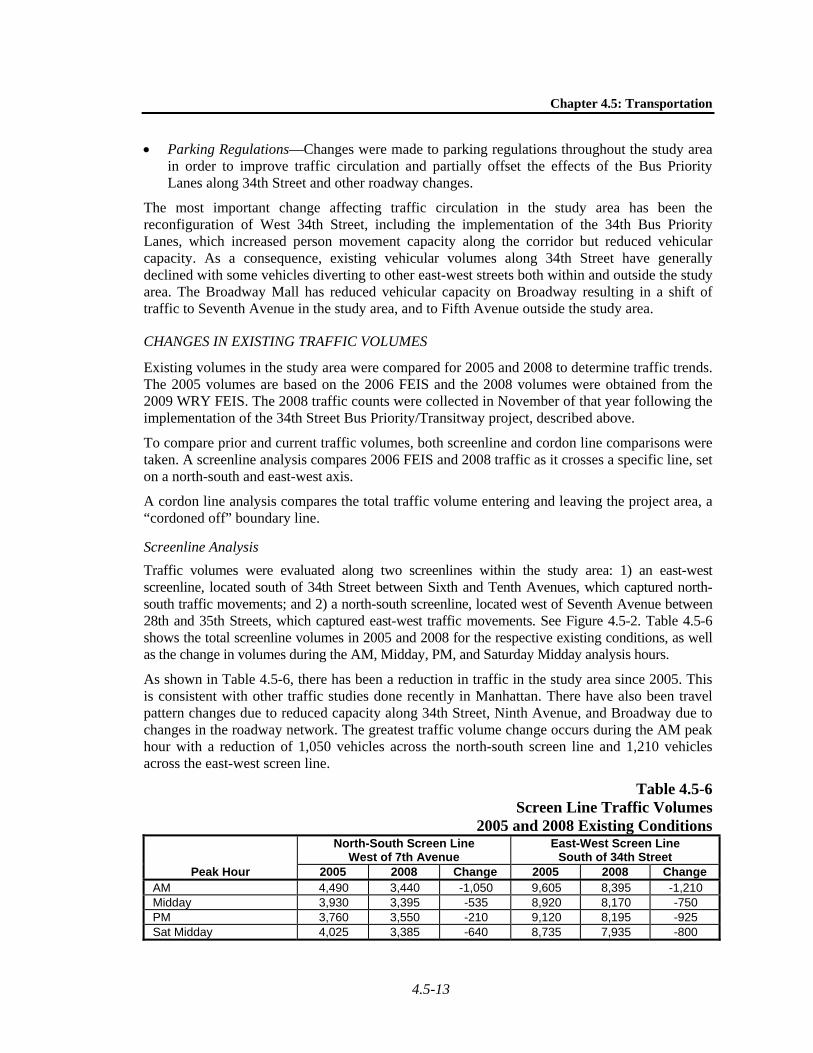
Traffic volumes were evaluated along two screenlines within the study area: 1) an east-west screenline, located south of 34th Street between Sixth and Tenth Avenues, which captured north-south traffic movements; and 2) a north-south screenline, located west of Seventh Avenue between 28th and 35th Streets, which captured east-west traffic movements. See Figure 4.5-2. Table 4.5-6 shows the total screenline volumes in 2005 and 2008 for the respective existing conditions, as well as the change in volumes during the AM, Midday, PM, and Saturday Midday analysis hours.
As shown in Table 4.5-6, there has been a reduction in traffic in the study area since 2005. This is consistent with other traffic studies done recently in Manhattan. There have also been travel pattern changes due to reduced capacity along 34th Street, Ninth Avenue, and Broadway due to changes in the roadway network. The greatest traffic volume change occurs during the AM peak hour with a reduction of 1,050 vehicles across the north-south screen line and 1,210 vehicles across the east-west screen line.
Table 4.5-6Screen Line Traffic Volumes
2005 and 2008 Existing Conditions
Peak Hour
North-South Screen LineWest of 7th Avenue
East-West Screen LineSouth of 34th Street
2005 2008 Change 2005 2008 ChangeAM 4,490 3,440 -1,050 9,605 8,395 -1,210 Midday 3,930 3,395 -535 8,920 8,170 -750 PM 3,760 3,550 -210 9,120 8,195 -925 Sat Midday 4,025 3,385 -640 8,735 7,935 -800
Moynihan Station Development Project
4.5-14
Cordon Line Analysis
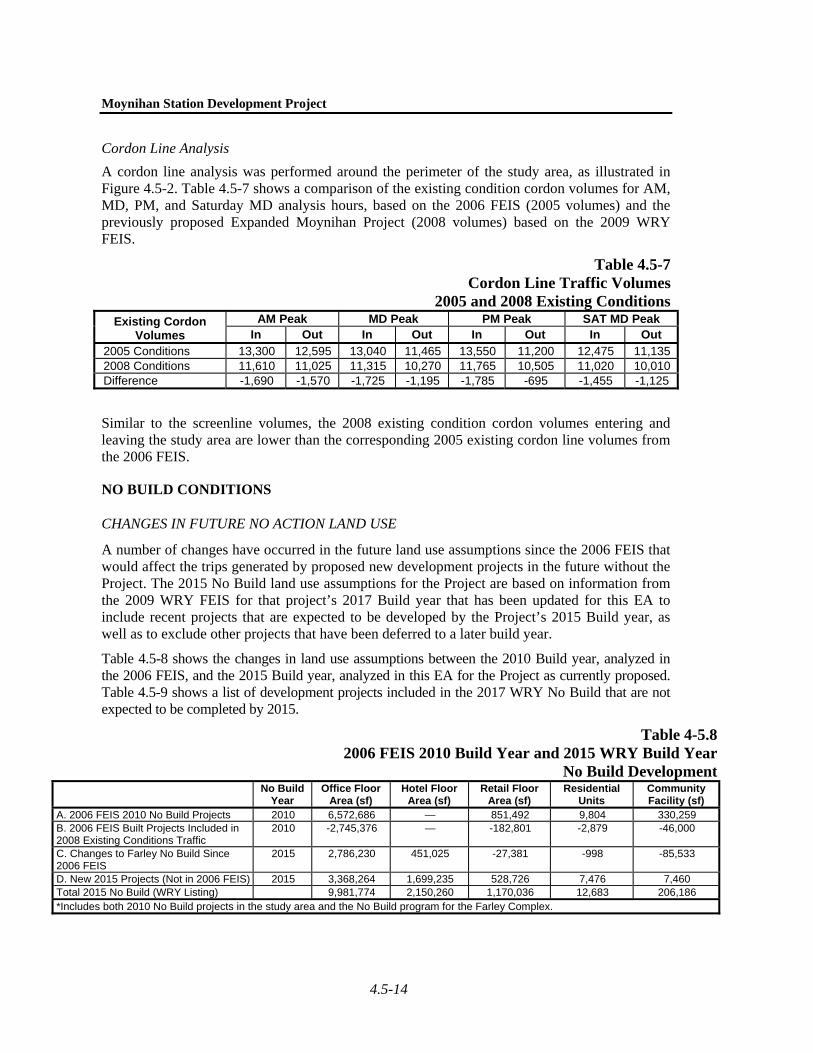
A cordon line analysis was performed around the perimeter of the study area, as illustrated in Figure 4.5-2. Table 4.5-7 shows a comparison of the existing condition cordon volumes for AM, MD, PM, and Saturday MD analysis hours, based on the 2006 FEIS (2005 volumes) and the previously proposed Expanded Moynihan Project (2008 volumes) based on the 2009 WRY FEIS.
Table 4.5-7Cordon Line Traffic Volumes
2005 and 2008 Existing ConditionsExisting Cordon
Volumes AM Peak MD Peak PM Peak SAT MD Peak
In Out In Out In Out In Out 2005 Conditions 13,300 12,595 13,040 11,465 13,550 11,200 12,475 11,1352008 Conditions 11,610 11,025 11,315 10,270 11,765 10,505 11,020 10,010Difference -1,690 -1,570 -1,725 -1,195 -1,785 -695 -1,455 -1,125
Similar to the screenline volumes, the 2008 existing condition cordon volumes entering and leaving the study area are lower than the corresponding 2005 existing cordon line volumes from the 2006 FEIS.
NO BUILD CONDITIONS
CHANGES IN FUTURE NO ACTION LAND USE
A number of changes have occurred in the future land use assumptions since the 2006 FEIS that would affect the trips generated by proposed new development projects in the future without the Project. The 2015 No Build land use assumptions for the Project are based on information from the 2009 WRY FEIS for that project’s 2017 Build year that has been updated for this EA to include recent projects that are expected to be developed by the Project’s 2015 Build year, as well as to exclude other projects that have been deferred to a later build year.
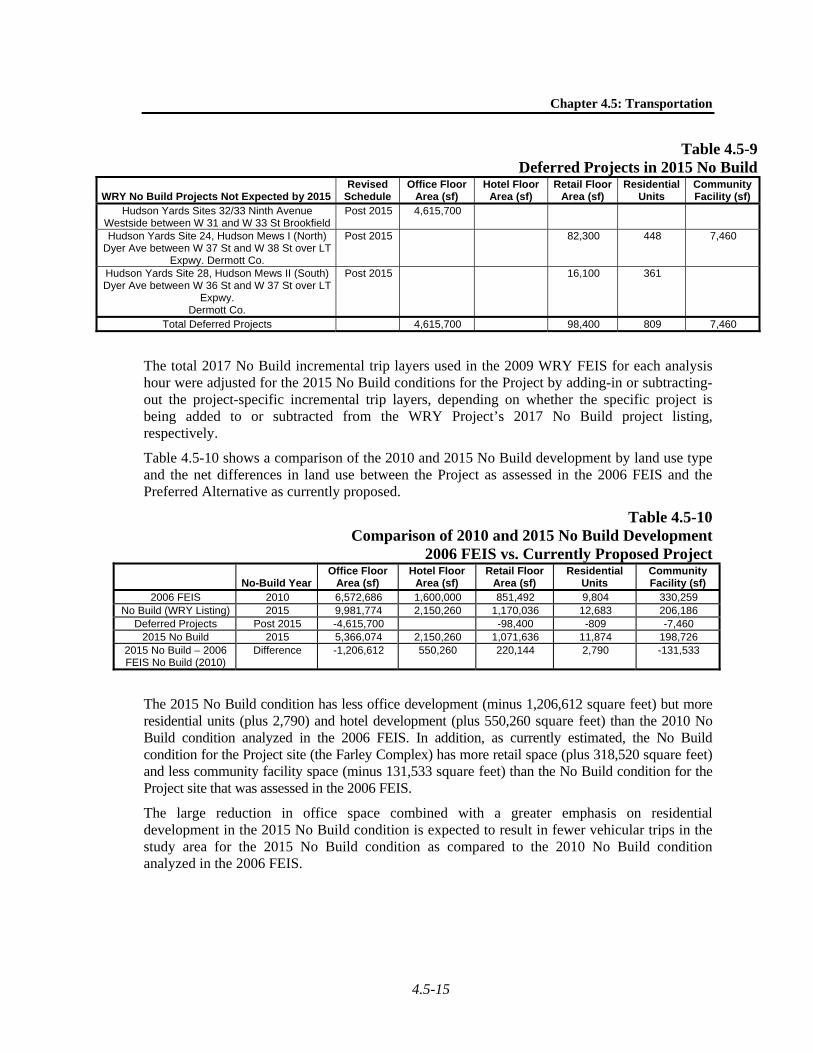
Table 4.5-8 shows the changes in land use assumptions between the 2010 Build year, analyzed in the 2006 FEIS, and the 2015 Build year, analyzed in this EA for the Project as currently proposed. Table 4.5-9 shows a list of development projects included in the 2017 WRY No Build that are not expected to be completed by 2015.
Table 4-5.82006 FEIS 2010 Build Year and 2015 WRY Build Year
No Build Development
No Build
Year Office Floor
Area (sf) Hotel Floor
Area (sf) Retail Floor
Area (sf) Residential
Units Community Facility (sf)
A. 2006 FEIS 2010 No Build Projects 2010 6,572,686 — 851,492 9,804 330,259 B. 2006 FEIS Built Projects Included in 2008 Existing Conditions Traffic
2010 -2,745,376 — -182,801 -2,879 -46,000
C. Changes to Farley No Build Since 2006 FEIS
2015 2,786,230 451,025 -27,381 -998 -85,533
D. New 2015 Projects (Not in 2006 FEIS) 2015 3,368,264 1,699,235 528,726 7,476 7,460 Total 2015 No Build (WRY Listing) 9,981,774 2,150,260 1,170,036 12,683 206,186 *Includes both 2010 No Build projects in the study area and the No Build program for the Farley Complex.
Chapter 4.5: Transportation
4.5-15
Table 4.5-9Deferred Projects in 2015 No Build
WRY No Build Projects Not Expected by 2015Revised
Schedule Office Floor
Area (sf) Hotel Floor
Area (sf) Retail Floor
Area (sf) Residential
Units Community Facility (sf)
Hudson Yards Sites 32/33 Ninth Avenue Westside between W 31 and W 33 St Brookfield
Post 2015 4,615,700
Hudson Yards Site 24, Hudson Mews I (North) Dyer Ave between W 37 St and W 38 St over LT
Expwy. Dermott Co.
Post 2015 82,300 448 7,460
Hudson Yards Site 28, Hudson Mews II (South) Dyer Ave between W 36 St and W 37 St over LT
Expwy. Dermott Co.
Post 2015 16,100 361
Total Deferred Projects 4,615,700 98,400 809 7,460
The total 2017 No Build incremental trip layers used in the 2009 WRY FEIS for each analysis hour were adjusted for the 2015 No Build conditions for the Project by adding-in or subtracting-out the project-specific incremental trip layers, depending on whether the specific project is being added to or subtracted from the WRY Project’s 2017 No Build project listing, respectively.
Table 4.5-10 shows a comparison of the 2010 and 2015 No Build development by land use type and the net differences in land use between the Project as assessed in the 2006 FEIS and the Preferred Alternative as currently proposed.
Table 4.5-10Comparison of 2010 and 2015 No Build Development
2006 FEIS vs. Currently Proposed Project
No-Build Year Office Floor
Area (sf) Hotel Floor
Area (sf) Retail Floor
Area (sf) Residential
Units Community Facility (sf)
2006 FEIS 2010 6,572,686 1,600,000 851,492 9,804 330,259 No Build (WRY Listing) 2015 9,981,774 2,150,260 1,170,036 12,683 206,186
Deferred Projects Post 2015 -4,615,700 -98,400 -809 -7,460 2015 No Build 2015 5,366,074 2,150,260 1,071,636 11,874 198,726
2015 No Build – 2006 FEIS No Build (2010)
Difference -1,206,612 550,260 220,144 2,790 -131,533
The 2015 No Build condition has less office development (minus 1,206,612 square feet) but more residential units (plus 2,790) and hotel development (plus 550,260 square feet) than the 2010 No Build condition analyzed in the 2006 FEIS. In addition, as currently estimated, the No Build condition for the Project site (the Farley Complex) has more retail space (plus 318,520 square feet) and less community facility space (minus 131,533 square feet) than the No Build condition for the Project site that was assessed in the 2006 FEIS.
The large reduction in office space combined with a greater emphasis on residential development in the 2015 No Build condition is expected to result in fewer vehicular trips in the study area for the 2015 No Build condition as compared to the 2010 No Build condition analyzed in the 2006 FEIS.
Moynihan Station Development Project
4.5-16
CHANGES IN NO BUILD TRAFFIC VOLUMES
Screenline Analysis
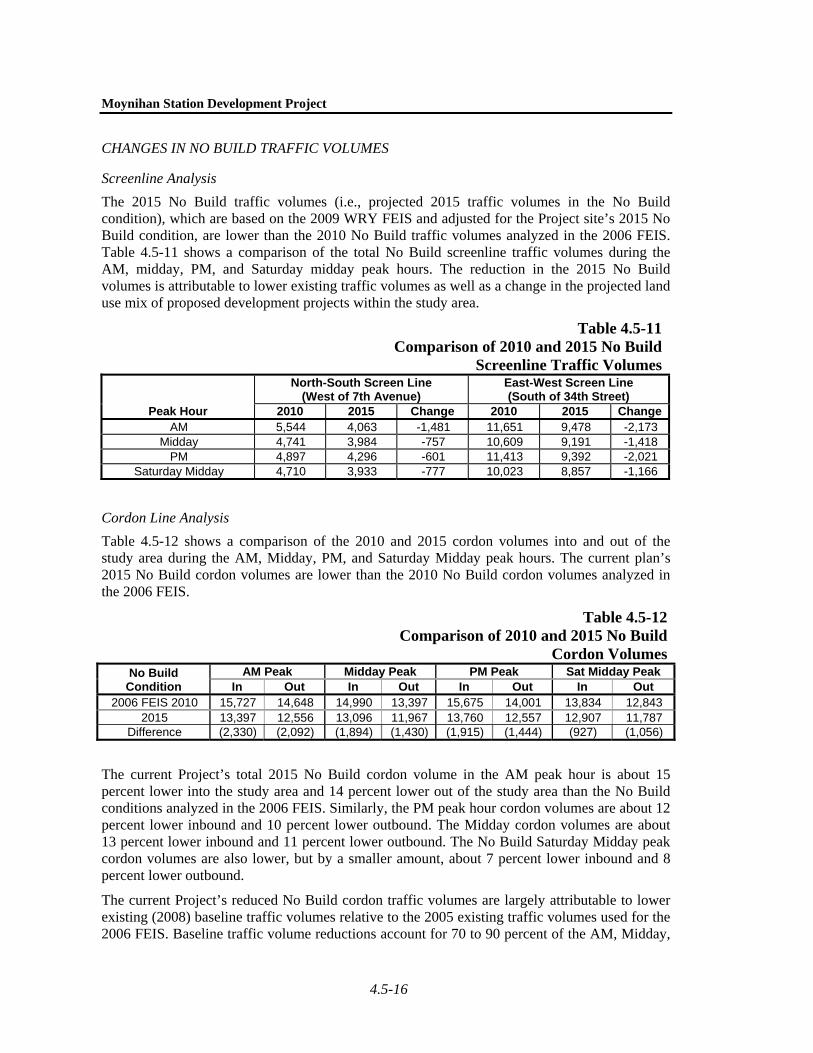
The 2015 No Build traffic volumes (i.e., projected 2015 traffic volumes in the No Build condition), which are based on the 2009 WRY FEIS and adjusted for the Project site’s 2015 No Build condition, are lower than the 2010 No Build traffic volumes analyzed in the 2006 FEIS. Table 4.5-11 shows a comparison of the total No Build screenline traffic volumes during the AM, midday, PM, and Saturday midday peak hours. The reduction in the 2015 No Build volumes is attributable to lower existing traffic volumes as well as a change in the projected land use mix of proposed development projects within the study area.
Table 4.5-11Comparison of 2010 and 2015 No Build
Screenline Traffic Volumes
Peak Hour
North-South Screen Line (West of 7th Avenue)
East-West Screen Line (South of 34th Street)
2010 2015 Change 2010 2015 ChangeAM 5,544 4,063 -1,481 11,651 9,478 -2,173
Midday 4,741 3,984 -757 10,609 9,191 -1,418 PM 4,897 4,296 -601 11,413 9,392 -2,021
Saturday Midday 4,710 3,933 -777 10,023 8,857 -1,166
Cordon Line Analysis
Table 4.5-12 shows a comparison of the 2010 and 2015 cordon volumes into and out of the study area during the AM, Midday, PM, and Saturday Midday peak hours. The current plan’s 2015 No Build cordon volumes are lower than the 2010 No Build cordon volumes analyzed in the 2006 FEIS.
Table 4.5-12Comparison of 2010 and 2015 No Build
Cordon Volumes
No Build Condition
AM Peak Midday Peak PM Peak Sat Midday PeakIn Out In Out In Out In Out
2006 FEIS 2010 15,727 14,648 14,990 13,397 15,675 14,001 13,834 12,843 2015 13,397 12,556 13,096 11,967 13,760 12,557 12,907 11,787
Difference (2,330) (2,092) (1,894) (1,430) (1,915) (1,444) (927) (1,056)
The current Project’s total 2015 No Build cordon volume in the AM peak hour is about 15 percent lower into the study area and 14 percent lower out of the study area than the No Build conditions analyzed in the 2006 FEIS. Similarly, the PM peak hour cordon volumes are about 12 percent lower inbound and 10 percent lower outbound. The Midday cordon volumes are about 13 percent lower inbound and 11 percent lower outbound. The No Build Saturday Midday peak cordon volumes are also lower, but by a smaller amount, about 7 percent lower inbound and 8 percent lower outbound.
The current Project’s reduced No Build cordon traffic volumes are largely attributable to lower existing (2008) baseline traffic volumes relative to the 2005 existing traffic volumes used for the 2006 FEIS. Baseline traffic volume reductions account for 70 to 90 percent of the AM, Midday,
Chapter 4.5: Transportation
4.5-17
and PM No Build cordon volume reductions in the 2015 Build year. The remaining traffic reductions are due to changes in the mix of development projects without the Project—less office space and greater emphasis on residential uses that generate fewer auto trips than office development.
4.5.4 PROPOSED PROJECT CONDITIONS
CHANGES IN INCREMENTAL BUILD TRAFFIC VOLUMES
CORDON LINE ANALYSIS
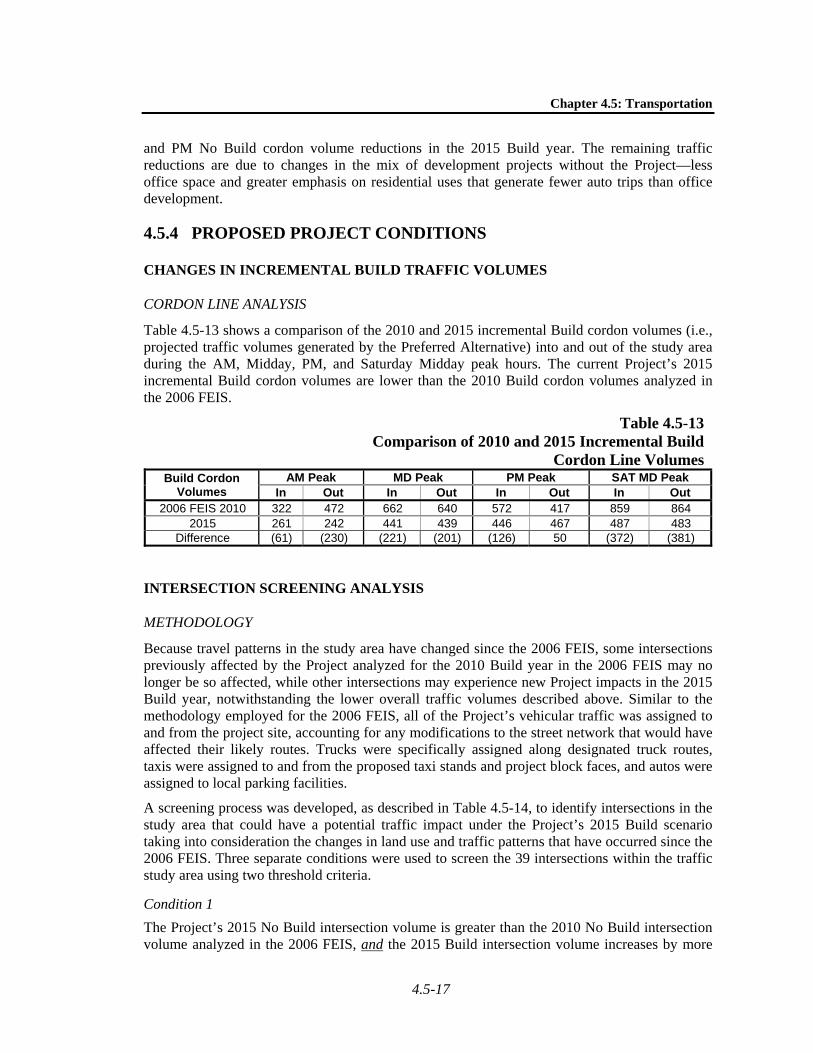
Table 4.5-13 shows a comparison of the 2010 and 2015 incremental Build cordon volumes (i.e., projected traffic volumes generated by the Preferred Alternative) into and out of the study area during the AM, Midday, PM, and Saturday Midday peak hours. The current Project’s 2015 incremental Build cordon volumes are lower than the 2010 Build cordon volumes analyzed in the 2006 FEIS.
Table 4.5-13Comparison of 2010 and 2015 Incremental Build
Cordon Line Volumes
Build Cordon Volumes
AM Peak MD Peak PM Peak SAT MD PeakIn Out In Out In Out In Out
2006 FEIS 2010 322 472 662 640 572 417 859 864 2015 261 242 441 439 446 467 487 483
Difference (61) (230) (221) (201) (126) 50 (372) (381)
INTERSECTION SCREENING ANALYSIS
METHODOLOGY
Because travel patterns in the study area have changed since the 2006 FEIS, some intersections previously affected by the Project analyzed for the 2010 Build year in the 2006 FEIS may no longer be so affected, while other intersections may experience new Project impacts in the 2015 Build year, notwithstanding the lower overall traffic volumes described above. Similar to the methodology employed for the 2006 FEIS, all of the Project’s vehicular traffic was assigned to and from the project site, accounting for any modifications to the street network that would have affected their likely routes. Trucks were specifically assigned along designated truck routes, taxis were assigned to and from the proposed taxi stands and project block faces, and autos were assigned to local parking facilities.
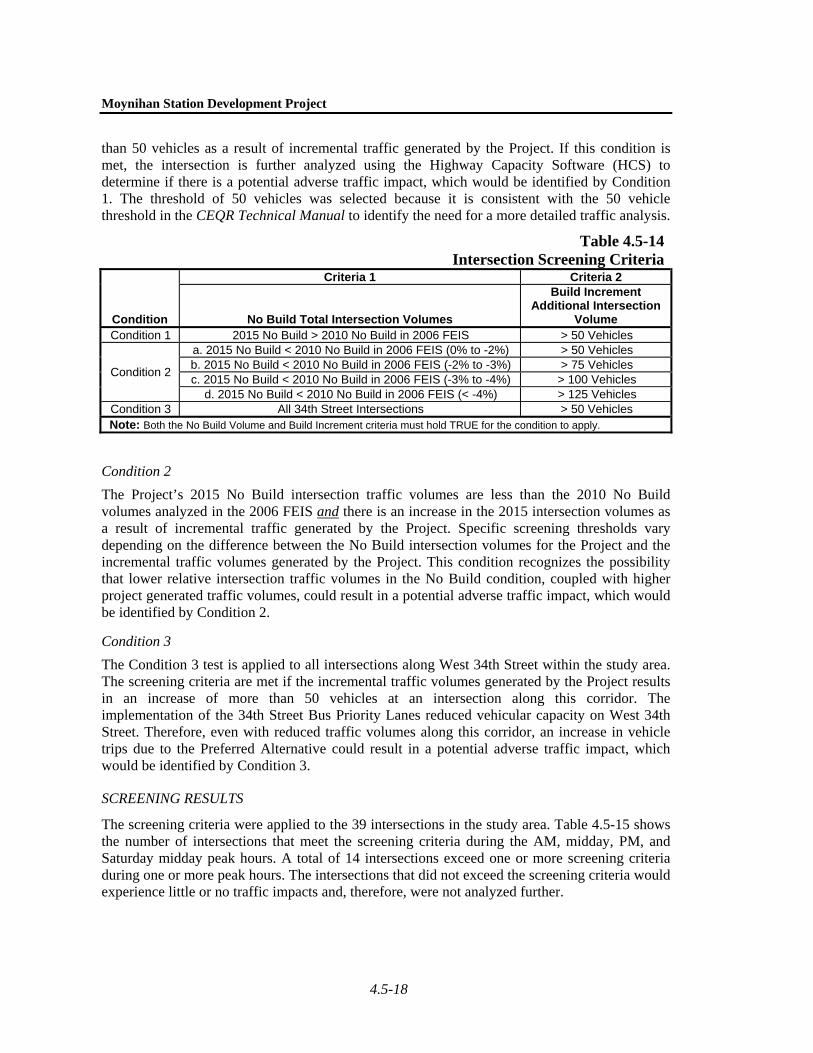
A screening process was developed, as described in Table 4.5-14, to identify intersections in the study area that could have a potential traffic impact under the Project’s 2015 Build scenario taking into consideration the changes in land use and traffic patterns that have occurred since the 2006 FEIS. Three separate conditions were used to screen the 39 intersections within the traffic study area using two threshold criteria.
Condition 1
The Project’s 2015 No Build intersection volume is greater than the 2010 No Build intersection volume analyzed in the 2006 FEIS, and the 2015 Build intersection volume increases by more
Moynihan Station Development Project
4.5-18
than 50 vehicles as a result of incremental traffic generated by the Project. If this condition is met, the intersection is further analyzed using the Highway Capacity Software (HCS) to determine if there is a potential adverse traffic impact, which would be identified by Condition 1. The threshold of 50 vehicles was selected because it is consistent with the 50 vehicle threshold in the CEQR Technical Manual to identify the need for a more detailed traffic analysis.
Table 4.5-14Intersection Screening Criteria
Condition
Criteria 1 Criteria 2
No Build Total Intersection Volumes
Build Increment Additional Intersection
Volume Condition 1 2015 No Build > 2010 No Build in 2006 FEIS > 50 Vehicles
Condition 2
a. 2015 No Build < 2010 No Build in 2006 FEIS (0% to -2%) > 50 Vehicles b. 2015 No Build < 2010 No Build in 2006 FEIS (-2% to -3%) > 75 Vehicles c. 2015 No Build < 2010 No Build in 2006 FEIS (-3% to -4%) > 100 Vehicles
d. 2015 No Build < 2010 No Build in 2006 FEIS (< -4%) > 125 Vehicles Condition 3 All 34th Street Intersections > 50 Vehicles Note: Both the No Build Volume and Build Increment criteria must hold TRUE for the condition to apply.
Condition 2
The Project’s 2015 No Build intersection traffic volumes are less than the 2010 No Build volumes analyzed in the 2006 FEIS and there is an increase in the 2015 intersection volumes as a result of incremental traffic generated by the Project. Specific screening thresholds vary depending on the difference between the No Build intersection volumes for the Project and the incremental traffic volumes generated by the Project. This condition recognizes the possibility that lower relative intersection traffic volumes in the No Build condition, coupled with higher project generated traffic volumes, could result in a potential adverse traffic impact, which would be identified by Condition 2.
Condition 3
The Condition 3 test is applied to all intersections along West 34th Street within the study area. The screening criteria are met if the incremental traffic volumes generated by the Project results in an increase of more than 50 vehicles at an intersection along this corridor. The implementation of the 34th Street Bus Priority Lanes reduced vehicular capacity on West 34th Street. Therefore, even with reduced traffic volumes along this corridor, an increase in vehicle trips due to the Preferred Alternative could result in a potential adverse traffic impact, which would be identified by Condition 3.
SCREENING RESULTS
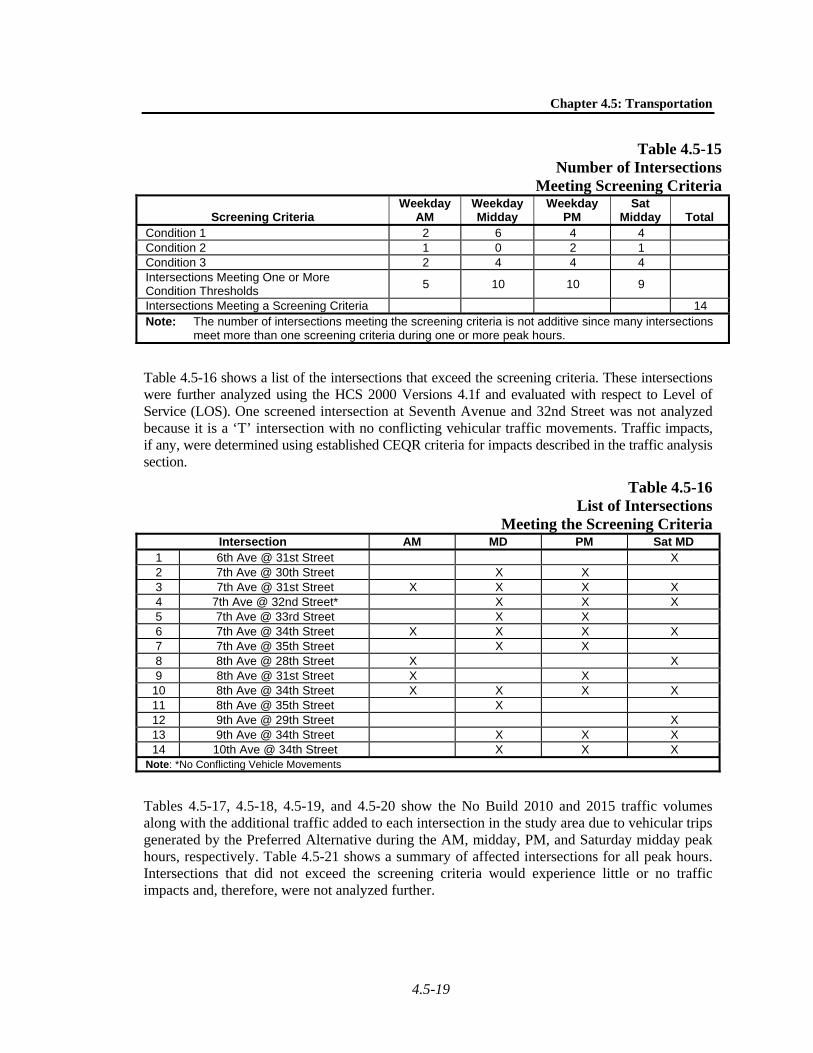
The screening criteria were applied to the 39 intersections in the study area. Table 4.5-15 shows the number of intersections that meet the screening criteria during the AM, midday, PM, and Saturday midday peak hours. A total of 14 intersections exceed one or more screening criteria during one or more peak hours. The intersections that did not exceed the screening criteria would experience little or no traffic impacts and, therefore, were not analyzed further.
Chapter 4.5: Transportation
4.5-19
Table 4.5-15Number of Intersections
Meeting Screening Criteria
Screening Criteria Weekday
AM WeekdayMidday
Weekday PM
Sat Midday Total
Condition 1 2 6 4 4 Condition 2 1 0 2 1 Condition 3 2 4 4 4 Intersections Meeting One or More Condition Thresholds
5 10 10 9
Intersections Meeting a Screening Criteria 14 Note: The number of intersections meeting the screening criteria is not additive since many intersections
meet more than one screening criteria during one or more peak hours.
Table 4.5-16 shows a list of the intersections that exceed the screening criteria. These intersections were further analyzed using the HCS 2000 Versions 4.1f and evaluated with respect to Level of Service (LOS). One screened intersection at Seventh Avenue and 32nd Street was not analyzed because it is a ‘T’ intersection with no conflicting vehicular traffic movements. Traffic impacts, if any, were determined using established CEQR criteria for impacts described in the traffic analysis section.
Table 4.5-16List of Intersections
Meeting the Screening CriteriaIntersection AM MD PM Sat MD
1 6th Ave @ 31st Street X 2 7th Ave @ 30th Street X X 3 7th Ave @ 31st Street X X X X 4 7th Ave @ 32nd Street* X X X 5 7th Ave @ 33rd Street X X 6 7th Ave @ 34th Street X X X X 7 7th Ave @ 35th Street X X 8 8th Ave @ 28th Street X X 9 8th Ave @ 31st Street X X
10 8th Ave @ 34th Street X X X X 11 8th Ave @ 35th Street X 12 9th Ave @ 29th Street X 13 9th Ave @ 34th Street X X X 14 10th Ave @ 34th Street X X X
Note: *No Conflicting Vehicle Movements
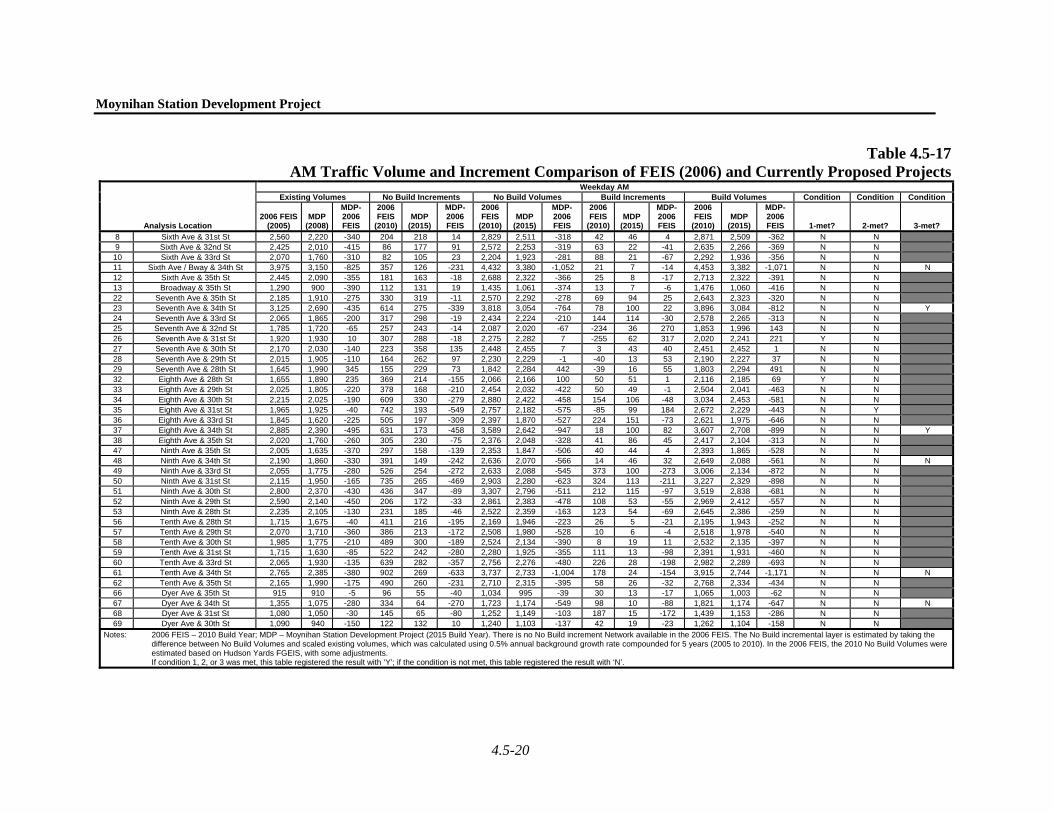
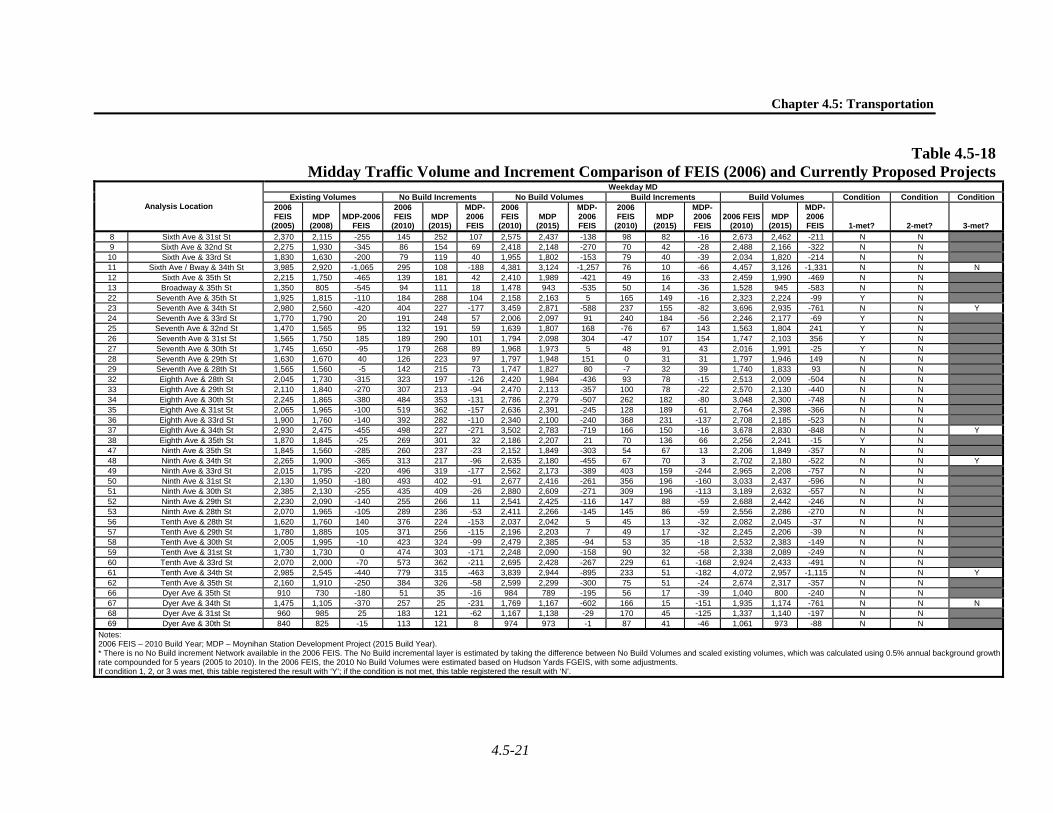
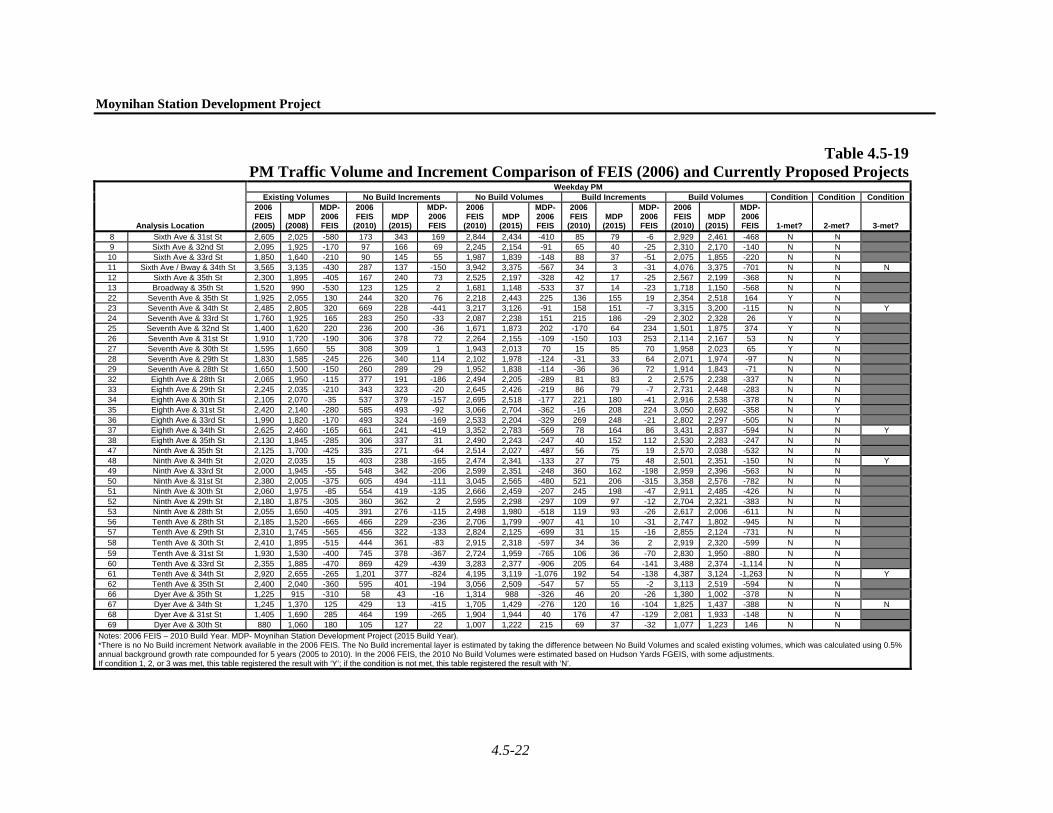
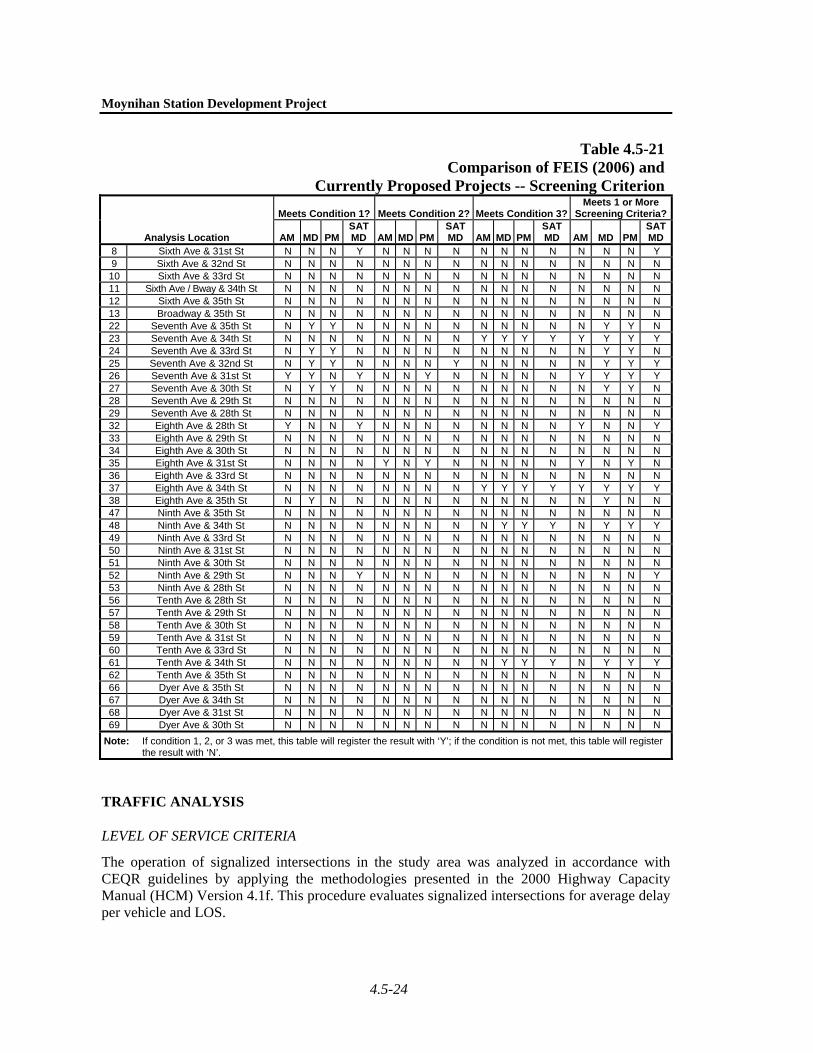
Tables 4.5-17, 4.5-18, 4.5-19, and 4.5-20 show the No Build 2010 and 2015 traffic volumes along with the additional traffic added to each intersection in the study area due to vehicular trips generated by the Preferred Alternative during the AM, midday, PM, and Saturday midday peak hours, respectively. Table 4.5-21 shows a summary of affected intersections for all peak hours. Intersections that did not exceed the screening criteria would experience little or no traffic impacts and, therefore, were not analyzed further.
Moynihan Station Development Project
4.5-20
Table 4.5-17AM Traffic Volume and Increment Comparison of FEIS (2006) and Currently Proposed Projects
Analysis Location
Weekday AM Existing Volumes No Build Increments No Build Volumes Build Increments Build Volumes Condition Condition Condition
2006 FEIS (2005)
MDP (2008)
MDP-2006 FEIS
2006 FEIS
(2010)MDP
(2015)
MDP-2006 FEIS
2006 FEIS
(2010) MDP
(2015)
MDP-2006 FEIS
2006 FEIS
(2010) MDP
(2015)
MDP-2006 FEIS
2006 FEIS
(2010) MDP
(2015)
MDP-2006 FEIS 1-met? 2-met? 3-met?
8 Sixth Ave & 31st St 2,560 2,220 -340 204 218 14 2,829 2,511 -318 42 46 4 2,871 2,509 -362 N N 9 Sixth Ave & 32nd St 2,425 2,010 -415 86 177 91 2,572 2,253 -319 63 22 -41 2,635 2,266 -369 N N 10 Sixth Ave & 33rd St 2,070 1,760 -310 82 105 23 2,204 1,923 -281 88 21 -67 2,292 1,936 -356 N N 11 Sixth Ave / Bway & 34th St 3,975 3,150 -825 357 126 -231 4,432 3,380 -1,052 21 7 -14 4,453 3,382 -1,071 N N N 12 Sixth Ave & 35th St 2,445 2,090 -355 181 163 -18 2,688 2,322 -366 25 8 -17 2,713 2,322 -391 N N 13 Broadway & 35th St 1,290 900 -390 112 131 19 1,435 1,061 -374 13 7 -6 1,476 1,060 -416 N N 22 Seventh Ave & 35th St 2,185 1,910 -275 330 319 -11 2,570 2,292 -278 69 94 25 2,643 2,323 -320 N N 23 Seventh Ave & 34th St 3,125 2,690 -435 614 275 -339 3,818 3,054 -764 78 100 22 3,896 3,084 -812 N N Y 24 Seventh Ave & 33rd St 2,065 1,865 -200 317 298 -19 2,434 2,224 -210 144 114 -30 2,578 2,265 -313 N N 25 Seventh Ave & 32nd St 1,785 1,720 -65 257 243 -14 2,087 2,020 -67 -234 36 270 1,853 1,996 143 N N 26 Seventh Ave & 31st St 1,920 1,930 10 307 288 -18 2,275 2,282 7 -255 62 317 2,020 2,241 221 Y N 27 Seventh Ave & 30th St 2,170 2,030 -140 223 358 135 2,448 2,455 7 3 43 40 2,451 2,452 1 N N 28 Seventh Ave & 29th St 2,015 1,905 -110 164 262 97 2,230 2,229 -1 -40 13 53 2,190 2,227 37 N N 29 Seventh Ave & 28th St 1,645 1,990 345 155 229 73 1,842 2,284 442 -39 16 55 1,803 2,294 491 N N 32 Eighth Ave & 28th St 1,655 1,890 235 369 214 -155 2,066 2,166 100 50 51 1 2,116 2,185 69 Y N 33 Eighth Ave & 29th St 2,025 1,805 -220 378 168 -210 2,454 2,032 -422 50 49 -1 2,504 2,041 -463 N N 34 Eighth Ave & 30th St 2,215 2,025 -190 609 330 -279 2,880 2,422 -458 154 106 -48 3,034 2,453 -581 N N 35 Eighth Ave & 31st St 1,965 1,925 -40 742 193 -549 2,757 2,182 -575 -85 99 184 2,672 2,229 -443 N Y 36 Eighth Ave & 33rd St 1,845 1,620 -225 505 197 -309 2,397 1,870 -527 224 151 -73 2,621 1,975 -646 N N 37 Eighth Ave & 34th St 2,885 2,390 -495 631 173 -458 3,589 2,642 -947 18 100 82 3,607 2,708 -899 N N Y 38 Eighth Ave & 35th St 2,020 1,760 -260 305 230 -75 2,376 2,048 -328 41 86 45 2,417 2,104 -313 N N 47 Ninth Ave & 35th St 2,005 1,635 -370 297 158 -139 2,353 1,847 -506 40 44 4 2,393 1,865 -528 N N 48 Ninth Ave & 34th St 2,190 1,860 -330 391 149 -242 2,636 2,070 -566 14 46 32 2,649 2,088 -561 N N N 49 Ninth Ave & 33rd St 2,055 1,775 -280 526 254 -272 2,633 2,088 -545 373 100 -273 3,006 2,134 -872 N N 50 Ninth Ave & 31st St 2,115 1,950 -165 735 265 -469 2,903 2,280 -623 324 113 -211 3,227 2,329 -898 N N 51 Ninth Ave & 30th St 2,800 2,370 -430 436 347 -89 3,307 2,796 -511 212 115 -97 3,519 2,838 -681 N N 52 Ninth Ave & 29th St 2,590 2,140 -450 206 172 -33 2,861 2,383 -478 108 53 -55 2,969 2,412 -557 N N 53 Ninth Ave & 28th St 2,235 2,105 -130 231 185 -46 2,522 2,359 -163 123 54 -69 2,645 2,386 -259 N N 56 Tenth Ave & 28th St 1,715 1,675 -40 411 216 -195 2,169 1,946 -223 26 5 -21 2,195 1,943 -252 N N 57 Tenth Ave & 29th St 2,070 1,710 -360 386 213 -172 2,508 1,980 -528 10 6 -4 2,518 1,978 -540 N N 58 Tenth Ave & 30th St 1,985 1,775 -210 489 300 -189 2,524 2,134 -390 8 19 11 2,532 2,135 -397 N N 59 Tenth Ave & 31st St 1,715 1,630 -85 522 242 -280 2,280 1,925 -355 111 13 -98 2,391 1,931 -460 N N 60 Tenth Ave & 33rd St 2,065 1,930 -135 639 282 -357 2,756 2,276 -480 226 28 -198 2,982 2,289 -693 N N 61 Tenth Ave & 34th St 2,765 2,385 -380 902 269 -633 3,737 2,733 -1,004 178 24 -154 3,915 2,744 -1,171 N N N 62 Tenth Ave & 35th St 2,165 1,990 -175 490 260 -231 2,710 2,315 -395 58 26 -32 2,768 2,334 -434 N N 66 Dyer Ave & 35th St 915 910 -5 96 55 -40 1,034 995 -39 30 13 -17 1,065 1,003 -62 N N 67 Dyer Ave & 34th St 1,355 1,075 -280 334 64 -270 1,723 1,174 -549 98 10 -88 1,821 1,174 -647 N N N 68 Dyer Ave & 31st St 1,080 1,050 -30 145 65 -80 1,252 1,149 -103 187 15 -172 1,439 1,153 -286 N N 69 Dyer Ave & 30th St 1,090 940 -150 122 132 10 1,240 1,103 -137 42 19 -23 1,262 1,104 -158 N N
Notes: 2006 FEIS – 2010 Build Year; MDP – Moynihan Station Development Project (2015 Build Year). There is no No Build increment Network available in the 2006 FEIS. The No Build incremental layer is estimated by taking the difference between No Build Volumes and scaled existing volumes, which was calculated using 0.5% annual background growth rate compounded for 5 years (2005 to 2010). In the 2006 FEIS, the 2010 No Build Volumes were estimated based on Hudson Yards FGEIS, with some adjustments.
If condition 1, 2, or 3 was met, this table registered the result with ‘Y’; if the condition is not met, this table registered the result with ‘N’.
Chapter 4.5: Transportation
4.5-21
Table 4.5-18 Midday Traffic Volume and Increment Comparison of FEIS (2006) and Currently Proposed Projects
Analysis Location
Weekday MDExisting Volumes No Build Increments No Build Volumes Build Increments Build Volumes Condition Condition Condition
2006 FEIS
(2005) MDP
(2008) MDP-2006
FEIS
2006 FEIS
(2010) MDP
(2015)
MDP-2006 FEIS
2006 FEIS
(2010) MDP
(2015)
MDP-2006 FEIS
2006 FEIS
(2010) MDP
(2015)
MDP-2006 FEIS
2006 FEIS(2010)
MDP (2015)
MDP-2006 FEIS 1-met? 2-met? 3-met?
8 Sixth Ave & 31st St 2,370 2,115 -255 145 252 107 2,575 2,437 -138 98 82 -16 2,673 2,462 -211 N N 9 Sixth Ave & 32nd St 2,275 1,930 -345 86 154 69 2,418 2,148 -270 70 42 -28 2,488 2,166 -322 N N 10 Sixth Ave & 33rd St 1,830 1,630 -200 79 119 40 1,955 1,802 -153 79 40 -39 2,034 1,820 -214 N N 11 Sixth Ave / Bway & 34th St 3,985 2,920 -1,065 295 108 -188 4,381 3,124 -1,257 76 10 -66 4,457 3,126 -1,331 N N N 12 Sixth Ave & 35th St 2,215 1,750 -465 139 181 42 2,410 1,989 -421 49 16 -33 2,459 1,990 -469 N N 13 Broadway & 35th St 1,350 805 -545 94 111 18 1,478 943 -535 50 14 -36 1,528 945 -583 N N 22 Seventh Ave & 35th St 1,925 1,815 -110 184 288 104 2,158 2,163 5 165 149 -16 2,323 2,224 -99 Y N 23 Seventh Ave & 34th St 2,980 2,560 -420 404 227 -177 3,459 2,871 -588 237 155 -82 3,696 2,935 -761 N N Y 24 Seventh Ave & 33rd St 1,770 1,790 20 191 248 57 2,006 2,097 91 240 184 -56 2,246 2,177 -69 Y N 25 Seventh Ave & 32nd St 1,470 1,565 95 132 191 59 1,639 1,807 168 -76 67 143 1,563 1,804 241 Y N 26 Seventh Ave & 31st St 1,565 1,750 185 189 290 101 1,794 2,098 304 -47 107 154 1,747 2,103 356 Y N 27 Seventh Ave & 30th St 1,745 1,650 -95 179 268 89 1,968 1,973 5 48 91 43 2,016 1,991 -25 Y N 28 Seventh Ave & 29th St 1,630 1,670 40 126 223 97 1,797 1,948 151 0 31 31 1,797 1,946 149 N N 29 Seventh Ave & 28th St 1,565 1,560 -5 142 215 73 1,747 1,827 80 -7 32 39 1,740 1,833 93 N N 32 Eighth Ave & 28th St 2,045 1,730 -315 323 197 -126 2,420 1,984 -436 93 78 -15 2,513 2,009 -504 N N 33 Eighth Ave & 29th St 2,110 1,840 -270 307 213 -94 2,470 2,113 -357 100 78 -22 2,570 2,130 -440 N N 34 Eighth Ave & 30th St 2,245 1,865 -380 484 353 -131 2,786 2,279 -507 262 182 -80 3,048 2,300 -748 N N 35 Eighth Ave & 31st St 2,065 1,965 -100 519 362 -157 2,636 2,391 -245 128 189 61 2,764 2,398 -366 N N 36 Eighth Ave & 33rd St 1,900 1,760 -140 392 282 -110 2,340 2,100 -240 368 231 -137 2,708 2,185 -523 N N 37 Eighth Ave & 34th St 2,930 2,475 -455 498 227 -271 3,502 2,783 -719 166 150 -16 3,678 2,830 -848 N N Y 38 Eighth Ave & 35th St 1,870 1,845 -25 269 301 32 2,186 2,207 21 70 136 66 2,256 2,241 -15 Y N 47 Ninth Ave & 35th St 1,845 1,560 -285 260 237 -23 2,152 1,849 -303 54 67 13 2,206 1,849 -357 N N 48 Ninth Ave & 34th St 2,265 1,900 -365 313 217 -96 2,635 2,180 -455 67 70 3 2,702 2,180 -522 N N Y 49 Ninth Ave & 33rd St 2,015 1,795 -220 496 319 -177 2,562 2,173 -389 403 159 -244 2,965 2,208 -757 N N 50 Ninth Ave & 31st St 2,130 1,950 -180 493 402 -91 2,677 2,416 -261 356 196 -160 3,033 2,437 -596 N N 51 Ninth Ave & 30th St 2,385 2,130 -255 435 409 -26 2,880 2,609 -271 309 196 -113 3,189 2,632 -557 N N 52 Ninth Ave & 29th St 2,230 2,090 -140 255 266 11 2,541 2,425 -116 147 88 -59 2,688 2,442 -246 N N 53 Ninth Ave & 28th St 2,070 1,965 -105 289 236 -53 2,411 2,266 -145 145 86 -59 2,556 2,286 -270 N N 56 Tenth Ave & 28th St 1,620 1,760 140 376 224 -153 2,037 2,042 5 45 13 -32 2,082 2,045 -37 N N 57 Tenth Ave & 29th St 1,780 1,885 105 371 256 -115 2,196 2,203 7 49 17 -32 2,245 2,206 -39 N N 58 Tenth Ave & 30th St 2,005 1,995 -10 423 324 -99 2,479 2,385 -94 53 35 -18 2,532 2,383 -149 N N 59 Tenth Ave & 31st St 1,730 1,730 0 474 303 -171 2,248 2,090 -158 90 32 -58 2,338 2,089 -249 N N 60 Tenth Ave & 33rd St 2,070 2,000 -70 573 362 -211 2,695 2,428 -267 229 61 -168 2,924 2,433 -491 N N 61 Tenth Ave & 34th St 2,985 2,545 -440 779 315 -463 3,839 2,944 -895 233 51 -182 4,072 2,957 -1,115 N N Y 62 Tenth Ave & 35th St 2,160 1,910 -250 384 326 -58 2,599 2,299 -300 75 51 -24 2,674 2,317 -357 N N 66 Dyer Ave & 35th St 910 730 -180 51 35 -16 984 789 -195 56 17 -39 1,040 800 -240 N N 67 Dyer Ave & 34th St 1,475 1,105 -370 257 25 -231 1,769 1,167 -602 166 15 -151 1,935 1,174 -761 N N N 68 Dyer Ave & 31st St 960 985 25 183 121 -62 1,167 1,138 -29 170 45 -125 1,337 1,140 -197 N N 69 Dyer Ave & 30th St 840 825 -15 113 121 8 974 973 -1 87 41 -46 1,061 973 -88 N N
Notes: 2006 FEIS – 2010 Build Year; MDP – Moynihan Station Development Project (2015 Build Year). * There is no No Build increment Network available in the 2006 FEIS. The No Build incremental layer is estimated by taking the difference between No Build Volumes and scaled existing volumes, which was calculated using 0.5% annual background growth rate compounded for 5 years (2005 to 2010). In the 2006 FEIS, the 2010 No Build Volumes were estimated based on Hudson Yards FGEIS, with some adjustments. If condition 1, 2, or 3 was met, this table registered the result with ‘Y’; if the condition is not met, this table registered the result with ‘N’.
Moynihan Station Development Project
4.5-22
Table 4.5-19PM Traffic Volume and Increment Comparison of FEIS (2006) and Currently Proposed Projects
Analysis Location
Weekday PMExisting Volumes No Build Increments No Build Volumes Build Increments Build Volumes Condition Condition Condition
2006 FEIS
(2005) MDP
(2008)
MDP-2006 FEIS
2006 FEIS
(2010) MDP
(2015)
MDP-2006 FEIS
2006 FEIS
(2010) MDP
(2015)
MDP-2006 FEIS
2006 FEIS
(2010) MDP
(2015)
MDP-2006 FEIS
2006 FEIS
(2010) MDP
(2015)
MDP-2006 FEIS 1-met? 2-met? 3-met?
8 Sixth Ave & 31st St 2,605 2,025 -580 173 343 169 2,844 2,434 -410 85 79 -6 2,929 2,461 -468 N N 9 Sixth Ave & 32nd St 2,095 1,925 -170 97 166 69 2,245 2,154 -91 65 40 -25 2,310 2,170 -140 N N 10 Sixth Ave & 33rd St 1,850 1,640 -210 90 145 55 1,987 1,839 -148 88 37 -51 2,075 1,855 -220 N N 11 Sixth Ave / Bway & 34th St 3,565 3,135 -430 287 137 -150 3,942 3,375 -567 34 3 -31 4,076 3,375 -701 N N N 12 Sixth Ave & 35th St 2,300 1,895 -405 167 240 73 2,525 2,197 -328 42 17 -25 2,567 2,199 -368 N N 13 Broadway & 35th St 1,520 990 -530 123 125 2 1,681 1,148 -533 37 14 -23 1,718 1,150 -568 N N 22 Seventh Ave & 35th St 1,925 2,055 130 244 320 76 2,218 2,443 225 136 155 19 2,354 2,518 164 Y N 23 Seventh Ave & 34th St 2,485 2,805 320 669 228 -441 3,217 3,126 -91 158 151 -7 3,315 3,200 -115 N N Y 24 Seventh Ave & 33rd St 1,760 1,925 165 283 250 -33 2,087 2,238 151 215 186 -29 2,302 2,328 26 Y N 25 Seventh Ave & 32nd St 1,400 1,620 220 236 200 -36 1,671 1,873 202 -170 64 234 1,501 1,875 374 Y N 26 Seventh Ave & 31st St 1,910 1,720 -190 306 378 72 2,264 2,155 -109 -150 103 253 2,114 2,167 53 N Y 27 Seventh Ave & 30th St 1,595 1,650 55 308 309 1 1,943 2,013 70 15 85 70 1,958 2,023 65 Y N 28 Seventh Ave & 29th St 1,830 1,585 -245 226 340 114 2,102 1,978 -124 -31 33 64 2,071 1,974 -97 N N 29 Seventh Ave & 28th St 1,650 1,500 -150 260 289 29 1,952 1,838 -114 -36 36 72 1,914 1,843 -71 N N 32 Eighth Ave & 28th St 2,065 1,950 -115 377 191 -186 2,494 2,205 -289 81 83 2 2,575 2,238 -337 N N 33 Eighth Ave & 29th St 2,245 2,035 -210 343 323 -20 2,645 2,426 -219 86 79 -7 2,731 2,448 -283 N N 34 Eighth Ave & 30th St 2,105 2,070 -35 537 379 -157 2,695 2,518 -177 221 180 -41 2,916 2,538 -378 N N 35 Eighth Ave & 31st St 2,420 2,140 -280 585 493 -92 3,066 2,704 -362 -16 208 224 3,050 2,692 -358 N Y 36 Eighth Ave & 33rd St 1,990 1,820 -170 493 324 -169 2,533 2,204 -329 269 248 -21 2,802 2,297 -505 N N 37 Eighth Ave & 34th St 2,625 2,460 -165 661 241 -419 3,352 2,783 -569 78 164 86 3,431 2,837 -594 N N Y 38 Eighth Ave & 35th St 2,130 1,845 -285 306 337 31 2,490 2,243 -247 40 152 112 2,530 2,283 -247 N N 47 Ninth Ave & 35th St 2,125 1,700 -425 335 271 -64 2,514 2,027 -487 56 75 19 2,570 2,038 -532 N N 48 Ninth Ave & 34th St 2,020 2,035 15 403 238 -165 2,474 2,341 -133 27 75 48 2,501 2,351 -150 N N Y 49 Ninth Ave & 33rd St 2,000 1,945 -55 548 342 -206 2,599 2,351 -248 360 162 -198 2,959 2,396 -563 N N 50 Ninth Ave & 31st St 2,380 2,005 -375 605 494 -111 3,045 2,565 -480 521 206 -315 3,358 2,576 -782 N N 51 Ninth Ave & 30th St 2,060 1,975 -85 554 419 -135 2,666 2,459 -207 245 198 -47 2,911 2,485 -426 N N 52 Ninth Ave & 29th St 2,180 1,875 -305 360 362 2 2,595 2,298 -297 109 97 -12 2,704 2,321 -383 N N 53 Ninth Ave & 28th St 2,055 1,650 -405 391 276 -115 2,498 1,980 -518 119 93 -26 2,617 2,006 -611 N N 56 Tenth Ave & 28th St 2,185 1,520 -665 466 229 -236 2,706 1,799 -907 41 10 -31 2,747 1,802 -945 N N 57 Tenth Ave & 29th St 2,310 1,745 -565 456 322 -133 2,824 2,125 -699 31 15 -16 2,855 2,124 -731 N N 58 Tenth Ave & 30th St 2,410 1,895 -515 444 361 -83 2,915 2,318 -597 34 36 2 2,919 2,320 -599 N N 59 Tenth Ave & 31st St 1,930 1,530 -400 745 378 -367 2,724 1,959 -765 106 36 -70 2,830 1,950 -880 N N 60 Tenth Ave & 33rd St 2,355 1,885 -470 869 429 -439 3,283 2,377 -906 205 64 -141 3,488 2,374 -1,114 N N 61 Tenth Ave & 34th St 2,920 2,655 -265 1,201 377 -824 4,195 3,119 -1,076 192 54 -138 4,387 3,124 -1,263 N N Y 62 Tenth Ave & 35th St 2,400 2,040 -360 595 401 -194 3,056 2,509 -547 57 55 -2 3,113 2,519 -594 N N 66 Dyer Ave & 35th St 1,225 915 -310 58 43 -16 1,314 988 -326 46 20 -26 1,380 1,002 -378 N N 67 Dyer Ave & 34th St 1,245 1,370 125 429 13 -415 1,705 1,429 -276 120 16 -104 1,825 1,437 -388 N N N 68 Dyer Ave & 31st St 1,405 1,690 285 464 199 -265 1,904 1,944 40 176 47 -129 2,081 1,933 -148 N N 69 Dyer Ave & 30th St 880 1,060 180 105 127 22 1,007 1,222 215 69 37 -32 1,077 1,223 146 N N
Notes: 2006 FEIS – 2010 Build Year. MDP- Moynihan Station Development Project (2015 Build Year). *There is no No Build increment Network available in the 2006 FEIS. The No Build incremental layer is estimated by taking the difference between No Build Volumes and scaled existing volumes, which was calculated using 0.5% annual background growth rate compounded for 5 years (2005 to 2010). In the 2006 FEIS, the 2010 No Build Volumes were estimated based on Hudson Yards FGEIS, with some adjustments. If condition 1, 2, or 3 was met, this table registered the result with ‘Y’; if the condition is not met, this table registered the result with ‘N’.

Chapter 4.5: Transportation
4.5-23
Table 4.5-20Saturday Midday Traffic Volume and Increment Comparison of FEIS (2006) and Currently Proposed Projects
Analysis Location
Saturday MD Existing Volumes No Build Increments No Build Volumes Build Increments Build Volumes Condition Condition Condition
2006 FEIS (2005)
MDP (2008)
MDP-2006 FEIS
2006 FEIS (2010)
MDP (2015)
MDP-2006 FEIS
2006 FEIS (2010)
MDP (2015)
MDP-2006 FEIS
2006 FEIS (2010)
MDP (2015)
MDP-2006 FEIS
2006 FEIS (2010)
MDP (2015)
MDP-2006 FEIS 1-met? 2-met? 3-met?
8 Sixth Ave & 31st St 2,165 2,300 135 95 278 182 2,315 2,653 338 132 97 -35 2,447 2,657 210 Y N 9 Sixth Ave & 32nd St 1,880 1,915 35 35 188 153 1,962 2,166 204 74 36 -38 2,036 2,160 124 N N 10 Sixth Ave & 33rd St 1,665 1,785 120 33 136 103 1,740 1,980 240 83 34 -49 1,823 1,976 153 N N 11 Sixth Ave / Bway & 34th St 3,460 3,065 -395 191 87 -104 3,738 3,253 -485 103 2 -101 3,841 3,250 -591 N N N 12 Sixth Ave & 35th St 1,950 1,955 5 84 154 70 2,083 2,173 90 61 19 -42 2,144 2,165 21 N N 13 Broadway & 35th St 975 810 -165 74 96 22 1,074 933 -141 65 17 -48 1,139 927 -212 N N 22 Seventh Ave & 35th St 1,960 1,670 -290 166 339 173 2,175 2,064 -111 209 170 -39 2,384 2,088 -296 N N 23 Seventh Ave & 34th St 3,160 2,455 -705 364 284 -80 3,604 2,820 -784 308 167 -141 3,912 2,846 -1,066 N N Y 24 Seventh Ave & 33rd St 1,930 1,615 -315 189 350 161 2,168 2,018 -150 287 199 -88 2,455 2,042 -413 N N 25 Seventh Ave & 32nd St 1,620 1,360 -260 121 247 126 1,782 1,652 -130 -68 89 157 1,714 1,628 -86 N Y 26 Seventh Ave & 31st St 1,905 1,745 -160 179 336 157 2,132 2,138 6 -10 148 158 2,122 2,124 2 Y N 27 Seventh Ave & 30th St 1,790 1,490 -300 183 334 151 2,018 1,873 -145 70 104 34 2,088 1,863 -225 N N 28 Seventh Ave & 29th St 1,670 1,695 25 143 261 118 1,855 2,012 157 14 39 25 1,869 1,997 128 N N 29 Seventh Ave & 28th St 1,575 1,705 130 142 219 77 1,757 1,980 223 3 37 34 1,760 1,974 214 N N 32 Eighth Ave & 28th St 1,810 1,880 70 232 199 -34 2,088 2,141 53 125 86 -39 2,213 2,137 -76 Y N 33 Eighth Ave & 29th St 1,905 1,870 -35 230 238 8 2,183 2,169 -14 138 89 -49 2,321 2,159 -162 N N 34 Eighth Ave & 30th St 2,065 1,780 -285 385 438 53 2,502 2,277 -225 349 194 -155 2,851 2,223 -628 N N 35 Eighth Ave & 31st St 2,180 2,035 -145 356 413 57 2,591 2,515 -76 146 216 70 2,843 2,453 -390 N N 36 Eighth Ave & 33rd St 1,925 1,705 -220 324 383 59 2,298 2,145 -153 477 242 -235 2,775 2,137 -638 N N 37 Eighth Ave & 34th St 3,125 2,480 -645 395 268 -127 3,599 2,830 -769 248 161 -87 3,847 2,823 -1,024 N N Y 38 Eighth Ave & 35th St 2,085 1,840 -245 201 327 125 2,339 2,227 -112 106 150 44 2,423 2,205 -218 N N 47 Ninth Ave & 35th St 1,780 1,535 -245 216 230 14 2,041 1,815 -226 82 72 -10 2,134 1,770 -364 N N 48 Ninth Ave & 34th St 2,010 1,845 -165 268 217 -52 2,329 2,122 -207 104 73 -31 2,433 2,078 -355 N N Y 49 Ninth Ave & 33rd St 1,950 1,820 -130 382 370 -12 2,381 2,250 -131 494 160 -334 2,875 2,200 -675 N N 50 Ninth Ave & 31st St 2,205 2,115 -90 425 433 7 2,686 2,618 -68 449 212 -237 3,135 2,568 -567 N N 51 Ninth Ave & 30th St 2,320 2,110 -210 406 461 54 2,785 2,640 -145 411 205 -206 3,196 2,576 -620 N N 52 Ninth Ave & 29th St 2,110 2,165 55 253 260 7 2,416 2,496 80 199 97 -102 2,615 2,475 -140 Y N 53 Ninth Ave & 28th St 2,085 2,015 -70 226 224 -2 2,364 2,306 -58 177 93 -84 2,541 2,286 -255 N N 56 Tenth Ave & 28th St 2,215 1,600 -615 179 192 13 2,450 1,844 -606 61 16 -45 2,511 1,846 -665 N N 57 Tenth Ave & 29th St 2,240 1,750 -490 205 223 18 2,502 2,031 -471 81 18 -63 2,583 2,031 -552 N N 58 Tenth Ave & 30th St 2,180 1,770 -410 177 320 143 2,412 2,148 -264 76 37 -39 2,488 2,121 -367 N N 59 Tenth Ave & 31st St 1,865 1,470 -395 360 274 -86 2,272 1,793 -479 107 39 -68 2,379 1,781 -598 N N 60 Tenth Ave & 33rd St 2,175 1,740 -435 445 356 -89 2,675 2,153 -522 282 65 -217 2,957 2,128 -829 N N 61 Tenth Ave & 34th St 2,665 2,195 -470 460 286 -174 3,192 2,553 -639 295 59 -236 3,488 2,552 -936 N N Y 62 Tenth Ave & 35th St 2,095 1,740 -355 250 285 35 2,398 2,083 -315 100 57 -43 2,498 2,088 -410 N N 66 Dyer Ave & 35th St 1,200 800 -400 36 32 -3 1,266 859 -407 65 20 -45 1,331 871 -460 N N 67 Dyer Ave & 34th St 1,505 1,050 -455 218 29 -189 1,761 1,114 -647 203 20 -183 1,856 1,123 -733 N N N 68 Dyer Ave & 31st St 1,505 1,065 -440 263 131 -132 1,806 1,231 -575 189 57 -132 1,996 1,222 -774 N N 69 Dyer Ave & 30th St 1,105 780 -325 84 158 73 1,217 963 -254 112 43 -69 1,329 938 -391 N N
Notes: 2006 FEIS – 2010 Build Year; MDP- Moynihan Station Development Project (2015 Build Year). * There is no No Build increment Network available in the 2006 FEIS. The No Build incremental layer is estimated by taking the difference between No Build Volumes and scaled existing volumes, which was calculated using 0.5% annual background growth rate compounded for 5 years (2005 to 2010). In the 2006 FEIS, the 2010 No Build Volumes were estimated based on Hudson Yards FGEIS, with some adjustments. If condition 1, 2, or 3 was met, this table registered the result with ‘Y’; if the condition is not met, this table registered the result with ‘N’.
Moynihan Station Development Project
4.5-24
Table 4.5-21Comparison of FEIS (2006) and
Currently Proposed Projects -- Screening Criterion
Analysis Location
Meets Condition 1? Meets Condition 2? Meets Condition 3?Meets 1 or More
Screening Criteria?
AM MD PMSAT MD AM MD PM
SAT MD AM MD PM
SAT MD AM MD PM
SAT MD
8 Sixth Ave & 31st St N N N Y N N N N N N N N N N N Y 9 Sixth Ave & 32nd St N N N N N N N N N N N N N N N N 10 Sixth Ave & 33rd St N N N N N N N N N N N N N N N N 11 Sixth Ave / Bway & 34th St N N N N N N N N N N N N N N N N 12 Sixth Ave & 35th St N N N N N N N N N N N N N N N N 13 Broadway & 35th St N N N N N N N N N N N N N N N N 22 Seventh Ave & 35th St N Y Y N N N N N N N N N N Y Y N 23 Seventh Ave & 34th St N N N N N N N N Y Y Y Y Y Y Y Y 24 Seventh Ave & 33rd St N Y Y N N N N N N N N N N Y Y N 25 Seventh Ave & 32nd St N Y Y N N N N Y N N N N N Y Y Y 26 Seventh Ave & 31st St Y Y N Y N N Y N N N N N Y Y Y Y 27 Seventh Ave & 30th St N Y Y N N N N N N N N N N Y Y N 28 Seventh Ave & 29th St N N N N N N N N N N N N N N N N 29 Seventh Ave & 28th St N N N N N N N N N N N N N N N N 32 Eighth Ave & 28th St Y N N Y N N N N N N N N Y N N Y 33 Eighth Ave & 29th St N N N N N N N N N N N N N N N N 34 Eighth Ave & 30th St N N N N N N N N N N N N N N N N 35 Eighth Ave & 31st St N N N N Y N Y N N N N N Y N Y N 36 Eighth Ave & 33rd St N N N N N N N N N N N N N N N N 37 Eighth Ave & 34th St N N N N N N N N Y Y Y Y Y Y Y Y 38 Eighth Ave & 35th St N Y N N N N N N N N N N N Y N N 47 Ninth Ave & 35th St N N N N N N N N N N N N N N N N 48 Ninth Ave & 34th St N N N N N N N N N Y Y Y N Y Y Y 49 Ninth Ave & 33rd St N N N N N N N N N N N N N N N N 50 Ninth Ave & 31st St N N N N N N N N N N N N N N N N 51 Ninth Ave & 30th St N N N N N N N N N N N N N N N N 52 Ninth Ave & 29th St N N N Y N N N N N N N N N N N Y 53 Ninth Ave & 28th St N N N N N N N N N N N N N N N N 56 Tenth Ave & 28th St N N N N N N N N N N N N N N N N 57 Tenth Ave & 29th St N N N N N N N N N N N N N N N N 58 Tenth Ave & 30th St N N N N N N N N N N N N N N N N 59 Tenth Ave & 31st St N N N N N N N N N N N N N N N N 60 Tenth Ave & 33rd St N N N N N N N N N N N N N N N N 61 Tenth Ave & 34th St N N N N N N N N N Y Y Y N Y Y Y 62 Tenth Ave & 35th St N N N N N N N N N N N N N N N N 66 Dyer Ave & 35th St N N N N N N N N N N N N N N N N 67 Dyer Ave & 34th St N N N N N N N N N N N N N N N N 68 Dyer Ave & 31st St N N N N N N N N N N N N N N N N 69 Dyer Ave & 30th St N N N N N N N N N N N N N N N N
Note: If condition 1, 2, or 3 was met, this table will register the result with ‘Y’; if the condition is not met, this table will register the result with ‘N’.
TRAFFIC ANALYSIS
LEVEL OF SERVICE CRITERIA
The operation of signalized intersections in the study area was analyzed in accordance with CEQR guidelines by applying the methodologies presented in the 2000 Highway Capacity Manual (HCM) Version 4.1f. This procedure evaluates signalized intersections for average delay per vehicle and LOS.

Chapter 4.5: Transportation
4.5-25
The LOS for the signalized intersections is based on the average stopped delay per vehicle for the various lane group movements within the intersection. This delay is the basis for an LOS determination for individual lane groups (grouping of movements in one or more travel lanes), the approaches, and the overall intersection. The levels of service are defined in Table 4.5-22 below.
Table 4.5-22 LOS Criteria for Signalized Intersections
Level-of-Service (LOS) Average Delay A 10.0 seconds B 10.0 and 20.0 seconds C 20.0 and 35.0 seconds D 35.0 and 55.0 seconds E 55.0 and 80.0 seconds F 80.0 seconds
Sources: Transportation Research Board. Highway Capacity Manual, 2000.
Although the HCM methodology calculates a volume-to-capacity (v/c) ratio, there is no strict relationship between v/c ratios and LOS as defined in the HCM. A high v/c ratio indicates substantial traffic passing through an intersection, but a high v/c ratio combined with low average delay actually represents the most efficient condition in terms of traffic engineering standards, where an approach or the whole intersection processes traffic close to its theoretical maximum with minimal delay. However, very high v/c ratios—especially those approaching or greater than 1.0—are often correlated with a deteriorated LOS. Other important variables affecting delay include cycle length, progression, and green time. LOS A and B indicate good operating conditions with minimal delay. At LOS C, the number of vehicles stopping is higher, but congestion is still fairly light. LOS D describes a condition where congestion levels are more noticeable and individual cycle failures (a condition where motorists may have to wait for more than one green phase to clear the intersection) can occur. The mid-point of this service level (45 seconds of delay) is considered the threshold of acceptable operating conditions. Conditions at LOS E and F reflect poor service levels, and cycle failures are frequent. The HCM methodology provides for a summary of the total intersection operating conditions, by identifying the two critical movements (the worst-case from each roadway) and calculating a summary of critical v/c ratio, delay, and LOS.
SIGNIFICANT IMPACT CRITERIA
According to the criteria presented in the CEQR Technical Manual, impacts are considered significant and require examination of mitigation if they result in an increase of 5 or more seconds of delay in a lane group over No Build levels beyond mid-LOS D. For No Build LOS E, a 4-second increase in delay is considered significant. For No Build LOS F, a 3-second increase in delay is considered significant. However, if the No Build LOS F condition already corresponds with a delay in excess of 120 seconds, an increase of 1.0 or more seconds of delay is considered significant. In addition, impacts are considered significant if levels of service deteriorate from acceptable A, B or C in the No Build conditions to marginally unacceptable LOS D (a delay in excess of 45 seconds, the midpoint of LOS D), or unacceptable LOS E or F in the future Build conditions. The above sliding scale is applicable only if the proposed project is expected to generate five or more vehicle trips through the analysis intersection during the peak hour being examined.

Moynihan Station Development Project
4.5-26
INTERSECTIONS WITH IMPACTS
The 13 intersections identified during the screening analysis were analyzed to determine if there would be an impact on traffic for each of the affected analysis hours in the current 2015 Build year.1 However, only four of the intersections analyzed met the CEQR criteria for traffic impacts during one or more peak hours, as shown in Table 4.5-23.
Table 4.5-23Intersections Impacted by the Preferred Alternative (Prior to Mitigation)
Intersection Number and Location AM MD PM Saturday Midday 2 7th Ave @ 30th Street X 3 7th Ave @ 31st Street X X X 4 7th Ave @ 33rd Street X X 9 8th Ave @ 34th Street X
By comparison, the 2006 FEIS identified 12 intersections that required mitigation for one or more peak periods. Accordingly, the Preferred Alternative, when analyzed in connection with the changes to the traffic network, results in fewer impacted intersections from the Project analyzed in the 2006 FEIS. Further, three of the twelve intersections did not satisfy any of the screening criteria and were not analyzed, because impacts would have been highly unlikely.
MITIGATION MEASURES
Table 4.5-24 describes the proposed mitigation measures at each of the intersections for the peak hours impacted by the Preferred Alternative.
The traffic impacts at the four identified intersections can be fully mitigated by standard traffic engineering methods: primarily signal timing and providing an additional approach lane and by restricting parking where needed to better accommodate turning movements.
Table 4.5-25 shows a comparison of the mitigation measures proposed for the Preferred Alternative compared to the mitigation measures identified in the 2006 FEIS. For the four locations where traffic impacts were identified in the 2015 Build condition, the identified mitigation measures are shown. In general, these are low cost mitigation measures, similar to mitigation measures proposed in the 2006 FEIS.
1 Intersection 4-Seventh Avenue at West 32nd Street—was not analyzed because there are no conflicting
traffic movements.
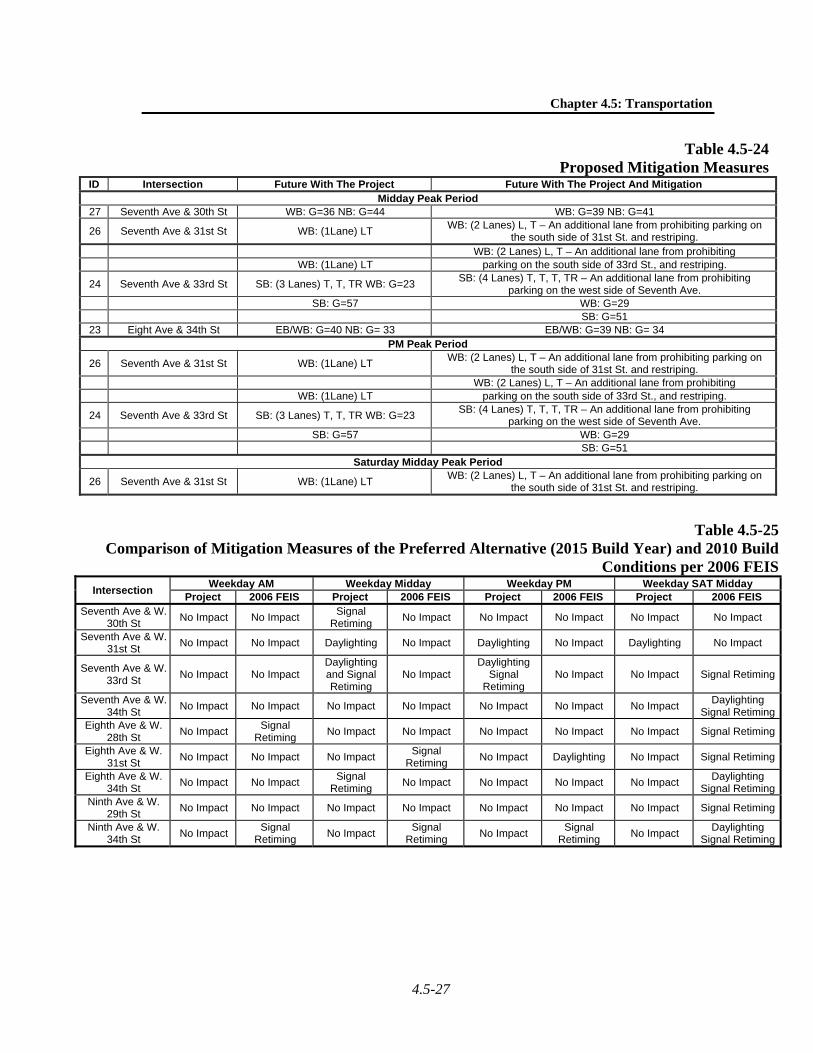
Chapter 4.5: Transportation
4.5-27
Table 4.5-24Proposed Mitigation Measures
ID Intersection Future With The Project Future With The Project And Mitigation Midday Peak Period
27 Seventh Ave & 30th St WB: G=36 NB: G=44 WB: G=39 NB: G=41
26 Seventh Ave & 31st St WB: (1Lane) LT WB: (2 Lanes) L, T – An additional lane from prohibiting parking on
the south side of 31st St. and restriping. WB: (2 Lanes) L, T – An additional lane from prohibiting WB: (1Lane) LT parking on the south side of 33rd St., and restriping.
24 Seventh Ave & 33rd St SB: (3 Lanes) T, T, TR WB: G=23 SB: (4 Lanes) T, T, T, TR – An additional lane from prohibiting
parking on the west side of Seventh Ave. SB: G=57 WB: G=29 SB: G=51
23 Eight Ave & 34th St EB/WB: G=40 NB: G= 33 EB/WB: G=39 NB: G= 34 PM Peak Period
26 Seventh Ave & 31st St WB: (1Lane) LT WB: (2 Lanes) L, T – An additional lane from prohibiting parking on
the south side of 31st St. and restriping. WB: (2 Lanes) L, T – An additional lane from prohibiting WB: (1Lane) LT parking on the south side of 33rd St., and restriping.
24 Seventh Ave & 33rd St SB: (3 Lanes) T, T, TR WB: G=23 SB: (4 Lanes) T, T, T, TR – An additional lane from prohibiting
parking on the west side of Seventh Ave. SB: G=57 WB: G=29 SB: G=51
Saturday Midday Peak Period
26 Seventh Ave & 31st St WB: (1Lane) LT WB: (2 Lanes) L, T – An additional lane from prohibiting parking on
the south side of 31st St. and restriping.
Table 4.5-25Comparison of Mitigation Measures of the Preferred Alternative (2015 Build Year) and 2010 Build
Conditions per 2006 FEISIntersection
Weekday AM Weekday Midday Weekday PM Weekday SAT Midday Project 2006 FEIS Project 2006 FEIS Project 2006 FEIS Project 2006 FEIS
Seventh Ave & W. 30th St
No Impact No Impact Signal
Retiming No Impact No Impact No Impact No Impact No Impact
Seventh Ave & W. 31st St
No Impact No Impact Daylighting No Impact Daylighting No Impact Daylighting No Impact
Seventh Ave & W. 33rd St
No Impact No Impact Daylighting and Signal Retiming
No Impact Daylighting
Signal Retiming
No Impact No Impact Signal Retiming
Seventh Ave & W. 34th St
No Impact No Impact No Impact No Impact No Impact No Impact No Impact Daylighting
Signal RetimingEighth Ave & W.
28th St No Impact
Signal Retiming
No Impact No Impact No Impact No Impact No Impact Signal Retiming
Eighth Ave & W. 31st St
No Impact No Impact No Impact Signal
Retiming No Impact Daylighting No Impact Signal Retiming
Eighth Ave & W. 34th St
No Impact No Impact Signal
Retiming No Impact No Impact No Impact No Impact
Daylighting Signal Retiming
Ninth Ave & W. 29th St
No Impact No Impact No Impact No Impact No Impact No Impact No Impact Signal Retiming
Ninth Ave & W. 34th St
No Impact Signal
Retiming No Impact
Signal Retiming
No Impact Signal
Retiming No Impact
Daylighting Signal Retiming
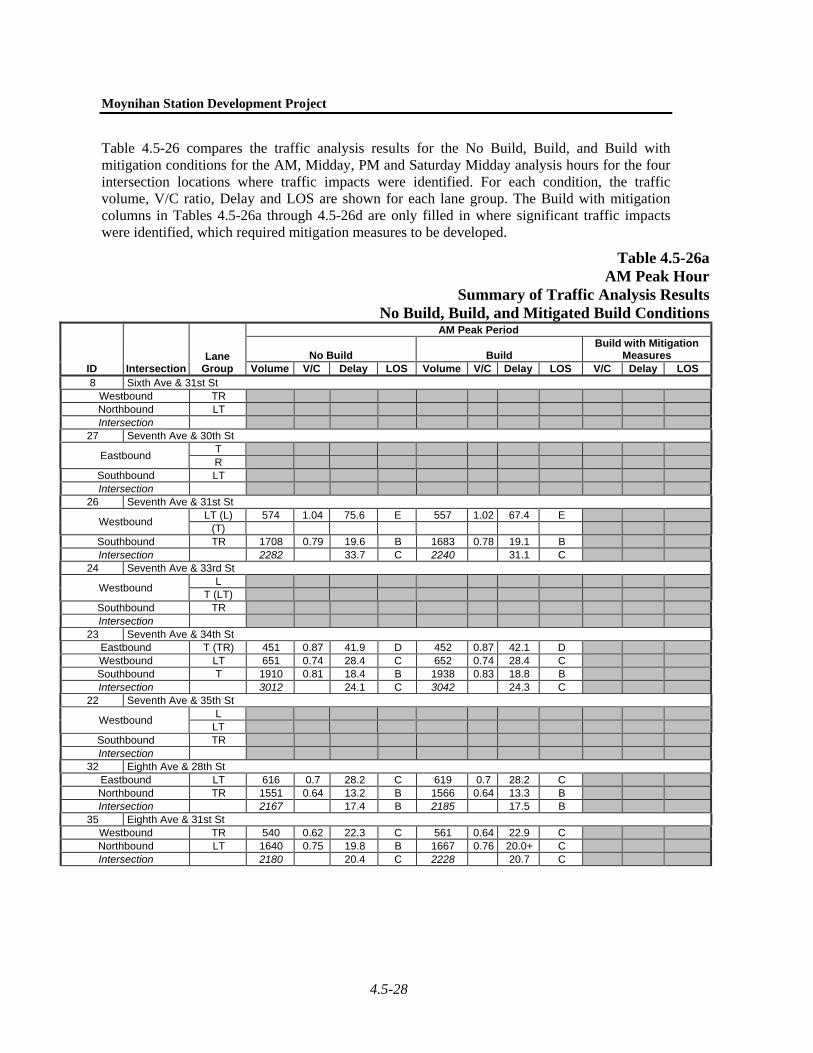
Moynihan Station Development Project
4.5-28
Table 4.5-26 compares the traffic analysis results for the No Build, Build, and Build with mitigation conditions for the AM, Midday, PM and Saturday Midday analysis hours for the four intersection locations where traffic impacts were identified. For each condition, the traffic volume, V/C ratio, Delay and LOS are shown for each lane group. The Build with mitigation columns in Tables 4.5-26a through 4.5-26d are only filled in where significant traffic impacts were identified, which required mitigation measures to be developed.
Table 4.5-26aAM Peak Hour
Summary of Traffic Analysis ResultsNo Build, Build, and Mitigated Build Conditions
ID Intersection Lane
Group
AM Peak Period
No Build Build Build with Mitigation
Measures Volume V/C Delay LOS Volume V/C Delay LOS V/C Delay LOS
8 Sixth Ave & 31st St Westbound TR Northbound LT Intersection
27 Seventh Ave & 30th St
Eastbound T R
Southbound LT Intersection
26 Seventh Ave & 31st St
Westbound LT (L) 574 1.04 75.6 E 557 1.02 67.4 E
(T) Southbound TR 1708 0.79 19.6 B 1683 0.78 19.1 B Intersection 2282 33.7 C 2240 31.1 C
24 Seventh Ave & 33rd St
Westbound L
T (LT) Southbound TR Intersection
23 Seventh Ave & 34th St Eastbound T (TR) 451 0.87 41.9 D 452 0.87 42.1 D Westbound LT 651 0.74 28.4 C 652 0.74 28.4 C Southbound T 1910 0.81 18.4 B 1938 0.83 18.8 B Intersection 3012 24.1 C 3042 24.3 C
22 Seventh Ave & 35th St
Westbound L
LT Southbound TR Intersection
32 Eighth Ave & 28th St Eastbound LT 616 0.7 28.2 C 619 0.7 28.2 C Northbound TR 1551 0.64 13.2 B 1566 0.64 13.3 B Intersection 2167 17.4 B 2185 17.5 B
35 Eighth Ave & 31st St Westbound TR 540 0.62 22.3 C 561 0.64 22.9 C Northbound LT 1640 0.75 19.8 B 1667 0.76 20.0+ C Intersection 2180 20.4 C 2228 20.7 C
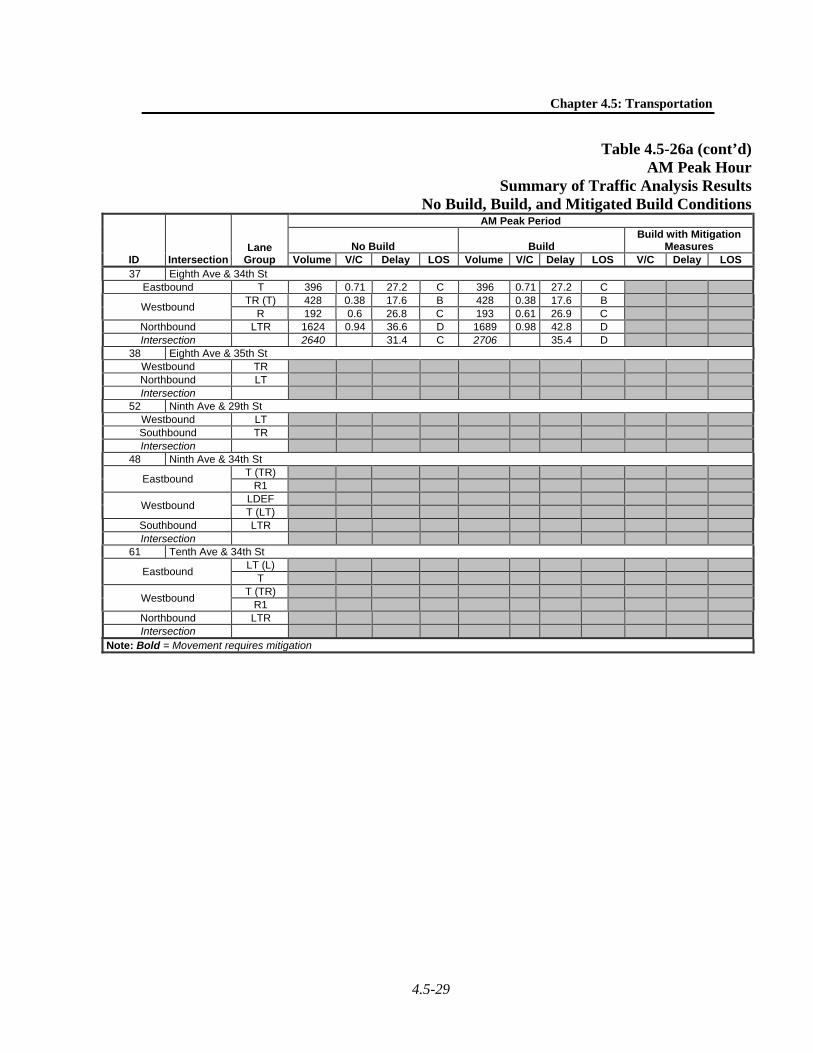
Chapter 4.5: Transportation
4.5-29
Table 4.5-26a (cont’d)AM Peak Hour
Summary of Traffic Analysis ResultsNo Build, Build, and Mitigated Build Conditions
ID Intersection Lane
Group
AM Peak Period
No Build Build Build with Mitigation
Measures Volume V/C Delay LOS Volume V/C Delay LOS V/C Delay LOS
37 Eighth Ave & 34th St Eastbound T 396 0.71 27.2 C 396 0.71 27.2 C
Westbound TR (T) 428 0.38 17.6 B 428 0.38 17.6 B
R 192 0.6 26.8 C 193 0.61 26.9 C Northbound LTR 1624 0.94 36.6 D 1689 0.98 42.8 D Intersection 2640 31.4 C 2706 35.4 D
38 Eighth Ave & 35th St Westbound TR Northbound LT Intersection
52 Ninth Ave & 29th St Westbound LT Southbound TR Intersection
48 Ninth Ave & 34th St
Eastbound T (TR)
R1
Westbound LDEF T (LT)
Southbound LTR Intersection
61 Tenth Ave & 34th St
Eastbound LT (L)
T
Westbound T (TR)
R1 Northbound LTR Intersection
Note: Bold = Movement requires mitigation

Moynihan Station Development Project
4.5-30
Table 4.5-26bMD Peak Hour
Summary of Traffic Analysis ResultsNo Build, Build, and Mitigated Build Conditions
ID Intersection Lane
Group
MD Peak Period
No Build Build Build with Mitigation
Measures Volume V/C Delay LOS Volume V/C Delay LOS V/C Delay LOS
8 Sixth Ave & 31st St Westbound TR Northbound LT Intersection
27 Seventh Ave & 30th St
Eastbound T 429 0.9 47.1 D 449 0.94 54.1 D 0.87 40.3 D R 150 0.37 21.5 C 151 0.38 21.6 C 0.34 18.9 B
Southbound LT 1393 0.62 14.5 B 1391 0.62 14.5 B 0.67 17.5 B Intersection 1972 22.1 C 1991 23.9 C 22.8 C
26 Seventh Ave & 31st St
Westbound LT (L) 624 1.19 126.9 F 631 1.2 131.9 F 0.4 20.8 C
(T) 0.78 31.8 C Southbound TR 1473 0.74 18.3 B 1471 0.74 18.3 B 0.74 18.3 B Intersection 2097 50.6 D 2102 52.4 D 21.5 C
24 Seventh Ave & 33rd St
Westbound L 0.7 43.1 D
T (LT) 295 1.17 144.4 F 314 1.22 162 F 0.34 25.2 C Southbound TR 1803 0.86 10.9 B 1864 0.91 13.8 B 0.75 11.5 B Intersection 2098 29.7 C 2178 35.1 D 14.7 B
23 Seventh Ave & 34th St Eastbound T (TR) 394 0.76 33.2 C 395 0.76 33.3 C Westbound LT 701 0.76 29.6 C 702 0.77 29.7 C Southbound T 1766 0.77 17.3 B 1828 0.8 18 B Intersection 2861 22.5 C 2925 22.9 C
22 Seventh Ave & 35th St
Westbound L 166 0.54 28.1 C 168 0.54 28.3 C
LT 277 0.71 33.9 C 277 0.71 33.9 C Southbound TR 1720 0.76 15.6 B 1780 0.79 16.2 B Intersection 2163 18.9 B 2225 19.3 B
32 Eighth Ave & 28th St Eastbound LT Northbound TR Intersection
35 Eighth Ave & 31st St Westbound TR Northbound LT Intersection
37 Eighth Ave & 34th St Eastbound T 363 0.6 23 C 363 0.6 23 C 0.61 24.1 C
Westbound TR (T) 489 0.42 18.2 B 489 0.42 18.2 B 0.43 19 B
R 186 0.6 26.9 C 187 0.6 27.1 C 0.63 28.9 C Northbound LTR 1743 0.98 42.7 D 1789 1.01 49.2 D 0.98 41.2 D Intersection 2781 34.7 C 2828 39 D 34.4 C
38 Eighth Ave & 35th St Westbound TR 402 0.98 63.6 E 401 0.98 62.5 E Northbound LT 1805 0.82 21.8 C 1840 0.84 22.5 C Intersection 2207 29.4 C 2241 29.6 C
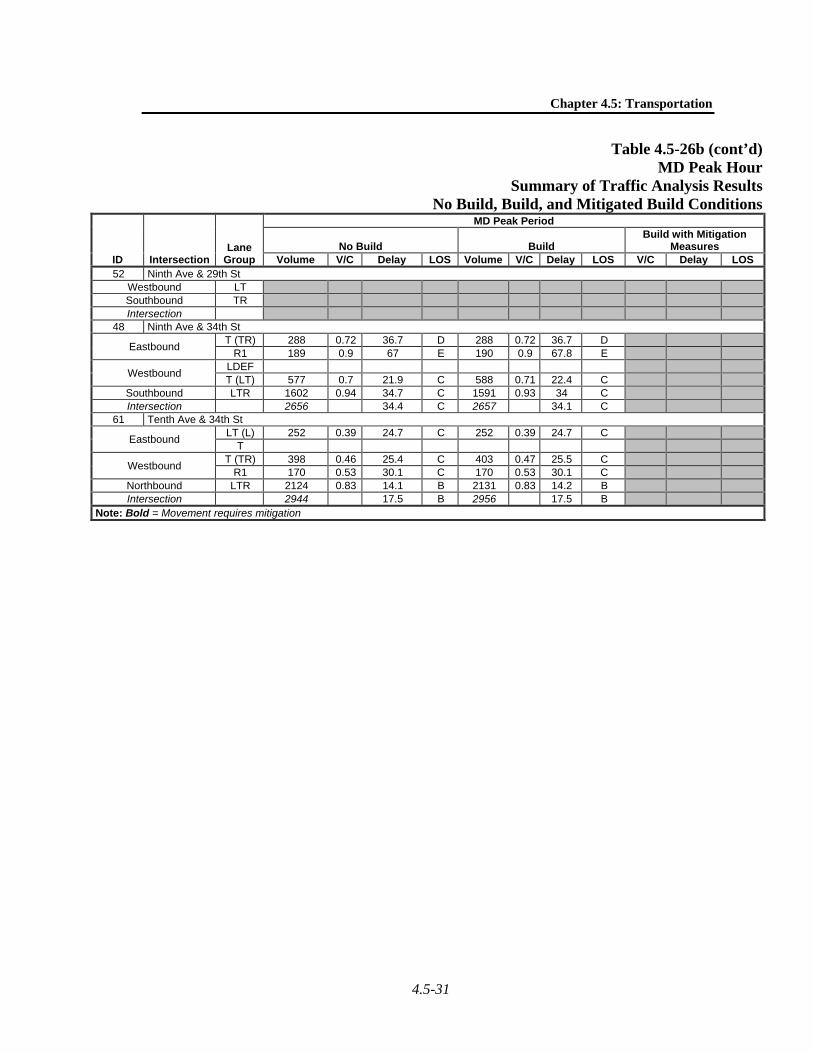
Chapter 4.5: Transportation
4.5-31
Table 4.5-26b (cont’d)MD Peak Hour
Summary of Traffic Analysis ResultsNo Build, Build, and Mitigated Build Conditions
ID Intersection Lane
Group
MD Peak Period
No Build Build Build with Mitigation
Measures Volume V/C Delay LOS Volume V/C Delay LOS V/C Delay LOS
52 Ninth Ave & 29th St Westbound LT Southbound TR Intersection
48 Ninth Ave & 34th St
Eastbound T (TR) 288 0.72 36.7 D 288 0.72 36.7 D
R1 189 0.9 67 E 190 0.9 67.8 E
Westbound LDEF T (LT) 577 0.7 21.9 C 588 0.71 22.4 C
Southbound LTR 1602 0.94 34.7 C 1591 0.93 34 C Intersection 2656 34.4 C 2657 34.1 C
61 Tenth Ave & 34th St
Eastbound LT (L) 252 0.39 24.7 C 252 0.39 24.7 C
T
Westbound T (TR) 398 0.46 25.4 C 403 0.47 25.5 C
R1 170 0.53 30.1 C 170 0.53 30.1 C Northbound LTR 2124 0.83 14.1 B 2131 0.83 14.2 B Intersection 2944 17.5 B 2956 17.5 B
Note: Bold = Movement requires mitigation
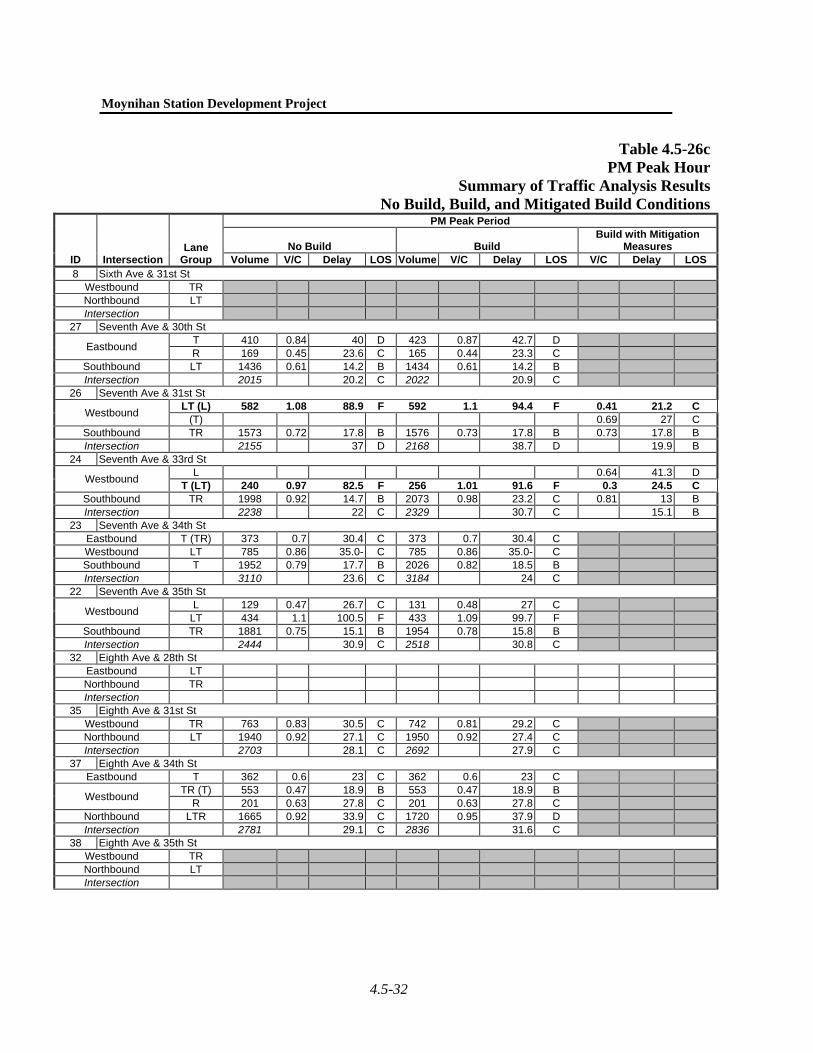
Moynihan Station Development Project
4.5-32
Table 4.5-26cPM Peak Hour
Summary of Traffic Analysis ResultsNo Build, Build, and Mitigated Build Conditions
ID Intersection Lane
Group
PM Peak Period
No Build Build Build with Mitigation
Measures Volume V/C Delay LOS Volume V/C Delay LOS V/C Delay LOS
8 Sixth Ave & 31st St Westbound TR Northbound LT Intersection
27 Seventh Ave & 30th St
Eastbound T 410 0.84 40 D 423 0.87 42.7 D R 169 0.45 23.6 C 165 0.44 23.3 C
Southbound LT 1436 0.61 14.2 B 1434 0.61 14.2 B Intersection 2015 20.2 C 2022 20.9 C
26 Seventh Ave & 31st St
Westbound LT (L) 582 1.08 88.9 F 592 1.1 94.4 F 0.41 21.2 C
(T) 0.69 27 C Southbound TR 1573 0.72 17.8 B 1576 0.73 17.8 B 0.73 17.8 B Intersection 2155 37 D 2168 38.7 D 19.9 B
24 Seventh Ave & 33rd St
Westbound L 0.64 41.3 D
T (LT) 240 0.97 82.5 F 256 1.01 91.6 F 0.3 24.5 C Southbound TR 1998 0.92 14.7 B 2073 0.98 23.2 C 0.81 13 B Intersection 2238 22 C 2329 30.7 C 15.1 B
23 Seventh Ave & 34th St Eastbound T (TR) 373 0.7 30.4 C 373 0.7 30.4 C Westbound LT 785 0.86 35.0- C 785 0.86 35.0- C Southbound T 1952 0.79 17.7 B 2026 0.82 18.5 B Intersection 3110 23.6 C 3184 24 C
22 Seventh Ave & 35th St
Westbound L 129 0.47 26.7 C 131 0.48 27 C
LT 434 1.1 100.5 F 433 1.09 99.7 F Southbound TR 1881 0.75 15.1 B 1954 0.78 15.8 B Intersection 2444 30.9 C 2518 30.8 C
32 Eighth Ave & 28th St Eastbound LT Northbound TR Intersection
35 Eighth Ave & 31st St Westbound TR 763 0.83 30.5 C 742 0.81 29.2 C Northbound LT 1940 0.92 27.1 C 1950 0.92 27.4 C Intersection 2703 28.1 C 2692 27.9 C
37 Eighth Ave & 34th St Eastbound T 362 0.6 23 C 362 0.6 23 C
Westbound TR (T) 553 0.47 18.9 B 553 0.47 18.9 B
R 201 0.63 27.8 C 201 0.63 27.8 C Northbound LTR 1665 0.92 33.9 C 1720 0.95 37.9 D Intersection 2781 29.1 C 2836 31.6 C
38 Eighth Ave & 35th St Westbound TR Northbound LT Intersection
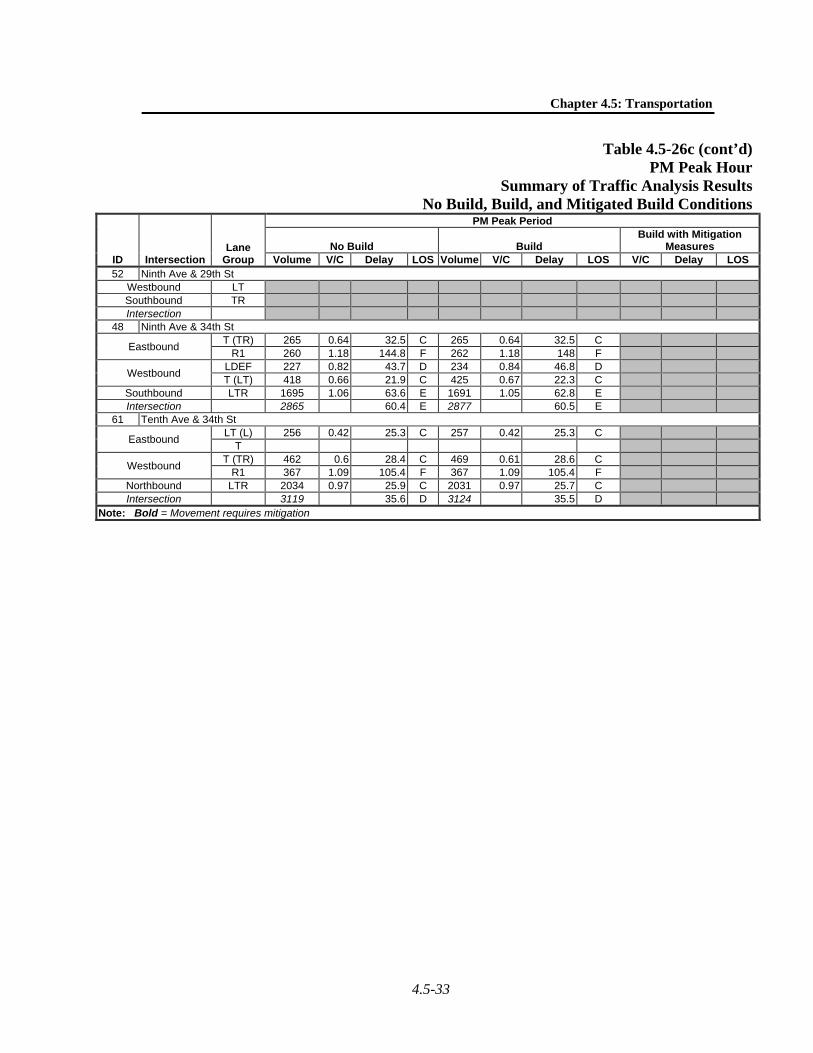
Chapter 4.5: Transportation
4.5-33
Table 4.5-26c (cont’d)PM Peak Hour
Summary of Traffic Analysis ResultsNo Build, Build, and Mitigated Build Conditions
ID Intersection Lane
Group
PM Peak Period
No Build Build Build with Mitigation
Measures Volume V/C Delay LOS Volume V/C Delay LOS V/C Delay LOS
52 Ninth Ave & 29th St Westbound LT Southbound TR Intersection
48 Ninth Ave & 34th St
Eastbound T (TR) 265 0.64 32.5 C 265 0.64 32.5 C
R1 260 1.18 144.8 F 262 1.18 148 F
Westbound LDEF 227 0.82 43.7 D 234 0.84 46.8 D T (LT) 418 0.66 21.9 C 425 0.67 22.3 C
Southbound LTR 1695 1.06 63.6 E 1691 1.05 62.8 E Intersection 2865 60.4 E 2877 60.5 E
61 Tenth Ave & 34th St
Eastbound LT (L) 256 0.42 25.3 C 257 0.42 25.3 C
T
Westbound T (TR) 462 0.6 28.4 C 469 0.61 28.6 C
R1 367 1.09 105.4 F 367 1.09 105.4 F Northbound LTR 2034 0.97 25.9 C 2031 0.97 25.7 C Intersection 3119 35.6 D 3124 35.5 D
Note: Bold = Movement requires mitigation
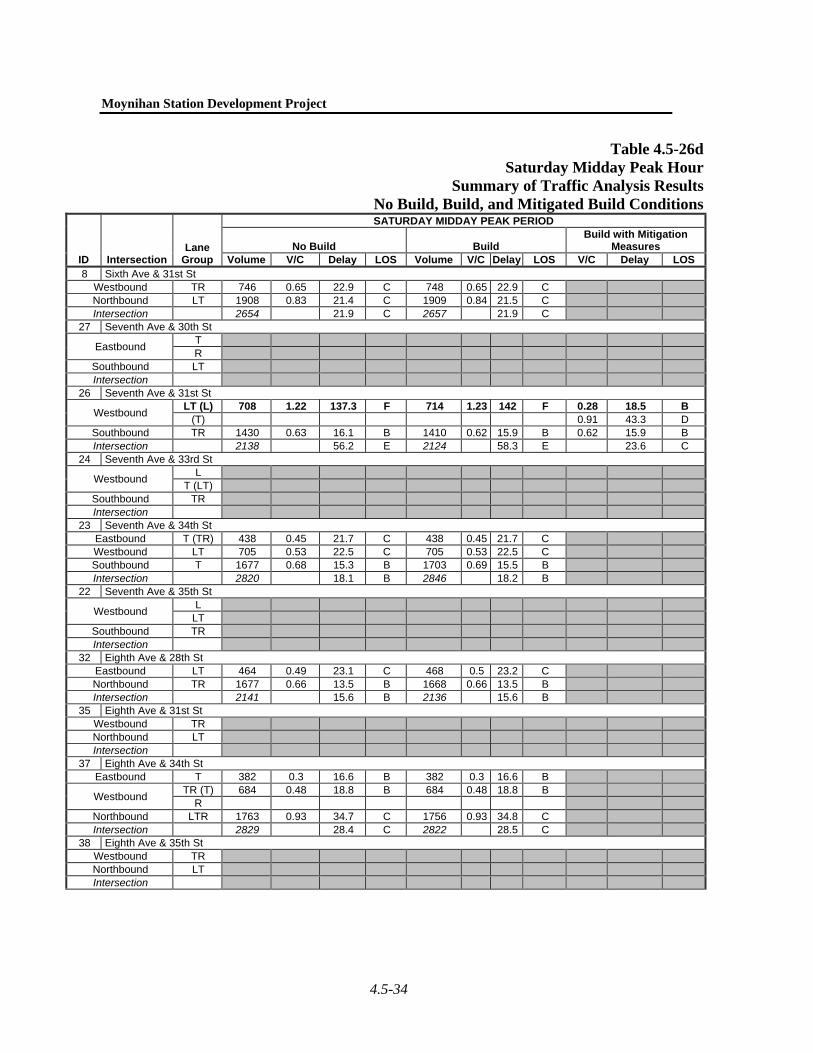
Moynihan Station Development Project
4.5-34
Table 4.5-26dSaturday Midday Peak Hour
Summary of Traffic Analysis ResultsNo Build, Build, and Mitigated Build Conditions
ID Intersection Lane
Group
SATURDAY MIDDAY PEAK PERIOD
No Build Build Build with Mitigation
Measures Volume V/C Delay LOS Volume V/C Delay LOS V/C Delay LOS
8 Sixth Ave & 31st St Westbound TR 746 0.65 22.9 C 748 0.65 22.9 C Northbound LT 1908 0.83 21.4 C 1909 0.84 21.5 C Intersection 2654 21.9 C 2657 21.9 C
27 Seventh Ave & 30th St
Eastbound T R
Southbound LT Intersection
26 Seventh Ave & 31st St
Westbound LT (L) 708 1.22 137.3 F 714 1.23 142 F 0.28 18.5 B
(T) 0.91 43.3 D Southbound TR 1430 0.63 16.1 B 1410 0.62 15.9 B 0.62 15.9 B Intersection 2138 56.2 E 2124 58.3 E 23.6 C
24 Seventh Ave & 33rd St
Westbound L
T (LT) Southbound TR Intersection
23 Seventh Ave & 34th St Eastbound T (TR) 438 0.45 21.7 C 438 0.45 21.7 C Westbound LT 705 0.53 22.5 C 705 0.53 22.5 C Southbound T 1677 0.68 15.3 B 1703 0.69 15.5 B Intersection 2820 18.1 B 2846 18.2 B
22 Seventh Ave & 35th St
Westbound L
LT Southbound TR Intersection
32 Eighth Ave & 28th St Eastbound LT 464 0.49 23.1 C 468 0.5 23.2 C Northbound TR 1677 0.66 13.5 B 1668 0.66 13.5 B Intersection 2141 15.6 B 2136 15.6 B
35 Eighth Ave & 31st St Westbound TR Northbound LT Intersection
37 Eighth Ave & 34th St Eastbound T 382 0.3 16.6 B 382 0.3 16.6 B
Westbound TR (T) 684 0.48 18.8 B 684 0.48 18.8 B
R Northbound LTR 1763 0.93 34.7 C 1756 0.93 34.8 C Intersection 2829 28.4 C 2822 28.5 C
38 Eighth Ave & 35th St Westbound TR Northbound LT Intersection
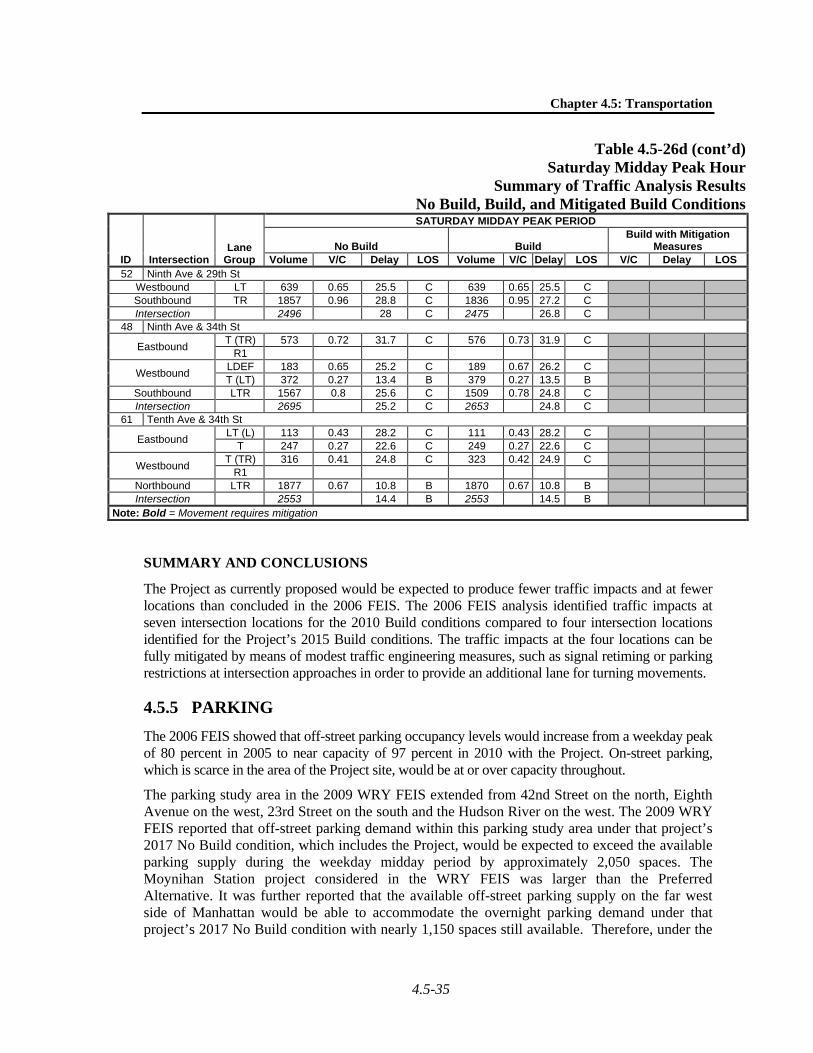
Chapter 4.5: Transportation
4.5-35
Table 4.5-26d (cont’d)Saturday Midday Peak Hour
Summary of Traffic Analysis ResultsNo Build, Build, and Mitigated Build Conditions
ID Intersection Lane
Group
SATURDAY MIDDAY PEAK PERIOD
No Build Build Build with Mitigation
Measures Volume V/C Delay LOS Volume V/C Delay LOS V/C Delay LOS
52 Ninth Ave & 29th St Westbound LT 639 0.65 25.5 C 639 0.65 25.5 C Southbound TR 1857 0.96 28.8 C 1836 0.95 27.2 C Intersection 2496 28 C 2475 26.8 C
48 Ninth Ave & 34th St
Eastbound T (TR) 573 0.72 31.7 C 576 0.73 31.9 C
R1
Westbound LDEF 183 0.65 25.2 C 189 0.67 26.2 C T (LT) 372 0.27 13.4 B 379 0.27 13.5 B
Southbound LTR 1567 0.8 25.6 C 1509 0.78 24.8 C Intersection 2695 25.2 C 2653 24.8 C
61 Tenth Ave & 34th St
Eastbound LT (L) 113 0.43 28.2 C 111 0.43 28.2 C
T 247 0.27 22.6 C 249 0.27 22.6 C
Westbound T (TR) 316 0.41 24.8 C 323 0.42 24.9 C
R1 Northbound LTR 1877 0.67 10.8 B 1870 0.67 10.8 B Intersection 2553 14.4 B 2553 14.5 B
Note: Bold = Movement requires mitigation
SUMMARY AND CONCLUSIONS
The Project as currently proposed would be expected to produce fewer traffic impacts and at fewer locations than concluded in the 2006 FEIS. The 2006 FEIS analysis identified traffic impacts at seven intersection locations for the 2010 Build conditions compared to four intersection locations identified for the Project’s 2015 Build conditions. The traffic impacts at the four locations can be fully mitigated by means of modest traffic engineering measures, such as signal retiming or parking restrictions at intersection approaches in order to provide an additional lane for turning movements.
4.5.5 PARKING
The 2006 FEIS showed that off-street parking occupancy levels would increase from a weekday peak of 80 percent in 2005 to near capacity of 97 percent in 2010 with the Project. On-street parking, which is scarce in the area of the Project site, would be at or over capacity throughout.
The parking study area in the 2009 WRY FEIS extended from 42nd Street on the north, Eighth Avenue on the west, 23rd Street on the south and the Hudson River on the west. The 2009 WRY FEIS reported that off-street parking demand within this parking study area under that project’s 2017 No Build condition, which includes the Project, would be expected to exceed the available parking supply during the weekday midday period by approximately 2,050 spaces. The Moynihan Station project considered in the WRY FEIS was larger than the Preferred Alternative. It was further reported that the available off-street parking supply on the far west side of Manhattan would be able to accommodate the overnight parking demand under that project’s 2017 No Build condition with nearly 1,150 spaces still available. Therefore, under the
Moynihan Station Development Project
4.5-36
2015 Build condition for the Project, it can be concluded that there would be a parking short-fall during the weekday midday period, but that overnight parking demand could be satisfied.
According to the CEQR Technical Manual, for proposed actions within the Manhattan Business District (defined as the area south of 61st Street), the inability of the Project or the surrounding area to accommodate projected future parking demands would be considered a parking shortfall, but is not deemed to be a significant adverse impact. This guidance reflects the City’s policies to discourage parking in the Midtown area. The unsatisfied demand for parking spaces during the midday peak utilization period would result in vehicles parking outside of the parking study area and motorists walking greater distances to their destinations. As parking shortfalls do not constitute significant adverse impacts under CEQR guidance, mitigation is not required.
4.5.6 TRANSIT AND PEDESTRIANS
As discussed above, the Preferred Alternative would include the redevelopment of the Farley Complex with the relocation and expansion of Amtrak service, and a new mixed-use off-site building on the Development Transfer Site. This program is similar to one of the development scenarios analyzed in the 2006 FEIS with regard to the redevelopment of the Farley Complex and the off-site building, with the one significant difference between the current Project and the 2006 Project being that Amtrak would be the main occupant at the new complex instead of NJT.
The 2006 FEIS provided detailed analyses of the 34th Street-Penn Station elements (stairways and control areas) serving patrons accessing the Seventh Avenue (1, 2, 3) and Eighth Avenue (A, C, E) subway lines and pedestrian elements (sidewalks, corner reservoirs, and crosswalks) at nine intersections in the immediate area of the Project site. The 2006 FEIS concluded that the development program analyzed for the 2010 Build condition would not result in any significant adverse impacts on subway stairways and control areas with the incorporation of proposed station improvements and mitigation measures outlined in the 2005 No. 7 Subway Extension—Hudson Yards Rezoning and Development Program Final Generic Environmental Impact Statement (FGEIS). For pedestrian conditions, 14 corner or crosswalk locations were projected to be significantly impacted during the weekday AM, midday, PM, and Saturday midday peak hours. Measures proposed to fully mitigate those impacts included widening of sidewalks and crosswalks and removal of sidewalk obstructions. The evaluation of the Preferred Alternative in this EA considers the same transit and pedestrian study areas and provides a summary of the current findings for the 2015 Build year and compares these findings with the related findings made for the 2010 Build year in the 2006 FEIS.
The Preferred Alternative, which would be completed by 2015, is expected to generate similar or fewer incremental levels of transit and pedestrian trips in the study area than what had been projected in the 2006 FEIS. The completion of other development projects in the future without the Project is also expected to progress at a slower pace than previously anticipated, resulting in fewer incremental transit and pedestrian trips in the No Build. A comparison of background transit and pedestrian levels indicates that overall activities in the area have not changed materially as well. Therefore, the future Build transit and pedestrian levels would be lower than or comparable to those analyzed in the 2006 FEIS and would result in a comparable number or fewer significant adverse impacts of similar or lesser magnitudes. As a result, the corresponding mitigation measures required would also be comparable to or less than those detailed in the 2006 FEIS.
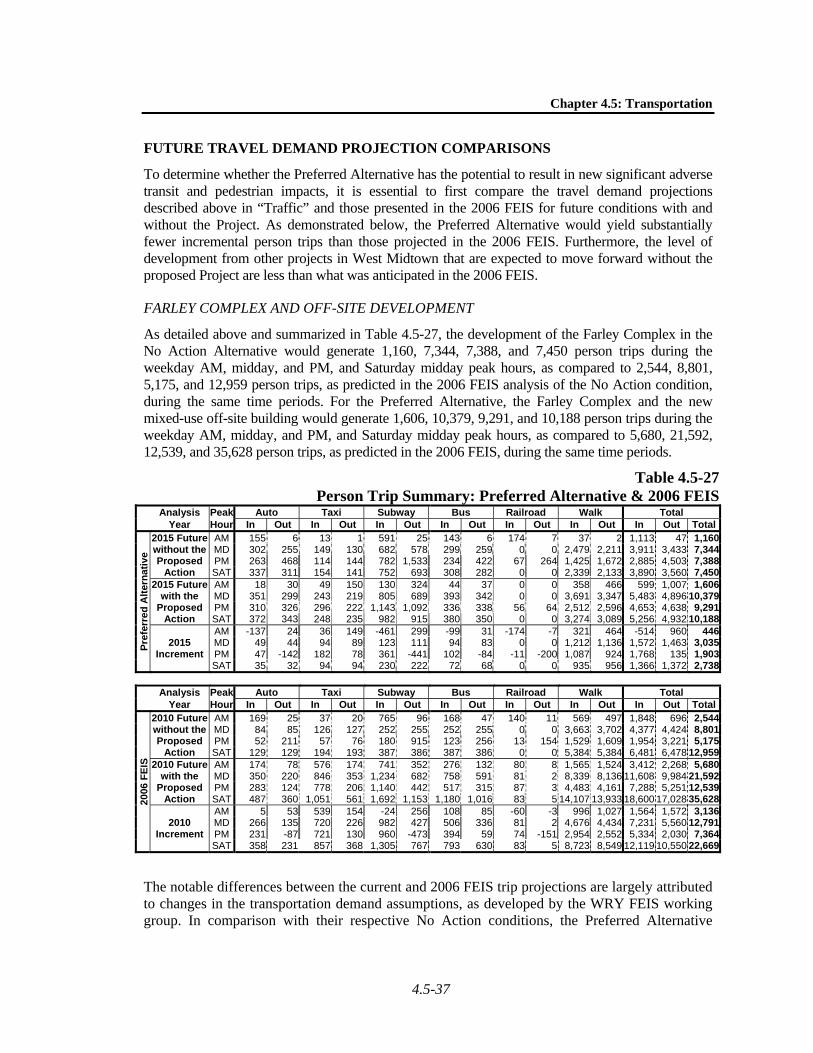
Chapter 4.5: Transportation
4.5-37
FUTURE TRAVEL DEMAND PROJECTION COMPARISONS
To determine whether the Preferred Alternative has the potential to result in new significant adverse transit and pedestrian impacts, it is essential to first compare the travel demand projections described above in “Traffic” and those presented in the 2006 FEIS for future conditions with and without the Project. As demonstrated below, the Preferred Alternative would yield substantially fewer incremental person trips than those projected in the 2006 FEIS. Furthermore, the level of development from other projects in West Midtown that are expected to move forward without the proposed Project are less than what was anticipated in the 2006 FEIS.
FARLEY COMPLEX AND OFF-SITE DEVELOPMENT
As detailed above and summarized in Table 4.5-27, the development of the Farley Complex in the No Action Alternative would generate 1,160, 7,344, 7,388, and 7,450 person trips during the weekday AM, midday, and PM, and Saturday midday peak hours, as compared to 2,544, 8,801, 5,175, and 12,959 person trips, as predicted in the 2006 FEIS analysis of the No Action condition, during the same time periods. For the Preferred Alternative, the Farley Complex and the new mixed-use off-site building would generate 1,606, 10,379, 9,291, and 10,188 person trips during the weekday AM, midday, and PM, and Saturday midday peak hours, as compared to 5,680, 21,592, 12,539, and 35,628 person trips, as predicted in the 2006 FEIS, during the same time periods.
Table 4.5-27Person Trip Summary: Preferred Alternative & 2006 FEIS
Analysis Peak Auto Taxi Subway Bus Railroad Walk Total Year Hour In Out In Out In Out In Out In Out In Out In Out Total
Pre
ferr
ed
Alt
ern
ativ
e
2015 Future without the Proposed
Action
AM 155 6 13 1 591 25 143 6 174 7 37 2 1,113 47 1,160MD 302 255 149 130 682 578 299 259 0 0 2,479 2,211 3,911 3,433 7,344PM 263 468 114 144 782 1,533 234 422 67 264 1,425 1,672 2,885 4,503 7,388SAT 337 311 154 141 752 693 308 282 0 0 2,339 2,133 3,890 3,560 7,450
2015 Future with the
Proposed Action
AM 18 30 49 150 130 324 44 37 0 0 358 466 599 1,007 1,606MD 351 299 243 219 805 689 393 342 0 0 3,691 3,347 5,483 4,896 10,379PM 310 326 296 222 1,143 1,092 336 338 56 64 2,512 2,596 4,653 4,638 9,291SAT 372 343 248 235 982 915 380 350 0 0 3,274 3,089 5,256 4,932 10,188
2015 Increment
AM -137 24 36 149 -461 299 -99 31 -174 -7 321 464 -514 960 446MD 49 44 94 89 123 111 94 83 0 0 1,212 1,136 1,572 1,463 3,035PM 47 -142 182 78 361 -441 102 -84 -11 -200 1,087 924 1,768 135 1,903SAT 35 32 94 94 230 222 72 68 0 0 935 956 1,366 1,372 2,738
Analysis Peak Auto Taxi Subway Bus Railroad Walk Total Year Hour In Out In Out In Out In Out In Out In Out In Out Total
20
06 F
EIS
2010 Future without the Proposed
Action
AM 169 25 37 20 765 96 168 47 140 11 569 497 1,848 696 2,544MD 84 85 126 127 252 255 252 255 0 0 3,663 3,702 4,377 4,424 8,801PM 52 211 57 76 180 915 123 256 13 154 1,529 1,609 1,954 3,221 5,175SAT 129 129 194 193 387 386 387 386 0 0 5,384 5,384 6,481 6,478 12,959
2010 Future with the
Proposed Action
AM 174 78 576 174 741 352 276 132 80 8 1,565 1,524 3,412 2,268 5,680MD 350 220 846 353 1,234 682 758 591 81 2 8,339 8,136 11,608 9,984 21,592PM 283 124 778 206 1,140 442 517 315 87 3 4,483 4,161 7,288 5,251 12,539SAT 487 360 1,051 561 1,692 1,153 1,180 1,016 83 5 14,107 13,933 18,600 17,028 35,628
2010 Increment
AM 5 53 539 154 -24 256 108 85 -60 -3 996 1,027 1,564 1,572 3,136MD 266 135 720 226 982 427 506 336 81 2 4,676 4,434 7,231 5,560 12,791PM 231 -87 721 130 960 -473 394 59 74 -151 2,954 2,552 5,334 2,030 7,364SAT 358 231 857 368 1,305 767 793 630 83 5 8,723 8,549 12,119 10,550 22,669
The notable differences between the current and 2006 FEIS trip projections are largely attributed to changes in the transportation demand assumptions, as developed by the WRY FEIS working group. In comparison with their respective No Action conditions, the Preferred Alternative
Moynihan Station Development Project
4.5-38
would yield between 400 and 3,100 incremental peak hour person trips in 2015, as compared to the 3,100 to 22,700 incremental peak hour person trips projected in the 2006 FEIS for 2010.
OTHER PROJECTS IN WEST MIDTOWN
As shown above in “Traffic,” there would be approximately 1.2 million fewer square feet of commercial office space expected to be completed in the Project area between 2008 and 2015 than anticipated in the 2006 FEIS for the 2005 to 2010 period. However, at the same time, there would be approximately 550,000 more square feet of hotel space, 220,000 more square feet of retail space, and 2,760 more residential dwelling units. Compared to the No Action analysis in the 2006 FEIS, the aggregate floor area of the expected development without the Project considered in this EA is comparable in total. Nonetheless, similar to what was concluded above for vehicular traffic, the change in the mix of development would result in fewer total incremental person trips from those No Build projects than what was considered in the 2006 FEIS.
TRANSIT
SUBWAY SERVICE
Subway service in the study area includes the Seventh Avenue line (1,2,3) at 34th Street-Penn Station, the Eighth Avenue line (A,C,E) at 34th Street-Penn Station, and the Sixth Avenue line (B,D,F,V), Broadway line (N,Q,R,W), and the Port Authority Trans Hudson (PATH) trains at 34th Street-Herald Square. The 2006 FEIS analyzed 19 subway stairway locations serving the A/C/E subway lines at the 34th Street-Penn Station along Eighth Avenue, and eight subway stairway locations serving the 1/2/3 subway lines at the 34th Street-Penn Station along Seventh Avenue. Updated volume information was obtained from the recently certified WRY FEIS (2009). In comparison, the 2008 aggregate peak hour stairway volumes analyzed in the WRY FEIS are higher by approximately 7 percent over the 2005 stairway volumes analyzed in the 2006 FEIS. Taking into account the transit trips generated by completed development projects between 2005 and 2008, the remaining transit trip increase would be in line with the CEQR background growth of 0.5-percent per year. The 2006 FEIS also analyzed five subway control areas serving the A/C/E subway lines at the 34th Street-Penn Station along Eighth Avenue, and two subway control areas serving the 1/2/3 subway lines at the 34th Street-Penn Station along Seventh Avenue. Similarly, the comparison of the 2006 FEIS and the 2009 WRY FEIS aggregate baseline volumes at these subway control areas shows a moderate increase of approximately 8 percent between 2005 and 2008.
As shown in Table 4.5-27, the Preferred Alternative would result in -162, 234, -80, and 452 incremental subway trips (total in/out) during the weekday AM, midday, and PM, and Saturday midday peak hours. These trips, spread among various station elements at the above stations, which is comparable to what was done in the 2006 FEIS, would not warrant a detailed analysis per the criteria in the CEQR Technical Manual. The CEQR Technical Manual states that quantitative analyses could be warranted if a transit element is expected to incur 200 or more peak hour incremental trips resulting from a proposed action. Incremental transit trips during a peak hour at or below this CEQR threshold is considered imperceptible. The projected trips above, spread among various station elements at the two study area stations, which is comparable to what was done in the 2006 FEIS, would not result in any station element incurring more than the CEQR analysis threshold of 200 transit trips. Therefore, a detailed analysis is not warranted, and the Preferred Alternative would not be expected to result in significant adverse subway impacts. Furthermore, the 2006 FEIS analyses, which considered substantially larger subway increments from the proposed Project (232, 1,409, 487, and 2,072
Chapter 4.5: Transportation
4.5-39
during the same time periods), concluded that no significant adverse impacts would result for the analyzed subway stairway and control area elements. With these lower Build incremental volumes coupled with a smaller No Action subway trip increase, the Preferred Alternative would not be expected to result in significant adverse subway impacts.
BUS SERVICE
There are various local and express bus routes serving the study area. The Preferred Alternative would result in -58, 177, 18, and 140 incremental bus trips (total in/out) during the weekday AM, midday, and PM, and Saturday peak hours. These trips, spread among numerous bus stops in the area, comparable to what was done in the 2006 FEIS, would not warrant a detailed analysis per the criteria in the CEQR Technical Manual, and therefore would not be expected to result in significant adverse bus impacts. In comparison, the 2006 FEIS estimated the proposed Project’s incremental bus trips to be substantially higher at 193, 842, 453, and 1,423 over the same time periods and also concluded that there would be no significant adverse impacts.
PEDESTRIANS
STREET-LEVEL PEDESTRIAN OPERATION
The pedestrian study area is the same as the one studied in the 2006 FEIS (and shown on Figure 14-2 of the 2006 FEIS), which includes sidewalks, crosswalks, and corner reservoirs from West 30th to West 34th Streets between Sixth and Tenth Avenues and from West 34th to West 35th Streets between Seventh and Ninth Avenues. The 2006 FEIS analyzed physical changes to street-level pedestrian facilities, including project-related pedestrian improvements, proposed by the previous Farley Complex development program and proposed in the Hudson Yards FGEIS, as well as by other developments in the study area. Similar improvements, except for those stipulated in the Hudson Yards FGEIS, are expected to be in place for the Project. In addition, the 15 Penn Plaza project, which is currently undergoing environmental review under CEQR and would be constructed by 2014, is expected to result in the reconstruction and re-opening of the passageway under the south side of 33rd Street between Seventh and Sixth Avenues (sometimes referred to as the Gimbels’ passageway) and related underground connections between Seventh and Sixth Avenues. The reconstructed passageway would accommodate pedestrian flows between Penn Station/the Seventh Avenue subway lines (1, 2, and 3) and the Sixth Avenue subway lines (B, D, F, N, Q, R, V, and W) and the PATH station and provide an alternative to pedestrians traveling along the 33rd Street corridor. The 15 Penn Plaza project would also improve several subway stairways and control areas serving the Seventh Avenue, Sixth Avenue, and Broadway subway lines, and the PATH station. The presence or absence of the Gimbel’s passageway does not materially affect the assessment of the Project’s pedestrian impacts.
In comparison, the 2008 aggregate peak hour pedestrian volumes analyzed in the WRY FEIS are higher by approximately 9 percent over the 2005 volumes analyzed in the 2006 FEIS for sidewalks, lower by approximately 28 percent for corner reservoirs, and lower by approximately 4 percent for crosswalks. Including the background growth of 0.5 percent per year outlined by the CEQR Technical Manual and additional pedestrian trips generated by other completed development projects over the three-year period within the study area, the amount of pedestrian growth realized between 2005 and 2008 for sidewalks is in line with typical volume increases. The corner and crosswalk volumes were lower in 2008 than they were in 2005.
Moynihan Station Development Project
4.5-40
The 2006 FEIS concluded that there would not be any significant adverse sidewalk impacts resulting from the Project to be completed in 2010. With comparable baseline conditions, fewer additional trips resulting from development projects in the future without the Project, and relatively lower incremental trip generation, the Preferred Alternative would also not be expected to result in significant adverse sidewalk impacts.
For corners and crosswalks, the 2006 FEIS, however, concluded that significant adverse impacts would occur at certain locations, all of which could be mitigated as described below.
Corner Reservoirs
Northeast corner of West 33rd Street and Ninth Avenue in the midday peak period – mitigated with a 5-foot widening of the east crosswalk at the northeast corner of West 33rd Street and Ninth Avenue to a width of 20 feet, and removal of all obstructions from the 20 feet of sidewalk adjacent to the east crosswalk.
Northwest corner of West 33rd Street and Eighth Avenue in the AM, midday, PM, and Saturday peak periods – mitigated with a 10-foot widening of the west crosswalk at the northwest corner of West 33rd Street and Eighth Avenue to a width of 24 feet, and removal of all obstructions from the 24 feet of sidewalk adjacent to the west crosswalk.
Crosswalks
East crosswalk of West 34th Street and Eighth Avenue in the midday, PM, and Saturday peak periods – mitigated with a 4.5-foot widening to a width of 20 feet.
West crosswalk of West 34th Street and Eighth Avenue in the PM peak period – mitigated with a 0.5-foot widening to a width of 16 feet.
West crosswalk of West 33rd Street and Ninth Avenue in the midday and Saturday peak periods – mitigated with a 5-foot widening to a width of 20 feet.
East crosswalk of West 33rd Street and Eighth Avenue in the AM, midday, PM, and Saturday peak periods – mitigated with a 2.3-foot widening to a width of 20 feet.
South crosswalk at West 33rd Street and Eighth Avenue in the midday peak period – mitigated with a 3-foot widening to a width of 20 feet.
West crosswalk of West 33rd Street and Eighth Avenue in the AM, PM, and Saturday peak periods – mitigated with a 10-foot widening to a width of 24 feet.
North crosswalk of West 33rd Street and Seventh Avenue in the PM peak period – mitigated with a 7.5-foot widening to a width of 21.5 feet incorporating crosswalk width previously considered as Hudson Yards mitigation.
South crosswalk of West 33rd Street and Seventh Avenue in the AM, midday, PM, and Saturday peak periods – mitigated with a 4-foot widening to a width of 20 feet.
West crosswalk of West 33rd Street and Seventh Avenue in the Saturday peak period – mitigated with a 2-foot widening to a width of 20.5 feet.
East crosswalk of West 31st Street and Ninth Avenue in the midday and Saturday peak periods – mitigated with a 3-foot widening to a width of 16 feet.
East crosswalk of West 31st Street and Eighth Avenue in the Saturday peak period – mitigated with a 5.5-foot widening to a width of 20 feet.
West crosswalk of West 31st Street and Eighth Avenue in the Saturday peak period – mitigated with a 0.5-foot widening to a width of 12 feet.
Chapter 4.5: Transportation
4.5-41
North crosswalk of West 31st Street and Seventh Avenue mitigated to a width of 20 feet incorporating crosswalk width previously considered as Hudson Yards mitigation.
As summarized in Table 4.5-27, the No Build program and the Preferred Alternative program for the Farley Complex and the new mixed-use off-site building would result in substantially fewer person trips than those projected in the 2006 FEIS. Since both the 2008 baseline and future 2015 background pedestrian levels would also be lower or comparable to those analyzed in the 2006 FEIS, some of the significant adverse pedestrian impacts identified previously in the 2006 FEIS may no longer occur with the Preferred Alternative. For those impacts that would remain, they are likely to be lower in magnitude and require comparable or lesser mitigation measures. The mitigation measures set forth in the 2006 FEIS, described above, would be more than adequate to eliminate any significant adverse pedestrian impacts associated with the 2015 development program for the Preferred Alternative. Further, the Project will commit to implementing the applicable Hudson Yards pedestrian mitigation measures, which are no longer available, at two study area locations as improvements under the Preferred Alternative.