Chapter 4: The effects of the brewery industry on the ...
38
The Regional Economics Applications Laboratory (REAL) of the University of Illinois focuses on the development and use of analytical models for urban and regional economic development. The purpose of the Discussion Papers is to circulate intermediate and final results of this research among readers within and outside REAL. The opinions and conclusions expressed in the papers are those of the authors and do not necessarily represent official positions of the University of Illinois. All requests and comments should be directed to Geoffrey J. D. Hewings, Director, Regional Economics Applications Laboratory, 607 South Matthews, Urbana, IL, 61801-3671, phone (217) 333- 4740, FAX (217) 244-9339. Web page: www.uiuc.edu/unit/real THE EFFECTS OF THE BREWERY INDUSTRY ON THE EVOLUTION OF THE METAL CAN INDUSTRY by Moshe Yanai REAL 04-T-16 October, 2004
Transcript of Chapter 4: The effects of the brewery industry on the ...

The Regional Economics Applications Laboratory (REAL) of the University of Illinois focuses on the development and use of analytical models for urban and regional economic development. The purpose of the Discussion Papers is to circulate intermediate and final results of this research among readers within and outside REAL. The opinions and conclusions expressed in the papers are those of the authors and do not necessarily represent official positions of the University of Illinois. All requests and comments should be directed to Geoffrey J. D. Hewings, Director, Regional Economics Applications Laboratory, 607 South Matthews, Urbana, IL, 61801-3671, phone (217) 333-4740, FAX (217) 244-9339. Web page: www.uiuc.edu/unit/real
THE EFFECTS OF THE BREWERY INDUSTRY ON THE EVOLUTION OF THE METAL CAN INDUSTRY
by
Moshe Yanai
REAL 04-T-16 October, 2004

The Effects of the Brewery Industry on the Evolution of the Metal
Can Industry
Moshe Yanai Head of The environmental statistics division, The Israeli Bureau of Statistics E-mail: [email protected]
ABSTRACT: Positive interactions in business have received little attention in recent years. I propose a set of definitions and research tools for analyzing these types of interactions among organizations. These proposed tools are applied in a study of the interaction between the metal can and large breweries industries. Although the proposed set of propositions was not supported by the data, there is some evidence that positive interactions do play a role in determining the fate of organizations. Future research is needed for better understanding and generalization of the conditions in which positive interactions are more likely to occur, and the consequences of positive interactions for organizations.
1. Introduction
Organizational ecology, the arena that studies temporal evolution and diversity of human
organizations, has focused primarily on competitive (i.e. negative) interactions among
organizations and organizational populations (Carroll 1984). Positive interactions have drawn
increasing attention in theory and research in biological ecology in recent years (Bronstein
1994). Organizational ecology, which has roots in biological ecology (mainly with regard to the
concept of natural selection), did not follow suit in this respect, although positive interactions
play a central role in social and economic systems along with competitive interactions. As Beard
and Dess (1988) state “positive interactions are the main way in which environments make
resources available to organizations, whereas competition is the main way in which
environments withhold resources.”
Few studies in organizational ecology have looked at positive interactions among organizations.
For example, Barnett and Carroll (1987) studied competition and mutualism among early
American phone companies; Baum and Singh (1994) studied positive and negative interactions
among day care centers in Canada, while Swaminathan (1995) examined negative and positive
interactions within the American wine industry. None of these studies focused on positive
interactions alone. The terminology used to describe positive interactions was incoherent and
confusing, where terms such as mutualism, symbiosis and commensalism were used alternately
without a clear definition.

R E A L
The effects of the brewery industry on the evolution of the metal can industry 2
In order to study in detail positive interactions among human organizations we first need to agree
upon a clear and reliable classification system for these interactions. I propose a classification
scheme (table 1) developed by the biologist Burkholder (1952). This scheme defines interactions
between two biological species using two identifying phases: the “on” phase that refers to
situations in which the species interact, and the “off” phase that refers to conditions in which the
species stop interacting. The interaction outcomes for the species are measured in terms of
productivity for each population and are symbolized by +, - and 0, representing increase,
decrease and no change in the population’s productivity, respectively. The scheme identifies
nine possible biological interactions, from which five positive interactions are revealed (Positive
interactions include all the non-negative interactions in the “on” phase, in which at least one of
the populations is positively affected.) From these five, three are well recognized: mutualism,
protocooperation, and commensalism. The other two are very rare in nature and have never been
scientifically named.
This biological scheme can be easily transformed into organizational ecology using accepted
operational measuring tools in this arena. The productivity effects on interacting organizational
populations can be measured in terms of performance (e.g. profit or sales volumes) in the short
run and viability (birth and mortality rates of organizations) in the long run. The ”on” phase,
which stands for the outcomes of the interactions can be measured in terms of performance or
birth rate effects on each population. The “off” phase, which stands for the outcomes of no
interaction and, therefore, represents the level of dependency between the interactors, can be
measured in terms of mortality effects on the populations. Based on the biological terminology
(table 1), we can draw the following definitions for two interacting organizations or
organizational populations:
Mutualism is an interaction in which both entities have reciprocal positive (+) effects on each
other in terms of performance, birth rates, and mortality (i.e. higher performance, birth rate and
mortality in one population lead to higher performance, birth rate and mortality in the other
population, respectively). This interaction type includes a special case of “symbiosis” (Cushman
and Beattie 1991) that refers to mutualistic interactions in which the interactors are physically
integrated (possibly, cases of mergers and vertical integration).
2
R E A L
The effects of the brewery industry on the evolution of the metal can industry 3
Protocooperation is an interaction in which both entities have reciprocal positive effects
regarding performance and birth rates, but have no effect on each other’s mortality rates.
Commensalism occurs when entity A has positive performance, birth rate, and mortality effects
on entity B, while the entity A is not affected by entity B in any way.
Note that this set of definitions requires testing the effects on both interactors before determining
their type of interaction. In some occasions this process can be very labor intensive, however,
accurate identification can be very helpful for better understanding and analysis of the different
types of interactions and their outcomes.
The next section will discuss the application of positive interactions at the population level in
business. Then, a brief historical review of the studied organizational populations, the metal can
and the brewery industries, will be presented. Finally, a case study regarding the interactions of
these populations will be presented analyzed and discussed.
2. Positive interactions between suppliers and their business customers
Under the assumption of rational behavior, organizations that exchange services or goods are
expected to positively affect each other. Otherwise, it would not be worthwhile for the
interacting parties to keep the trade going. However, the parties may also develop dependency
through long-term contracts and a network of personal relations. Organizations may choose to
locate their facilities next to other organizations with which they regularly exchange goods or
services in order to reduce transportation and coordination costs. Once this dependency is
created, a shift to an interchange with different organizations might be costly. For example,
when one of the long-term partners in a business exchange closes down, the other partner may
try to replace it with a new partner. However, in order to make this switch, the surviving partner
might have to update its equipment, relocate some of its facilities, face higher transportation,
coordination and legal costs, and/ or compete with new superior organizations for a new
partnership. Furthermore, the organization may also face the risk that a replacement is not to be
found and hence, it will have to reduce its production or, in extreme cases, even close down.
When aggregated into the organizational population level, both interacting populations are
expected to positively affect each other’s production and birth rate. However, higher
3

R E A L
The effects of the brewery industry on the evolution of the metal can industry 4
dependency costs are expected to increase mortality rates in these mutually interrelated
populations as well. In other words, these populations may be involved in an interaction
classified as mutualism. The mutual interaction effects are not expected to be symmetrical since
the supplier population and the customer population can rarely affect each other equally. The
dependence and benefit levels for each population are determined by the proportion of
production attributed to the other population. In addition, the environmental conditions and
resource availability can change the nature of the relationship and even shift it into a different
type of interaction. This set of ideas has never been tested within the framework of
organizational ecology. In order to test these ideas, two organizational populations that are
involved in economic exchange were studied: the metal can industry and the large breweries.
3. The Metal Can Industry
The history of canning dates back to 1795 (Can Manufacturers Institute 1998) when the
Frenchman Nicholas Appert invented a method of storing food for long periods of time using
airtight bottles sealed with cork stoppers. The invention was tried on the French army, and the
emperor Napoleon Bonaparte, who claimed that “an army marches on its stomach”, rewarded the
inventor with a prize of 20,000 francs.
Fifteen years later, the invention reached Britain, where it was extended into using metal and tin
containers as well. Tin cans were more advantageous than bottles for military use since they
were not breakable and were easier to handle. In 1812, the first canning plant was established in
the United States. The gold rush (1849) and the civil war (1861) greatly helped spread the
industry into new frontiers. By the end of the civil war, the production in the U.S. alone had
reached 30 million cans per year.
Still, the process of canning was labor intensive, and remained so for the next 60 years. Cans
were made by hand, and a can maker could make a maximum of 10 cans a day. Progress in can-
making production began in the early 1920’s when American engineers introduced a series of
technical improvements that enabled speeding up the production to as many as 250 cans per
minute. In the early1940’s manufacturers started adapting cans to pack carbonated soft drinks
4
R E A L
The effects of the brewery industry on the evolution of the metal can industry 5
and beer by improving the cans’ internal coating. Canning carbonated soft drinks introduced
problems of corrosion, color changes, and leakage to the can developers. Preserving beer was
somewhat easier since beer is less corrosive, ages naturally, and has a limited shelf life of about
three months in any package. The commercial adaptation for beverage cans took place only
towards the mid 1950’s due to wartime material limitations during World War II and the Korean
War.
In 1965, the metal can industry received a great boost with the introduction of the aluminum can.
Aluminum beverage cans have several advantages over the traditional steel cans. The aluminum
cans are formed from only two pieces, a body and an end. This structure enables 360 degree
printing on the can body and enhances its display appeal. In addition, aluminum cans are easier
to model, have better support for carbonation pressure, are lighter, and resist corrosion. The steel
manufacturers tried to stay updated and came up with their own version of a two-piece steel can.
However, the steel cans were never fully accepted by brewers and soft drink bottlers.
In the late 1960’s, with the rise of environmental awareness, both steel and aluminum can
producers started facing an increasing public pressure regarding the environmental damages cans
cause in the areas of mining and refuse disposal. As a result, by 1970 can makers began
recycling cans. Aluminum cans had proven to be more economical in their recycling process
than steel cans. Along with the other advantages of aluminum cans, this led to a full domination
of the aluminum can in the industry by 1985.
The metal can industry has kept developing since then. In 1997 production of cans in the U.S
had reached an annual rate of 133 billion cans, a recycling rate of 66.8% for aluminum cans, and
$8 billion in income for beer sales.
4. The American Brewery Industry
The history of the brewing industry in the U.S goes back to about 1633 (Carroll and
Swaminathan 1991). In similar fashion to the metal can industry, American brewing also started
as a small craft-based industry and remained so for a long time due to technical limitations. The
industry started expanding in the 1840’s; however, this expansion was interrupted by a
5

R E A L
The effects of the brewery industry on the evolution of the metal can industry 6
prohibition on alcohol imposed initially by various states and later by the federal government. It
was not until 1933, when federal prohibition ended, that the production of beer started increasing
again. However, until the mid 1980’s, the number of breweries kept declining. This process
occurred mainly through acquisitions and mergers and demonstrated strong economies of scale
and high concentration in the industry. Since 1983, the number of breweries has been rising.
Most of the new entries to the industry have been in the form of small microbreweries and
brewpubs. Recent studies describe this process as resource partitioning, in which the large and
generalist organizations capture the core of the market and leave the remote margins to the small
specialist ones (Carroll and Swaminathan 2000). The records show that by 1995, the total sales
of the brewery industry had reached 190 million barrels with more than 99% of this volume
derived from 25 large breweries. The remaining 1% came from 709 small breweries. Since
then, the number of small breweries has almost doubled, while the number of large breweries has
remained stable.
5. The Interaction Effects on the Metal Can Industry: Propositions
The distinction between the large and small breweries populations provides a great opportunity
to study the net effects of the interaction with the metal can industry. Generally, only the large
breweries use cans to pack their products, and therefore they can be used as a test group. The
small breweries, which rarely can their products, can be used as a control group because they are
affected by similar environmental factors, but do not interact directly with the metal can
producers.
Previous research in organizational ecology thoroughly studied mortality and formation of
organizations within organizational populations as a function of their density (Singh and
Lumsden 1990). Although past research considered both positive and negative interactions, its
main focus has been on competition and selection processes (Hannan and Freeman 1984). The
current study is designed to examine the consequences of the interaction with the large brewery
industry for the metal can industry in terms of mortality and birth rates within a perspective of
positive interactions.
6

R E A L
The effects of the brewery industry on the evolution of the metal can industry 7
Hypotheses of Positive Effects: The following line of propositions examine the positive effects
of the large breweries population on the metal can industry, while controlling for negative and
positive effects within the metal can industry. It is hypothesized that the two industries are
engaged in a mutualistic interaction. However, since the definition of mutualism requires the
examination of both interactors on each other, the precise nature of the interaction can be
revealed only after examining the effects of the metal can industry on the large breweries as well.
The metal can industry benefits from the brewery industry’s demand for cans, and hence, new
formations of large breweries are expected to increase the overall demand for metal can
products, and provide an enhanced business opportunity for new entrepreneurs in the metal can
industry. This leads to the following proposition:
Proposition 1: An increase in the annual rate of formation of large breweries will positively
affect the annual rate of formation in the metal can industry.
The creation of new large breweries may provide an opportunity for existing or new metal can
firms to capture a new pocket of demand for cans. The opportunity for new metal can firms to
capture the free demand is especially high when there are no other metal can firms in their area.
However, once existing or new metal can firms capture the demand and long-term contracts are
established, the opportunities for expansion or new formations diminish, and therefore:
Proposition 2: The positive effect of formation of large breweries on the formation of metal can
firms will diminish over time.
For the last ten years, beer cans constituted about 30% of the metal can industry production (Can
Manufacturers Institute 1990,1993,1996). In addition, some metal can plants are located
adjacent to their main customers (Swaminathan, personal communication). Therefore, the metal
can industry seems to be somewhat dependent on the demand for cans from the large brewery
industry. Mortality of large breweries is expected to decrease this demand, and hence, the metal
can industry is expected to suffer negative effects as a result of mortality of large breweries.
Proposition 3: Mortality of large firms in the brewery industry will positively affect (i.e.
increase) mortality in the metal can industry.
7

R E A L
The effects of the brewery industry on the evolution of the metal can industry 8
Metal can firms may switch to alternative customers as a result of large breweries’ mortality.
However the switch might be costly and sometimes impossible. Therefore, the risk of mortality
for metal cans firms, especially in the same area, may increase as a consequence. However, once
firms have succeeded in adjusting their production and facilities or found alternative customers,
the effects of the breweries’ mortality is expected to diminish.
Proposition 4: The positive effect of mortality of large breweries on mortality of metal can firms
will decline over time.
In both ecology and business, the intensity of interactions can be affected by spatial distribution
of the interactors. Populations that are spatially proximate to each other tend to compete more
intensely for common resources (Baum and Mezias 1992). Therefore, proximate populations
may endure greater reciprocal benefits and dependency effects when their resources do not
overlap. This assumption yields the following proposition:
Proposition 5: The positive effects of mortality of large breweries on mortality of metal can firms
will be greater for firms that operate in the same geographical region (i.e. East, Midwest, and
West coast).
The temporal dimension may also play an important role in determining the intensity of
interactions between organizational populations. In the beginning of the interaction, long-term
contracts, marketing channels, and personal networks are still undeveloped. When the
interaction matures, these associations become more institutionalized, and major changes are less
likely to occur. Whenever major changes do occur, they might be very costly and even
dangerous. For example, a metal can firm that is forced to switch to a new major customer after
a long-term contract had been terminated with one of its main clients may face higher than
average marketing, legal, and equipment costs, and hence, a higher mortality risk. The
significant interaction between the metal can and the brewery industries started in the mid with
the introduction of the aluminum can. If dependency increases with time, the following
proposition may apply:
Proposition 6: The mortality effects of the large breweries industry on the metal can industry will
be weaker during the 1960’s than during the 1970’s 1980’s or 1990’s.
8
R E A L
The effects of the brewery industry on the evolution of the metal can industry 9
According to the biologists Brooker and Callaghan (1998), there appears to be an active
relationship between the severity of the environment (i.e. the levels of disturbance and resource
scarcity) and the overall direction, either positive or negative, of plant species interactions. In
their view, competition becomes less important with increasing levels of severity, while positive
interactions become more important under these conditions. This trend is explained by changes
in environmental selective forces along severity gradients.
The notion that the severity of the environment may affect the balance between negative
and positive interactions can be implemented into the business arena. In order to test this
argument in business, the metal can cost index was used as an indicator for resource scarcity,
where high cost index represents greater resource scarcity. Higher production costs may lead to
higher prices and lower demand for the final product. In addition, higher costs may increase
competition within the industry for the reduced resources. Overall, this trend may drive the less
efficient firms in the industry out of business. When resources are scarce for a long period of
time, mortality of a main customer may have a greater effect on the risk of failure. When
aggregated to the population level, the dependency of metal can firms on their customers is
expected to be greater in stressed conditions than in unstressed conditions. These arguments lead
to the following proposition:
Proposition 7: The effects of mortality of firms in the large breweries industry on mortality of
firms in the metal can industry will be greater during periods of above average production cost in
the metal can industry.
A similar argument can be claimed for the effects of system disturbance on the risk of failure.
When an economic disturbance strikes, the overall demand for products decreases and
unemployment rates rise. Under reduced demand, the dependency on customers may be more
important and crucial for the organization’s survival. This argument yields the following
proposition:
Proposition 8: The effects of mortality of firms in the large breweries industry on mortality of
firms in the metal can industry will be greater during periods of above average unemployment
rates.
9

R E A L
The effects of the brewery industry on the evolution of the metal can industry 10
To test these propositions, a model will be developed, in the next section, and appropriate data
assembled to empirically implement the model.
6. Method
6.1 Data Sources
The data for the metal can industry were collected using two business directories: The Poor’s
Register directory (Standard Poor’s Register, various years), and the Million Dollar Directory
(Dun & Bradstreet, various years). The former was used in order to compile yearly life-history
data regarding formations, mortality and location for each organization registered within the SIC
classification for the metal can industry. There is no differentiation between mergers,
acquisitions and dissolution; they were all considered as mortality. The Million Dollar Directory
was used in order to verify the data from the Poor’s directory, and also to obtain additional data
for the organizations regarding their yearly size and sales volumes.
The primary data for the brewery industry were received electronically (Carroll and
Swaminathan 2000). These data included yearly entries for breweries at the firm level for both
small and large breweries. Each entry included information regarding birth date, mortality date,
size, type of brewery, and location. Since many of the large breweries operated multiple plants,
the Modern Brewery Age directory (Modern Brewery Age, various years) was used to collect
additional data regarding foundings and mortality at the plant level. In addition, sales volumes
were collected at the firm level because they were not available at the plant level.
The data for both industries cover the years 1962 to1996 within the United States (excluding
Alaska and Hawaii). The year 1962 was selected as a starting point, because data on the life
history of the metal can industry became available only then. The ending year was set to 1996
due to limitations of the brewery data.
6.2 Data Manipulation
The data for the mortality analysis were combined from unique observations regarding each
registered firm that operated during the study period in the metal can industry. Each observation
contained multiple records for each year of operation, from the firm’s birth until its dissolution,
10
R E A L
The effects of the brewery industry on the evolution of the metal can industry 11
or until the end of the study if it was in operation at that time. The dependent variable was the
failure rate, with no distinction as to the form of the dissolution. The independent variables
included a set of characteristics of the firm for each year, such as size, age, and location. In
order to measure the inter-population effects, the records of firms for each organizational
population (metal can, large breweries, and small breweries) were aggregated with regard to their
yearly counts of births, mortality and total densities. These counts were merged into the basic
data file, specified by time, as additional independent variables. Finally, a set of economic
indices was combined into the file as well. All the population-level independent variables were
entered with a one-year lag, in order to retain a cause and effect relationship between the
dependent and the independent variables (Jim Wade, personal communication 2000). The
selected one-year lag was used because exploratory analysis with longer lags showed weaker
correlation between the dependent and the independent variables along the time axis. In order
to test the regional effects, three data sets were derived from the basic data set, depending on the
location of the firm (East Coast, Midwest, and West). The process of population-level counting
was repeated for each region separately. Then, the counts and the economic indices were
merged into each data set in the same way as described above for the national data.
The formation data set was derived from the aggregated counts of births in the metal can
industry, where each year of study represented one observation. Since there were only 33 years
of data available, the power of the analysis at the national level would be inadequate. Therefore,
a data set was compiled that contained formations at the state level. Each observation
represented a year-state entry (Jim Wade, personal communication 2000). Only states where
both large breweries and metal can firms operated at any time point within the study period were
included in the analysis. Each participating state had 33-year records. As in the case of the
mortality data sets, population-level counts and economic indices were merged into the data set
with a one-year lag.
6.3 Model Specification and Estimation
In order to test the inter-population effects on organizational mortality and formation, accepted
models were used from within the organizational ecology arena. The models were estimated by
specifying the mortality and birth rate as a function of time t, a vector of covariates A that
11

R E A L
The effects of the brewery industry on the evolution of the metal can industry 12
measure various metal can industry characteristics, and vector of covariates B that measure
various characteristics of the brewery industry:
( ) ( ), ,r t f t A B= (1)
For the mortality models, event history methodology was used, where the dependent variable is
the instantaneous rate of a firm’s failure, defined as:
( ){ } (( ) lim , / 0jk ir t q t t t t t= + ∆ ∆ )→ (2)
where qj is the discrete probability of organization j to experience a failure (k) event between (t
+∆t), conditional on being at risk for the event at time t. Propositions 3, 4, and 5 were tested
using log-linear models (Amburgey and Barnett 1993) of the general form:
{ }expk tr Xβ= (3)
where Xt is a vector of time-varying variables, and β is a vector of parameters indicating the
effects of the independent variables on the rate of transition to a failure state. This rate is
assumed to remain constant over time. Propositions 6, 7, and 8 were tested using a piece-wise
constant rate model (Carroll and Swaminathan 2000), which is a generalization of the previous
model, but allows the transition rates to change across different periods. The models were
estimated with maximum likelihood procedures using the TDA statistical package (Blossfeld and
Rohwer 1995).
As to the formation set of propositions (propositions1 and 2), there were no data available
regarding the exact timing and order of events within years. Therefore, the population was
defined as the unit of analysis and firm formations were treated as events in a point process
(Swaminathan 1995). As in the mortality models, a constant transition rate was assumed (i.e.
formation rate) with a log-linear dependence on a set of covariates. Common practice was
followed by using the Poisson model, which assumes that the number of formations in a given
year can be depicted with a Poisson distribution. The number of formations in the year t, Yt, is
determined by the probability law:
( ) ( )Pr exp / !t t t t t tY Y Y Yλ λ= = − (4)
12

R E A L
The effects of the brewery industry on the evolution of the metal can industry 13
The relationship between the founding rate λt , and the vector of covariates Xt is specified as
follows:
Ln t tXλ α β= + (5)
Past studies in organizational ecology used an extension of the Poisson model, the negative
binomial model (Carroll and Swaminathan 2000), to correct for over-dispersion problems.
Exploratory analysis did not reveal such effects in my data, and therefore only the results of the
Poisson models are reported. This set of models was estimated using the statistical package
Limdep 7.0 (Econometric Software, Inc).
Exploratory analysis also revealed that the aggregated counts of formations and failures of large
breweries at the firm level were insignificant in the mortality and the formation models. This
may be attributed to the fact that the number of large breweries declined drastically during the
last few decades and remained almost stable in recent years. Therefore, the aggregated counts
for large breweries were analyzed at the plant level, which demonstrated higher variation over
time. Exploratory analysis did not show any significant effects at either level for density squared
(Carroll and Swaminathan 2000). Density squared measures environmental legitimization
effects, or in other words, social acceptance of a new form of organization. Therefore, this
covariate was not included the analysis.
6.5 Independent Variables
The independent variables for the mortality analysis were examined in sets of models. The first
model in each set contained a set of independent variables mostly within the metal can industry.
One of these control variables is density of metal can firms. In previous research, this
independent variable demonstrated a curvilinear relationship with mortality over time (Carroll
1984). In addition, the model included firm’s characteristics such as size, age, and density at the
time of the firm’s birth. These covariates showed significant effects on mortality in a number of
past studies (Singh and Lumsden 1990). The first model also included counts of failures and
formations and total dollar sales for the metal can industry, in order to keep a symmetric
structure with later models that included similar large breweries covariates. Finally, a control
variable was incorporated for mean-replaced missing size values, and economic indicators
13

R E A L
The effects of the brewery industry on the evolution of the metal can industry 14
concerning unemployment rate and metal can cost index. The second model in each set included
the significant covariates from the previous batch (except a few covariates that were dropped due
to collinearity problems) and also density, number of failures, formation at the plant level, and
total sales in dollars of the large breweries population. The third model included all the
covariates from the previous batch plus a similar set of covariates for the control group, the small
breweries. Overall, this process of modeling was repeated for all the mortality propositions, and
for the formation propositions as well.
7. Results
Overall, the mortality and the birth models reveal very weak effects for both between and within
population effects. Even though some coefficients in these models are significant, most of the
covariates that are included in the models do not significantly contribute to the explanation of the
variation of the dependent variables. The results reveal very few consistent trends across
models, where very few covariates remain significant and bear a consistent sign across models.
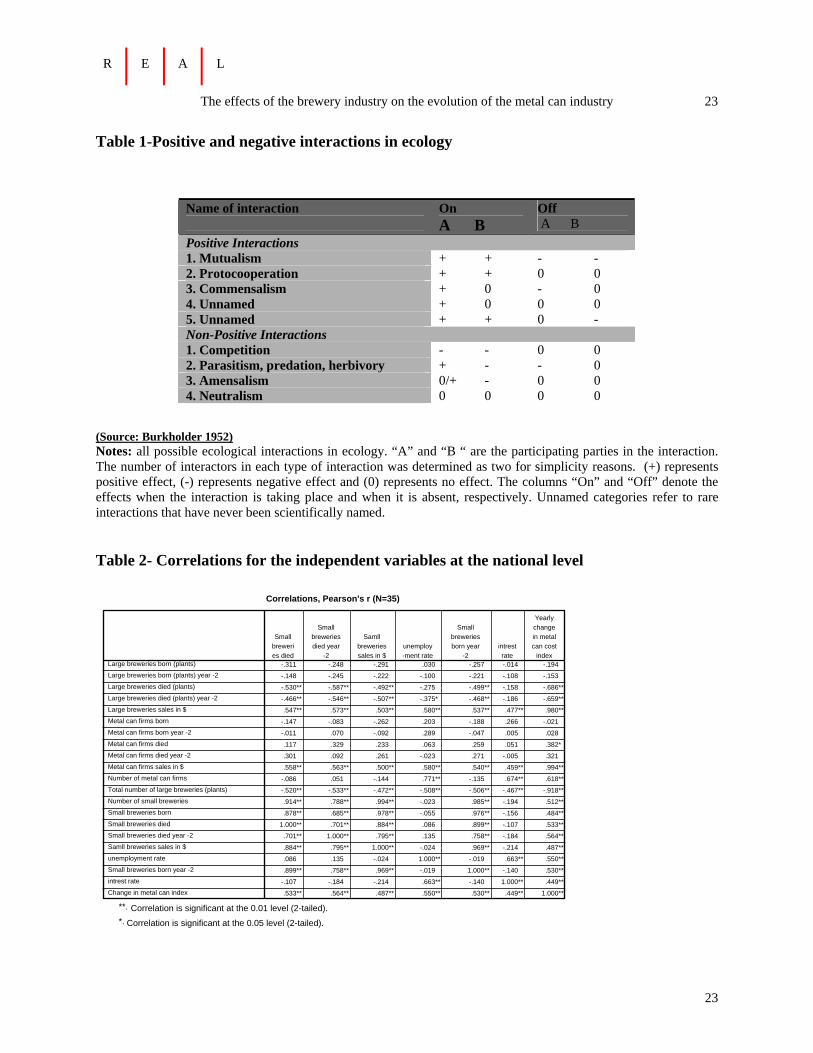
As to the detailed results, the correlation matrix for the independent variables at the national
level is presented in table 2. Several correlations fit the general direction of the prior predictions.
Metal can sales are highly negatively correlated with the mortality of large breweries (plants) in
the previous year. The number of metal can firms is slightly negatively correlated with mortality
of large breweries (plants) in the same year. Yearly sales of metal cans and beer are almost
perfectly linearly correlated. Yearly sales of beer are also highly correlated with the number of
metal can firms in the same year; however, other correlations do not fit the predicted pattern.
The number of large breweries plants is negatively correlated with metal can sales and the
number of metal can firms in the same year. The yearly density of small breweries and the
number of small breweries formed in the previous year are positively correlated with metal can
sales. Metal can sales are also positively correlated with mortality in the same and previous year
for small breweries. Sales of small breweries and metal cans are positively correlated as well.
Finally, the unemployment rate is positively correlated with metal can sales and density of metal
can firms.
14

R E A L
The effects of the brewery industry on the evolution of the metal can industry 15
The descriptive statistics are presented in table 3. From this table, it can be seen that the average
mortality rates and birth rates are almost equal within the large breweries (firms) and the metal
can firms’ populations. Also, for both large breweries firms and metal can firms, the average
within population birth and mortality rates are approximately equal. At the plant level however,
large breweries died on average three times more than new plants births.
Figure 1 presents the temporal evolution of densities of the metal can and the brewery industries
over the study period. From the figure, we can see that the large breweries (plants) and the metal
can firms follow a relatively similar pattern, especially since the mid 1970’s. The small
breweries show an entirely different pattern of constant growth since the mid 1980’s.
Table 4 presents several descriptive statistics for the metal can industry at the firm level; note
that metal can sales and metal can firms size have standard deviations that are greater than their
mean. Table 5 presents the Poisson models results for births of metal can firms. From the
results we can see that propositions 1 and 2 were not supported. Birth of new breweries did not
significantly increase the number of births in the metal can industry. As to the small breweries,
as predicted, they had no significant effects on metal can firms’ births. The coefficient for
density of metal can firms was found to be significantly negative in both first and third models,
indicating within industry competition. This finding is consistent with previous studies of
density dependence in organizational ecology (Singh and Lumsden 1990). The coefficient for
unemployment disturbance is unexpectedly positive in all three models. In the first model this
coefficient is also significant. It is possible that this coefficient interacted with unobserved
factors that masked its effects on the metal can industry.
Table 6 presents the results of the mortality models of metal can firms at the national level. The
results indicate that propositions 3 and 4 were not supported. The coefficient for large breweries
mortality is positive as predicted, but it is insignificant. The coefficient for large breweries sales
is negative and significant in the third model. Accordingly, births of new brewery plants and
beer sales significantly decreased the risk of mortality for firms in the metal can industry. As to
the control variables within the metal can industry, age has negative and significant coefficients
across all three models, as expected, indicating decreasing mortality risk with increasing age.
Mortality of metal can firms has negative and significant coefficients across the three models as
15

R E A L
The effects of the brewery industry on the evolution of the metal can industry 16
well, indicating reduced competition effects within the metal can industry. Births of metal can
firms and metal can sales have negative and significant coefficients in the first model; however,
these covariates were excluded from the other two models due to collinearity problems. The
yearly change in the metal can cost index is, as predicted, positive and significant across the
three models. Also as predicted, small breweries do not show any significant effects on metal
can firms’ mortality. Table 7 presents the results of the mortality models for the metal can firms
in the eastern region of the United States. Paralleling the models at the national level, births of
large breweries has a negative and significant coefficient in the second model, but this
coefficient becomes insignificant in the third model. Unexpectedly, in both second and third
models, density and sales of large breweries have a positive and significant effect on metal can
mortality risk in the eastern region. Table 8 presents the results of the mortality models for the
metal can firms in the Midwest. None of the large breweries covariates is significant in any of
these models. Regional density of metal can firms shows a significant positive effect across the
three models. The yearly change in the metal can cost index has unexpected negative and
significant coefficients across all three models.
Table 9 presents the results of the mortality models of the metal can firms in the western region
of the U.S. From looking at the table we can see that none of the coefficients in any of the
models is significant. This trend is possibly due to the small size of the observations in this
region (only 233 records with 13 mortality cases).
In conclusion, the three regional sets of models did not support proposition 5 regarding enhanced
effects of regional mortality of large breweries on the mortality of metal can firms. In addition,
other factors from within the metal can industry and from the brewery industry did not seem to
be more powerful at the regional level.
Table 10 presents the results of the mortality piece-rate models for decades’ effects; it is clear
that proposition 6 was not supported. Mortality, birth and density of large breweries did not
show any significant effect in any of the models and during any of the decades. Sales of metal
cans have a slightly positive and significant coefficient in the first model of the third period, but
the rest of this covariate’s coefficients are insignificant and bear mixed signs.
16

R E A L
The effects of the brewery industry on the evolution of the metal can industry 17
Table 11 presents the results of the mortality piece-rate models for metal can cost index stress
effects. Period 1 and 3 represent unstressed conditions, and period 2 represents stressed
conditions. The results indicate that proposition 7 was not supported; mortality of large
breweries was not significant in any of the periods and showed mixed signs across periods and
models. Births of large breweries has a significant negative effect in the second model of the
stressed period, but this coefficient becomes insignificant after controlling for small breweries
effects. Density of large breweries has mixed and insignificant coefficients across periods. The
small breweries covariates show a positive significant effect in the second period. These results,
however, should be interpreted with great caution since the small breweries population was very
small during this period and its sales volumes were almost negligible. The growth of this
population and its sales volumes started only in the third period, towards the late 1980’s.
Therefore, the significant coefficient for this covariate may represent an anomaly or an
interaction with unobserved factors. Finally, the unemployment rate has inconsistent effects
across models. This trend revealed it as an inadequate indicator for stress and led to the
exclusion of the models that examined proposition 8 regarding the effects of unemployment
disturbance. Trials to replace the unemployment covariate with alternative indicators, such as
the interest rate, did not yield any significant or consistent results either. It is possible that the
metal can industry did not suffer a major disturbance during the study period. Figure 1 depicts a
relatively stable trend for the evolution of the industry where no major drops in density are
revealed during the study period.
8. Discussion
Overall, the results reported in the previous section did not support the set of propositions
regarding mutual effects between the metal can industry and the large brewery population.
Births and mortality of organizations in the large brewery industry did not positively and
respectively affect births and mortality of metal can firms. Still, few unexpected positive effects
were found. Births and sales of large breweries significantly decreased the risk of mortality of
metal can firms during the study period. As predicted, the small breweries’ population was not
found to have notable effects on the metal can industry in any of the studied dimensions.
17

R E A L
The effects of the brewery industry on the evolution of the metal can industry 18
Although some correlations did occur between the industries’ figures, most of these correlations
disappeared after controlling for the industries' environments within the tested set of models.
Births of metal can firms were found to be affected only by competition from within the metal
can industry. The greater the number of metal can firms that were operating in the industry, the
less likely it was for new firms to be born. It is possible that existing metal can firms were
operating under their optimal capacity, and therefore were able to adjust their production levels
when new large breweries were formed or when sales of canned beer increased. The high
correlation between the two industries’ sales figures provides support for this line of thought.
At the national level, mortality of large breweries' plants did not affect mortality of metal can
firms. Therefore, it seems that the metal can industry was not significantly dependent on the
large brewery population for acquiring its crucial resources. This lack of dependency may be
attributed to the fact that most of the production of cans is sold to the soft drink industry. This
industry can be an alternative source of income when troubles occur in the brewery industry.
Since the soft drinks industry was not included in this study, this proposition remains to be
tested. An additional explanation for the insignificant mortality effect is that during the study
period, the brewery industry became more concentrated, where less firms controlled more and
more of the industry production volumes. Thus, a decrease in the number of operating large
breweries might not necessarily represent a decrease in beer production, and a reduced demand
for cans. The strong negative significant correlation between the large brewery sales and
mortality rates provides some support for this assumption. Although the analysis did not reveal
any dependency effects, there was evidence of some positive consequences; births and sales of
large breweries negatively affected mortality of metal can firms at the national level. This
finding supports the idea that metal can firms were able to adjust their production levels when
the demand for beer cans had increased. The increased demand provided additional resources
that strengthened the firms and reduced their risk of mortality. Another factor that contributed to
a decreased risk of mortality was mortality of metal can firms. This may indicate that the exiting
firms provided the surviving firms with extra resources that enabled them to override difficulties
during their lifetime. No evidence of direct competition was found at the national level. Density
of metal can firms did not have a significant positive effect on mortality within the industry.
18

R E A L
The effects of the brewery industry on the evolution of the metal can industry 19
There was even some evidence that births and sales of metal can firms reduced mortality within
the industry. These findings may indicate that, overall, within the study period, resources were
abundant and competition did not play a major role in the metal can industry at the national level.
Similar to the national level, the regional analysis did not reveal any dependency effects of the
metal can industry on the large breweries’ population. Mortality of large breweries did not affect
mortality of metal can firms in any of the studied regions. Overall, it seems that neither
competition, nor positive interactions were stronger at the regional level. The lack of stronger
regional effects may have several explanations. First, it is possible that the interactions between
metal can firms and large breweries occurred mostly at the national level, since most of the large
breweries have operated plants nationwide. Alternatively, it is possible that the regional
categorization was too broad for identifying effects at the local level. Finally, it might be that the
regional analysis lost a considerable amount of explanatory power due to the reduced number of
observations and mortality events in the regional models.
The temporal analysis did not reveal any inter-population effects. It is possible that time alone
had no effect on the strength or direction of the interaction between the two populations. It is
also possible that other factors, that were not included in this study, masked the effects of time.
As in the regional analysis, the categorization into decades was arbitrary and therefore could fail
to capture some of the actual temporal patterns of the interactions. The stress analysis did not
reveal any consistent trend regarding interaction effects. Several explanations are possible.
First, it might be that there was not a notable amount of stress during the study period. Overall,
the industry grew constantly during the study period, and availability of resources did not seem
to be a major problem. The development of the recycling process may have contributed to this
trend as well. Secondly, it is possible that cost did not represent “real” stress conditions in the
system.
In summary, the large breweries and the metal can industry were not found to be engaged in a
mutualistic interaction, even though some positive effects were observed. In order to determine
precisely what kind of interaction is involved , we need to test the effects on the large breweries
population as well.
19

R E A L
The effects of the brewery industry on the evolution of the metal can industry 20
Although mortality of large breweries did not affect mortality of metal can firms, it is possible
that some short-term effects did occur. In order to complete the puzzle of interactions for the
metal can industry, future research can examine its interaction effects with the soft drinks
industry as well. A similar set of propositions can be tested in order to examine the similarities
and differences with the findings of this study. In addition it might be useful to take into account
the changes in consumption patterns of canned beverages and canned beer over time, since these
changes can affect the overall demand for cans and the fate of the organizations that manufacture
them.
Future research can also implement this set of propositions to an entirely different group of
industries with various degrees of dependency, study the interactions over a longer period of
time, and examine industries that demonstrate more variation regarding their failure and birth
rates. This study demonstrates how little we know about positive interactions in business
environments. Future research is needed in order to construct a general and coherent theory
regarding the effects of positive interactions on organizations.
20

R E A L
The effects of the brewery industry on the evolution of the metal can industry 21
References
Amburgey, L. T, Kelly, D and Barnett, P. W. 1993. Resetting The Clock: The Dynamics of Organizational Change and Failure. Administrative Science Quarterly 38:51-73.
Barnett, W P. and Carroll, G. R. 1987. Competition and mutualism among early telephone companies. Administrative Science Quarterly 32(3): 400-421.
Baum, J A. C. and Mezias, S J. 1992. Localized competition and organizational failure in the Manhattan hotel industry, 1898-1990. Administrative Science Quarterly 37: 580-604.
Baum, J A. C. and Singh, V. J. 1994. Organizational Niches and the Dynamics of Organizational Mortality. American Journal of Sociology 100(2): 346-380.
Beard, D W. and Dess, G G. 1988. Modeling organizational species’ interdependence in an ecological community: an input-output approach. Academy of Management Review 13(3): 362-373.
Blossfeld, H P. and Rohwer, G. 1995. Techniques of event history modeling, new approaches to causal analysis. Lawrence Erlbaum Associates, Publishers. Mahwah, NJ.
Bronstein, J. L. 1994. Our current understanding of mutualism. The Quarterly Review of Biology 69: 31-51.
Brooker, R. W. and Callaghan, T. V. 1998. The balance between positive and negative plant interactions and its relationship to environmental gradients: a model. Oikos 81(1): 196-207.
Burkholder, P. R.1952. Cooperation and conflict among primitive organisms. American Scientist 40(4): 601-631.
Can Manufacturers Institute. Various years. Aluminum beverage cans, the ABCs of environmental education. Can, Washington, DC.
Carroll, G. R. 1984. Organizational Ecology. Annual Review of Sociology 10: 71-93.
Carroll, G. R. and Swaminathan, A. 1991. Density dependent organizational evolution in the American brewing industry from 1633 to 1988. Acta Sociologica 34: 155-175.
Carroll, G. R. and Swaminathan, A. 2000. Why the microbrewery moment? Organizational dynamics of resource partitioning in the American brewing industry after prohibition. Working Paper. University of Davis, CA.
Cushman, J. H. and Beattie, A. J. 1991. Mutualisms: assessing the benefits to hosts and visitors. TREE 6(6): 193-197.
Dun & Bradstreet. Various years. Million dollar directory. Dun & Bradstreet, Inc. New York, NY.
Hannan, M T. and Freeman, J. 1984. Structural Inertia and Organizational Change. American Sociological Review 49: 149-164.
Modern Brewery Age.1998. Various years. Modern brewery age Bluebook. Modern Brewery Age, Norwalk, CT.
Singh, J. V. and Lumsden, C. J. 1990. Theory and research in organizational ecology. Annu. Rev. Social 16: 161-195.
21

R E A L
The effects of the brewery industry on the evolution of the metal can industry 22
Standard and Poor's Corporation. Various years. Standard & Poor's register of corporations, directors and executives, United States, and Canada. Standard & Poor's Corporation, New York, NY.
Swaminathan, A. 1995. The proliferation of specialist organizations in the American wine industry, 1941-1990. Administrative Science Quarterly 40: 653-680.
22
R E A L
The effects of the brewery industry on the evolution of the metal can industry 23
Table 1-Positive and negative interactions in ecology
Name of interaction
On A B
Off A B
Positive Interactions 1. Mutualism + + - - 2. Protocooperation + + 0 0 3. Commensalism + 0 - 0 4. Unnamed + 0 0 0 5. Unnamed + + 0 - Non-Positive Interactions 1. Competition - - 0 0 2. Parasitism, predation, herbivory + - - 0 3. Amensalism 0/+ - 0 0 4. Neutralism 0 0 0 0
(Source: Burkholder 1952) Notes: all possible ecological interactions in ecology. “A” and “B “ are the participating parties in the interaction. The number of interactors in each type of interaction was determined as two for simplicity reasons. (+) represents positive effect, (-) represents negative effect and (0) represents no effect. The columns “On” and “Off” denote the effects when the interaction is taking place and when it is absent, respectively. Unnamed categories refer to rare interactions that have never been scientifically named.
Table 2- Correlations for the independent variables at the national level
Correlations, Pearson's r (N=35)
-.311 -.248 -.291 .030 -.257 -.014 -.194
-.148 -.245 -.222 -.100 -.221 -.108 -.153
-.530** -.587** -.492** -.275 -.499** -.158 -.686**
-.466** -.546** -.507** -.375* -.468** -.186 -.659**
.547** .573** .503** .580** .537** .477** .980**
-.147 -.083 -.262 .203 -.188 .266 -.021
-.011 .070 -.092 .289 -.047 .005 .028
.117 .329 .233 .063 .259 .051 .382*
.301 .092 .261 -.023 .271 -.005 .321
.558** .563** .500** .580** .540** .459** .994**
-.086 .051 -.144 .771** -.135 .674** .618**
-.520** -.533** -.472** -.508** -.506** -.467** -.918**
.914** .788** .994** -.023 .985** -.194 .512**
.878** .685** .978** -.055 .976** -.156 .484**
1.000** .701** .884** .086 .899** -.107 .533**
.701** 1.000** .795** .135 .758** -.184 .564**
.884** .795** 1.000** -.024 .969** -.214 .487**
.086 .135 -.024 1.000** -.019 .663** .550**
.899** .758** .969** -.019 1.000** -.140 .530**
-.107 -.184 -.214 .663** -.140 1.000** .449**
.533** .564** .487** .550** .530** .449** 1.000**
Large breweries born (plants)
Large breweries born (plants) year -2
Large breweries died (plants)
Large breweries died (plants) year -2
Large breweries sales in $
Metal can firms born
Metal can firms born year -2
Metal can firms died
Metal can firms died year -2
Metal can firms sales in $
Number of metal can firms
Total number of large breweries (plants)
Number of small breweries
Small breweries born
Small breweries died
Small breweries died year -2
Samll breweries sales in $
unemployment rate
Small breweries born year -2
intrest rate
Change in metal can index
Smallbreweries died
Smallbreweriesdied year
-2
Samllbreweriessales in $
unemploy-ment rate
Smallbreweriesborn year
-2intrestrate
Yearlychangein metalcan cost
index
Correlation is significant at the 0.01 level (2-tailed).**.
Correlation is significant at the 0.05 level (2-tailed).*.
23

R E A L
The effects of the brewery industry on the evolution of the metal can industry 24
Table 2- Correlations for the independent variables at the national level (continued)
Correlations, Pearson's r (N=35)
-.106 -.147 -.189 .196 .217 -.295 -.291
-.248 -.094 -.148 .104 .164 -.224 -.231
-.229 -.204 -.698** -.375* .697** -.505** -.450**
-.172 -.220 -.678** -.299 .587** -.497** -.452**
.305 .270 .987** .638** -.965** .525** .496**
-.108 -.049 -.051 .170 .049 -.232 -.249
-.132 -.091 .038 .202 .005 -.077 -.134
1.000** -.082 .355* .191 -.253 .232 .230
-.082 1.000** .288 -.153 -.223 .268 .286
.355* .288 1.000** .642** -.935** .524** .494**
.191 -.153 .642** 1.000** -.629** -.146 -.169
-.253 -.223 -.935** -.629** 1.000** -.495** -.465**
.232 .268 .524** -.146 -.495** 1.000** .984**
.230 .286 .494** -.169 -.465** .984** 1.000**
.117 .301 .558** -.086 -.520** .914** .878**
.329 .092 .563** .051 -.533** .788** .685**
.233 .261 .500** -.144 -.472** .994** .978**
.063 -.023 .580** .771** -.508** -.023 -.055
.259 .271 .540** -.135 -.506** .985** .976**
.051 -.005 .459** .674** -.467** -.194 -.156
.382* .321 .994** .618** -.918** .512** .484**
Large breweries born (plants)
Large brews born (plants) y -2
Large breweries died (plants)
Large brews died (plants) y -2
Large breweries sales in $
Metal can firms born
Metal can firms born year -2
Metal can firms died
Metal can firms died year -2
Metal can firms sales in $
Number of metal can firms
N of large brews (plants)
Number of small breweries
Small breweries born
Small breweries died
Small breweries died year -2
Samll breweries sales in $
unemployment rate
Small breweries born year -2
intrest rate
Change in metal can Index
Metalcan
firmsdied
Metalcan
firmsdied
year -2
Metalcan
firmssales in
$
Numberof metalcan firms
Totalnumberof large
breweries(plants)
Numberof small
breweries
Smallbreweries
born
Correlation is significant at the 0.01 level (2-tailed).**.
Correlation is significant at the 0.05 level (2-tailed).*.
Table 2- Correlations for the independent variables at the national level (continued)
Correlations, Pearson's r (N=35)
1.000** .150 .232 .196 -.227 .324 .383*
.150 1.000** .119 .200 -.190 -.274 .285
.232 .119 1.000** .580** -.701** .123 .075
.196 .200 .580** 1.000** -.678** .163 .069
-.227 -.190 -.701** -.678** 1.000** -.020 .002
.324 -.274 .123 .163 -.020 1.000** .167
.383* .285 .075 .069 .002 .167 1.000**
-.106 -.248 -.229 -.172 .305 -.108 -.132
-.147 -.094 -.204 -.220 .270 -.049 -.091
-.189 -.148 -.698** -.678** .987** -.051 .038
.196 .104 -.375* -.299 .638** .170 .202
.217 .164 .697** .587** -.965** .049 .005
-.295 -.224 -.505** -.497** .525** -.232 -.077
-.291 -.231 -.450** -.452** .496** -.249 -.134
-.311 -.148 -.530** -.466** .547** -.147 -.011
-.248 -.245 -.587** -.546** .573** -.083 .070
-.291 -.222 -.492** -.507** .503** -.262 -.092
.030 -.100 -.275 -.375* .580** .203 .289
-.257 -.221 -.499** -.468** .537** -.188 -.047
-.014 -.108 -.158 -.186 .477** .266 .005
-.194 -.153 -.686** -.659** .980** -.021 .028
Large breweries born (plants)
Large brews born (plants) y -2
Large breweries died (plants)
Large brews died (plants) y -2
Large breweries sales in $
Metal can firms born
Metal can firms born year -2
Metal can firms died
Metal can firms died year -2
Metal can firms sales in $
Number of metal can firms
N of large brews (plants)
Number of small breweries
Small breweries born
Small breweries died
Small breweries died year -2
Samll breweries sales in $
unemployment rate
Small breweries born year -2
intrest rate
Change in metal can index
Largebreweries
born(plants)
Largebreweries
born(plants)year -2
Largebreweries
died(plants)
Largebreweries
died(plants)year -2
Largebreweriessales in $
Metalcan
firmsborn
Metalcan
firmsborn
year -2
Correlation is significant at the 0.01 level (2-tailed).**.
Correlation is significant at the 0.05 level (2-tailed).*.
24

R E A L
The effects of the brewery industry on the evolution of the metal can industry 25
Table 3- Descriptive statistics at the population level
Table 4.3 Descriptive Statistics at the population level
35 .00 3.00 .4571 .7413
35 .00 1.00 .1143 .3228
35 .00 3.00 .2286 .5983
35 .00 1.00 2.857E-02 .1690
35 .00 16.00 4.5714 4.3944
35 0 4 1.49 1.31
35 0 12 2.60 3.04
35 0 2 .49 .74
35 23.00 172.00 62.0000 43.6193
35 8 57 23.14 14.81
35 13 95 32.69 23.76
35 2 18 5.86 4.94
35 .00 8.00 2.2286 1.9865
35 .00 3.00 .8571 .9438
35 .00 4.00 .8857 .9933
35 .00 4.00 .4857 .8869
35 .00 17.00 6.7143 4.9323
35 .00 10.00 2.2571 1.9903
35 .00 13.00 3.4286 3.2293
35 .00 4.00 1.0286 1.1242
35 44.00 227.00 96.7429 50.3776
35
Large breweries bornLarge breweries borneast (firms)Large breweries bornmidwest (firms)Large breweries bornwest (firms)Large breweries died(firms)Large breweries diedeast (firms)Large breweries diedmidwest (firms)Large breweries diedwest (firms)Number of largebreweries (firms)Number of largebreweries east (firms)Number of largebreweries midwest(firms)Number of largebreweries west (firms)Large breweries born(plants)Large breweries borneast (plants)Large breweries bornmidwest (plants)Large breweries bornwest (plants)Large breweries died(plants)Large breweries diedeast (plants)Large breweries diedmidwest (plants)Large breweries diedwest (plants)Total number of largebreweries (plants)Valid N (listwise)
N Minimum Maximum MeanStd.
Deviation
25

R E A L
The effects of the brewery industry on the evolution of the metal can industry 26
Table 3- Descriptive statistics at the population level (continued)
Table 4.3 Descriptive Statistics at the population level (continued)
35 20.00 79.00 36.7429 15.9657
35 18.00 120.00 46.2571 27.9130
35 6.00 28.00 13.7429 6.8055
35 .00 10.00 4.0000 2.425435 .00 8.00 2.1429 1.7846
35 .00 5.00 1.4857 1.2689
35 .00 3.00 .3714 .689735 .00 10.00 3.9714 2.479235 .00 7.00 2.0000 1.6270
35 .00 5.00 1.6000 1.3547
35 .00 2.00 .3714 .6456
35 54.00 79.00 65.0571 7.2027
35 21 37 29.31 5.22
35 22 33 29.06 2.38
35 3 11 6.69 2.49
35 .00 239.00 22.8571 49.1403
35 .00 82.00 6.1429 15.8210
35 .00 70.00 6.0000 14.4507
35 .00 87.00 10.7143 19.7210
35 .00 30.00 3.5143 6.7622
35 0 8 .71 1.74
35
Number of largebreweries east (plants)Number of largebreweries midwest(plants)Number of largebreweries west (plants)Metal can firms bornMetal can firms born eastMetal can firms bornmidwestMetal can firms born westMetal can firms diedMetal can firms died eastMetal can firms diedmidwestMetal can firms died westNumber of metal canfirmsNumber of metal canfirms eastNumber of metal canfirms midwestNumber of metal canfirms westSmall breweries bornSmall breweries borneastSmall breweries bornmidwestSmall breweries bornwestSmall breweries diedSmall breweries diedeastValid N (listwise)
N Minimum Maximum MeanStd.
Deviation
26

R E A L
The effects of the brewery industry on the evolution of the metal can industry 27
Table 3- Descriptive statistics at the population level (continued)
Table 4.3 Descriptive Statistics at the population level (continued)
35 0 11 .80 2.04
35 0 11 2.09 3.39
35 1.00 709.00 77.8571 157.8518
35 0 198 17.69 40.94
35 0 193 17.94 41.21
35 1 318 42.23 76.75
35 3.49 9.71 6.1264 1.5141
35 .93 1.22 1.0411 5.650E-02
35 79720.31 190253.04 146098.3 38818.34
35 2075.00 12449.60 7730.4171 3981.8092
35 .00 1622.00 172.1389 370.6865
35
Small breweries diedmidwestSmall breweries diedwestNumber of smallbreweriesNumber of smallbreweries esatNumber of smallbreweries midwestNumber of smallbreweries westunemployment rateYearly change in metalcan cost indexLarge breweries sales in$Metal can firms sales in $Samll breweries sales in$Valid N (listwise)
N Minimum Maximum MeanStd.
Deviation
Table 4– Descriptive statistics for the metal can industry at the firm level
Descriptive Statistics
1111 1.0 6510.0 478.519 1001.350
1912 2 72000 4086.50 10024.88
2277 54.00 79.00 60.4480 7.58962277 1.00 75.00 12.1866 11.4560
2277 .00 1.00 6.148E-02 .2403
1111
Sales in $size (number ofemployees)density at birthAGEstate at the end of year(1=died, 0=alive)Valid N (listwise)
N Minimum Maximum MeanStd.
Deviation
27

R E A L
The effects of the brewery industry on the evolution of the metal can industry 28
Table 5- Poisson birth models
(Standard errors in parentheses)
Covariates 1. Metal can 2. Metal can and large breweries
3. Metal can plus large and small breweries
Metal can firms died 0.017 (0.046)
Yearly change in metal can cost index 1.988 (1.300)
1.557 (1.768)
2.265 (1.847)
Metal can firms total sales 0.000 (0.000)
Density of metal can firms -0.086** (0.029)
-0.057 (0.034)
-0.106** (0.040)
Unemployment rate 0.246* (0.109)
0.169 (0.115)
0.210 (0.122)
Large breweries born (plants)
-0.044 (0.063)
-0.023 (0.066)
Large breweries born year –2 (plants)
-0.050 (0.062)
***
Large Breweries died (plants)
0.020 (0.029)
-0.013 (0.034)
Large breweries sales
-0.000 (0.000)
0.000 (0.000)
Density of large breweries (plants)
-0.003 (0.006)
0.002 (0.007)
Density of small breweries
-0.002 (0.013)
Small breweries born
0.016 (0.015)
Small breweries died
0.067 (0.075)
Small breweries total sales
-0.003 (0.004)
Number of observations Log likelihood
627 -293.756
627 -293.756
627 -293.756
• P<0.05, **P<0.01 *** Covariates were dropped due to collinearity problems.
28

R E A L
The effects of the brewery industry on the evolution of the metal can industry 29
Table 6- Mortality models at the national level (Standard errors in parentheses)
Covariates 1. Metal can 2. Metal can and large breweries
3. Metal can plus large and small breweries
Constant -6.546** (1.509)
-4.853 (2.971)
-4.740 (3.801)
Age -0.100** (0.016)
-0.107** (0.012)
-0.108** (0.012)
Density at birth time 0.010 (0.018)
Dummy for size replacement 0.959** (0.185)
0.996** (0.184)
0.997** (0.185)
Metal can firms born -0.092* (0.042)
***
Metal can firms died -0.107* (0.042)
-0.113** (0.043)
-0.150** (0.052)
Yearly change in metal can cost index 0.104** (0.024)
0.057** (0.014)
0.070** (0.017)
Metal can firms total sales -0.001** (0.000)
***
***
Density of metal can firms 0.0253 (0.024)
0.025 (0.020)
0.063 (0.033)
Size 0.000 (0.000)
Unemployment rate 0.087 (0.098)
Large breweries born (plants) -0.134* (0.055)
-0.152* (0.063)
Large Breweries died (plants) 0.017 (0.025)
0.021 (0.029)
Large breweries died year –2 (plants) -0.011 (0.029)
-0.017 (0.039)
Large breweries sales 0.000 (0.000)
-0.000* (0.000)
Density of large breweries (plants) 0.010 (0.010)
0.007 (0010)
Density of small breweries
0.065 (0.021)
Small breweries born
0.020 (0.033)
Small breweries born year –2
-0.022 (0.024)
Small breweries died
-0.049 (0.071)
Small breweries died year –2 0.037 (0.092)
Small breweries total sales -0002 (0.004)
Number of spells Number of events Log likelihood
2227 140 -768.304
2227 140 -763.878
2227 140 -771.244
* P<0.05, **P<0.01 *** Covariates were dropped due to collinearity problems.
29

R E A L
The effects of the brewery industry on the evolution of the metal can industry 30
Table 7- Mortality models for the eastern region (Standard errors in parentheses) Covariates 1. Metal can 2. Metal can and
large breweries 3. Metal can plus large and small breweries
Constant -2.361 (3.220)
-15.832** (3.428)
-16.377** (3.574)
Age -0.117** (0.023)
-0.109** (0.023)
-0.109** (0.023)
Density at birth time 0.028 (0.023)
0.032 (0.022)
0.034 (0.022)
Dummy for size replacement 0.833** (0.250)
0.816 (0.247)
0.825 (0.249)
Metal can firms born east 0.017 (0.090)
Metal can firms died east -0.088 (0.092)
Yearly change in metal can cost index -2.331 (2.786)
Metal can firms total sales 0.000 (0.000)
Density of metal can firms east -0.060 (0.070)
Size 0.000 (0.000)
Unemployment rate 0.037 (0.125)
Large breweries born east (plants)
-0.340* (0.155)
-0.274 (0.157)
Large Breweries died east (plants)
-0.046 (0.061)
***
Large breweries sales
0.000** (0.000)
0.000** (0.000)
Density of large breweries east (plants)
0.107** (0.033)
0.108** (0.033)
Density of small breweries east
-0.023 (0.017)
Small breweries born east
0.054 (0.037)
Small breweries died east
0.120 (0.123)
Small breweries total sales
***
Number of spells Number of events Log likelihood
1032 73 -389.519
1032 73 -384.846
1032 73 -383.363
* P<0.05 **P<0.01 *** Covariates were dropped due to collinearity problems.
30

R E A L
The effects of the brewery industry on the evolution of the metal can industry 31
Table 8- Mortality models for the Midwest (Standard errors in parentheses) Covariates 1.Metal can 2. Metal can and
large breweries 3. Metal can plus large and small breweries
Constant 2.470 (4.806)
0.360 (4.963)
4.318 (6.269)
Age -0.089** (0.025)
-0.088** (0.019)
-0.089** (0.019)
Density at birth time -0.001 (0.033)
Dummy for size replacement 1.666** (0.331)
1.683** (0.327)
1.699 (0.328)
Metal can firms born mid-west -0.237 (0.132)
Metal can firms died mid-west -0.237* (0.119)
-0.305* (0.145)
-0.379* (0.171)
Yearly change in metal can cost index -10.967* (4.273)
-8.849* (3.814)
-12.233* (5.653)
Metal can firms total sales -0.000 (0.000)
Density of metal can firms mid-west 0.169* (0.080)
0.167* (0.073)
0.165* (0.083)
Size 0.000 (0.000)
Unemployment rate 0.127 (0.134)
Large breweries born mid-west (plants)
-0.227 (0.157)
-0.283 (0.182)
Large Breweries died mid-west (plants)
0.004 (0.055)
-0.001 (0.056)
Large breweries sales
0.000 (0.000)
0.000 (0.000)
Density of large breweries mid-west (plants)
0.005 (0.019)
0.002 (0.019)
Density of small breweries mid-west
-0.043 (0.100)
Small breweries born mid-west
0.089 (0.102)
Small breweries died mid-west
0.125 (0.284)
Small breweries total sales
0.000 (0.008)
Number of spells Number of events Log likelihood
1012 54 -297.688
1012 54 -299.237
1012 54 -298.206
* P<0.05 **P<0.01 *** Covariates were dropped due to collinearity problems.
31

R E A L
The effects of the brewery industry on the evolution of the metal can industry 32
Table 9- Mortality models for the western region (Standard errors in parentheses) Covariates 1. Metal can 2. Metal can and
large breweries 3. Metal can plus large and small breweries
Constant -2.730 (16.133)
-14.467 (11.404)
-18.731 (12.146)
Age 0.075 (0.155)
Density at birth time 0.082 (0.145)
Dummy for size replacement 0.188 (1.424)
Metal can firms born west 0.063 (0.612)
Metal can firms died west -0.167 (0.447)
Yearly change in metal can cost index -8.228 (10.833)
Metal can firms total sales 0.000 (0.000)
Density of metal can firms west 0.224 (0.223)
Size 0.000 (0.000)
Unemployment rate -0.470 (0.377)
Large breweries born west (plants)
-0.613 (0.558)
-0.625 (0.599)
Large Breweries died west (plants)
-0.158 (0.348)
-0.029 (0.397)
Large breweries sales
0.000 (0.000)
0.000 (0.000)
Density of large breweries west (plants)
0.172 (0.308)
0.306 (0.341)
Density of small breweries west
0.046 (0.038)
Small breweries born west
-0.009 (0.060)
Small breweries died west
-0.335 (0.280)
Small breweries total sales
-0.006 (0.005)
Number of spells Number of events Log likelihood
233 13 -74.565
233 13 -77.112
233 13 -76.009
* P<0.05 **P<0.01 *** Covariates were dropped due to collinearity problems.
32

R E A L
The effects of the brewery industry on the evolution of the metal can industry 33
Table 10- Piece-rate mortality models for decades (Standard errors in parentheses) Covariates 1. Metal can 2. Metal can and
large breweries 3. Metal can plus large and small breweries
Period 1 (1962-1971): -1.328 (6.573)
14.011 (32.636)
7.556 (30.719)
Age -0.301** (0.105)
-0.295** (0.110)
-0.306** (0.110)
Metal can firms born -0.045 (0.106)
0.038 (0.150)
0.024 (0.147)
Metal can firms died -0.034 (0.132)
-0.132 (0.158)
-0.154 (0.162)
Metal can firms total sales -0.000 (0.000)
0.000 (0.002)
-0.001 (0.002)
Density of metal can firms 0.112 (0.116)
-0.045 (0.347)
0.038 (0.328)
Unemployment rate -0.527 (0.308)
Large breweries born (plants) -0.119 (0.182)
-0.165 (0.179)
Large Breweries died (plants) 0.091 (0.066)
0.101 (0.060)
Large breweries sales -0.000 (0.000)
-0.000 (0.000)
Density of large breweries (plants) -0.039 (0.035)
-0.038 (0.032)
Density of small breweries *** Small breweries born 0.473
(0.391) Small breweries died -7.647
(9.928) Small breweries total sales *** Period 2 (1972-1981): -17.991**
(5.824) -21.087 (18.393)
4.015 (50.141)
Age -0.119** (0.039)
-0.117** (0.038)
-0.117** (0.039)
Metal can firms born -0.206 (0.126)
-0.320 (0.169)
-0.189 (0.311)
Metal can firms died -0.548** (0.184)
-0.617** (0.235)
-1.129 (0.630)
Metal can firms total sales -0.000 (0.000)
-0.001 (0.001)
0.000 (0.002)
Density of metal can firms 0.233* (0.112)
0.198 (0.182)
-0.255 (0.722)
Unemployment rate 0.298 (0.212)
Large breweries born (plants) 0.016 (0.257)
0.519 (0.659)
Large Breweries died (plants) 0.116 (0.109)
0.333 (0.325)
Large breweries sales 0.000 (0.000)
0.000 (0.000)
Density of large breweries (plants)
-0.018 (0.047)
-0.055 (0.085)
33

R E A L
The effects of the brewery industry on the evolution of the metal can industry 34
Table 10- Piece-rate mortality models for decades (continued) (Standard errors in parentheses) Covariates 1. Metal can 2. Metal can and
large breweries 3. Metal can plus large and small breweries
Density of small breweries *** Small breweries born -2.717
(2.477) Small breweries died 1.891
(1.725) Small breweries total sales *** Period 3 (1982-1996): -13.662**
(2.494) -26.986** (9.899)
-18.377 (11.512)
Age -0.037** (0.011)
-0.037** (0.011)
-0.037** (0.011)
Metal can firms born -0.062 (0.056)
-0.063 (0.090)
-0.004 (0.104)
Metal can firms died -0.090 (0.051)
-0.067 (0.047)
-0.127* (0.059)
Metal can firms total sales 0.000** (0.000)
0.001 (0.000)
0.001* (0.000)
Density of metal can firms 0.043 (0.033)
0.035 (0.041)
0.024 (0.059)
Unemployment rate -0.090 (0.155)
Large breweries born (plants) -0.095 (0.096)
-0.172 (0.109)
Large Breweries died (plants) -0.005 (0.053)
-0.051 (0.078)
Large breweries sales 0.000 (0.000)
0.000 (0.000)
Density of large breweries (plants) 0.045 (0.046)
0.026 (0.055)
Density of small breweries *** Small breweries born 0.007
(0.006) Small breweries died -0.076
(0.047) Small breweries total sales *** Number of spells Number of events Log likelihood
2227 140 -845.885
2227 140 -836.784
2227 140 -833.372
* P<0.05 **P<0.01 *** Covariates were dropped due to collinearity problems.
34

R E A L
The effects of the brewery industry on the evolution of the metal can industry 35
Table 11- Piece-rate mortality models for metal can cost index stress (Standard errors in parentheses) Covariates 1. Metal can 2. Metal can and
large breweries 3. Metal can plus large and small breweries
Period 1, no stress (1962-1970): -7.576 (8.724)
23.172 (99.261)
23.669 (116.185)
Age -0.244 (0.134)
-0.269 (0.140)
-0.269 (0.140)
Metal can firms born -0.223 (0.145)
0.292 (0.831)
0.362 (1.835)
Metal can firms died 0.037 (0.143)
0.043 (0.994)
0.037 (1.129)
Metal can firms total sales -0.001 (0.001)
-0.002 (0.013)
-0.001 (0.018)
Density of metal can firms 0.162 (0.151)
-0.330 (1.133)
-0.391 (1.907)
Unemployment rate -0.312 (0.418)
-4.066 (12.745)
-4.607 (19.286)
Large breweries born (plants)
-0.4825 (0.918)
-0.541 (1.697)
Large Breweries died (plants)
0.293 (0.815)
0.282 (0.944)
Large breweries sales
*** ***
Density of large breweries (plants)
0.065 (0.210)
0.086 (0.533)
Density of small breweries
0.544 (25.520)
Small breweries born
-0.753 (16.302)
Small breweries died
0.473 (134.999)
Small breweries total sales
-0.116 (9.031)
Period 2, stress (1971-1986): -13.036** (3.098)
-10.905* (5.318)
22.540 (20.123)
Age -0.107** (0.024)
-0.108** (0.024)
-0.104** (0.024)
Metal can firms born 0.015 (0.078)
-0.028 (0.084)
0.007 (0.121)
Metal can firms died -0.351** (0.090)
-0.251** (0.096)
-0.323* (0.155)
Metal can firms total sales 0.000 (0.000)
-0.000 (0.000)
-0.000 (0.001)
Density of metal can firms 0.105 (0.056)
0.148* (0.071)
-0.190 (0.323)
Unemployment rate 0.255* (0.129)
0.347* (0.158)
-0.300 (0.329)
Large breweries born (plants)
-0.270* (0.121)
-0.264 (0.294)
Large Breweries died (plants)
-0.086 (0.065)
0.156 (0.144)
Large breweries sales
*** ***
Density of large breweries (plants)
-0.019 (0.020)
-0.117 (0.075)
Density of small breweries
-0.578 (0.410)
35

R E A L
The effects of the brewery industry on the evolution of the metal can industry 36
Table 11- Piece-rate mortality models for metal can cost index stress (continued) (Standard errors in parentheses) Covariates 1. Metal can 2. Metal can and
large breweries 3. Metal can plus large and small breweries
Small breweries born
0.636 (0.627)
Small breweries died
0.576 (1.329)
Small breweries total sales
0.084* (0.043)
Period 3, no stress (1987-1996): -27.856** (6.143)
-37.109** (9.800)
-1.671 (24.227)
Age -0.030** (0.011)
-0.030** (0.011)
-0.029* (0.011)
Metal can firms born -0.205** (0.068)
-0.333* (0.138)
-2.332 (3.588)
Metal can firms died -0.227** (0.085)
-0.294** (0.097)
-0.044 (0.749)
Metal can firms total sales 0.002** (0.000)
0.002** (0.001)
0.001 (0.005)
Density of metal can firms 0.269** (0.081)
0.440** (0.134)
1.248 (1.685)
Unemployment rate -1.880** (0.552)
-2.408** (0.664)
-5.979 (10.737)
Large breweries born (plants)
-0.161 (0.119)
1.161 (2.563)
Large Breweries died (plants)
0.096 (0.087)
0.617 (1.134)
Large breweries sales
*** ***
Density of large breweries (plants)
-0.046 (0.055)
-1.046 (1.833)
Density of small breweries
-0.121 (0.296)
Small breweries born
0.151 (0.251)
Small breweries died
0.576 (1.329)
Small breweries total sales
0.013 (0.053)
Number of spells Number of events Log likelihood
2227 140 -836.716
2227 140 -828.230
2227 140 -810.957
* P<0.05 **P<0.01 *** Covariates were dropped due to collinearity problems.
36

R E A L
The effects of the brewery industry on the evolution of the metal can industry 37
Figure 1- Density of the brewing and metal can populations 1962-1996
.00
100.00
200.00
300.00
400.00
500.00
600.00
700.00
800.00
Year
Large breweries(plant level)Small breweries
Metal can firms
37