CHAPTER 4 TECHNICAL FEASIBILITY STUDY4-1 CHAPTER 4 TECHNICAL FEASIBILITY STUDY 4.1 Power Demand...
174
4-1 CHAPTER 4 TECHNICAL FEASIBILITY STUDY 4.1 Power Demand Projection 4.1.1 Male’ Island In the aftermath of the Tsunami disaster caused by Sumatra earthquake of December 2004, there has been steady migration of people from outer islands to Male’ Island and the demand for electricity here has increased rapidly. The latest power demand projection conducted by STELCO was the Power Extension Study that was conducted by German consultant OLP in 2004, and this made a forecast of peak demand on Male’ and Hulhumale’ Islands up to 2020. For Male’ Island, this study estimated two scenarios: a high growth case and a low growth case; however, even in the low growth case, peak load is expected to exceed the firm capacity of generator facilities (the capacity obtained after deducting the largest generator capacity from the 85% of total rated capacity) in 2013, indicating an urgent need to reinforce generating facilities. Accordingly, STELCO commenced the Fourth Power System Development Project under support from DANIDA (Denmark) in 2009. This entails the procurement and installation of two DEGs (8 MW) with construction of foundations for three units and is scheduled for completion in 2010. It is planned to procure and install the third unit under this project in 2011. Male' - Firm Capacity versus Peak Load [MW] - 2003 to 2020 0.00 5.00 10.00 15.00 20.00 25.00 30.00 35.00 40.00 45.00 50.00 55.00 60.00 65.00 70.00 2003 2004 2005 2006 2007 2008 2009 2010 2011 2012 2013 2014 2015 2016 2017 2018 2019 2020 Year [MW] Largest Gen-set Out DG 10 / 8.0 MW DG 8 +9 / 16.0 MW DG 6+7 / 13.0 MW DG 1 - 5 / 16.6 MW Scenario 2 Projection @ 10.0 - 2.5% p.a. Scenario 1 Projection @10.3 - 2.5% p.a. Scenario 1 Extrapolation @ 10.3% p.a. Peak Load Actual Optimistic Conservative Source : STELCO Figure 4.1.1-1 Power Demand Projection for Male’ Island (STELCO)
Transcript of CHAPTER 4 TECHNICAL FEASIBILITY STUDY4-1 CHAPTER 4 TECHNICAL FEASIBILITY STUDY 4.1 Power Demand...
4-1
CHAPTER 4 TECHNICAL FEASIBILITY STUDY
4.1 Power Demand Projection
4.1.1 Male’ Island
In the aftermath of the Tsunami disaster caused by Sumatra earthquake of December 2004, there has
been steady migration of people from outer islands to Male’ Island and the demand for electricity here
has increased rapidly. The latest power demand projection conducted by STELCO was the Power
Extension Study that was conducted by German consultant OLP in 2004, and this made a forecast of
peak demand on Male’ and Hulhumale’ Islands up to 2020. For Male’ Island, this study estimated two
scenarios: a high growth case and a low growth case; however, even in the low growth case, peak load
is expected to exceed the firm capacity of generator facilities (the capacity obtained after deducting the
largest generator capacity from the 85% of total rated capacity) in 2013, indicating an urgent need to
reinforce generating facilities. Accordingly, STELCO commenced the Fourth Power System
Development Project under support from DANIDA (Denmark) in 2009. This entails the procurement
and installation of two DEGs (8 MW) with construction of foundations for three units and is scheduled
for completion in 2010. It is planned to procure and install the third unit under this project in 2011.
Male' - Firm Capacity versus Peak Load [MW] - 2003 to 2020
0.00
5.00
10.00
15.00
20.00
25.00
30.00
35.00
40.00
45.00
50.00
55.00
60.00
65.00
70.00
2003 2004 2005 2006 2007 2008 2009 2010 2011 2012 2013 2014 2015 2016 2017 2018 2019 2020
Year
[MW
]
Largest Gen-set Out
DG 10 / 8.0 MW
DG 8 +9 / 16.0 MW
DG 6+7 / 13.0 MW
DG 1 - 5 / 16.6 MW
Scenario 2 Projection@ 10.0 - 2.5% p.a.
Scenario 1 Projection @10.3 - 2.5% p.a.
Scenario 1 Extrapolation@ 10.3% p.a.
Peak Load Actual
Optimistic
Conservative
Source : STELCO
Figure 4.1.1-1 Power Demand Projection for Male’ Island (STELCO)

4-2
The Study Team conducted regression analysis based on the minimum square method utilizing GDP
values (by the Ministry of Finance) from 1997 to 2007 and GDP projections from 2008 to 2011 as the
first parameter and population statistics from 2000 to 2007 as the second parameter, and compared the
findings with the above projection by STELCO. The prediction model was constructed on the
econometric simulation software Simple EE, which is used for projecting power demand in East Asia.
Generally speaking, since econometric models are constructed as an aggregate of numerous estimation
expressions and definitional expressions, it is necessary to verify the model validity. In the Study,
model validity was verified through using the following indicators:
Coefficient of determination (R2) (expressing overall model certainty): 0.85 or more
Value t (estimated coefficient assessing reference accuracy): Absolute value of 2 or more
As a result of conducting regression analysis on peak load, R2 = 0.979 and t = 2.57 were obtained and
the validity of the constructed model was verified. In the future, these projection findings will be used
to project peak load on each distribution line feeder and estimate the maximum PV capacity that can
be connected to each feeder.
3137033640 36110
38380 40600 4276044840 46790 48610
50270 5174053000
34330
37952 4144144949 48424
5180755040
5806060807
6322365254 66853
33554 35829
38258 40523
42789 45055
47321 49587
51852 54118
56384 58650
0
10000
20000
30000
40000
50000
60000
70000
80000
2009 2010 2011 2012 2013 2014 2015 2016 2017 2018 2019 2020
Pe
ak L
oad
(kW
)
Year
STELCO projection (low growth case)
STELCO projection (high growth case)
Study Team projection (GDP regression analysis)
Source: Prepared by the Study Team
Figure 4.1.1-2 Power Demand Projection for Male’ Island
(Comparison with the Study Team’s Projection)
4.1.2 Hulhumale’ Island
As in the case of Male’ Island, the latest demand projection (Figure 4.1.2-1) is the one that was
implemented in 2004, however, because values from 2004 onwards are not reflected in this forecast,
the Study Team conducted a separate demand projection involving analysis of peak power from 2004
to 2008. According to the Hulhumale’ Development Corporation (HDC), although plans aiming for the
relocation of 60,000 residents by 2020 are being sustained by the new government, future trends
regarding the large-scale development of residential areas and industrial and business districts are
4-3
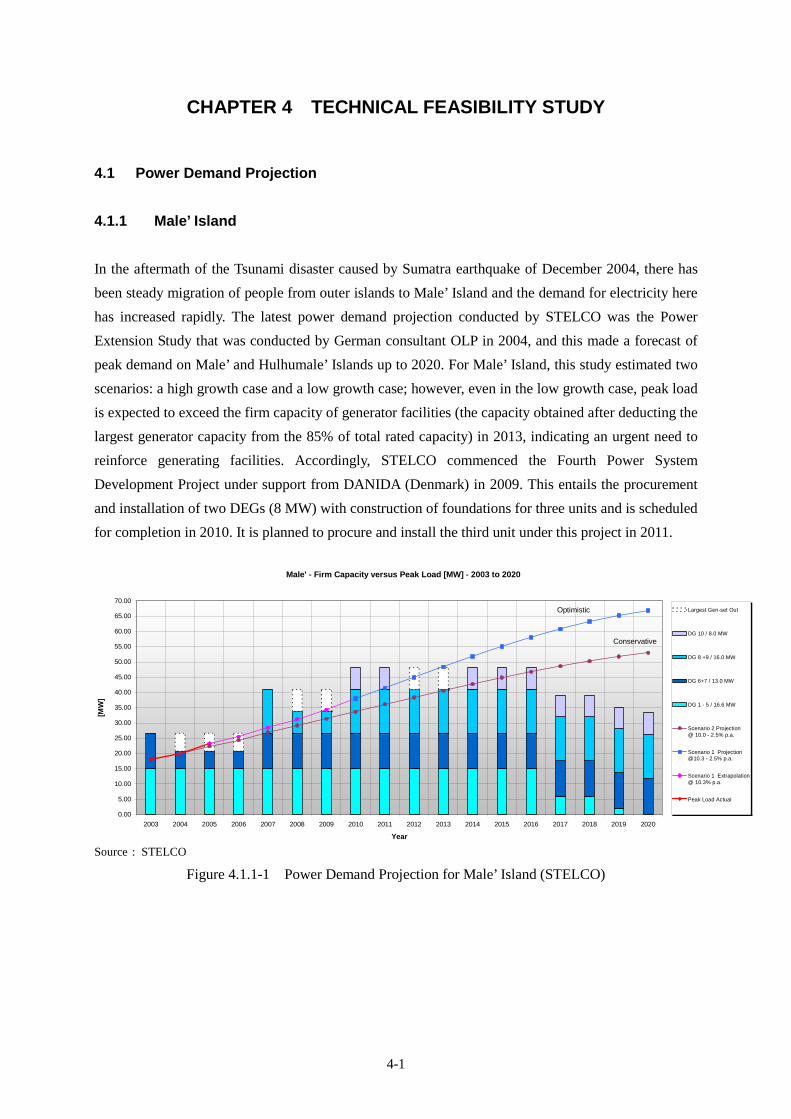
unclear. Accordingly, demand projection was implemented for two cases, i.e. 1) the population growth
rate (24.3%) required to achieve the target population proposed under the relocation program, and 2)
the case assuming the peak load growth rate (10.8%) between 1987~2008 on Male’ Island. As is
shown in Figure 4.1.2-2, power demand in the high growth case is estimated to be approximately 16
MW in 2020, which is close to the findings of the low growth case by STELCO. Therefore, detailed
analysis in the following sections will be carried out based on the high growth case estimated by the
Study Team.
Hulhumale - Peak Load Projections [MW] - 2005 to 2020
0.00
2.50
5.00
7.50
10.00
12.50
15.00
17.50
20.00
22.50
25.00
27.50
30.00
2000 2002 2004 2006 2008 2010 2012 2014 2016 2018 2020
Year
[MW
]
Scenario 1 Population@ 3050 cap/a0.2 - 0.5 kW/cap
Scenario 2 Population@ 1500 / 3050 cap/a 0.15 - 0.4 kW/cap
Scenario 3 Population@ 1500 / 3050 cap/a0.2 - 0.5 kW/cap
Peak Load Actual
Optimistic
Conservative
Source : STELCO
Figure 4.1.2-1 Estimated Power Demand on Hulhumale’ Island (STELCO)
1,479 1,838 2,283 2,838
3,526 4,382
5,445
6,766
8,408
10,448
12,983
16,133
1,319 1,461 1,620 1,795 1,989 2,204 2,443 2,707 3,000 3,325 3,684
4,083
0
2,000
4,000
6,000
8,000
10,000
12,000
14,000
16,000
18,000
2009 2010 2011 2012 2013 2014 2015 2016 2017 2018 2019 2020
Pea
k L
oad
(kW
)
Year
High growth case
Low growth case
Source : Prepared by the Study Team
Figure 4.1.2-2 Estimated Power Demand on Hulhumale’ Island (Study Team)

4-4
4.2 Collection and Analysis of Solar Irradiation Data, etc.
During the first field survey, the Study Team visited the Department of Meteorology and calculated
monthly solar irradiation utilizing data measured in a joint effort between the former Ministry of
Communication Science & Technology (MCST) and UNDP between August 1, 2003 and July 31,
2004.
Solar irradiation observations are not currently implemented due to breakdown of the data logger,
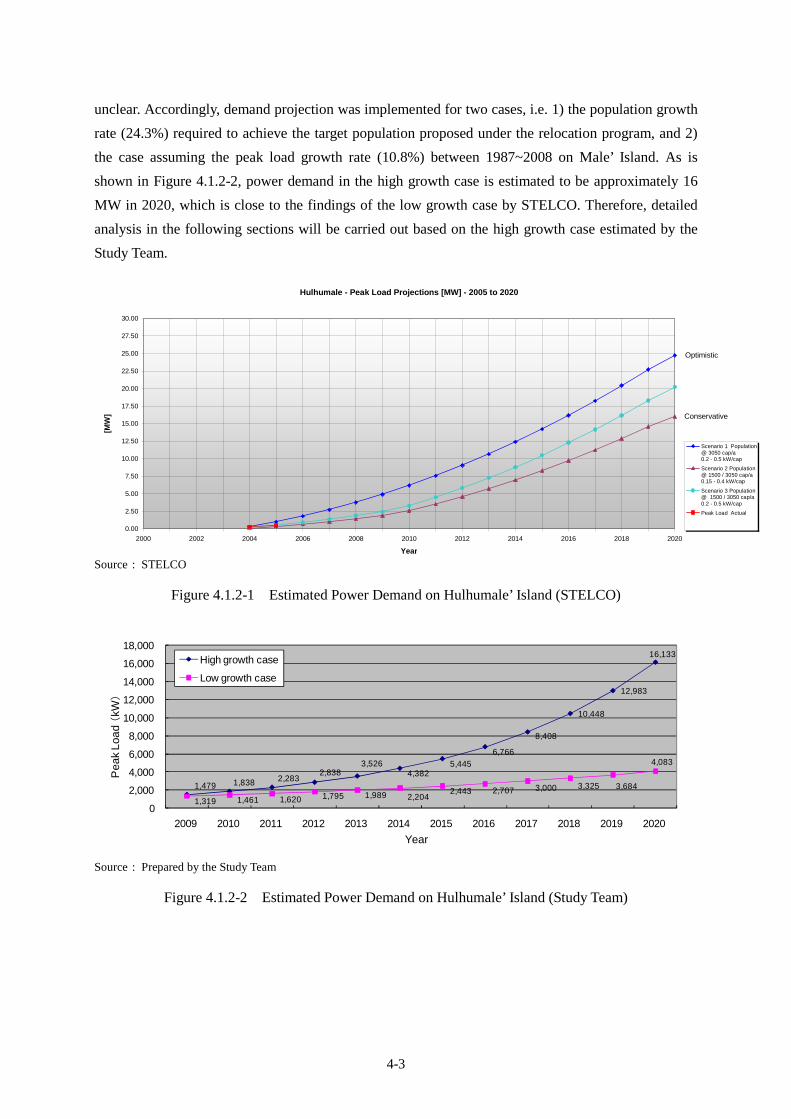
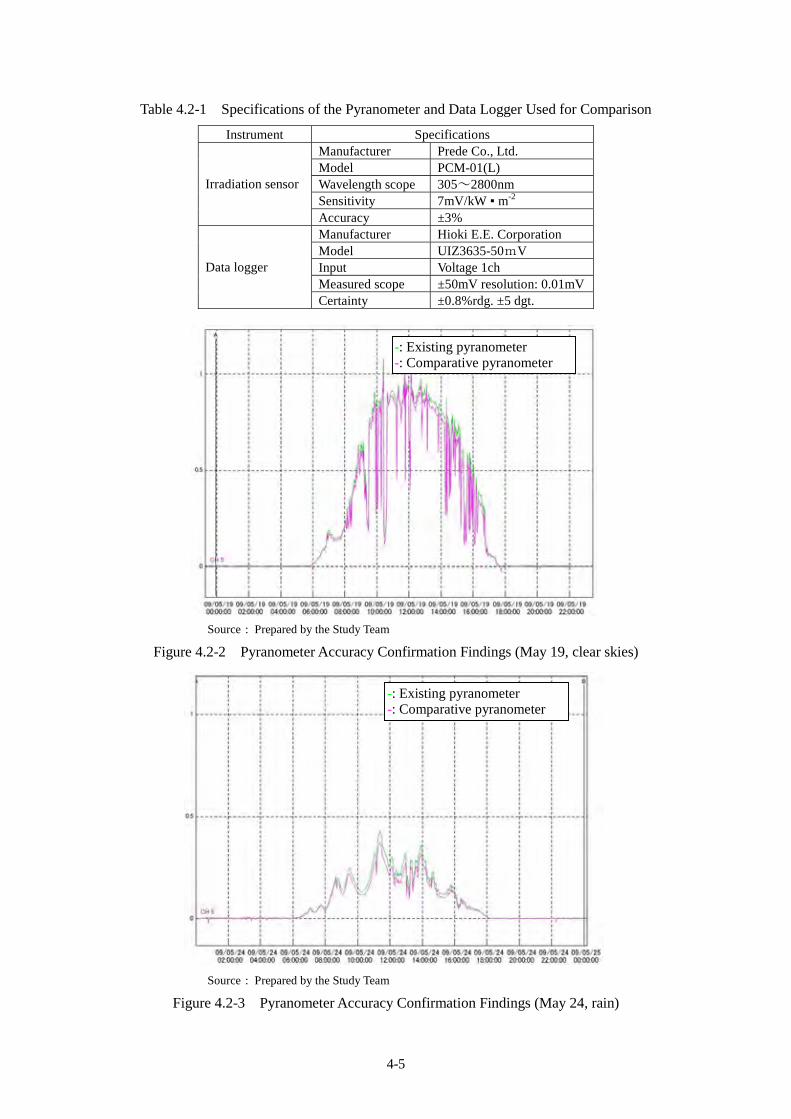
however, the Study Team found that the pyranometer is operating independently. In order to confirm
the reliability of the data, in the second field survey the Study Team took a calibrated pyranometer
(Table 4.2-1), installed it in the same place and compared the resulting data with data from the existing
instrument. As is shown in Figure 4.2-2 and Figure 4.2-3, since both meters give almost the same data,
reliability of the local pyranometer was confirmed and it was decided to adopt the measurements from
August 1, 2003 to July 31, 2004 as the basic data.
Source : Prepared by the Study Team
Figure 4.2-1 Hulhumale’ Island Solar Irradiation Data Analysis Findings
Pyranometer (data logger not working) installed in the Meteorological Agency on Hulhumale’ Island
Month
Daily Avg. GrobalIrradiation
[kWh/m2/day]
1 5.302 5.693 6.084 5.315 4.926 5.127 4.578 5.679 4.63
10 6.1511 4.0512 5.17
AVE 5.22
0.00
1.00
2.00
3.00
4.00
5.00
6.00
7.00
1 2 3 4 5 6 7 8 9 10 11 12 AVE
Month
Irr
adiatio
n(kW
h/m2/d
ay)
4-5
Table 4.2-1 Specifications of the Pyranometer and Data Logger Used for Comparison
Instrument Specifications Manufacturer Prede Co., Ltd. Model PCM-01(L) Wavelength scope 305~2800nm Sensitivity 7mV/kW m-2
Irradiation sensor
Accuracy ±3% Manufacturer Hioki E.E. Corporation Model UIZ3635-50mV Input Voltage 1ch Measured scope ±50mV resolution: 0.01mV
Data logger
Certainty ±0.8%rdg. ±5 dgt.
Source : Prepared by the Study Team
Figure 4.2-2 Pyranometer Accuracy Confirmation Findings (May 19, clear skies)
Source : Prepared by the Study Team
Figure 4.2-3 Pyranometer Accuracy Confirmation Findings (May 24, rain)
-: Existing pyranometer -: Comparative pyranometer
-: Existing pyranometer -: Comparative pyranometer

4-6
This global solar irradiation data were divided into direct solar irradiation and scattered solar
irradiation using the solar irradiation estimation method devised by the New Energy and Industrial
Technology Development Organization (NEDO) based on survey by the Japan Weather Association.
The findings of these calculations shall be used as design parameters for projecting power generation
in the grid-connected PV system.
Source : Prepared by the Study Team
Figure 4.2-4 Horizontal Plane Solar Irradiation Data Applied in the Study
4.3 Examination and Measurement concerning Solar Irradiation Obstruction
The Study Team and counterparts surveyed each potential site and confirmed the areas where sunlight
is impeded by surrounding buildings and obstructions, etc. Upon selecting impacted areas on each site,
examination of solar irradiation obstruction was conducted with the counterparts using a solar map at
the winter solstice on Male’ Island and Hulhumale’ Island and a transit compass.
Month
Daily Avg. GrobalIrradiation
[kWh/m2/day]
1 5.232 5.613 5.994 5.245 4.866 5.067 4.518 5.609 4.56
10 6.0611 4.0012 5.10
AVE 5.15
0.00
1.00
2.00
3.00
4.00
5.00
6.00
7.00
1 2 3 4 5 6 7 8 9 10 11 12 AVE
Month
Irr
adia
tio
n(kW
h/m2/d
ay)

4-7
Table 4.3-1 Measurement Results concerning Solar Irradiation Obstruction
No Site Solar irradiation
obstruction (measured site)
Measurement point and impacted time
Male’ Island 1 STELCO Building None 2 STELCO Power House None
3 Dharubaaruge Yes
(West and east buildings)
West building Points A, B, C, D (17:00-18: 00) East building Points A, B (16:00-18:00), Point C (6:00-9: 00,17:00-18:00), Point D (6:00-7:00)
4 Velaanaage (Govt. Office) Unknown (works in progress)
5 Giyaasudheen School Yes
(Gymnasium)
Point A (6:00-8:10,13: 50-15:10), Point B (6:00-8:10), Point C (6:00-7:40) Point D (6:00-7:30), Point E (6:00-7:10)
6 Kalaafaanu School
Yes (South and
north school buildings and gymnasium)
South school building: Points A, B (17: 10-18: 00), Point C (16:30-18:00), Point D (17:00-18:00)North building: Points A, B (16:50-18:00), Point C (16:30-18:00), Point D (15:30-18:00)Gymnasium Point A (16:30-18:00), Point B (15:40-18:00), Point C (14:50-18:00), Point D (15:30-18:00)
North school
building
South school
building
gymnasium

4-8
No Site Solar irradiation
obstruction (measured site)
Measurement point and impacted time
7 Maldives Center for Social Education
Yes
Range of 6 m viewed from above
8 Thaajuddeen School Yes
(Gymnasium)
Gymnasium: Point A (6:00-10:00)
9 New Secondary School for Girls
Yes (Central building,
gymnasium, west school
building)
Central building: Point A (6:00-7:20, 16:00-18:00), Point B (6:00-7:30, 16:30-18:00) Gymnasium: Point A (6:00-7:50, 15:30-18:00) Point B (15:30-18:00), Point C (15:30-18:00)Point D (6:00-8:00, 16:30-18:00), west school building Point A (6:00-11:00), Point B (6:00-7:30)
10 Indhira Gandhi Memorial Hospital (IGMH)
Yes (Rooftop terrace)
Point A (6:00-8:00, 16:30-18:00) Point B (6:00-7:50, 16:20-18:00) Point C (6:00-10:00, 16:20-18:00) Point D (6:00-8: 10, 16:50-18:00) Point E (6:00-7: 30, 15:10-18:00)
11 Faculty of Engineering None
12 National Stadium Yes Impossible to measure (the west stand is affected in the afternoon)
13 Majeedhiya School None
Central
building
West school
building
gymnasium
gymnasium

4-9
No Site Solar irradiation
obstruction (measured site)
Measurement point and impacted time
14 Dharumavantha School Yes Omitted from the solar irradiation study because of numerous surrounding obstructions.
15 Fen Building Yes
(Rooftop terrace)
Point A (14:00-18:00), Point B (17:00-18:00), Point C 13:50-18:00), Point D (6:00-18:00)
16 Water Tank (MWSC) None 17 Faculty Education None 18 Sports Grounds None
19 Male’ South West Harbour Parking
None
20 Grand Friday Mosque None 21 Jumhooree Maidhan None 22 President’s Office None
Hulhumale’ Island 1 Lale International School None 2 Hulhumale Hospital None 3 Ghaazee School None 4 HDC None 5 Housing Flats None
Source : Prepared by the Study Team
Figure 4.3-1 OJT on the Solar Irradiation Obstruction Measurement Method
Solar energy comprises direct solar irradiation which directly reaches the earth, as well as scattered
solar irradiation (scattered by dirt, dust and clouds, etc. in the air) and reflected solar irradiation.
However, reflected solar irradiation shall not be considered here because it varies according to
conditions in each area.

4-10
Solar energy shall be examined as the sum of direct solar irradiation and scattered solar irradiation,
and the hourly intensity of solar irradiation shall be calculated. Accordingly, hourly changes in solar
irradiation intensity are approximated in the manner shown in the figure below.
0
0.2
0.4
0.6
0.8
1
1 2 3 4 5 6 7 8 9 10 11 12 13 14 15 16 17 18 19 20 21 22 23 24
Source : Prepared by the Study Team
Figure 4.3-2 Hourly Changes in Solar Irradiation Intensity
The above figure shows the amount of solar irradiation at the measurement point, assuming that
shadow has an impact that invalidates solar irradiation between 06:00 and 09:00 and this invalid solar
irradiation is deducted.
The following table shows direct solar irradiation and scattered solar irradiation values calculated by
the Study Team upon quoting from the survey and research report on PV systems (survey and research
of meteorological data for constructing PV utilization systems) by NEDO. For the purposes of this
examination, data are taken from January, the month of the winter solstice, when shadows are the
longest.

4-11
Table 4.3-2 Solar Irradiation in January on Male’ Island
Month TimeHorizontal Place
Direct Arrival
Horizontal Plane
Scattering
Horizontal Plane
Total
1 1 0.000 0.000 0.0001 2 0.000 0.000 0.0001 3 0.000 0.000 0.0001 4 0.000 0.000 0.0001 5 0.000 0.000 0.0001 6 0.000 0.000 0.0001 7 0.063 0.064 0.1271 8 0.165 0.130 0.2951 9 0.281 0.188 0.4691 10 0.389 0.231 0.6201 11 0.465 0.259 0.7241 12 0.492 0.268 0.7601 13 0.465 0.259 0.7241 14 0.389 0.231 0.6201 15 0.281 0.188 0.4691 16 0.165 0.130 0.2951 17 0.063 0.064 0.1271 18 0.000 0.000 0.0001 19 0.000 0.000 0.0001 20 0.000 0.000 0.0001 21 0.000 0.000 0.0001 22 0.000 0.000 0.0001 23 0.000 0.000 0.0001 24 0.000 0.000 0.000
5.230 Source : Prepared by the Study Team
In cases where shadow occurs at a certain time at the target point, it is conservatively assumed that the
intensity of solar irradiation at that time entails neither direct solar irradiation nor scattered solar
irradiation. In the case where shadow has an impact between 06:00~08:00 in January in the target area,
it is assumed that a total of 0.127 kwh/m2 of solar energy between 06:00 and 07:00 and a total of 0.295
kwh/m2 of solar energy between 07:00 and 08:00 cannot be acquired due to the shadow. Therefore,
judging from the solar irradiation examination data given in the above table, this means that solar
irradiation in January is 5.23 kwh/m2/day, and the amount of solar irradiation available for power
generation is this amount minus 0.127 kwh/m2 and 0.295 kwh/m2, i.e. 4.477 kwh/m2/day.
Based on these findings, the estimated amount of solar irradiation at each site is calculated as follows.
4-12
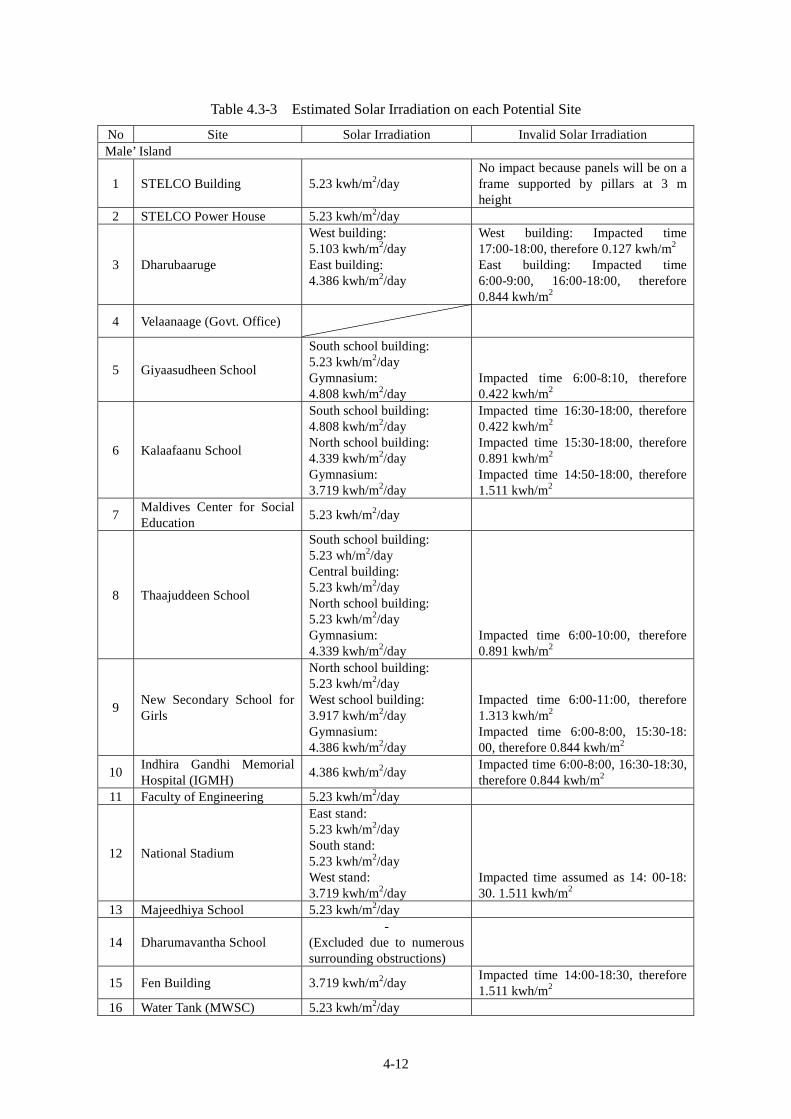
Table 4.3-3 Estimated Solar Irradiation on each Potential Site
No Site Solar Irradiation Invalid Solar Irradiation Male’ Island
1 STELCO Building 5.23 kwh/m2/day No impact because panels will be on a frame supported by pillars at 3 m height
2 STELCO Power House 5.23 kwh/m2/day
3 Dharubaaruge
West building: 5.103 kwh/m2/day East building: 4.386 kwh/m2/day
West building: Impacted time 17:00-18:00, therefore 0.127 kwh/m2
East building: Impacted time 6:00-9:00, 16:00-18:00, therefore 0.844 kwh/m2
4 Velaanaage (Govt. Office)
5 Giyaasudheen School
South school building: 5.23 kwh/m2/day Gymnasium: 4.808 kwh/m2/day
Impacted time 6:00-8:10, therefore 0.422 kwh/m2
6 Kalaafaanu School
South school building: 4.808 kwh/m2/day North school building: 4.339 kwh/m2/day Gymnasium: 3.719 kwh/m2/day
Impacted time 16:30-18:00, therefore 0.422 kwh/m2 Impacted time 15:30-18:00, therefore 0.891 kwh/m2 Impacted time 14:50-18:00, therefore 1.511 kwh/m2
7 Maldives Center for Social Education
5.23 kwh/m2/day
8 Thaajuddeen School
South school building: 5.23 wh/m2/day Central building: 5.23 kwh/m2/day North school building: 5.23 kwh/m2/day Gymnasium: 4.339 kwh/m2/day
Impacted time 6:00-10:00, therefore 0.891 kwh/m2
9 New Secondary School for Girls
North school building: 5.23 kwh/m2/day West school building: 3.917 kwh/m2/day Gymnasium: 4.386 kwh/m2/day
Impacted time 6:00-11:00, therefore 1.313 kwh/m2 Impacted time 6:00-8:00, 15:30-18: 00, therefore 0.844 kwh/m2
10 Indhira Gandhi Memorial Hospital (IGMH)
4.386 kwh/m2/day Impacted time 6:00-8:00, 16:30-18:30, therefore 0.844 kwh/m2
11 Faculty of Engineering 5.23 kwh/m2/day
12 National Stadium
East stand: 5.23 kwh/m2/day South stand: 5.23 kwh/m2/day West stand: 3.719 kwh/m2/day
Impacted time assumed as 14: 00-18: 30. 1.511 kwh/m2
13 Majeedhiya School 5.23 kwh/m2/day
14 Dharumavantha School -
(Excluded due to numerous surrounding obstructions)
15 Fen Building 3.719 kwh/m2/day Impacted time 14:00-18:30, therefore 1.511 kwh/m2
16 Water Tank (MWSC) 5.23 kwh/m2/day

4-13
No Site Solar Irradiation Invalid Solar Irradiation 17 Faculty Education 5.23 kwh/m2/day 18 Sports Grounds 5.23 kwh/m2/day
19 Male’ South West Harbour Parking
5.23 kwh/m2/day
20 Grand Friday Mosque 5.23 kwh/m2/day 21 Jumhooree Maidhan 5.23 kwh/m2/day 22 President’s Office 5.23 kwh/m2/day
Hulhumale’ Island 1 Lale International School 5.23 kwh/m2/day 2 Hulhumale Hospital 5.23 kwh/m2/day 3 Ghaazee School 5.23 kwh/m2/day 4 HDC 5.23 kwh/m2/day 5 Housing Flats 5.23 kwh/m2/day
Source : Prepared by the Study Team
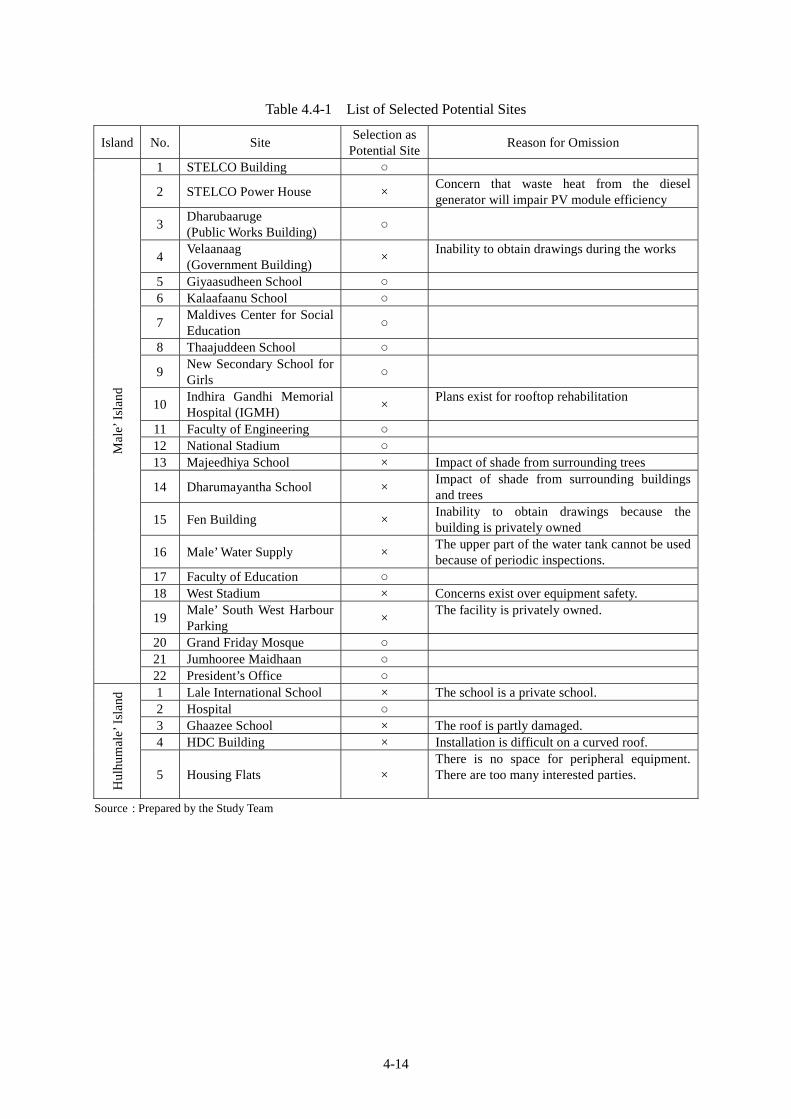
4.4 Selection of Potential Sites for Introducing the Grid-Connected PV System
The Maldives side recommended that the following 27 sites, consisting of 22 on Male’ Island and 5 on
Hulhumale’ Island, be used as survey targets in the Study. Upon discussing with the Maldives side, a
number of sites were excluded because of concerns over the impact of shadow, difficulty in
implementing survey due to private facilities or difficulty in obtaining drawings, etc., and it was
eventually decided to implement technical examination on 14 potential sites.
4-14
Table 4.4-1 List of Selected Potential Sites
Island No. Site Selection as
Potential Site Reason for Omission
1 STELCO Building
2 STELCO Power House × Concern that waste heat from the diesel generator will impair PV module efficiency
3 Dharubaaruge (Public Works Building)
4 Velaanaag (Government Building)
× Inability to obtain drawings during the works
5 Giyaasudheen School 6 Kalaafaanu School
7 Maldives Center for Social Education
8 Thaajuddeen School
9 New Secondary School for Girls
10 Indhira Gandhi Memorial Hospital (IGMH)
× Plans exist for rooftop rehabilitation
11 Faculty of Engineering 12 National Stadium 13 Majeedhiya School × Impact of shade from surrounding trees
14 Dharumayantha School × Impact of shade from surrounding buildings and trees
15 Fen Building × Inability to obtain drawings because the building is privately owned
16 Male’ Water Supply × The upper part of the water tank cannot be used because of periodic inspections.
17 Faculty of Education 18 West Stadium × Concerns exist over equipment safety.
19 Male’ South West Harbour Parking
× The facility is privately owned.
20 Grand Friday Mosque 21 Jumhooree Maidhaan
Mal
e’ I
slan
d
22 President’s Office 1 Lale International School × The school is a private school. 2 Hospital 3 Ghaazee School × The roof is partly damaged. 4 HDC Building × Installation is difficult on a curved roof.
Hul
hum
ale’
Isl
and
5 Housing Flats × There is no space for peripheral equipment. There are too many interested parties.
Source : Prepared by the Study Team

4-15
4.5 Assessment of Load Responsiveness in the Diesel Generator
The Study Team surveyed STELCO diesel power plants on Male’ Island and Hulhumale’ Island and
confirmed the control method used on existing diesel generators. On both islands, the number of diesel
generators in operation is left to the individual discretion of operators. On Male’ Island, since a
SCADA (Supervisory Control and Data Acquisition) system is used to monitor demand conditions in
real time, the system can respond to demand changes relatively quickly, whereas on Hulhumale’
Island, operators monitor and record the total generator output every hour and alter the number of
units in operation so that spare operating capacity is 20% or more.
The number of governor-free diesel generators can be switched by the SCADA system, however, since
the system is configured to trip when engine exhaust heat exceeds 550℃, an alarm is triggered and
operation is switched to fixed output operation when 500℃ is reached. The diesel governor speed
adjustment rate is stabilized at 4%.
The frequency control standard of STELCO is 50Hz±1.0% and, since the governor speed adjustment
rate is 4%, it is possible to hold fluctuations to within the standard range up to 25.0%(1.0% / 4.0%) of
the generator rated capacity during governor-free operation.
4.6 Examination and Measurement of Existing Distribution Transformer Capacity
and Distribution System
Concerning the potential sites that were selected in 4.4, survey was carried out on the capacity of
existing distribution transformers and distribution lines that will link the PV systems with the grid.
Out of the distribution transformers at the interconnection points, No. 61 Tr (Kalaafaanu School) and
No. 62 Tr (Maldives Center for Social Education) are owned by the Ministry of Education and
Ministry of Human Resources, Youth and Sports, respectively, while the others are all owned by
STELCO.
Upon checking against the results of examining PV installation capacity on the potential sites as
described in 4.10, it was confirmed that none of the existing transformers will be overloaded.
However, concerning No. 61 Tr, since the high voltage power receiving equipment is broken down, it
is scheduled to conduct repairs under the budget of the Ministry of Education.

4-16
Table 4.6-1 Survey Findings Regarding Capacity of Transformers at Interconnection Points
Island Site No.
Site Name PV
Capacity [kWp]
Feeder No.
Distribution Tr No.
Tr Capacity
[kVA] Remarks
1 STELCO Building 45 FD9 20B 500 3 Dharubaaruge 85 FD3 60 630
5 Giyaasudheen
School 40 FD6 70 150
6 Kalaafaanu School 85 FD3 61 100
High voltage power receiving equipment is broken down.
7 Maldives Center
for Social Education
100 FD6 62 200
8 Thaajuddeen
School 130 FD6 23 1,000
9 New Secondary School for Girls
100 FD6 23 1,000
11 Faculty of
Engineering 80 FD4 25 800
12 National Stadium 400 FD9 41B 1,000
17 Faculty of Education
10 FD7 30 630
20 Grand Friday
Mosque 30 FD2 14 630
21 Jumhooree Maidhaan
60 - 160 FD2 14 630
Male’ Island
22 President’s Office 20 FD8 73 1,250 Hulhumale’
Island 2 Hospital 60 FD2 11 315
Source : Prepared by the Study Team
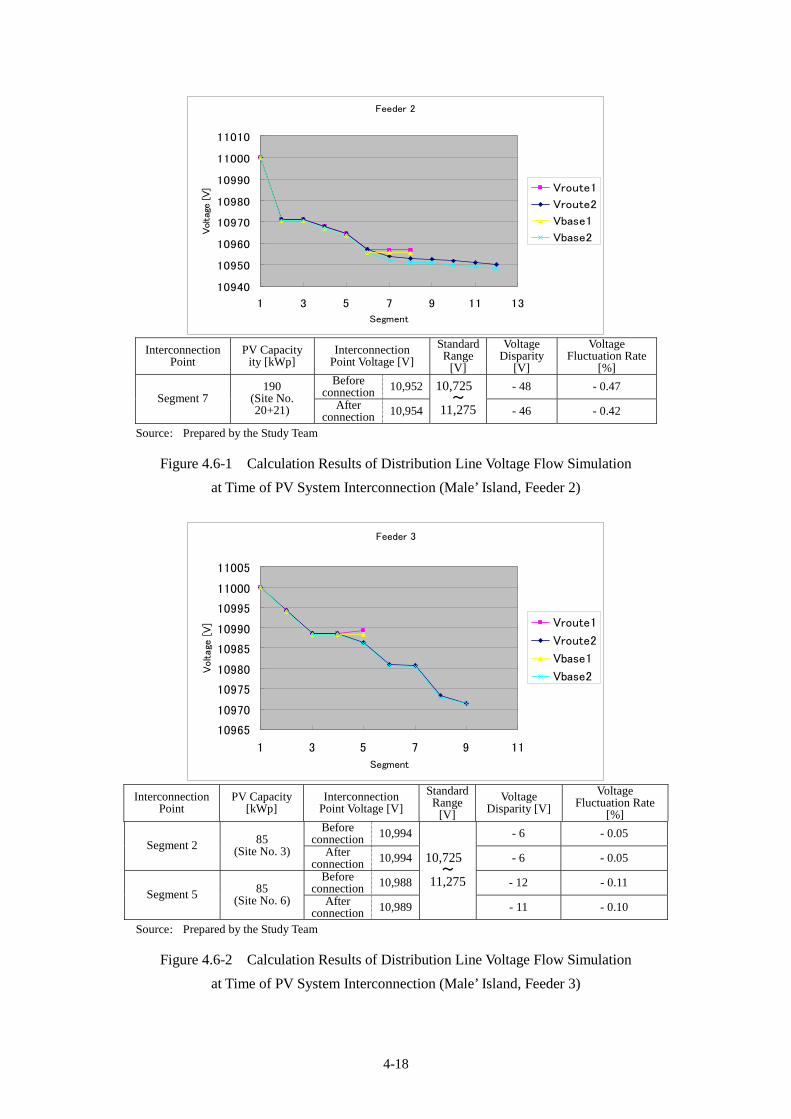
Furthermore, in order to examine impact on the distribution system, calculation of simulated voltage
flows was carried out using the condition shown in Table 4.6.2 based on distribution transformer
demand data and line impedance data received from STELCO. In order to check for excessive voltage
increase when solar backflows occur, minimum load (demand data) and solar generating capacity were
calculated assuming installation of rated output with power factor of 1 at each interconnection point.
As for the bus voltage of power plant, the Team confirmed with STELCO that AVR (Automatic
Voltage Regulator) setting of 11kV rated voltage generators is 11kV and tap setting of step-up
transformers for 400V rated voltage generators is middle tap (11kV, fix)
Also, the line impedance data were calculated upon considering the most recent reinforcement plans
indicated in Table 3.3.5-1.
The simulation results are given below. In the legend given in each figure, Vbase indicates the voltage
on each section before connection of the PV system to the grid, while index numbers are conferred to
each branch feeder. On feeders where Vroute is the same number as Vbase, voltage following connection
of the PV system to the grid is shown (however, V is displayed for feeders that have no branch line).

4-17
In addition, Segment 1 on horizontal axis means bus of power plant and each connection point of
distribution transformer (11kV/230V) is numbered up to the end of distribution lines
Table 4.6- 2 Simulation Condition
2 3 4 5 6 7 8 9 10 11 12 13 14Tr No. 50A 50B 42 34 54A 54B 91Min. Load [kVA] 571 1007 35 552 567 522 65PV Capacity [kW]Tr No. 14 17B 17A 21 49 58BMin. Load [kVA] 138 167 98 264 81 819PV Capacity [kW] 190Tr No. 60 13B 13A 61Min. Load [kVA] 45 561 448 0PV Capacity [kW] 85 85Tr No. 81 57A 57B 51 41AMin. Load [kVA] 338 262 519 713 704PV Capacity [kW]Tr No. 33 31A 47 39 90 43Min. Load [kVA] 539 201 330 12 8 334PV Capacity [kW]Tr No. 25 31BMin. Load [kVA] 35 325PV Capacity [kW] 80Tr No. 20A 32 29 87 88Min. Load [kVA] 435 423 309 24 93PV Capacity [kW]Tr No. 70 40 28 72 26 24 24B 24AMin. Load [kVA] 44 486 159 173 196 268 270 187PV Capacity [kW] 40Tr No. 23 62Min. Load [kVA] 268 23PV Capacity [kW] 230 100Tr No. 44A 44B 46Min. Load [kVA] 393 432 706PV Capacity [kW]Tr No. 30 56A 66 77 76 59A 59B 84 22 10 79 83 16Min. Load [kVA] 412 709 518 127 556 437 547 110 565 594 75 352 217PV Capacity [kW] 10Tr No. 75 52 85 67 38 64 36 86 35Min. Load [kVA] 527 340 110 120 388 30 362 415 388PV Capacity [kW]Tr No. 15 18Min. Load [kVA] 499 240PV Capacity [kW]Tr No. 48 53 73 11 68Min. Load [kVA] 300 271 249 203 16PV Capacity [kW] 20Tr No. 20B 78 41B 19 37 12B 69 82A 12A 65 71Min. Load [kVA] 30 397 0 531 579 385 46 123 473 44 41PV Capacity [kW] 45 400Tr No. 10 11 12 13 14Min. Load [kVA] 60 67 143 131 235PV Capacity [kW] 60Tr No. 15Min. Load [kVA] 145PV Capacity [kW]
Segment
Male' Island
Hulhumale'Island
Feeder 2
Feeder 3
Feeder 4
Feeder 6
Feeder 7
Feeder 8
Feeder 9
Feeder 2
Route 1
Route 2
Route 1
Route 2
Route 1
Route 2
Route 1
Route 2
Route 3
Route 4
Route 1
Route 1
Route 2
Route 3
Route 1
Route 1
Route 2
Source : Prepared by the Study Team ※all load factor are 0.8.
4-18
Interconnection Point
PV Capacity ity [kWp]
Interconnection Point Voltage [V]
StandardRange
[V]
Voltage Disparity
[V]
Voltage Fluctuation Rate
[%] Before
connection 10,952 - 48 - 0.47 Segment 7
190 (Site No. 20+21) After
connection 10,954
10,725 ~
11,275 - 46 - 0.42
Source : Prepared by the Study Team
Figure 4.6-1 Calculation Results of Distribution Line Voltage Flow Simulation
at Time of PV System Interconnection (Male’ Island, Feeder 2)
Feeder 3
10965
10970
10975
10980
10985
10990
10995
11000
11005
1 3 5 7 9 11
Segment
Voltage
[V
] Vroute1
Vroute2
Vbase1
Vbase2
Interconnection
Point PV Capacity
[kWp] Interconnection
Point Voltage [V]
StandardRange
[V]
Voltage Disparity [V]
Voltage Fluctuation Rate
[%] Before
connection 10,994 - 6 - 0.05 Segment 2 85
(Site No. 3) After connection 10,994 - 6 - 0.05
Before connection 10,988 - 12 - 0.11
Segment 5 85 (Site No. 6) After
connection 10,989
10,725 ~
11,275
- 11 - 0.10
Source : Prepared by the Study Team
Figure 4.6-2 Calculation Results of Distribution Line Voltage Flow Simulation
at Time of PV System Interconnection (Male’ Island, Feeder 3)
Feeder 2
10940
10950
10960
10970
10980
10990
11000
11010
1 3 5 7 9 11 13
Segment
Voltag
e [V] Vroute1
Vroute2
Vbase1
Vbase2
4-19
Feeder 4
10988
10990
10992
10994
10996
10998
11000
11002
1 3 5 7 9
Segment
Voltage
[V
] Vroute1
Vroute2
Vbase1
Vbase2
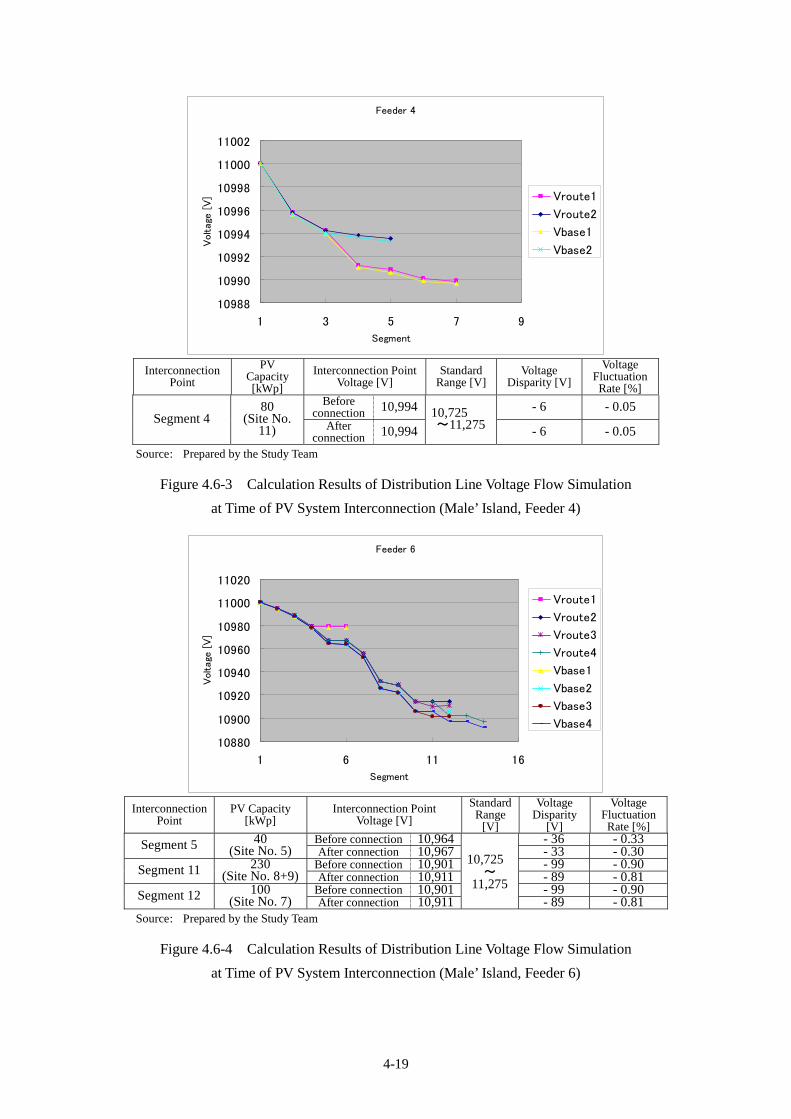
Interconnection
Point
PV Capacity [kWp]
Interconnection Point Voltage [V]
Standard Range [V]
Voltage Disparity [V]
Voltage Fluctuation Rate [%]
Before connection 10,994 - 6 - 0.05
Segment 4 80
(Site No. 11) After
connection 10,994
10,725 ~11,275 - 6 - 0.05
Source : Prepared by the Study Team
Figure 4.6-3 Calculation Results of Distribution Line Voltage Flow Simulation
at Time of PV System Interconnection (Male’ Island, Feeder 4)
Feeder 6
10880
10900
10920
10940
10960
10980
11000
11020
1 6 11 16
Segment
Voltage
[V
]
Vroute1
Vroute2
Vroute3
Vroute4
Vbase1
Vbase2
Vbase3
Vbase4
Interconnection
Point PV Capacity
[kWp] Interconnection Point
Voltage [V]
StandardRange
[V]
Voltage Disparity
[V]
Voltage Fluctuation Rate [%]
Before connection 10,964 - 36 - 0.33 Segment 5 40 (Site No. 5) After connection 10,967 - 33 - 0.30
Before connection 10,901 - 99 - 0.90 Segment 11 230 (Site No. 8+9) After connection 10,911 - 89 - 0.81
Before connection 10,901 - 99 - 0.90 Segment 12 100 (Site No. 7) After connection 10,911
10,725 ~
11,275- 89 - 0.81
Source : Prepared by the Study Team
Figure 4.6-4 Calculation Results of Distribution Line Voltage Flow Simulation
at Time of PV System Interconnection (Male’ Island, Feeder 6)

4-20
Feeder 7
10930
10940
10950
10960
10970
10980
10990
11000
11010
1 6 11 16
Segment
Voltage
[V
]V
Vbase
Interconnection
Point PV Capacity
[kWp] Interconnection Point
Voltage [V] Standard
Range [V]Voltage
Disparity [V]Voltage Fluctuation
Rate [%] Before
connection 10,979 - 21 - 0.19
Segment 2 10
(Site No. 17) After connection
10,979
10,725 ~11,275 - 21 - 0.19
Source : Prepared by the Study Team
Figure 4.6-5 Calculation Results of Distribution Line Voltage Flow Simulation
at Time of PV System Interconnection (Male’ Island, Feeder 7)
Feeder 8
109501095510960109651097010975109801098510990109951100011005
1 3 5 7 9 11 13
Segment
Voltage
[V
]
Vroute1
Vroute2
Vroute3
Vbase1
Vbase2
Vbase3
Interconnection
Point PV Capacity
[kWp] Interconnection Point
Voltage [V] Standard
Range [V]Voltage Disparity
[V]
Voltage Fluctuation Rate
[%] Before
connection10,956 - 44 - 0.40
Segment 10 20
(Site No. 22) After
connection 10,956
10,725 ~11,275 - 44 - 0.40
Source : Prepared by the Study Team
Figure 4.6-6 Calculation Results of Distribution Line Voltage Flow Simulation
at Time of PV System Interconnection (Male’ Island, Feeder 8)

4-21
Feeder 9
10970
10975
10980
10985
10990
10995
11000
11005
1 3 5 7 9 11 13
Segment
Voltage
[V
]V
Vbase
Interconnection
Point PV Capacity
[kWp] Interconnection Point
Voltage [V]
Standard Range [V]
Voltage Disparity
[V]
Voltage Fluctuation Rate [%]
Before connection 10,997 - 3 - 0.03
Segment 2 45 (Site No. 1) After
connection 10,997 - 3 - 0.03
Before connection 10,986 - 14 - 0.13
Segment 2 400 (Site No. 12) After
connection 10,987
10,725 ~11,275
- 13 - 0.12
Source : Prepared by the Study Team
Figure 4.6-7 Calculation Results of Distribution Line Voltage Flow Simulation
at Time of PV System Interconnection (Male’ Island, Feeder 9)
Feeder 2
10975
10980
10985
10990
10995
11000
11005
1 3 5 7 9 11
Segment
Voltage
[V
] Vroute1
Vroute2
Vbase1
Vbase2
Interconnection
Point PV Capacity
[kWp] Interconnection Point
Voltage [V]
Standard Range
[V]
Voltage Disparity
[V]
Voltage Fluctuation Rate
[%] Before
connection10,986 - 14 - 0.13
Segment 3 60
(Site No. 2) After connection 10,987
10,725 ~
11,275 - 13 - 0.12
Source : Prepared by the Study Team
Figure 4.6-8 Calculation Results of Distribution Line Voltage Flow Simulation
at Time of PV System Interconnection (Hulhumale’ Island, Feeder 2)
4-22
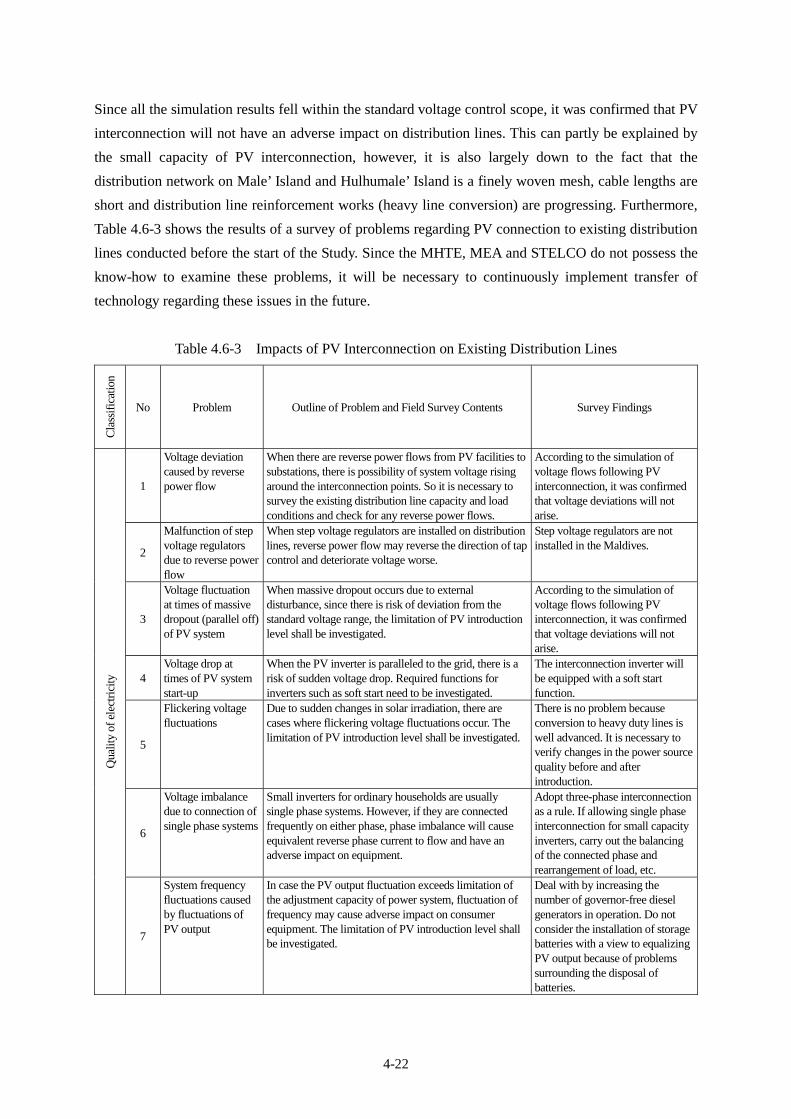
Since all the simulation results fell within the standard voltage control scope, it was confirmed that PV
interconnection will not have an adverse impact on distribution lines. This can partly be explained by
the small capacity of PV interconnection, however, it is also largely down to the fact that the
distribution network on Male’ Island and Hulhumale’ Island is a finely woven mesh, cable lengths are
short and distribution line reinforcement works (heavy line conversion) are progressing. Furthermore,
Table 4.6-3 shows the results of a survey of problems regarding PV connection to existing distribution
lines conducted before the start of the Study. Since the MHTE, MEA and STELCO do not possess the
know-how to examine these problems, it will be necessary to continuously implement transfer of
technology regarding these issues in the future.
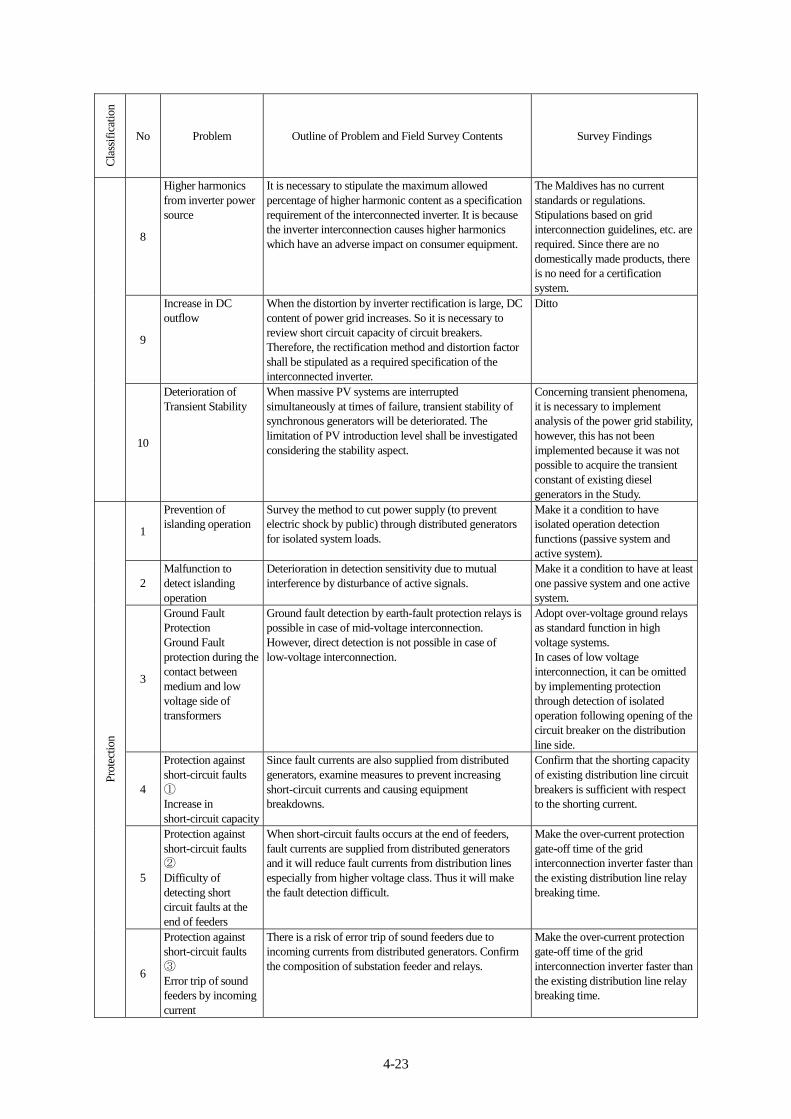
Table 4.6-3 Impacts of PV Interconnection on Existing Distribution Lines
Cla
ssif
icat
ion
No Problem Outline of Problem and Field Survey Contents Survey Findings
1
Voltage deviation caused by reverse power flow
When there are reverse power flows from PV facilities to substations, there is possibility of system voltage rising around the interconnection points. So it is necessary to survey the existing distribution line capacity and load conditions and check for any reverse power flows.
According to the simulation of voltage flows following PV interconnection, it was confirmed that voltage deviations will not arise.
2
Malfunction of step voltage regulators due to reverse power flow
When step voltage regulators are installed on distribution lines, reverse power flow may reverse the direction of tap control and deteriorate voltage worse.
Step voltage regulators are not installed in the Maldives.
3
Voltage fluctuation at times of massive dropout (parallel off) of PV system
When massive dropout occurs due to external disturbance, since there is risk of deviation from the standard voltage range, the limitation of PV introduction level shall be investigated.
According to the simulation of voltage flows following PV interconnection, it was confirmed that voltage deviations will not arise.
4 Voltage drop at times of PV system start-up
When the PV inverter is paralleled to the grid, there is a risk of sudden voltage drop. Required functions for inverters such as soft start need to be investigated.
The interconnection inverter will be equipped with a soft start function.
5
Flickering voltage fluctuations
Due to sudden changes in solar irradiation, there are cases where flickering voltage fluctuations occur. The limitation of PV introduction level shall be investigated.
There is no problem because conversion to heavy duty lines is well advanced. It is necessary to verify changes in the power source quality before and after introduction.
6
Voltage imbalance due to connection of single phase systems
Small inverters for ordinary households are usually single phase systems. However, if they are connected frequently on either phase, phase imbalance will cause equivalent reverse phase current to flow and have an adverse impact on equipment.
Adopt three-phase interconnection as a rule. If allowing single phase interconnection for small capacity inverters, carry out the balancing of the connected phase and rearrangement of load, etc.
Qua
lity
of e
lect
rici
ty
7
System frequency fluctuations caused by fluctuations of PV output
In case the PV output fluctuation exceeds limitation of the adjustment capacity of power system, fluctuation of frequency may cause adverse impact on consumer equipment. The limitation of PV introduction level shall be investigated.
Deal with by increasing the number of governor-free diesel generators in operation. Do not consider the installation of storage batteries with a view to equalizing PV output because of problems surrounding the disposal of batteries.
4-23
Cla
ssif
icat
ion
No Problem Outline of Problem and Field Survey Contents Survey Findings
8
Higher harmonics from inverter power source
It is necessary to stipulate the maximum allowed percentage of higher harmonic content as a specification requirement of the interconnected inverter. It is because the inverter interconnection causes higher harmonics which have an adverse impact on consumer equipment.
The Maldives has no current standards or regulations. Stipulations based on grid interconnection guidelines, etc. are required. Since there are no domestically made products, there is no need for a certification system.
9
Increase in DC outflow
When the distortion by inverter rectification is large, DC content of power grid increases. So it is necessary to review short circuit capacity of circuit breakers. Therefore, the rectification method and distortion factor shall be stipulated as a required specification of the interconnected inverter.
Ditto
10
Deterioration of Transient Stability
When massive PV systems are interrupted simultaneously at times of failure, transient stability of synchronous generators will be deteriorated. The limitation of PV introduction level shall be investigated considering the stability aspect.
Concerning transient phenomena, it is necessary to implement analysis of the power grid stability, however, this has not been implemented because it was not possible to acquire the transient constant of existing diesel generators in the Study.
1
Prevention of islanding operation
Survey the method to cut power supply (to prevent electric shock by public) through distributed generators for isolated system loads.
Make it a condition to have isolated operation detection functions (passive system and active system).
2 Malfunction to detect islanding operation
Deterioration in detection sensitivity due to mutual interference by disturbance of active signals.
Make it a condition to have at least one passive system and one active system.
3
Ground Fault Protection Ground Fault protection during the contact between medium and low voltage side of transformers
Ground fault detection by earth-fault protection relays is possible in case of mid-voltage interconnection. However, direct detection is not possible in case of low-voltage interconnection.
Adopt over-voltage ground relays as standard function in high voltage systems. In cases of low voltage interconnection, it can be omitted by implementing protection through detection of isolated operation following opening of the circuit breaker on the distribution line side.
4
Protection against short-circuit faults ① Increase in short-circuit capacity
Since fault currents are also supplied from distributed generators, examine measures to prevent increasing short-circuit currents and causing equipment breakdowns.
Confirm that the shorting capacity of existing distribution line circuit breakers is sufficient with respect to the shorting current.
5
Protection against short-circuit faults ② Difficulty of detecting short circuit faults at the end of feeders
When short-circuit faults occurs at the end of feeders, fault currents are supplied from distributed generators and it will reduce fault currents from distribution lines especially from higher voltage class. Thus it will make the fault detection difficult.
Make the over-current protection gate-off time of the grid interconnection inverter faster than the existing distribution line relay breaking time.
Prot
ectio
n
6
Protection against short-circuit faults ③ Error trip of sound feeders by incoming current
There is a risk of error trip of sound feeders due to incoming currents from distributed generators. Confirm the composition of substation feeder and relays.
Make the over-current protection gate-off time of the grid interconnection inverter faster than the existing distribution line relay breaking time.

4-24
Cla
ssif
icat
ion
No Problem Outline of Problem and Field Survey Contents Survey Findings
1
Malfunction of automatic power restoration in case of faults
Overload and voltage deviation may occur in distribution lines in case distribution automation system (or SCADA) is equipped with automatic power restoration system.
There is no automatic power switchover function in the event of failures.
2
Malfunction of automatic feeder reclose
In case that distribution feeder has automatic reclose, there is a possibility of mismatch of time setting between it and re-interconnection of distributed generators. It is necessary to investigate the measures against this issue.
There is no automatic feeder reclose. It is necessary to equip a condition of receiving voltage confirmation for the restart.
3
Overload of distribution equipment by switching of distribution lines
Since output of distributed generators cannot be monitored and power flows cannot be predicted, overload of distribution lines may occur after switching operation. It is necessary to confirm the switching operation and monitoring and control of the power distribution company.
Examine installation of monitoring devices that can monitor PV output. - It is necessary to review the demand management method that takes PV output into account. O
pera
tion
Man
agem
ent
4
Difficulty in switching over without interruption
Imbalance of the interconnection capacity of distributed generators causes the phase angle of loop points to increase, and dropout of inverter may occur due to increase in cross current flows and growing change in voltage phase. This problem occurs when the capacity of PV systems is very large.
All loop change-over is conducted as power outage switchover.
Source : Prepared by the Study Team
4.7 Grid-Connected PV System Stability Assessment Technique
In order to assess the stability of the grid-connected PV system, power source quality of existing
distribution lines was measured using the measuring instruments shown in Table 4.7-1. Out of the
potential sites, the national stadium, which has the largest potential grid-connected PV capacity, was
selected. The measurement results are indicated below.
Table 4.7-1 Specifications of Measuring Instruments
Device Power supply quality analyzer Manufacturer Hioki E.E. Corporation Model 3196 Measurement line Single phase 2 wires, single phase 3 wires, 3-phase 3 wires, 3-phase 4 wires
Voltage range CH1 – 3 : AC 150/300/600V CH4 : AC 60/150/300/600V, DC ±60/600V peak
Current range Uses a clamp onset 9661 AC 50/500A
Measurement system
Transient over-voltage: 2MS/s High frequency: 2048 points (at times of 10cycle/50Hz, 12cycle/60Hz) Other effective value: 256 points/cycle
Measurement functions
1. Transient over-voltage 2. Voltage swell, voltage dip, voltage instantaneous stop 3. Frequency, voltage, current, voltage-current peak; active, reactive and apparent power, power
factor or displacement power factor 4. Voltage imbalance ratio, current imbalance ratio 5. High frequency voltage, current and power, inter-harmonics voltage and current, high frequency
voltage and current phase difference, K factor, general high frequency voltage and current distortion factor, general inter-harmonics voltage and current distortion factor
6. ΔV10 flicker or IEC flicker [Pst, Plt] 7. EN50160
Source : Prepared by the Study Team
4-25
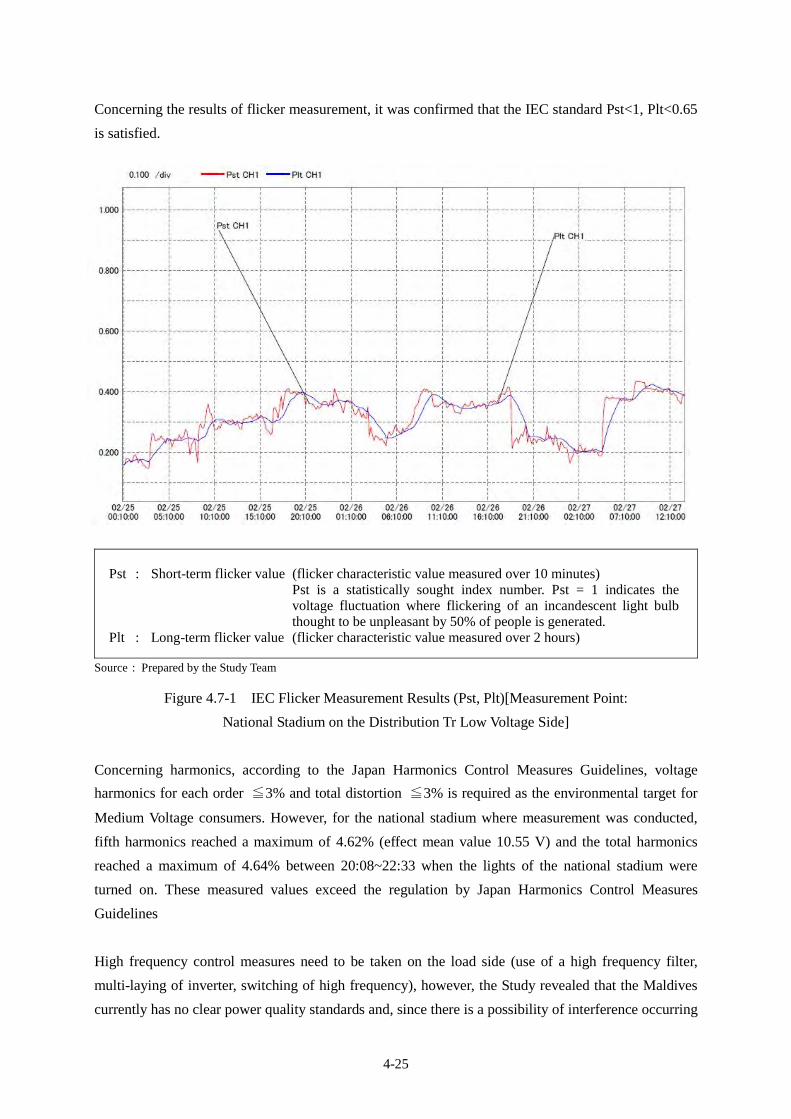
Concerning the results of flicker measurement, it was confirmed that the IEC standard Pst<1, Plt<0.65
is satisfied.
Pst : Short-term flicker value (flicker characteristic value measured over 10 minutes) Pst is a statistically sought index number. Pst = 1 indicates the
voltage fluctuation where flickering of an incandescent light bulb thought to be unpleasant by 50% of people is generated.
Plt : Long-term flicker value (flicker characteristic value measured over 2 hours)
Source : Prepared by the Study Team
Figure 4.7-1 IEC Flicker Measurement Results (Pst, Plt)[Measurement Point:
National Stadium on the Distribution Tr Low Voltage Side]
Concerning harmonics, according to the Japan Harmonics Control Measures Guidelines, voltage
harmonics for each order ≦3% and total distortion ≦3% is required as the environmental target for
Medium Voltage consumers. However, for the national stadium where measurement was conducted,
fifth harmonics reached a maximum of 4.62% (effect mean value 10.55 V) and the total harmonics
reached a maximum of 4.64% between 20:08~22:33 when the lights of the national stadium were
turned on. These measured values exceed the regulation by Japan Harmonics Control Measures
Guidelines
High frequency control measures need to be taken on the load side (use of a high frequency filter,
multi-laying of inverter, switching of high frequency), however, the Study revealed that the Maldives
currently has no clear power quality standards and, since there is a possibility of interference occurring

4-26
in capacitors and other power instruments, it will be necessary to examine standards and regulations in
future.
Accordingly, the grid interconnection converter will need to have specifications that conform to
Japanese high frequency control guidelines.
Source : Prepared by the Study Team
Figure 4.7-2 Results of High Frequency Voltage Distortion Measurement [Measurement Point:
National Stadium on the Distribution Tr Low Voltage Side]
Concerning the frequency fluctuation, this is held to an extremely precise range of 49.96~50.06Hz
and 50Hz±0.1%, and there is a low possibility of stoppages being caused by the detection of frequency
fluctuations in the PV interconnection inverter.
%

4-27
Source : Prepared by the Study Team
Figure 4.7-3 Results of Frequency Fluctuation Measurement
[Measurement Point: National Stadium on the Distribution Tr Low Voltage Side]
Concerning voltage fluctuation, there is some voltage drop when the stadium lights are turned on,
however, the fluctuation scope is 228.3~234.1V, which falls within the nominal voltage range of
230±2% (the STELCO standard is±2.5% of nominal voltage). Therefore, there is no problem
regarding PV interconnection in this respect too.

4-28
Source : Prepared by the Study Team
Figure 4.7-4 Voltage Fluctuation Measurement Results
[Measurement Point: National Stadium on the Distribution Tr Low Voltage Side]

4-29
Also, it was surveyed whether or not PV operation information (DC voltage and current, AC voltage,
current and frequency, active power, reactive power, solar irradiation intensity, etc.) can be
incorporated into the SCADA system with a view to monitoring the operating status and assessing
stability of the grid-connected PV system.
The SCADA system currently enables 40 out of 98 substations and seven diesel power plants on Male’
Island to be remotely monitored and controlled by wireless, and the PLC (Programmable Logic
Controller) has almost reached full capacity. Since it will be difficult to install a new monitoring
station, it is desirable to install data loggers, etc. that can monitor and record the operating condition of
the PV systems at all times.
4.8 Technique for Determining the Introduced Capacity of Grid-Connected PV
Systems
As the technique for determining the grid-connected PV system capacity that can be technically
introduced in the Maldives, it is necessary to examine and decide the possible capacity by means of
the following two steps: Step 1: examination of constraints from the viewpoint of power system
operation, and Step 2: examination of constraints from the viewpoint of distribution line operation.
The results of examination in each step are as shown below.
[Step 1] Examination of constraints from the viewpoint of power system operation
Based on the results of assessing load responsiveness of diesel generators as described in 4.5, the
available fluctuation of diesel generators with governor-free operation is as follows by utilizing
2009 case on Male’ Island .
41.96MW * ( 1.0% / 4.0% ) = approximately 16.78MW
Here, the frequency control standard of STELCO is 50Hz±1.0% and, since the governor speed
adjustment rate is 4%.
PV output fluctuation (kW) + Demand fluctuation (kW) available fluctuation of diesel generators with governor-free operation (kW)
From the above expression, assuming the demand fluctuation is around 7% of peak load based on
STELCO operating performance, the available PV output fluctuation is as follows..
The available PV output fluctuation 16.78MW - 10.94MW = 5.84MW
Here, assuming that the fluctuation range of PV output is between 10~90% of rated output based on past

4-30
cases, the potential grid-connected PV introduction capacity on Male’ Island in 2009 is approximately
7.3MW. And in the same way, the potential grid-connected PV introduction capacity on Male’ Island
and Hulhumale’ Island up to 2020 can be calculated as shown in the following figure.
Source : Prepared by the Study Team
Figure 4.8-1 Possible PV Capacity on Male' Island
Source : Prepared by the Study Team
Figure 4.8-2 Possible PV Capacity on Hulhumale' Island
41.96
65.96
73.96
67.96 67.96 67.96 67.96 67.96 67.96 67.96 67.96 67.96
7.3
12.1 14.4 14.2 14.0 13.8 13.6 13.4 13.2 13.0 12.8 12.6
0
10
20
30
40
50
60
70
80
2009 2010 2011 2012 2013 2014 2015 2016 2017 2018 2019 2020
Cap
acity
/P
eak
Dem
and
[MW
]
Year
Total Rated Capacity [MW]
Governor Free Capacty [MW]
Ppssible PV Capacity [MWp]
Peak Demand [MW]
4.0 4.0 4.0 4.0 4.0 4.0 4.0 4.0 4.0 4.0 4.0 4.0
1.13 1.12 1.11 1.09 1.08 1.06 1.04 1.01 0.99 0.96 0.93 0.89
0
0.5
1
1.5
2
2.5
3
3.5
4
4.5
2009 2010 2011 2012 2013 2014 2015 2016 2017 2018 2019 2020
Cap
acity
/ P
eak
Dem
and
[MW
]
Year
Total Rated Capacity [MW]
Governor Free Capacty [MW]
Possible PV Capacity [MWp]
Peak Demand [MW]
4-31
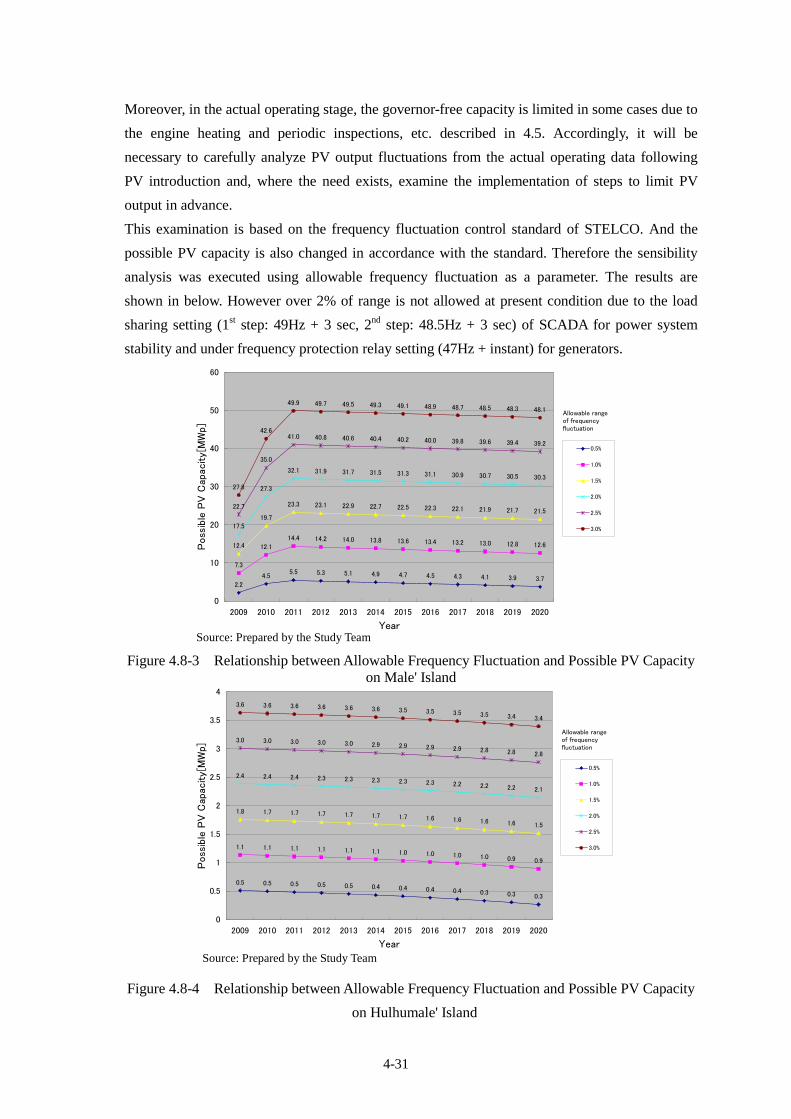
Moreover, in the actual operating stage, the governor-free capacity is limited in some cases due to
the engine heating and periodic inspections, etc. described in 4.5. Accordingly, it will be
necessary to carefully analyze PV output fluctuations from the actual operating data following
PV introduction and, where the need exists, examine the implementation of steps to limit PV
output in advance.
This examination is based on the frequency fluctuation control standard of STELCO. And the
possible PV capacity is also changed in accordance with the standard. Therefore the sensibility
analysis was executed using allowable frequency fluctuation as a parameter. The results are
shown in below. However over 2% of range is not allowed at present condition due to the load
sharing setting (1st step: 49Hz + 3 sec, 2nd step: 48.5Hz + 3 sec) of SCADA for power system
stability and under frequency protection relay setting (47Hz + instant) for generators.
Source: Prepared by the Study Team
Figure 4.8-3 Relationship between Allowable Frequency Fluctuation and Possible PV Capacity on Male' Island
Source: Prepared by the Study Team
Figure 4.8-4 Relationship between Allowable Frequency Fluctuation and Possible PV Capacity
on Hulhumale' Island
2.2
4.55.5 5.3 5.1 4.9 4.7 4.5 4.3 4.1 3.9 3.7
7.3
12.1
14.4 14.2 14.0 13.8 13.6 13.4 13.2 13.0 12.8 12.612.4
19.7
23.3 23.1 22.9 22.7 22.5 22.3 22.1 21.9 21.7 21.5
17.5
27.3
32.1 31.9 31.7 31.5 31.3 31.1 30.9 30.7 30.5 30.3
22.7
35.0
41.0 40.8 40.6 40.4 40.2 40.0 39.8 39.6 39.4 39.2
27.8
42.6
49.9 49.7 49.5 49.3 49.1 48.9 48.7 48.5 48.3 48.1
0
10
20
30
40
50
60
2009 2010 2011 2012 2013 2014 2015 2016 2017 2018 2019 2020
Year
Poss
ible
PV
Cap
acity[
MW
p]
0.5%
1.0%
1.5%
2.0%
2.5%
3.0%
Allowable rangeof frequencyfluctuation
0.5 0.5 0.5 0.5 0.5 0.4 0.4 0.4 0.4 0.3 0.3 0.3
1.1 1.1 1.1 1.1 1.1 1.1 1.0 1.0 1.0 1.0 0.9 0.9
1.8 1.7 1.7 1.7 1.7 1.7 1.7 1.6 1.6 1.6 1.6 1.5
2.4 2.4 2.4 2.3 2.3 2.3 2.3 2.3 2.2 2.2 2.2 2.1
3.0 3.0 3.0 3.0 3.0 2.9 2.9 2.9 2.9 2.8 2.8 2.8
3.6 3.6 3.6 3.6 3.6 3.6 3.5 3.5 3.5 3.5 3.4 3.4
0
0.5
1
1.5
2
2.5
3
3.5
4
2009 2010 2011 2012 2013 2014 2015 2016 2017 2018 2019 2020
Year
Poss
ible
PV
Cap
acity[
MW
p]
0.5%
1.0%
1.5%
2.0%
2.5%
3.0%
Allowable rangeof frequencyfluctuation

4-32
[Step 2] Examination of constraints from the viewpoint of distribution line operation
In the simulated calculation of voltage flow used in the examination described in 4.6, the PV
interconnection capacity reaching the upper limit of the distribution line voltage control value
was calculated under the harshest conditions of decoupling all load from each distribution line.
As a result of the simulation, it was found that the rise in distribution line voltage was within the
control standard even when PV energy was connected to the upper capacity limit of each
distribution line. This can be explained by the fact that distribution lines are short in length
(because of the small size of the island) and they have mostly been converted to heavy lines.
From the results of examination, the limitations on distribution line operation are found to be as
follows: on Male’ Island, 5,330 kW on each distribution line and 42,640 kW over the entire
distribution line network; and on Hulhumale’ Island, 3,040 kW on each distribution line and
6,080 kW over the entire network.
Table 4.8-1 Examination Results regarding PV Connection Capacity to Distribution Lines
(Male’ Island)
Feeder No. PV Connection Capacity [kW]
Peak Voltage [V] Voltage Rise [V] Fluctuation Rate [%]
FD2 5,330 11,083 83 0.75 FD3 5,330 11,070 70 0.64 FD4 5,330 11,028 28 0.25 FD5 5,330 11,096 96 0.87 FD6 5,330 11,225 225 2.05 FD7 5,330 11,118 118 1.07 FD8 5,330 11,109 109 0.99 FD9 5,330 11,089 89 0.81 Total 42,640 - - -
Source : Prepared by the Study Team
Table 4.8-2 Examination Results regarding PV Connection Capacity to Distribution Lines
(Hulhumale’ Island)
Feeder No. PV Connection Capacity [kW]
Peak Voltage [V] Voltage Rise [V] Fluctuation Rate [%]
FD1 3,040 11,139 139 1.26 FD2 3,040 11,104 104 0.95 Total 6,080 - - -
Source : Prepared by the Study Team
From the above examination, it was concluded that values limited from the viewpoint of power
system operation should be applied as the potential grid-connected PV capacity on Male’ Island
and Hulhumale’ Island.
Moreover, regarding constraints in terms of the possible installation space, when the above
examination results are converted into installation area, the possible installation capacity by 2020

4-33
on Male’ Island (12.6 MW) requires space of approximately 90,000 m2, while the possible
capacity on Hulhumale’ Island (0.89 MW) requires approximately 6,000 m2. Since these areas
account for 6.0% of total island area excluding streets, parks and cemeteries on Male’ Island (1.5
km2), there should be no problem whatsoever.
As for Hulhumale’ Island, developing standard housings has approximately 750 m2 of roof top
areas. Therefore roof top areas of eight housing are almost equal to required areas for PV
installation on Holhumale’ Island.
Based on the results of this examination and the economic and financial feasibility study (refer to
Chapter 5), the target grid-connected PV installation capacity by 2020 is set as follows.
Table 4.8-3 Target Grid-Connected PV Installation Capacity on Male’ Island and Hulhumale’ Island
(kW)
Source : Prepared by the Study Team
4.9 Standard Design Specifications of the Grid-Connected PV System
Taking into consideration the technical requirements examined in the Study and meteorological
conditions and building strengths in the Maldives, the design standard specifications required of the
grid-connected PV system are as indicated in the following table.
Table 4.9-1 Standard Design Specifications of the Grid-Connected PV System
Equipment Item Required Specifications (1) Applicable standard IEC and equivalent standard (2) Environment of use Area prone to salt damage (3) Ambient temperature Up to +40℃ (4) Installation method Sloping roof type or flat roof type (5) Type Crystal silicon (6) Module efficiency No less than 12%
PV module
(7) Module capacity No less than 100W/sheet (1) Support mode Sloping roof type: attached to main buildings
Flat roof type: S stand (2) Environment of use Area prone to salt damage (3) Material SS400 hot-dip zinc finish or equivalent quality
PV module installation stand
(4) Design standard wind velocity
15m above ground, wind velocity 60m/s
(1) Structure Indoor/Outdoor, wall-hanging type or vertical self-supporting type
(2) Environment of use Area prone to salt damage (excluding indoor types)
(3) Ambient temperature and humidity
Up to +40℃, no less than 70%
Connection box
(4) Peak input voltage No less than the string unit nominal open voltage (VOC)
Year 2011 2012 2013 2014 2015 2016 2017 2018 2019 2020Male' Island 280 560 840 1,120 1,400 1,680 1,960 2,240 2,520 2,800
Hulhumale' Island 20 40 60 80 100 120 140 160 180 200

4-34
Equipment Item Required Specifications (5) Number of input circuits No less than the sub-array unit number of lines (6) Input current No less than the module nominal shorting
current (ISC) per circuit (7) Number of output
circuits 1 circuit
(8) Output current No less than the sub-array nominal shorting current (ISC)
(9) In-built instruments - Distribution line circuit breaker: Number of circuits
- Backflow prevention diode: Each string - Induction lightning protector: All
input/output circuits, between lines, between ground
(1) Structure Indoor/Outdoor, wall-hanging type or vertical self-supporting type
(2) Environment of use Area prone to salt damage (excluding indoor types)
(3) Ambient temperature and humidity
Up to +40℃, no less than 70%
(4) Peak input voltage No less than the string unit nominal open voltage (VOC)
(5) Number of input circuits No less than the number of integrated connection boxes
(6) Input current No less than the connection box output current (7) Number of output
circuits 1 circuit
(8) Output current No less than the sub-array nominal shorting current x number of input circuits
Collecting box * This may be omitted if
there is one connection box or the number of power conditioners input circuits exceeds the number of connection boxes.
(9) In-built instruments - Distribution line circuit breaker: Number of circuits
- Induction lightning protector: All input/output circuits, between lines, between ground
(1) Structure Indoor/Outdoor, vertical self-supporting type (2) Environment of use Area prone to salt damage (excluding indoor
types) (3) Ambient temperature
and humidity Up to +40℃, no less than 70%
(4) Main circuit type Self-exciting voltage type (5) Switching method High frequency PWM (6) Insulation method Commercial frequency insulated transformer
type Non-insulation (no transformer) only allowed in cases of small capacity
(7) Cooling method Forced air cooling (8) Rated input voltage Around the string peak output voltage (Vpmax) (9) Input operating voltage
range The string peak output voltage (Vpmax) and nominal open voltage (Voc) must be in the range.
(10) Number of input circuits No less than the number of collection boxes (11) Output electricity mode 3φ3W (12) Rated output voltage AC202V (13) Rated frequency 50Hz (14) AC output current
distortion factor No more than 5% of total current and 3% of each harmonic
(15) Power control method Peak output follow-up control
Power conditioners
(16) Rated power conversion No less than 90%

4-35
Equipment Item Required Specifications efficiency
(17) Control function - Automatic start/stop, soft start - Automatic voltage adjustment - Condensive reactive power control or output
control function (only when there is risk of voltage deviations with reverse flow)
(18) Grid connection protective function
- Over-voltage (OVR) - Under-voltage (UVR) - Frequency rise (OFR) - Frequency drop (UFR) - Over-voltage ground (OVGR) (can be omitted
in case of low voltage interconnection) - Automatic reclose in case of recover from
blackout (with a condition of receiving voltage confirmation)
All settings and times shall be adjustable.
(19) Isolated operation detection function
- Active type (1 or more of the following methods): ① Frequency shift type ② Active power fluctuation type ③ Reactive power fluctuation type ④ Load fluctuation type
- Passive type (1 or more of the following methods) ① Power phase jump detection type ② 3rd harmonic voltage rise detection type ③ Frequency change rate detection type
(1) Structure Indoor/Outdoor, vertical self-supporting type (2) Environment of use Area prone to salt damage (excluding indoor
types) (3) Ambient temperature
and humidity + Up to +40℃, no less than 70%
(4) Primary voltage 3φ4W AC400V (5) Secondary voltage 3φ3W AC200V (6) Frequency 50Hz (7) Insulation class Type B
Interconnection transformer
(8) Wire connection method Y- (Yd1) Source : Prepared by the Study Team
4.10 Potential Sites for Grid-Connected PV System Installation, and PV Installation
Capacity
Concerning the potential sites selected in 4.4, field surveys were implemented on such items as the
possible PV installation area, existing power receiving facilities and surrounding environment, etc.
Concerning the PV installation capacity, the ideal array method was calculated upon considering the
possible installation area and impact of obstructions to solar irradiation discussed in 4.3.
Tables 4.10-1 and 4.10-2 show the results of examining the PV array method, while the results of
examination on PV installed capacity are as indicated in the comparison sheet of potential sites for PV
installation as the start of this report.

4-36
Table 4.10-1 Results of PV Array Examination at Potential Sites on Male’ Island
No. Site PV Installation Site
1 STELCO Building
3 Dharubaaruge
5 Giyaasudheen School
6 Kalaafaanu School
7 Maldives Center for Social Education
South school building
North school building32.5
30
22.5
17.5
17.5 17.5
7.5 7.5
7.5 7.5
17.5
22.5
22.5
12.5
72.5
40

4-37
No. Site PV Installation Site
8 Thaajuddeen School
9 New Secondary School for Girls
11 Faculty of Engineering
12 National Stadium
17 Faculty of Education
10
80
120
80
120
10
20
40
10
Central building
Gymnasium
27.5
55
17.5
45
50 15
20

4-38
No. Site PV Installation Site
19 Male’ South West Harbour Parking
20 Grand Friday Mosque
21 Jumhooree Maidhaan
22 President’s Office
10
10
Table 4.10-2 Results of PV Array Examination at Potential Sites on Hulhumale’ Island
No. Site PV Installation Site
2 Hospital
80 * 2 = 160
10 * 3 = 40
40
30
30 20
10
10
20 20
4-39
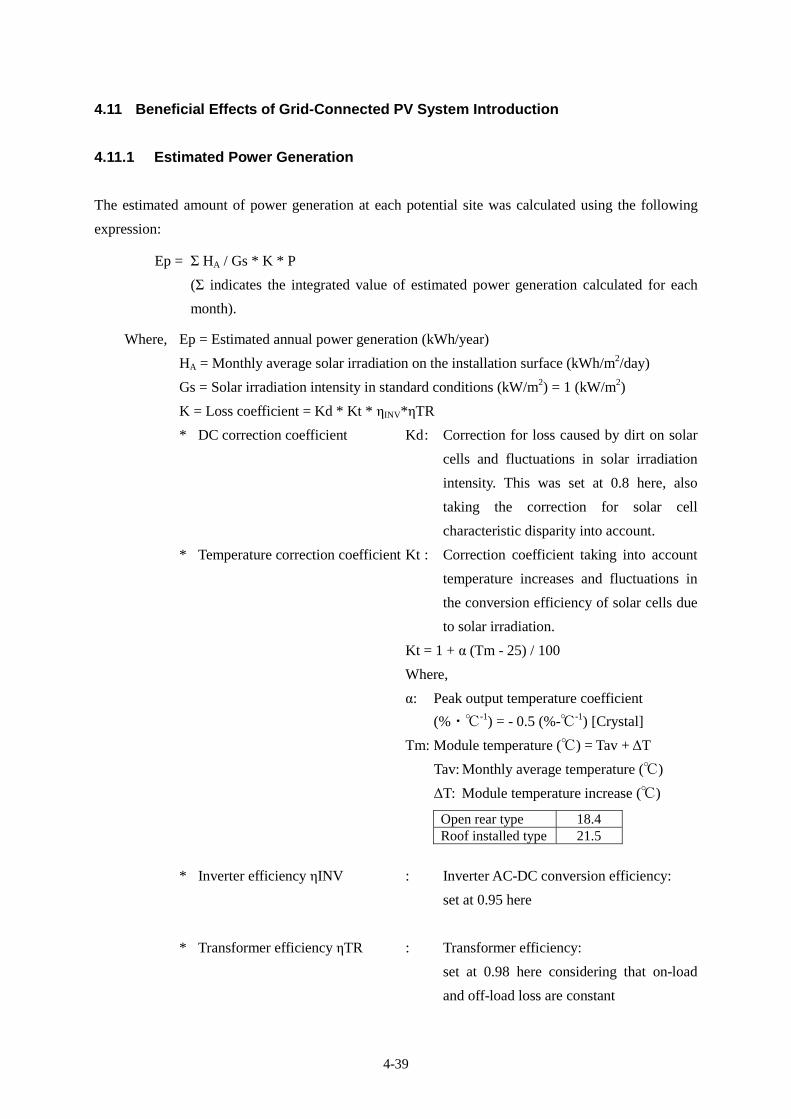
4.11 Beneficial Effects of Grid-Connected PV System Introduction
4.11.1 Estimated Power Generation
The estimated amount of power generation at each potential site was calculated using the following
expression:
Ep = Σ HA / Gs * K * P
(Σ indicates the integrated value of estimated power generation calculated for each
month).
Where, Ep = Estimated annual power generation (kWh/year)
HA = Monthly average solar irradiation on the installation surface (kWh/m2/day)
Gs = Solar irradiation intensity in standard conditions (kW/m2) = 1 (kW/m2)
K = Loss coefficient = Kd * Kt * ηINV*ηTR
* DC correction coefficient Kd : Correction for loss caused by dirt on solar
cells and fluctuations in solar irradiation
intensity. This was set at 0.8 here, also
taking the correction for solar cell
characteristic disparity into account.
* Temperature correction coefficient Kt : Correction coefficient taking into account
temperature increases and fluctuations in
the conversion efficiency of solar cells due
to solar irradiation.
Kt = 1 + α (Tm - 25) / 100
Where,
α: Peak output temperature coefficient
(%・℃-1) = - 0.5 (%-℃-1) [Crystal]
Tm: Module temperature (℃) = Tav + ΔT
Tav: Monthly average temperature (℃)
ΔT: Module temperature increase (℃)
Open rear type 18.4 Roof installed type 21.5
* Inverter efficiency ηINV : Inverter AC-DC conversion efficiency:
set at 0.95 here
* Transformer efficiency ηTR : Transformer efficiency:
set at 0.98 here considering that on-load
and off-load loss are constant
4-40
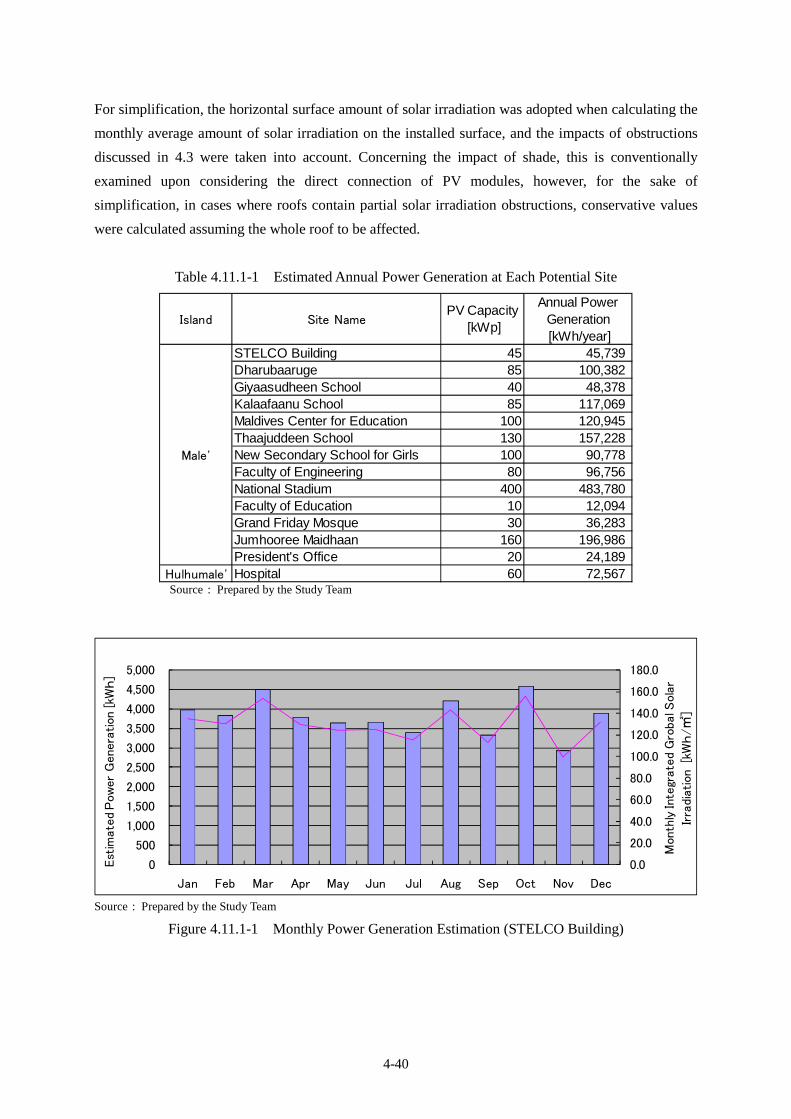
For simplification, the horizontal surface amount of solar irradiation was adopted when calculating the
monthly average amount of solar irradiation on the installed surface, and the impacts of obstructions
discussed in 4.3 were taken into account. Concerning the impact of shade, this is conventionally
examined upon considering the direct connection of PV modules, however, for the sake of
simplification, in cases where roofs contain partial solar irradiation obstructions, conservative values
were calculated assuming the whole roof to be affected.
Table 4.11.1-1 Estimated Annual Power Generation at Each Potential Site
Source : Prepared by the Study Team
Source : Prepared by the Study Team
Figure 4.11.1-1 Monthly Power Generation Estimation (STELCO Building)
Island Site NamePV Capacity
[kWp]
Annual PowerGeneration [kWh/year]
STELCO Building 45 45,739Dharubaaruge 85 100,382Giyaasudheen School 40 48,378Kalaafaanu School 85 117,069Maldives Center for Education 100 120,945Thaajuddeen School 130 157,228New Secondary School for Girls 100 90,778Faculty of Engineering 80 96,756National Stadium 400 483,780Faculty of Education 10 12,094Grand Friday Mosque 30 36,283Jumhooree Maidhaan 160 196,986President's Office 20 24,189
Hulhumale' Hospital 60 72,567
Male'
0.0
20.0
40.0
60.0
80.0
100.0
120.0
140.0
160.0
180.0
0
500
1,000
1,500
2,000
2,500
3,000
3,500
4,000
4,500
5,000
Jan Feb Mar Apr May Jun Jul Aug Sep Oct Nov Dec
Mon
thly
Inte
grate
d G
roba
l Sola
r
Irra
diation
[kW
h/㎡
]
Est
imate
d P
ow
er G
ene
ration
[kW
h]

4-41
Source : Prepared by the Study Team
Figure 4.11.1-2 Monthly Power Generation Estimation (Dharubaaruge)
Source : Prepared by the Study Team
Figure 4.11.1-3 Monthly Power Generation Estimation (Giyaasudheen School)
Source : Prepared by the Study Team
Figure 4.11.1-4 Monthly Power Generation Estimation (Kalaafaanu School)
0.0
20.0
40.0
60.0
80.0
100.0
120.0
140.0
160.0
180.0
200.0
0
2,000
4,000
6,000
8,000
10,000
12,000
Jan Feb Mar Apr May Jun Jul Aug Sep Oct Nov Dec
Mon
thly
Inte
grate
d G
roba
l Sola
r
Irra
dia
tion
[kW
h/㎡
]
Est
imate
d P
ow
er G
ene
ration
[kW
h]
0.0
20.0
40.0
60.0
80.0
100.0
120.0
140.0
160.0
180.0
200.0
0
1,000
2,000
3,000
4,000
5,000
6,000
Jan Feb Mar Apr May Jun Jul Aug Sep Oct Nov Dec
Mont
hly
Inte
grate
d G
roba
l Sola
r
Irra
diation [k
Wh
/㎡
]
Est
imate
d P
ow
er
Gener
ation
[kW
h]
0.0
20.0
40.0
60.0
80.0
100.0
120.0
140.0
160.0
180.0
200.0
0
2,000
4,000
6,000
8,000
10,000
12,000
14,000
Jan Feb Mar Apr May Jun Jul Aug Sep Oct Nov Dec
Mont
hly
Inte
grate
d G
roba
l Sola
r
Irra
diation [k
Wh
/㎡
]
Est
imate
d P
ow
er
Gener
ation
[kW
h]
4-42
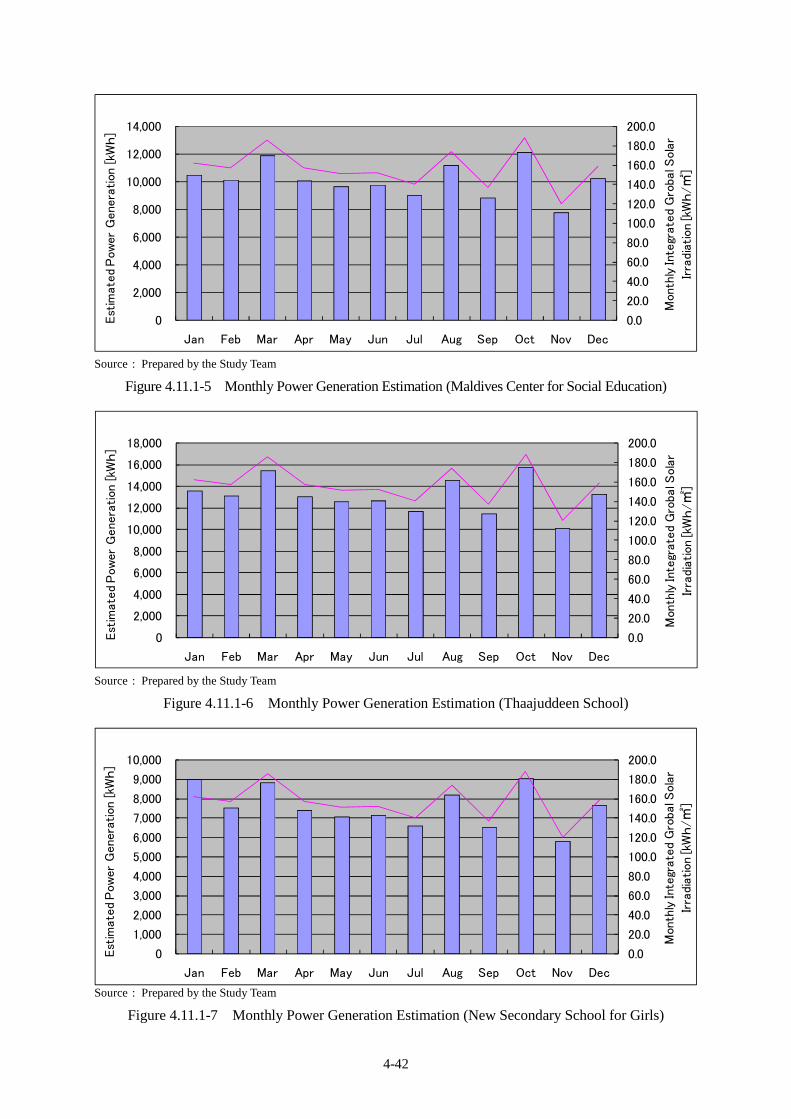
Source : Prepared by the Study Team
Figure 4.11.1-5 Monthly Power Generation Estimation (Maldives Center for Social Education)
Source : Prepared by the Study Team
Figure 4.11.1-6 Monthly Power Generation Estimation (Thaajuddeen School)
0.0
20.0
40.0
60.0
80.0
100.0
120.0
140.0
160.0
180.0
200.0
0
1,000
2,000
3,000
4,000
5,000
6,000
7,000
8,000
9,000
10,000
Jan Feb Mar Apr May Jun Jul Aug Sep Oct Nov Dec
Mon
thly
Inte
grate
d G
roba
l Sola
r
Irra
dia
tion
[kW
h/㎡
]
Est
imate
d P
ow
er G
ene
ration
[kW
h]
Source : Prepared by the Study Team
Figure 4.11.1-7 Monthly Power Generation Estimation (New Secondary School for Girls)
0.0
20.0
40.0
60.0
80.0
100.0
120.0
140.0
160.0
180.0
200.0
0
2,000
4,000
6,000
8,000
10,000
12,000
14,000
Jan Feb Mar Apr May Jun Jul Aug Sep Oct Nov Dec
Mon
thly
Inte
grate
d G
roba
l Sola
r
Irra
dia
tion
[kW
h/㎡
]
Est
imate
d P
ow
er G
ene
ration
[kW
h]
0.0
20.0
40.0
60.0
80.0
100.0
120.0
140.0
160.0
180.0
200.0
0
2,000
4,000
6,000
8,000
10,000
12,000
14,000
16,000
18,000
Jan Feb Mar Apr May Jun Jul Aug Sep Oct Nov DecM
onth
ly In
tegr
ate
d G
roba
l Sola
r
Irra
dia
tion
[kW
h/㎡
]
Est
imate
d P
ow
er G
ene
ration
[kW
h]

4-43
0.0
20.0
40.0
60.0
80.0
100.0
120.0
140.0
160.0
180.0
200.0
0
2,000
4,000
6,000
8,000
10,000
12,000
Jan Feb Mar Apr May Jun Jul Aug Sep Oct Nov Dec
Mon
thly
Inte
grate
d G
roba
l Sola
r
Irra
dia
tion
[kW
h/㎡
]
Est
imate
d P
ow
er G
ene
ration
[kW
h]
Source : Prepared by the Study Team
Figure 4.11.1-8 Monthly Power Generation Estimation (Faculty of Engineering)
0.0
20.0
40.0
60.0
80.0
100.0
120.0
140.0
160.0
180.0
200.0
0
10,000
20,000
30,000
40,000
50,000
60,000
Jan Feb Mar Apr May Jun Jul Aug Sep Oct Nov Dec
Mon
thly
Inte
grate
d G
roba
l Sola
r
Irra
dia
tion
[kW
h/㎡
]
Est
imate
d P
ow
er G
ene
ration
[kW
h]
Source : Prepared by the Study Team
Figure 4.11.1-9 Monthly Power Generation Estimation (National Stadium)
0.0
20.0
40.0
60.0
80.0
100.0
120.0
140.0
160.0
180.0
200.0
0
200
400
600
800
1,000
1,200
1,400
Jan Feb Mar Apr May Jun Jul Aug Sep Oct Nov Dec
Mon
thly
Inte
grate
d G
roba
l Sola
r
Irra
dia
tion
[kW
h/㎡
]
Est
imate
d P
ow
er G
ene
ration
[kW
h]
Source : Prepared by the Study Team
Figure 4.11.1-10 Monthly Power Generation Estimation (Faculty of Education)

4-44
0.0
20.0
40.0
60.0
80.0
100.0
120.0
140.0
160.0
180.0
200.0
0
500
1,000
1,500
2,000
2,500
3,000
3,500
4,000
Jan Feb Mar Apr May Jun Jul Aug Sep Oct Nov Dec
Mont
hly
Inte
grate
d G
roba
l Sola
r
Irra
diation [k
Wh
/㎡
]
Est
imate
d P
ow
er
Gener
ation
[kW
h]
Source : Prepared by the Study Team
Figure 4.11.1-11 Monthly Power Generation Estimation (Grand Friday Mosque)
0.0
20.0
40.0
60.0
80.0
100.0
120.0
140.0
160.0
180.0
200.0
0
5,000
10,000
15,000
20,000
25,000
Jan Feb Mar Apr May Jun Jul Aug Sep Oct Nov Dec
Mont
hly
Inte
grate
d G
roba
l Sola
r
Irra
diation [k
Wh
/㎡
]
Est
imate
d P
ow
er
Gener
ation
[kW
h]
Source : Prepared by the Study Team
Figure 4.11.1-12 Monthly Power Generation Estimation (Jumhooree Maidhaan)
0.0
20.0
40.0
60.0
80.0
100.0
120.0
140.0
160.0
180.0
200.0
0
500
1,000
1,500
2,000
2,500
3,000
Jan Feb Mar Apr May Jun Jul Aug Sep Oct Nov Dec
Mon
thly
Inte
grate
d G
roba
l Sola
r
Irra
dia
tion
[kW
h/㎡
]
Est
imate
d P
ow
er G
ene
ration
[kW
h]
Source : Prepared by the Study Team
Figure 4.11.1-13 Monthly Power Generation Estimation (President’s Office)
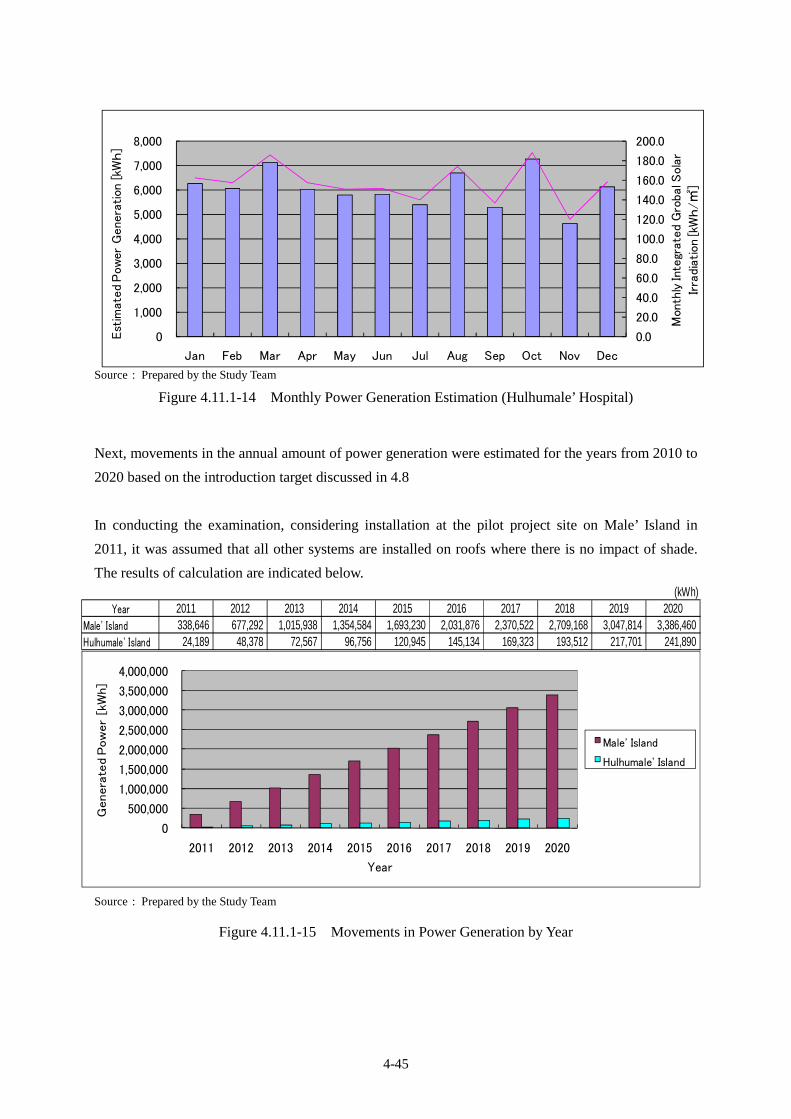
4-45
0.0
20.0
40.0
60.0
80.0
100.0
120.0
140.0
160.0
180.0
200.0
0
1,000
2,000
3,000
4,000
5,000
6,000
7,000
8,000
Jan Feb Mar Apr May Jun Jul Aug Sep Oct Nov Dec
Mon
thly
Inte
grate
d G
roba
l Sola
r
Irra
dia
tion
[kW
h/㎡
]
Est
imate
d P
ow
er G
ene
ration
[kW
h]
Source : Prepared by the Study Team
Figure 4.11.1-14 Monthly Power Generation Estimation (Hulhumale’ Hospital)
Next, movements in the annual amount of power generation were estimated for the years from 2010 to
2020 based on the introduction target discussed in 4.8
In conducting the examination, considering installation at the pilot project site on Male’ Island in
2011, it was assumed that all other systems are installed on roofs where there is no impact of shade.
The results of calculation are indicated below.
Source : Prepared by the Study Team
Figure 4.11.1-15 Movements in Power Generation by Year
(kWh)Year 2011 2012 2013 2014 2015 2016 2017 2018 2019 2020
Male' Island 338,646 677,292 1,015,938 1,354,584 1,693,230 2,031,876 2,370,522 2,709,168 3,047,814 3,386,460Hulhumale' Island 24,189 48,378 72,567 96,756 120,945 145,134 169,323 193,512 217,701 241,890
0
500,000
1,000,000
1,500,000
2,000,000
2,500,000
3,000,000
3,500,000
4,000,000
2011 2012 2013 2014 2015 2016 2017 2018 2019 2020
Genera
ted P
ow
er
[kW
h]
Year
Male' Island
Hulhumale' Island

4-46
4.11.2 Diesel Fuel Consumption Saving
Based on operating performance figures obtained from STELCO for diesel power plants on Male’
Island and Hulhumale’ Island for the past three years, fuel consumption per unit power generation
(kWh) was calculated as follows.
Table 4.11.2-1 Fuel Consumption at Diesel Power Plants on Male’ Island and Hulhumale’ Island
Island Item 2006 2007 2008 3-month Mean
Power generation [kWh] 156,107,764 177,052,316 195,105,695 -
Fuel consumption [liter] 40,151,086 45,482,134 50,460,116 - Male’
Fuel consumption per kWh [liter/kWh]
0.26 0.26 0.26 0.26
Power generation [kWh] 4,106,410 5,810,041 7,324,293 -
Fuel consumption [liter] 1,196,425 1,614,299 2,061,552 - Hulhumale’
Fuel consumption per kWh [liter/kWh]
0.29 0.28 0.28 0.28
Source : Prepared by the Study Team using data obtained from STELCO
Using the above results, the amount of fuel savings calculated based on the grid-connected PV power
generation each year as estimated in 4.11.1 was calculated in the manner shown in Table 4.11.2-2.
Table 4.11.2-2 Yearly Diesel Fuel Saving
Source : Prepared by the Study Team
4.11.3 CO2 Emission Reductions
Based on the diesel fuel savings calculated in 4.11.2, the following coefficient was used to calculate
the amount of CO2 emission reductions.
CO2 reduction [kg] = Light oil CO2 emission coefficient* x Diesel fuel saving = 2.62 [kg-CO2/liter] x Diesel fuel saving [liter]
* Concerning the emission coefficient, the Total Emissions Calculation Method Guidelines of the Ministry of Environment were quoted.
As a result, the amount of CO2 emission reductions in each year was calculated as follows. In the case
where the PV introduction target is achieved according to plan, the amount of CO2 emission reductions
over 10 years from 2010 to 2020 is 12,688 tons on Male’ Island and 976 tons on Hulhumale’ Island,
resulting in a total reduction of 13,664 tons.
(liter)Year 2011 2012 2013 2014 2015 2016 2017 2018 2019 2020 Total
Male' Island 88,048 176,096 264,144 352,192 440,240 528,288 616,336 704,384 792,432 880,480 4,842,638Hulhumale' Island 6,773 13,546 20,319 27,092 33,865 40,638 47,410 54,183 60,956 67,729 372,511
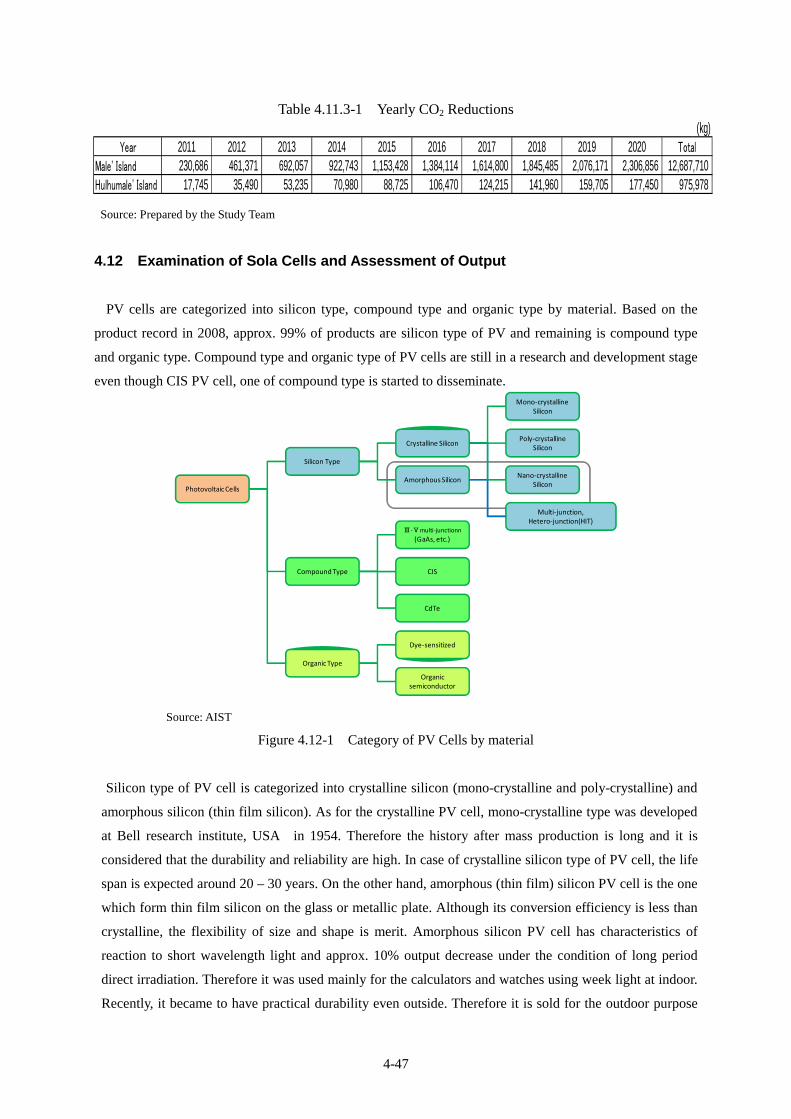
4-47
Table 4.11.3-1 Yearly CO2 Reductions
Source: Prepared by the Study Team
4.12 Examination of Sola Cells and Assessment of Output
PV cells are categorized into silicon type, compound type and organic type by material. Based on the
product record in 2008, approx. 99% of products are silicon type of PV and remaining is compound type
and organic type. Compound type and organic type of PV cells are still in a research and development stage
even though CIS PV cell, one of compound type is started to disseminate.
Source: AIST
Figure 4.12-1 Category of PV Cells by material
Silicon type of PV cell is categorized into crystalline silicon (mono-crystalline and poly-crystalline) and
amorphous silicon (thin film silicon). As for the crystalline PV cell, mono-crystalline type was developed
at Bell research institute, USA in 1954. Therefore the history after mass production is long and it is
considered that the durability and reliability are high. In case of crystalline silicon type of PV cell, the life
span is expected around 20 – 30 years. On the other hand, amorphous (thin film) silicon PV cell is the one
which form thin film silicon on the glass or metallic plate. Although its conversion efficiency is less than
crystalline, the flexibility of size and shape is merit. Amorphous silicon PV cell has characteristics of
reaction to short wavelength light and approx. 10% output decrease under the condition of long period
direct irradiation. Therefore it was used mainly for the calculators and watches using week light at indoor.
Recently, it became to have practical durability even outside. Therefore it is sold for the outdoor purpose
(kg)Year 2011 2012 2013 2014 2015 2016 2017 2018 2019 2020 Total
Male' Island 230,686 461,371 692,057 922,743 1,153,428 1,384,114 1,614,800 1,845,485 2,076,171 2,306,856 12,687,710Hulhumale' Island 17,745 35,490 53,235 70,980 88,725 106,470 124,215 141,960 159,705 177,450 975,978
Photovoltaic Cells
Silicon Type
Compound Type
Organic Type
Crystalline Silicon
Amorphous Silicon
Ⅲ‐Ⅴmulti‐junctionn
(GaAs, etc.)
CIS
CdTe
Dye‐sensitized
Organic semiconductor
Mono‐crystallineSilicon
Poly‐crystallineSilicon
Nano‐crystallineSilicon
Multi‐junction,Hetero‐junction(HIT)

4-48
but its reliability has still not been verified yet because it just started the production.
Moreover the cell efficiency of thin film type is less (approx. 10%) than crystalline type (approx. 15%).
This means the thin film type cell needs 1.5 times of area comparing with crystalline type. Therefore the
crystalline is effective under the condition of small land like Maldives
In addition, crystalline PV cell occupies 90% of market in Asia as shown in Table 4.12-2. The sales
agents are selling mainly the crystalline PV cells. Therefore the crystalline silicon type has an advantage
taking consideration into the marketability and ease to respond for trouble.
Reflecting with this, it is recommendable to apply crystalline silicon type of PV cells taking durability and
reliability into consideration.
Table 4.12-1 Type of PV Cells and Characteristics
Source: NEDO
Mono-crystalline Poly-crystalline Amorphous Multi-junction
Characteristic
/ Utilize 200μm~300μ
m of thin mono-crystallinesilicon plate/ Most historic PV cell/ Expensive butperformance and reliabilityis high
/ Poly-crystalline plate withaggregate of small crystal/ Cheaper than mono-crystalline and easy toproduce/ Most popular at present/ Efficiency is lower thanmono-crystalline type
/ 1 μm of thin film coatingon a plate by amorphoussilicon/ Large area product isavailable/ Mass-production/ Performance has someissues comparing withcrystalline silicon
/ Amorphous and smallcrystalline of laminated PV/ Large area product isavailable/ Mass-production/ Perform under wide rangeof wavelength condition/ less amount of silicon(approx. 1/100 of crystalinetype)/ Efficiency is higher thanamorphous type
/ One of compoundsemiconductor/ Thin film PV utilizing Cu(Cupper), In (Indium) andSe (Selenium)/ Production process issimple/ Expectation for highperformance/ R&D is on-going
/ Particular compoundsemiconductor plateutilizing Ga (gallium), As(Arsenic) etc./ High performance (30 -40 % of efficiency )/ High cost/ Particular purpose suchas space development/ Reseach for costreduction by concentratedPV system
/ Dye on titanium oxide(semiconductor) absorbslight and releases electron/ Easy production/ Expectation for low cost/ Issues on efficiency andendurance
/ P-N junction of organicsemiconductor/ Expectation for low cost/ Issues on efficiency andendurance
Module Efficiency( ) means research stage
~19% ~15% ~6% ~12% ~11%~31% (in case of
concentrate)(11%) (5%)
Practicability Practical application stage Practical application stage Practical application stage Practical application stage Practical application stage Practical application stage R&D stage R&D stage
ManufacturerSharp,Sanyo (HIT Type)
Sharp,Kyocera,Mitsubishi
MHI,Kaneka
MHI,Kaneka,Fuji Electric, Sharp
Showa Shell,Honda
Sharp
Sharp,Fujikura,Sony,AISIN
Panasonic,ENEOS,Mitsubishi Chemical,Sumitomo Chemical
Oraganic thin film
Compound OrganicSiliconCrystalline silicon Thin film silicon
CIS Ⅲ-Ⅴ crystalline Dye-sensitized
several mm ~ several cm
Edited by the Study Team in reference to the materials by METI and NEDO in Japan

4-49
Source:Newton September 2009
Figure 4.12-2 Trend of PV introduction capacity in the world
4.13 Expected Model of Grid-Connected PV System Introduction
Since the total amount of installed capacity of the grid-connected PV systems on Male’ Island and
Hulhumale’ Island will be limited to 13.49 MW, a scenario that entails disseminating the technology
by 13.49 MW over 10 years until 2020 is considered. Regarding the parties responsible for introducing
the technology, it is assumed that STELCO will take charge from 2011 to 2014 and that STELCO and
the private sector will be jointly responsible from 2015 to 2020. Accordingly, the expected model of
grid-connected PV system introduction shall be divided into two stages, i.e. the pilot project and the
period up to 2014, and the period from 2015 to 2020.
In the pilot project and period up to 2014, since STELCO will be the agency responsible for
introduction, two models of introduction can be considered: the model where STELCO introduces the
grid-connected PV system as its own equipment into its own company buildings, and the model where
STELCO introduces it as its own equipment into other companies’ buildings. As for the period from
2015 to 2020, since the private sector will join STELCO on the implementing side and consideration
is given to establishing an excess power purchasing system when introducing to the private sector,
■:Mono-crystalline、■:Poly- crystalline、■:Amorphous、■:CdTe、■:CIS
Japan
Europe Asia
USA

4-50
another model, i.e. the model where building owners introduce equipment as private generator systems
and sell excess power to STELCO, can be considered in addition to the above two.
Table 4.13-1 Expected Model of Grid-Connected PV System Introduction
in the Pilot Project and Period until 2014
No. Model of Introduction Installation
Site PV System
Owner Features, Issues, Requirements, etc.
①
STELCO installs PV systems in its own building as company property.
STELCO’s own facilities
STELCO
- Since STELCO owns the PV systems, planning and design for the PV systems is easier.
- Installation sites can be selected by STELCO.
②
STELCO borrows rooftops owned by other entities and installs its PV systems.
Properties owned by
third parties STELCO
- Related regulations and constraints, rental fees for property shall be considered.
- Agreement concerning system operation and security are required.
- Since STELCO owns the PV facilities, there is no need to consider tariff for reverse power.
Source : Prepared by the Study Team
Table 4.13-2 Expected Model of Grid-Connected PV System Introduction in the Period from 2015 to 2020
No. Model of Introduction Installation
Site PV System
Owner Features, Issues, Requirements, etc.
①
STELCO installs PV systems in its own building as company property.
STELCO’s own facilities
STELCO
- Since STELCO owns the PV systems, planning and design for the PV systems is easier.
- Installation sites can be selected by STELCO.
②
STELCO borrows rooftops owned by other entities and installs its PV systems.
Properties owned by
third parties STELCO
- Related regulations and constraints, and rental fees for property shall be considered.
- Agreement concerning system operation and security is required.
- Since STELCO owns the PV facilities, there is no need to consider tariff for reverse power.
③
Building owners install PV systems as their own generators and sell excess power to STELCO.
Properties owned by
third parties
Property owners
- Since PV systems are usually operated as in-house generators, reverse power is relatively little and the impact on distribution lines is small.
- It is necessary to determine the interconnection guidelines and other transparent standards regarding protective equipment and so on.
Source : Prepared by the Study Team
The metering of PV power generation will be treated as follows. STELCO will install standalone meter
for PV system in case that STELCO own the PV system. A meter without protection for reverse rotation is
installed at interconnection point in order to measure stand-by consumption during nighttime.
On the other hand, as mentioned above, excess power purchasing system will be applied for private
sectors after 2015. In case that private sectors own the system, the Team concluded that it is better to install

4-51
a new meter (with protection for reverse rotation) to measure selling electricity beside of an existing buying
meter (with protection for reverse rotation). It is the reason why the power purchasing price is uncertain
because it must be decided taking financial condition after privatization of STELCO into consideration.
Table 4.13- 3 Metering method for grid-connected PV system PV
System owner
Fig. No.
interconnection category
Procurement & installation
of meter
Type of meter Installation point for meter
Boundary of properties and responsibility
Metering method
① LV LV side
STELCO ② MV
STELCO
Without protection for
reverse rotation (MEA accredited
products)
MV side of interconnection
transformer
All STELCO’s properties
Standalone meter for PV power generation
LV 1Φ(~40A)
③ LV 3Φ
(~63A)
STELCO (PV System owner must shoulder the
cost)
④
LV 3Φ
(100~300A)
LV side(between
existing meter and distribution
board) Except
for STELCO
⑤ MV
(300A~)
PV System owner (need
STELCO’s calibration) or can order to STELCO
With protection for
reverse rotation (MEA accredited
products)
MV side of receiving
transformer
Primary side of meter or incoming cable terminal of MDB is boundary. The distribution lines side’s cables belong to STELCO. The meters belong to the customer but installation, removal and replacement without approval from STELCO are prohibited
An additional meter (with protection for reverse rotation) to measure selling electricity must be install beside an existing meter (with protection for reverse rotation)
Source: Prepared by the Study Team
Figure 4.13- 1 Image for metering of grid-connected PV system(STELCO’s installation)
3Φ, 11kV
3Φ, 11kV
②
①
STELCO
Property
Meter
Power Conditioner
Transformer(11kV/0.4kV)
STELCO
Property
Meter
Power Conditioner
Transformer(11kV/0.4kV)
VCT
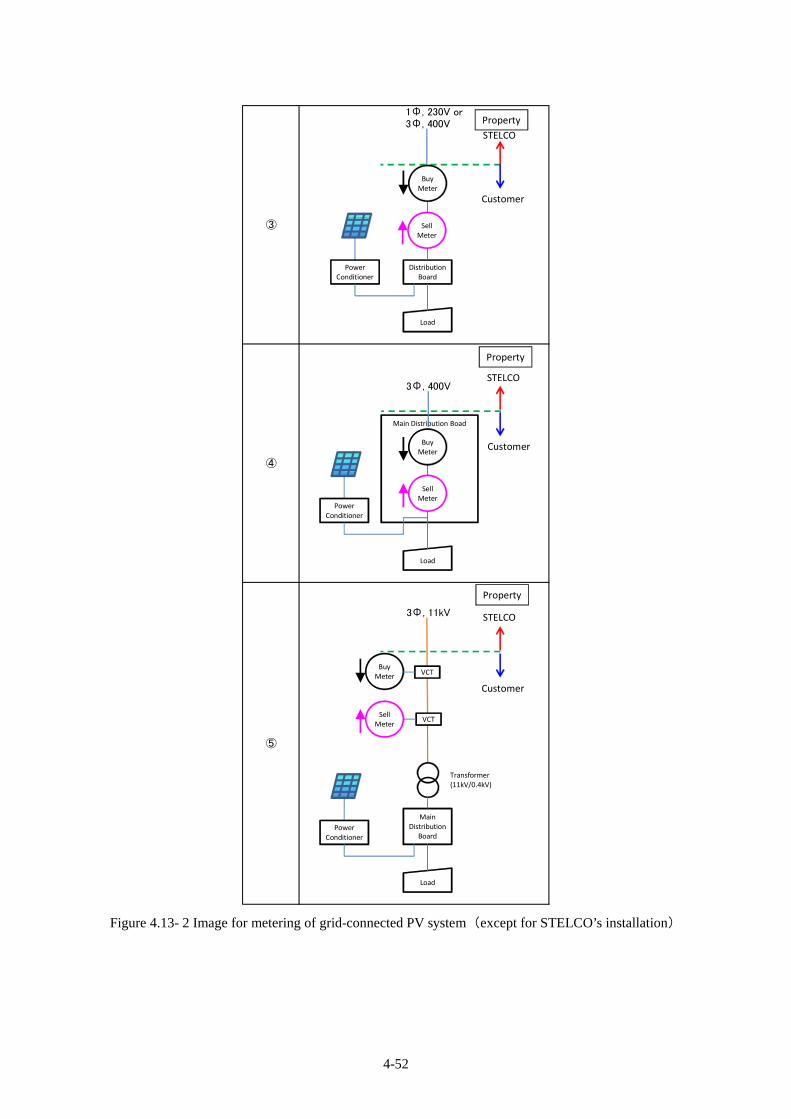
4-52
Figure 4.13- 2 Image for metering of grid-connected PV system(except for STELCO’s installation)
1Φ, 230V or3Φ, 400V
3Φ, 400V
3Φ, 11kV
③
④
⑤
Distribution Board
Load
STELCO
BuyMeter
Customer
Main Distribution Boad
Load
STELCO
BuyMeter
Customer
MainDistribution
Board
Load
STELCO
BuyMeter
Customer
Transformer(11kV/0.4kV)
Property
Property
Property
SellMeter
SellMeter
SellMeter
Power Conditioner
Power Conditioner
Power Conditioner
VCT
VCT

4-53
4.14 Legal Systems (Building Law, etc.) concerning Existing Buildings
It is planned to install the PV panels on the square roof or roofs of existing buildings. On Male’ Island,
where buildings are densely packed, and Hulhumale’ Island, which is undergoing large-scale
development plans, this is deemed to be the optimum method upon taking the impact of shade, cost
and ease of maintenance, etc into consideration. Roofing specifications in the Maldives generally
consist of sheets metal roofing on sloped roofs on both RC buildings (reinforced concrete structures)
and S buildings (steel structures). In cases where rooftops are used as open spaces, water-proofing
specifications are applied to RC slab. The National Building Code of the Maldives was established in
August 2008, this provides broad performance stipulations. Maldives National Building Act first draft
was announced in June. 2009. They invited a public comment and they are adjusting it toward the
enactment. When new building or rebuilding works are implemented, the responsible engineering
section of the MHTE individually reviews and gives planning permission for each applied building.
New Zealand and British standards are used to provide the basis for conducting review. Provided that
the calculations used to prove the safety of structures can be explained in engineering terms, it doesn’t
matter which country’s standard are used. The loads that are assumed when designing PV panels and
supporting members generally comprise permanent dead load and natural external forces such as wind
load, seismic load and snow loads, etc.; however, since the Maldives has never experienced earthquake
disasters (excluding tsunami damage) in the past, it was confirmed with the MHTE Engineering
Section that seismic load doesn’t need to be considered.
Table 4.14-1 Assumed Loads when Installing PV Panels
No. Load type Contents 1 Dead load Combined weight of the PV modules and supports, etc.
2 Wind load Vectorial sum of the wind load (also taking monsoon strong winds into account) acting on the PV modules and the load acting on frame and other supporting structures
3 Snow load Vertical snow load on PV module surfaces (not considered in this study)
4 Seismic load Horizontal seismic force acting on structures (on steel structure frame, this seismic force is generally smaller than wind load and is not considered in the Study).
Source : Prepared by the Study Team
4.15 Structural Analysis of Buildings and Conceptual Design of Building
Reinforcements
With respect to the potential sites proposed by each concerned government agency, field surveys and
surveys of existing design documents were conducted; and the panel support methods and installation
methods were classified and examined according to the facilities and buildings recommended upon
taking obstructed solar radiation, generating capacity, ease of reinforcement and rehabilitation and
public relations effect, etc. into account. Basically, in cases of sheets metal roofing, panels shall be
supported on the purlin, while in cases of installation on square roof and on the ground, supporting

4-54
frame shall be constructed out of steel frames and supported with RC foundations. Structural analysis
of buildings is intended to quantitatively determine the impact that PV panels (decided according to
the generating capacity, etc.) have on existing buildings when the panel load is installed on the planned
roofs. First, existing design documents will be used to gauge the roof materials, the method used to
support roof materials and cross-sectional performance of support members, etc. Next, a structural
model will be constructed according to the roof support method; stress analysis taking the weight of
panels into account will be implemented, and judgment will be made concerning whether or not the
stress level exceeds the permissible bearing force of the support members.
If stress is found to exceed the bearing force in the above examination, the shape and connections, etc.
of structures will be reconfirmed in detail based on the existing design documents and field surveys
and, upon compiling feasible reinforcement methods including iron sheet wrapping, special fiber sheet
reinforcement, addition of buckling prevention materials and so on, the quantity, term and cost of
reinforcement works will be identified.
Table 4.15-1 Contents and Results of Examination on PV Panel Supports
No Site Support Type
(Installed floor) Examination Contents Examination Results
Male’ Island
1 STELCO Building S frame (rooftop RC) Examination of S frame and floor attachment method
S frame, rooftop floor, foundation works
2 STELCO Power House purlin attachment (roof) None (there is impact from waste heat)
-----
3 Dharubaaruge purlin attachment (roof)Examination of purlin and panel attachment
Existing design documents unknown (impossible)
4 Velaanaage (Govt. Office) Unknown (work in progress)
None -----
5 Giyaasudheen School purlin attachment (roof)Examination of purlin and panel attachment
Roof repair works No reinforcement
6 Kalaafaanu School purlin attachment (roof)Examination of purlin and panel attachment
Roof repair works No reinforcement
7 Maldives Center for Social Education
purlin attachment (roof)Examination of purlin and panel attachment
Roof repair works No reinforcement
8 Thaajuddeen School purlin attachment (roof)Examination of purlin and panel attachment
Roof repair works No reinforcement
9 New Secondary School for Girls
purlin attachment (roof)Examination of purlin and panel attachment
No reinforcement
10 Indhira Gandhi Memorial Hospital (IGMH)
purlin attachment (roof)S frame (rooftop RC)
None (rehabilitation plan exists)
-----
11 Faculty of Engineering purlin attachment (roof)Examination of purlin and panel attachment
Unusual attachment, existing design documents unknown (impossible)
12 National Stadium purlin attachment (roof)Examination of purlin and panel attachment and main members
Existing design documents unknown (impossible)
13 Majeedhiya School purlin attachment (roof)
None (major shade obstruction) -----
14 Dharumavantha School purlin attachment (roof) None (major shade obstruction) -----
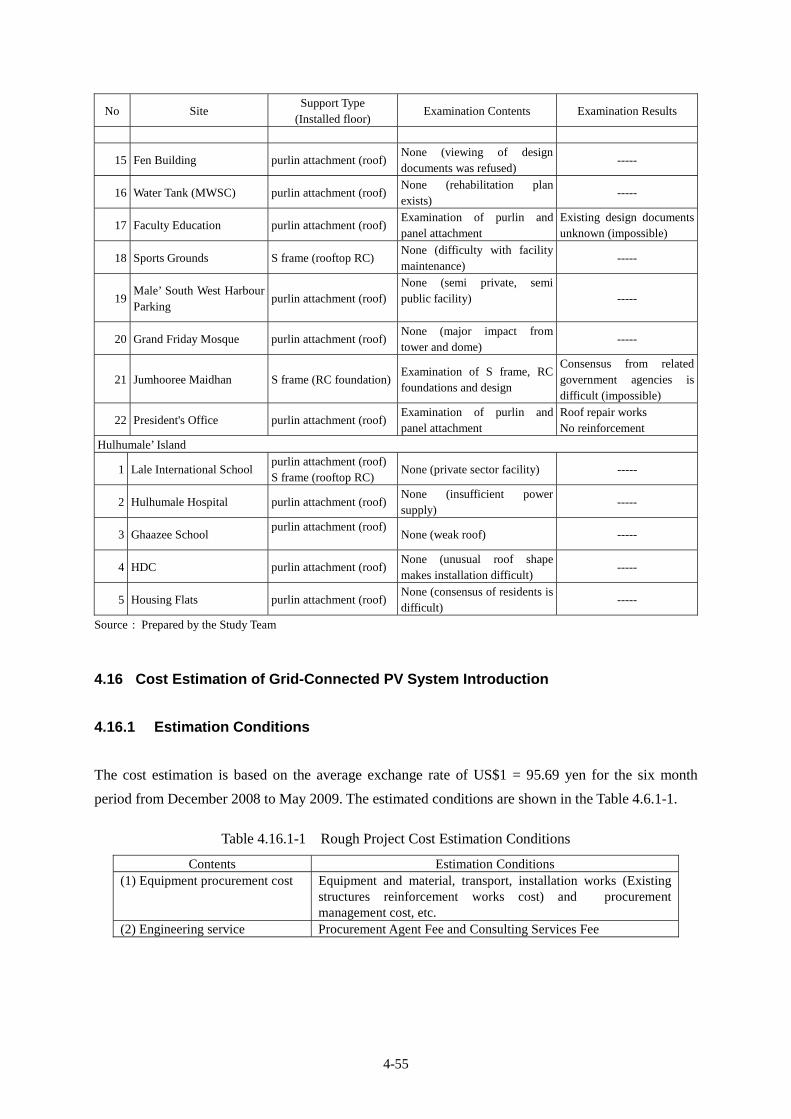
4-55
No Site Support Type
(Installed floor) Examination Contents Examination Results
15 Fen Building purlin attachment (roof) None (viewing of design documents was refused)
-----
16 Water Tank (MWSC) purlin attachment (roof) None (rehabilitation plan exists)
-----
17 Faculty Education purlin attachment (roof) Examination of purlin and panel attachment
Existing design documents unknown (impossible)
18 Sports Grounds S frame (rooftop RC) None (difficulty with facility maintenance)
-----
19 Male’ South West Harbour Parking
purlin attachment (roof) None (semi private, semi public facility)
-----
20 Grand Friday Mosque purlin attachment (roof) None (major impact from tower and dome)
-----
21 Jumhooree Maidhan S frame (RC foundation) Examination of S frame, RC foundations and design
Consensus from related government agencies is difficult (impossible)
22 President's Office purlin attachment (roof) Examination of purlin and panel attachment
Roof repair works No reinforcement
Hulhumale’ Island
1 Lale International School purlin attachment (roof) S frame (rooftop RC)
None (private sector facility) -----
2 Hulhumale Hospital purlin attachment (roof) None (insufficient power supply)
-----
3 Ghaazee School purlin attachment (roof)
None (weak roof) -----
4 HDC purlin attachment (roof) None (unusual roof shape makes installation difficult)
-----
5 Housing Flats purlin attachment (roof) None (consensus of residents is difficult)
-----
Source : Prepared by the Study Team
4.16 Cost Estimation of Grid-Connected PV System Introduction
4.16.1 Estimation Conditions
The cost estimation is based on the average exchange rate of US$1 = 95.69 yen for the six month
period from December 2008 to May 2009. The estimated conditions are shown in the Table 4.6.1-1.
Table 4.16.1-1 Rough Project Cost Estimation Conditions
Contents Estimation Conditions (1) Equipment procurement cost Equipment and material, transport, installation works (Existing
structures reinforcement works cost) and procurement management cost, etc.
(2) Engineering service Procurement Agent Fee and Consulting Services Fee
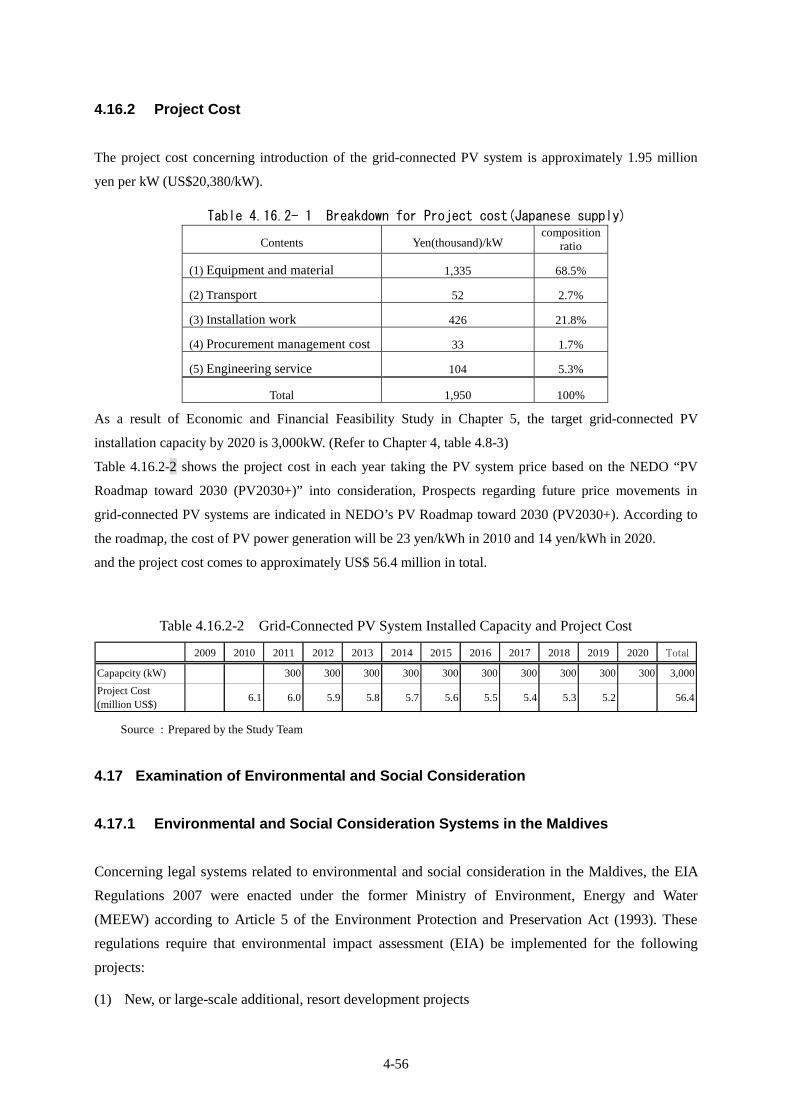
4-56
4.16.2 Project Cost
The project cost concerning introduction of the grid-connected PV system is approximately 1.95 million
yen per kW (US$20,380/kW).
Table 4.16.2- 1 Breakdown for Project cost(Japanese supply)
Contents Yen(thousand)/kW composition
ratio
(1) Equipment and material 1,335 68.5%
(2) Transport 52 2.7%
(3) Installation work 426 21.8%
(4) Procurement management cost 33 1.7%
(5) Engineering service 104 5.3%
Total 1,950 100%
As a result of Economic and Financial Feasibility Study in Chapter 5, the target grid-connected PV
installation capacity by 2020 is 3,000kW. (Refer to Chapter 4, table 4.8-3)
Table 4.16.2-2 shows the project cost in each year taking the PV system price based on the NEDO “PV
Roadmap toward 2030 (PV2030+)” into consideration, Prospects regarding future price movements in
grid-connected PV systems are indicated in NEDO’s PV Roadmap toward 2030 (PV2030+). According to
the roadmap, the cost of PV power generation will be 23 yen/kWh in 2010 and 14 yen/kWh in 2020.
and the project cost comes to approximately US$ 56.4 million in total.
Table 4.16.2-2 Grid-Connected PV System Installed Capacity and Project Cost
2009 2010 2011 2012 2013 2014 2015 2016 2017 2018 2019 2020 Total
Capapcity (kW) 300 300 300 300 300 300 300 300 300 300 3,000
Project Cost(million US$)
6.1 6.0 5.9 5.8 5.7 5.6 5.5 5.4 5.3 5.2 56.4
Source : Prepared by the Study Team
4.17 Examination of Environmental and Social Consideration
4.17.1 Environmental and Social Consideration Systems in the Maldives
Concerning legal systems related to environmental and social consideration in the Maldives, the EIA
Regulations 2007 were enacted under the former Ministry of Environment, Energy and Water
(MEEW) according to Article 5 of the Environment Protection and Preservation Act (1993). These
regulations require that environmental impact assessment (EIA) be implemented for the following
projects:
(1) New, or large-scale additional, resort development projects

4-57
(2) Aquaculture and processing facilities, and artificial atoll development projects
(3) Agriculture, stockbreeding and large-scale forest felling projects
(4) Port construction, dredging, landfill and shore protection projects
(5) Trunk road construction projects
(6) Airport, heliport and hydroplane hub construction projects
(7) Large-scale housing development and factory construction projects
(8) Incinerator, waste disposal site and large-scale waste storage and separation facilities
(9) Bottling plant and water supply/sewage system projects
(10) Power plant and petroleum/gas, etc. fuel treatment and refining facility construction projects
(11) Seawater desalination facilities and hospital construction projects
As is indicated above, EIA is required when constructing power plants. However, since this presumes
the construction of diesel power plants, it will be necessary to submit a Development Proposal
Screening Form to the Environmental Protection Agency (EPA) and undergo a screening review to
determine whether or not grid-connected PV systems are subject to an EIA (or initial environmental
examination: IEE). The result of screening will be notified to the project owner within 10 days from
receipt of application, and in the case where an EIA or IEE is deemed necessary, the project owner will
need to present an EIA/IEE Application Form (Form C2) and Project Brief to the EPA and commence
the application procedure for an Environmental Decision Statement. On receiving the application
form, the EPA will hold a scoping meeting together with representatives from related government
agencies in order to discuss and confirm the expected environmental impacts of the proposed project.
After the scoping meeting, the project owner will present the items (TOR) that need to be surveyed in
the EIA or IEE to the EPA and, after receiving approval from the EPA, it will prepare the EIA or IEE
report according to the TOR. The survey report will undergo review by the MHTE and external
reviewers, and the result (one of the following) will be notified to the project owner by means of the
Environmental Decision Statement. Figure 4.17.1-1 shows the work flow regarding EIA or IEE review
to approval. All documents that need to be presented to the EPA will need to be prepared by a licensed
EIA consultant in Maldives.
① Approval of the project application
② Request for renewed survey or provision of additional information concerning the contents
of the submitted report
③ Refusal on the grounds of inadequate content of the EIA or IEE report
④ Refusal of the project application due to the possibility of project implementation exerting a
massive impact on the environment

4-58
Source : “EIA Regulations 2007” MHTE
Figure 4.17.1-1 Environmental Impact Assessment
(or Initial Environmental Examination) Review Process
4.17.2 Agencies concerned with Environmental and Social Consideration
The Environmental Section of the MHTE is in charge of regulations, supervision and administration
concerning environmental impact assessment, whereas the EPA implements review and approval work
concerning the EIA or IEE for individual projects. The EPA has 78 employees as of June 2009 and it
also implements research, education and enlightenment activities in the environmental field
(biotechnology, biological diversity, water hygiene, marine hygiene, coastal area management, etc.).

4-59
4.17.3 Environmental and Social Consideration for Pilot Project Implementation
(1) Process and Results of Screening Review
According to the EIA Regulations 2007, in the screening stage, project owners are required to
assess components that have the potential to impose environmental impact classified into three
ranks, i.e. 1) No impact, 2) Impact exists, and 3) Adverse impact exists. Table 4.17.3-1 shows the
screening results for the pilot project which were prepared by the Study Team in consultation
with the MHTE.
Table 4.17.3-1 Pilot Project Screening
Environmental Components No impact Beneficial impact Adverse impact Seabed (Sea) water quality Fish stocks Coral reefs Sea grass beds Beaches Mangroves and wetlands Protected area Terrestrial vegetation Introduction of exotic species (density) Habitat change Air quality Groundwater quality Groundwater availability Noise levels Public wellbeing Public health Public safety Public transport Employment opportunities Economic Status Public views
Source : “EIA Regulations 2007” MHTE with additions made by the Study Team
Implementation of the project will make it possible to reduce generated electric energy from
DEG operation by power plants on Male’ Island during the daytime peak period, thereby
enabling emissions of atmospheric pollutants such as nitrogen oxides (NOx) and sulfur oxides
(SOx), etc. and greenhouse gases (carbon dioxide: CO2) from power plants to be reduced.
Moreover, due to the proximity of power plants on Male’ Island to residential areas and schools,
noise from radiators and air suction/exhaust silencers and vibrations from the operation of
generation equipment are exerting a serious environmental problem. Through reducing the
operation of DEGs, it is anticipated that the project can also mitigate the environmental impacts
caused by such noise and vibration. Other indirect benefits of project implementation will be

4-60
economic ripple effects brought about by greater employment of local laborers, etc. and creation
of new industries.
Envisaging implementation of the pilot project, the MHTE Energy Section, acting as the project
owner, presented the designated screening form to the EPA. As a result of the EPA screening, a
document was sent to the MHTE on June 1, 2009 notifying that the project will cause no major
environmental impact and will not require an IEE.
(2) Treatment and Recycling of Waste Storage Batteries
Concerning the potential pilot project sites currently being forwarded, since the proposed plan
does not include systems for isolated operation switchover requiring storage batteries, no
environmental impact is considered necessary regarding the treatment and recycling of used
batteries. However, if grid-connected PV systems with isolated operation switchover are
introduced to facilities that require highly reliable power supply in the future, it will be necessary
to pay ample attention to the waste battery treatment method. Since the Maldives does not have a
commercial system for recycling even car batteries, it will be impossible to consign the treatment
of PV sealed and valve-controlled lead storage batteries within that country. Accordingly, it may
be necessary to appropriately store used storage batteries in materials warehouses next to power
plants and, when a certain quantity has been reached, to transport them to recycling operators in
nearby countries such as India and Sri Lanka, etc.
However, the export and import of used storage batteries for recycling or final disposal are
regulated by the Basel Convention, which regulates the cross-border movement and disposal of
hazardous waste products, and laws regulating the export and import of specific hazardous
wastes, etc. In case of Maldives, which joined the Basel Convention in April 1992, permission for
exporting waste batteries with the aim of recycling, cannot be granted unless it notifies the
importing country, etc. of its intention to export the target objects and receives an agreement.
Accordingly, the EPA is currently compiling a comprehensive Solid Waste Management
Regulation and intends to examine the treatment method for waste batteries. In a past PV project,
Japan transferred technology to Marshall Island counterparts concerning the recycling of lead
from waste batteries for use as fishing plummets and neutralization of diluted sulfuric acid
(electrolytic solution) with baking soda, and the Study Team explained this treatment method to
Maldives side.
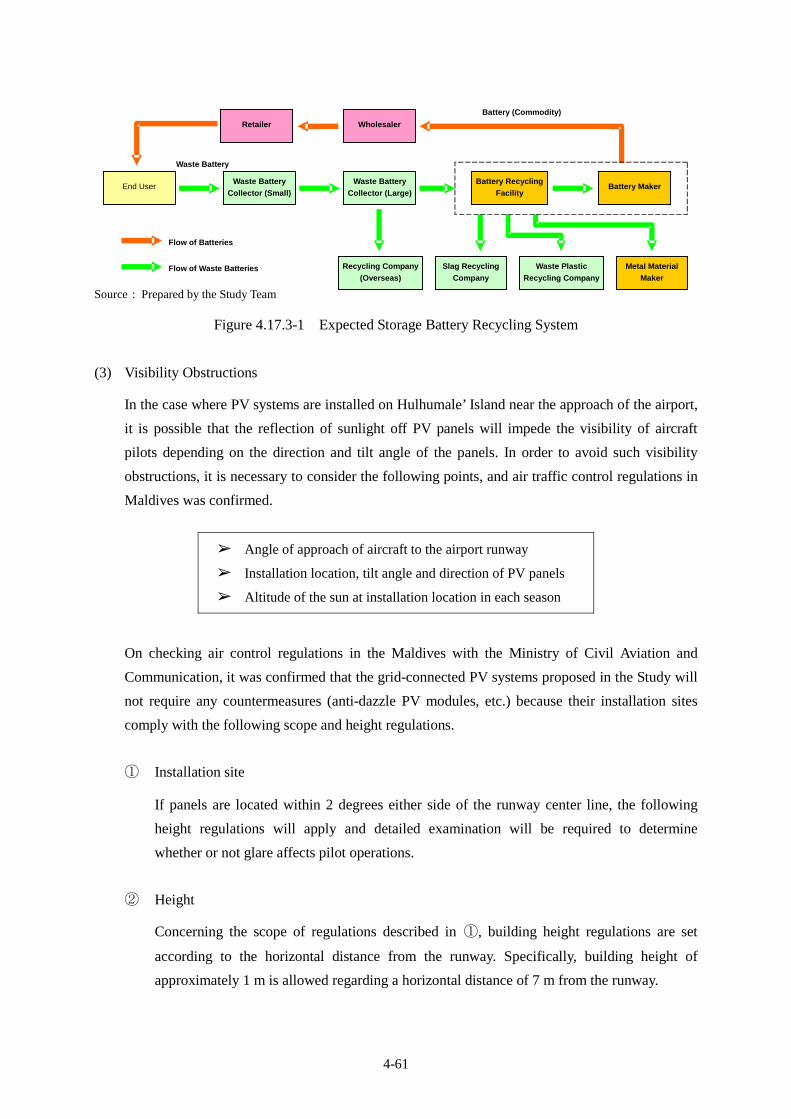
4-61
Source : Prepared by the Study Team
Figure 4.17.3-1 Expected Storage Battery Recycling System
(3) Visibility Obstructions
In the case where PV systems are installed on Hulhumale’ Island near the approach of the airport,
it is possible that the reflection of sunlight off PV panels will impede the visibility of aircraft
pilots depending on the direction and tilt angle of the panels. In order to avoid such visibility
obstructions, it is necessary to consider the following points, and air traffic control regulations in
Maldives was confirmed.
Angle of approach of aircraft to the airport runway
Installation location, tilt angle and direction of PV panels
Altitude of the sun at installation location in each season
On checking air control regulations in the Maldives with the Ministry of Civil Aviation and
Communication, it was confirmed that the grid-connected PV systems proposed in the Study will
not require any countermeasures (anti-dazzle PV modules, etc.) because their installation sites
comply with the following scope and height regulations.
① Installation site
If panels are located within 2 degrees either side of the runway center line, the following
height regulations will apply and detailed examination will be required to determine
whether or not glare affects pilot operations.
② Height
Concerning the scope of regulations described in ①, building height regulations are set
according to the horizontal distance from the runway. Specifically, building height of
approximately 1 m is allowed regarding a horizontal distance of 7 m from the runway.
Retailer Wholesaler
Waste Battery
Collector (Small)
Waste Battery
Collector (Large)
Slag Recycling
Company
Waste Plastic
Recycling Company
Recycling Company
(Overseas)
Battery Recycling
Facility Battery Maker
Metal Material
Maker
End User
Battery (Commodity)
Waste Battery
Flow of Batteries
Flow of Waste Batteries

5-1
CHAPTER 5 ECONOMIC AND FINANCIAL FEASIBILITY STUDY
5.1 Methodology of Economic and Financial Analysis on Introduction of the
Grid-Connected PV System
Since one of the objectives of the Study is to confirm institutional measures necessary for
disseminating grid-connected PV systems, conditions that are conducive to high economic and
financial feasibility will be verified in the economic and financial analysis, and sensitivity analysis
which examines some cases altering institutional conditions (surplus power purchasing system,
subsidies, funds, etc.). Figure 5.1-1 shows the analysis flow: upon organizing and confirming the basic
preconditions for the economic and financial analysis, conditions for implementing institutional
measures for dissemination of the grid-connected PV system will be set and cash flow will be
projected in each case. Based on the results of the cash flow projection, the internal rate of return and
net present value of the project will be calculated, and sensitivity analysis based on altering some
index values will be conducted. The final results will be fed back to examination of the appropriate
institutional measures for disseminating the grid-connected PV system.
Source : Prepared by the Study Team
Figure 5.1-1 Flow of Economic and Financial Analysis

5-2
5.2 Setting of Preconditions
5.2.1 Conditions on PV System, Operation and Maintenance
The preconditions on PV system, operation and maintenance are as follows. These conditions are
common to each type. Prices are those in effect as of May 2009.
PV system
PV system cost : US$ 20,380/kW including cost for construction
works, installation works, design and supervision
Import duties : 25% on equipment and materials price
Operation and maintenance
Diesel fuel price : US$ 0.63/ (STO price MRf 8.1/ )
Lubricant price : US$ 2.28/
Diesel fuel required to generate 1kWh : Male’ 0.26 /kWh, Hulhumale’ 0.28 /kWh
Lubricant required to generate 1kWh : 0.001 /kWh (same on Male’ and Hulhumale’)
DEG maintenance cost : US$ 0.034/kWh
(same on Male’ and Hulhumale’)
PV system maintenance cost : US$ 0.004/kWh
(same on Male’ and Hulhumale’)
Lifetime of main system components : PV panels: 30 years, Other parts: 15 years
Power consumption
Consumption amount to total power generation : 94%
Ratio of power consumption on Male’ Island and Hulhumale’ Island : 75%
Breakdown of power consumption by consumer category
on Male’ Island and Hulhumale’ Island:
Domestic: 45% Businesses: 35% Government and schools: 20%
Administration cost : US$ 0.039/kWh
Exchange rate : US$ 1.00 = ¥ 95.69 = MRf 12.8 (end of May 2009)
Concerning measures for disseminating the grid-connected PV system in the Maldives, since STELCO
is due to be privatized and government subsidies for STELCO to make up a deficit will no longer be
available, supporting measures to reduce the financial burden on the initial investment will be needed.
Besides, as introduction of the PV system can be also extended to the private sector, cases for
introduction by solely STELCO and introduction by STELCO and the private sector will be examined.
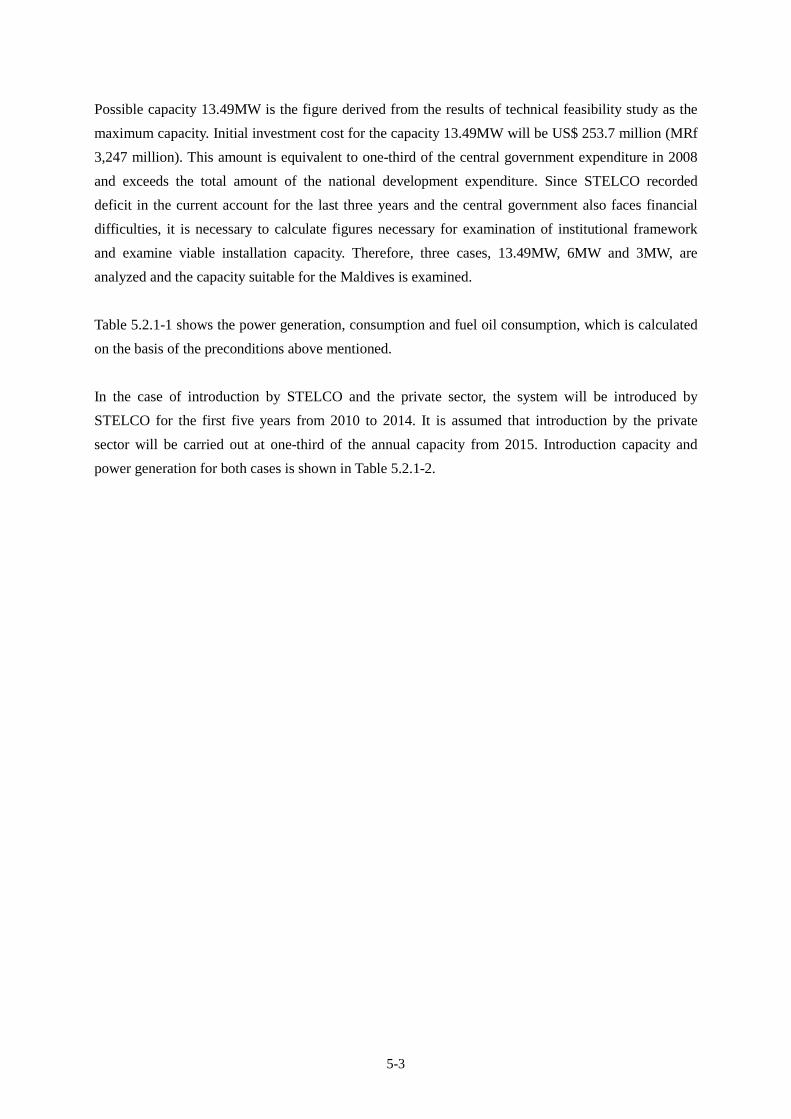
5-3
Possible capacity 13.49MW is the figure derived from the results of technical feasibility study as the
maximum capacity. Initial investment cost for the capacity 13.49MW will be US$ 253.7 million (MRf
3,247 million). This amount is equivalent to one-third of the central government expenditure in 2008
and exceeds the total amount of the national development expenditure. Since STELCO recorded
deficit in the current account for the last three years and the central government also faces financial
difficulties, it is necessary to calculate figures necessary for examination of institutional framework
and examine viable installation capacity. Therefore, three cases, 13.49MW, 6MW and 3MW, are
analyzed and the capacity suitable for the Maldives is examined.
Table 5.2.1-1 shows the power generation, consumption and fuel oil consumption, which is calculated
on the basis of the preconditions above mentioned.
In the case of introduction by STELCO and the private sector, the system will be introduced by
STELCO for the first five years from 2010 to 2014. It is assumed that introduction by the private
sector will be carried out at one-third of the annual capacity from 2015. Introduction capacity and
power generation for both cases is shown in Table 5.2.1-2.
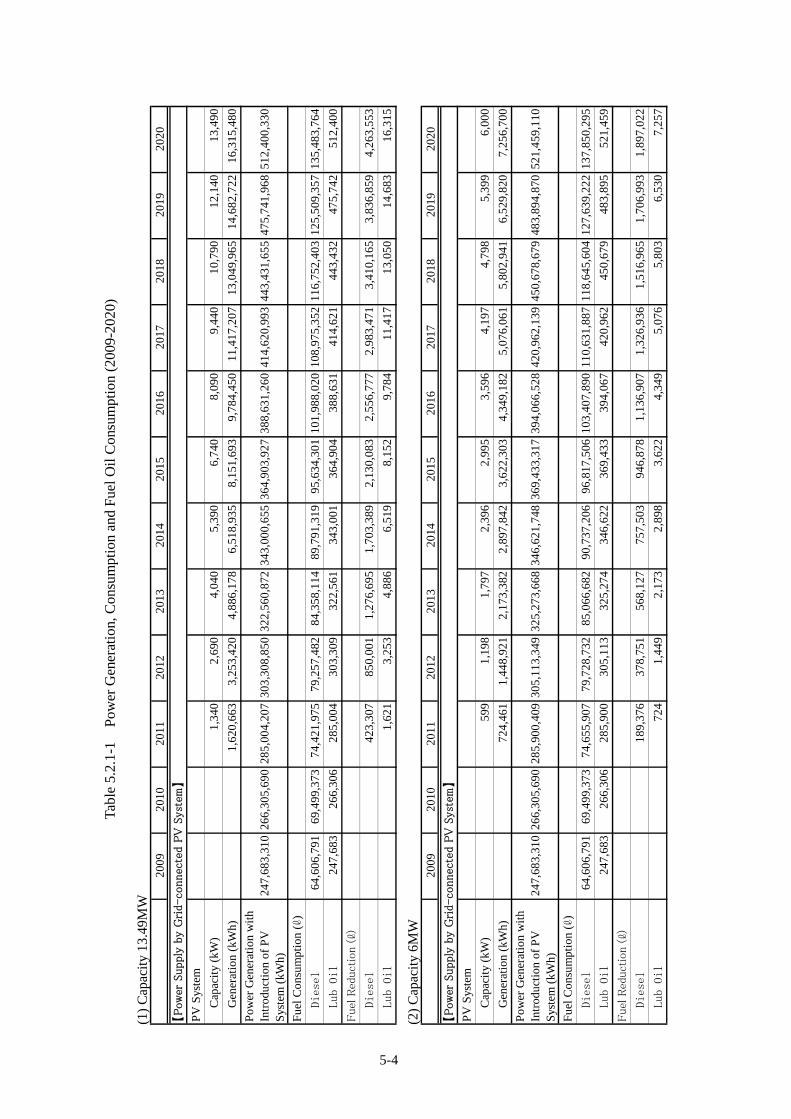
5-4
Tabl
e 5.
2.1-
1 P
ower
Gen
erat
ion,
Con
sum
ptio
n an
d Fu
el O
il C
onsu
mpt
ion
(200
9-20
20)
(1)
Cap
acity
13.
49M
W
2009
2010
2011
2012
2013
2014
2015
2016
2017
2018
2019
2020
PV
Sys
tem
Cap
acit
y (k
W)
1,34
02,
690
4,04
05,
390
6,74
08,
090
9,44
010
,790
12,1
4013
,490
Gen
erat
ion
(kW
h)1,
620,
663
3,25
3,42
04,
886,
178
6,51
8,93
58,
151,
693
9,78
4,45
011
,417
,207
13,0
49,9
6514
,682
,722
16,3
15,4
80
Pow
er G
ener
atio
n w
ith
Intr
oduc
tion
of
PV
Sys
tem
(kW
h)24
7,68
3,31
026
6,30
5,69
028
5,00
4,20
730
3,30
8,85
032
2,56
0,87
234
3,00
0,65
536
4,90
3,92
738
8,63
1,26
041
4,62
0,99
344
3,43
1,65
547
5,74
1,96
851
2,40
0,33
0
Fue
l Con
sum
ptio
n (
)
Diesel
64,6
06,7
9169
,499
,373
74,4
21,9
7579
,257
,482
84,3
58,1
1489
,791
,319
95,6
34,3
0110
1,98
8,02
010
8,97
5,35
211
6,75
2,40
312
5,50
9,35
713
5,48
3,76
4
Lub Oil
247,
683
266,
306
285,
004
303,
309
322,
561
343,
001
364,
904
388,
631
414,
621
443,
432
475,
742
512,
400
Fuel
Red
uct
ion (
)
Diesel
423,
307
850,
001
1,27
6,69
51,
703,
389
2,13
0,08
32,
556,
777
2,98
3,47
13,
410,
165
3,83
6,85
94,
263,
553
Lub Oil
1,62
13,
253
4,88
66,
519
8,15
29,
784
11,4
1713
,050
14,6
8316
,315
【Power
Supply
by
Gri
d-co
nnec
ted P
V S
yste
m】
(2)
Cap
acit
y 6M
W
2009
2010
2011
2012
2013
2014
2015
2016
2017
2018
2019
2020
PV
Sys
tem
Cap
acit
y (k
W)
599
1,19
81,
797
2,39
62,
995
3,59
64,
197
4,79
85,
399
6,00
0
Gen
erat
ion
(kW
h)72
4,46
11,
448,
921
2,17
3,38
22,
897,
842
3,62
2,30
34,
349,
182
5,07
6,06
15,
802,
941
6,52
9,82
07,
256,
700
Pow
er G
ener
atio
n w
ith
Intr
oduc
tion
of
PV
Sys
tem
(kW
h)24
7,68
3,31
026
6,30
5,69
028
5,90
0,40
930
5,11
3,34
932
5,27
3,66
834
6,62
1,74
836
9,43
3,31
739
4,06
6,52
842
0,96
2,13
945
0,67
8,67
948
3,89
4,87
052
1,45
9,11
0
Fue
l Con
sum
ptio
n (
)
Diesel
64,6
06,7
9169
,499
,373
74,6
55,9
0779
,728
,732
85,0
66,6
8290
,737
,206
96,8
17,5
0610
3,40
7,89
011
0,63
1,88
711
8,64
5,60
412
7,63
9,22
213
7,85
0,29
5
Lub Oil
247,
683
266,
306
285,
900
305,
113
325,
274
346,
622
369,
433
394,
067
420,
962
450,
679
483,
895
521,
459
Fuel
Red
uct
ion (
)
Diesel
189,
376
378,
751
568,
127
757,
503
946,
878
1,13
6,90
71,
326,
936
1,51
6,96
51,
706,
993
1,89
7,02
2
Lub Oil
724
1,44
92,
173
2,89
83,
622
4,34
95,
076
5,80
36,
530
7,25
7
【Power
Supply
by
Gri
d-co
nnec
ted P
V S
yste
m】
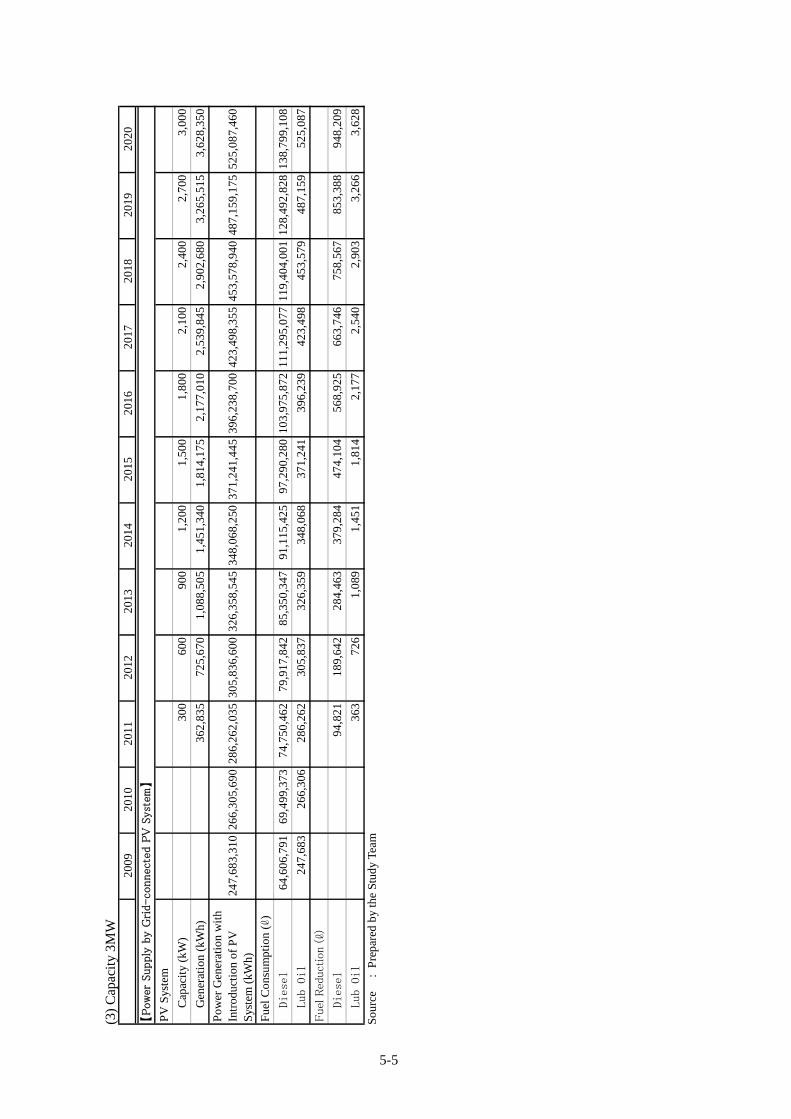
5-5
(3)
Cap
acit
y 3M
W
2009
2010
2011
2012
2013
2014
2015
2016
2017
2018
2019
2020
PV
Sys
tem
Cap
acit
y (k
W)
300
600
900
1,20
01,
500
1,80
02,
100
2,40
02,
700
3,00
0
Gen
erat
ion
(kW
h)36
2,83
572
5,67
01,
088,
505
1,45
1,34
01,
814,
175
2,17
7,01
02,
539,
845
2,90
2,68
03,
265,
515
3,62
8,35
0
Pow
er G
ener
atio
n w
ith
Intr
oduc
tion
of
PV
Sys
tem
(kW
h)24
7,68
3,31
026
6,30
5,69
028
6,26
2,03
530
5,83
6,60
032
6,35
8,54
534
8,06
8,25
037
1,24
1,44
539
6,23
8,70
042
3,49
8,35
545
3,57
8,94
048
7,15
9,17
552
5,08
7,46
0
Fue
l Con
sum
ptio
n (
)
Diesel
64,6
06,7
9169
,499
,373
74,7
50,4
6279
,917
,842
85,3
50,3
4791
,115
,425
97,2
90,2
8010
3,97
5,87
211
1,29
5,07
711
9,40
4,00
112
8,49
2,82
813
8,79
9,10
8
Lub Oil
247,
683
266,
306
286,
262
305,
837
326,
359
348,
068
371,
241
396,
239
423,
498
453,
579
487,
159
525,
087
Fuel
Red
uct
ion (
)
Diesel
94,8
2118
9,64
228
4,46
337
9,28
447
4,10
456
8,92
566
3,74
675
8,56
785
3,38
894
8,20
9
Lub Oil
363
726
1,08
91,
451
1,81
42,
177
2,54
02,
903
3,26
63,
628
【Power
Supply
by
Gri
d-co
nnec
ted P
V S
yste
m】
S
ourc
e :
Pre
pare
d by
the
Stud
y Te
am
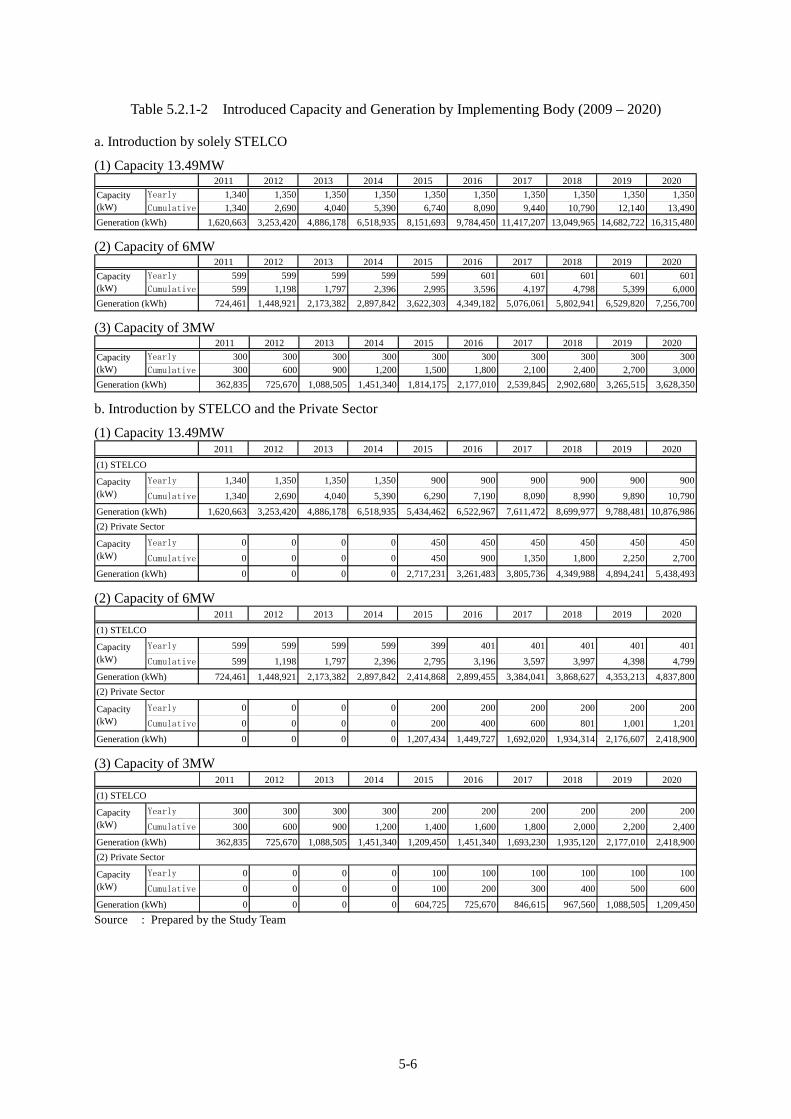
5-6
Table 5.2.1-2 Introduced Capacity and Generation by Implementing Body (2009 – 2020)
a. Introduction by solely STELCO
(1) Capacity 13.49MW 2011 2012 2013 2014 2015 2016 2017 2018 2019 2020
Yearly 1,340 1,350 1,350 1,350 1,350 1,350 1,350 1,350 1,350 1,350
Cumulative 1,340 2,690 4,040 5,390 6,740 8,090 9,440 10,790 12,140 13,490
Generation (kWh) 1,620,663 3,253,420 4,886,178 6,518,935 8,151,693 9,784,450 11,417,207 13,049,965 14,682,722 16,315,480
Capacity(kW)
(2) Capacity of 6MW 2011 2012 2013 2014 2015 2016 2017 2018 2019 2020
Yearly 599 599 599 599 599 601 601 601 601 601
Cumulative 599 1,198 1,797 2,396 2,995 3,596 4,197 4,798 5,399 6,000
Generation (kWh) 724,461 1,448,921 2,173,382 2,897,842 3,622,303 4,349,182 5,076,061 5,802,941 6,529,820 7,256,700
Capacity(kW)
(3) Capacity of 3MW 2011 2012 2013 2014 2015 2016 2017 2018 2019 2020
Yearly 300 300 300 300 300 300 300 300 300 300
Cumulative 300 600 900 1,200 1,500 1,800 2,100 2,400 2,700 3,000
Generation (kWh) 362,835 725,670 1,088,505 1,451,340 1,814,175 2,177,010 2,539,845 2,902,680 3,265,515 3,628,350
Capacity(kW)
b. Introduction by STELCO and the Private Sector
(1) Capacity 13.49MW 2011 2012 2013 2014 2015 2016 2017 2018 2019 2020
Yearly 1,340 1,350 1,350 1,350 900 900 900 900 900 900
Cumulative 1,340 2,690 4,040 5,390 6,290 7,190 8,090 8,990 9,890 10,790
Generation (kWh) 1,620,663 3,253,420 4,886,178 6,518,935 5,434,462 6,522,967 7,611,472 8,699,977 9,788,481 10,876,986
Yearly 0 0 0 0 450 450 450 450 450 450
Cumulative 0 0 0 0 450 900 1,350 1,800 2,250 2,700
Generation (kWh) 0 0 0 0 2,717,231 3,261,483 3,805,736 4,349,988 4,894,241 5,438,493
Capacity(kW)
(2) Private Sector
Capacity(kW)
(1) STELCO
(2) Capacity of 6MW 2011 2012 2013 2014 2015 2016 2017 2018 2019 2020
Yearly 599 599 599 599 399 401 401 401 401 401
Cumulative 599 1,198 1,797 2,396 2,795 3,196 3,597 3,997 4,398 4,799
Generation (kWh) 724,461 1,448,921 2,173,382 2,897,842 2,414,868 2,899,455 3,384,041 3,868,627 4,353,213 4,837,800
Yearly 0 0 0 0 200 200 200 200 200 200
Cumulative 0 0 0 0 200 400 600 801 1,001 1,201
Generation (kWh) 0 0 0 0 1,207,434 1,449,727 1,692,020 1,934,314 2,176,607 2,418,900
Capacity(kW)
(2) Private Sector
Capacity(kW)
(1) STELCO
(3) Capacity of 3MW 2011 2012 2013 2014 2015 2016 2017 2018 2019 2020
Yearly 300 300 300 300 200 200 200 200 200 200
Cumulative 300 600 900 1,200 1,400 1,600 1,800 2,000 2,200 2,400
Generation (kWh) 362,835 725,670 1,088,505 1,451,340 1,209,450 1,451,340 1,693,230 1,935,120 2,177,010 2,418,900
Yearly 0 0 0 0 100 100 100 100 100 100
Cumulative 0 0 0 0 100 200 300 400 500 600
Generation (kWh) 0 0 0 0 604,725 725,670 846,615 967,560 1,088,505 1,209,450
Capacity(kW)
(2) Private Sector
Capacity(kW)
(1) STELCO
Source : Prepared by the Study Team

5-7
5.2.2 Price Forecast of the Grid-Connected PV System
With regard to past price movements of grid-connected PV systems throughout the world, the
International Energy Agency (IEA) has implemented a study, “the Cost and Performance Trends in
Grid-Connected Photovoltaic Systems and Case Studies” covering 11 countries including Japan,
Europe and North America. According to the results of the study, the median value of the
grid-connected PV system cost in each year does not always display a linear trend, however, since the
cost was US$16/W in 1992 and US$8/W in 2006, an overall trend of cost reduction can be seen as
shown in Figure 5.2.2-1.
Note: Capacity of the sample facilities: 73% for less than 10kW, 24% for between 10 and
100 kW, and 4% for more than 100kW Source : International Energy Agency, “Cost and Performance Trends
in Grid-Connected Photovoltaic Systems and Case Studies,” 2007
Figure 5.2.2-1 Movements in Total Cost of Grid-Connected PV Systems
Figure 5.2.2-2 shows movements in the cost of sub-systems and indicates that prices have come down
for all components including modules and inverters, etc.
Source : International Energy Agency, “Cost and Performance Trends
in Grid-Connected Photovoltaic Systems and Case Studies”, 2007
Figure 5.2.2-2 Movements in Grid-Connected PV System Sub-System Costs
Su
b-s
yste
m c
ost
s (U
S$/
W),
Modules
Inverters
BOS
Tota
l co
st (
US
$/W
) ,2
00
5 Median in each year

5-8
Accordingly, it is reported that the reduction in prices for the system components is the contributory
factor to the price reduction of the grid-connected PV systems.
Prospects regarding future price movements in grid-connected PV systems are indicated in NEDO’s
PV Roadmap toward 2030 (PV2030+). According to the roadmap, the cost of PV power generation
will be 23 yen/kWh in 2010 and 14 yen/kWh in 2020 (see Figure 5.2.2-3).
Time for realization(Development Completion)
2010 onwards 2020 (2017) 2030 (2025) 2050
Generation costEquivalent to the cost for
domestic use (23 yen/kWh)Equivalent to the cost for light
and power (14 yen/kWh)Equivalent to the cost forbusiness use (7 yen/kWh)
Use in power source for allpurposes (7 yen/kWh)
Module conversion efficiencyPractical module 16%
(cells for research 20%)Practical module 20%
(cells for research 25%)Practical module 25%
(cells for research 30%)Ultra high efficiency module
40%
Production for domesticmarket (GW/year)
0.5 - 1 2 - 3 6 - 12 25 - 35
Production for overseasmarkets (GW/year)
- 1 - 3 30 - 35 - 300
Main usesDetached houses and public
facilitiesHouses (detached and
collective), public facilities,offices, etc.
Houses (detached andcollective), public facilities,
private businesses, recharging of
Private sector uses, commercialuses, transport, agriculture, and
isolated power sources Source : “Photovoltaic Power Generation Roadmap for 2030 (PV2030+),” New Energy and
Industrial Technology Development Organization (NEDO)
Figure 5.2.2-3 Scenario of PV System Economy Improvement in the Roadmap
The roadmap also sets the development target of PV module production cost at 100 yen/W for 2010,
75 yen/W for 2020, and less than 50 yen/W for 2030.
Based on the forecast scenario in this roadmap, the annual average cost will fall by approximately
3.9% per year for power generation and 2.5% per year for PV module production between 2010 and
2020. Therefore, it is assumed that the cost of the grid-connected PV system over the project period
falls by 2.5% on average per year up to 2020. Table 5.2.2-1 shows the projected PV system price up to
2020 based on this assumption.
●Cost Reduction Scenarios and PV Power Extension
~50 yen/kWh
30 yen/kWh
23 yen/kWh
14 yen/kWh
7 yen/kWh
Less than 7 yen/kWh
Gen
erat
ion
cost
Higher performance and reduced costs enabled by
generational shifts in technology
Higher performance enabled by ultra-thin and multi-coupling and hetero coupling, etc.
Technology innovation geared to higher
performance such as introduction of new
materials, etc. Solar cells comprising new materials and new structures
Introduction of ultra high efficiency (40%)
solar cells based on new principles and
structures
Acceleration of technology development assuming the period
of mass production application
Establishment of mass production systems for crystal
silicon, thin film silicon and CIS, etc. , and improvement in
performance
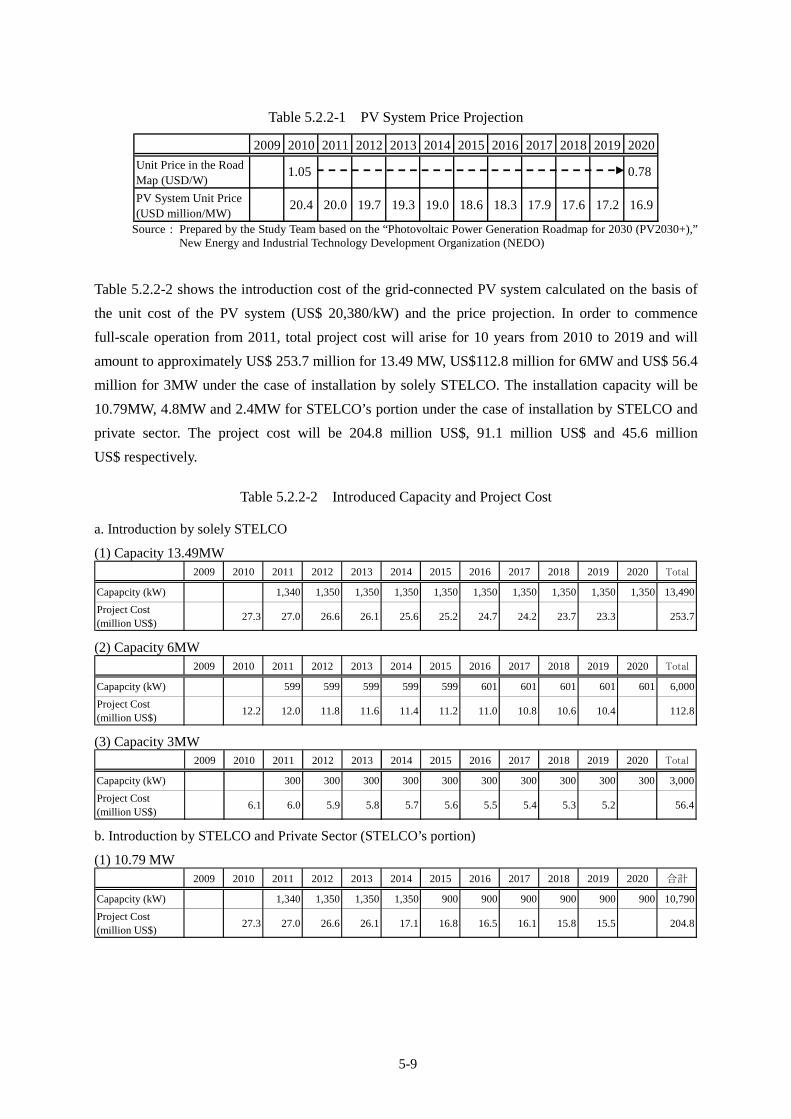
5-9
Table 5.2.2-1 PV System Price Projection
2009 2010 2011 2012 2013 2014 2015 2016 2017 2018 2019 2020
Unit Price in the RoadMap (USD/W)
1.05 0.78
PV System Unit Price(USD million/MW)
20.4 20.0 19.7 19.3 19.0 18.6 18.3 17.9 17.6 17.2 16.9
Source : Prepared by the Study Team based on the “Photovoltaic Power Generation Roadmap for 2030 (PV2030+),” New Energy and Industrial Technology Development Organization (NEDO)
Table 5.2.2-2 shows the introduction cost of the grid-connected PV system calculated on the basis of
the unit cost of the PV system (US$ 20,380/kW) and the price projection. In order to commence
full-scale operation from 2011, total project cost will arise for 10 years from 2010 to 2019 and will
amount to approximately US$ 253.7 million for 13.49 MW, US$112.8 million for 6MW and US$ 56.4
million for 3MW under the case of installation by solely STELCO. The installation capacity will be
10.79MW, 4.8MW and 2.4MW for STELCO’s portion under the case of installation by STELCO and
private sector. The project cost will be 204.8 million US$, 91.1 million US$ and 45.6 million
US$ respectively.
Table 5.2.2-2 Introduced Capacity and Project Cost
a. Introduction by solely STELCO
(1) Capacity 13.49MW 2009 2010 2011 2012 2013 2014 2015 2016 2017 2018 2019 2020 Total
Capapcity (kW) 1,340 1,350 1,350 1,350 1,350 1,350 1,350 1,350 1,350 1,350 13,490
Project Cost(million US$)
27.3 27.0 26.6 26.1 25.6 25.2 24.7 24.2 23.7 23.3 253.7
(2) Capacity 6MW 2009 2010 2011 2012 2013 2014 2015 2016 2017 2018 2019 2020 Total
Capapcity (kW) 599 599 599 599 599 601 601 601 601 601 6,000
Project Cost(million US$)
12.2 12.0 11.8 11.6 11.4 11.2 11.0 10.8 10.6 10.4 112.8
(3) Capacity 3MW 2009 2010 2011 2012 2013 2014 2015 2016 2017 2018 2019 2020 Total
Capapcity (kW) 300 300 300 300 300 300 300 300 300 300 3,000
Project Cost(million US$)
6.1 6.0 5.9 5.8 5.7 5.6 5.5 5.4 5.3 5.2 56.4
b. Introduction by STELCO and Private Sector (STELCO’s portion)
(1) 10.79 MW 2009 2010 2011 2012 2013 2014 2015 2016 2017 2018 2019 2020 合計
Capapcity (kW) 1,340 1,350 1,350 1,350 900 900 900 900 900 900 10,790
Project Cost(million US$)
27.3 27.0 26.6 26.1 17.1 16.8 16.5 16.1 15.8 15.5 204.8

5-10
(2) 4.8 MW 2009 2010 2011 2012 2013 2014 2015 2016 2017 2018 2019 2020 合計
Capapcity (kW) 599 599 599 599 399 401 401 401 401 401 4,799
Project Cost(million US$)
12.2 12.0 11.8 11.6 7.6 7.5 7.3 7.2 7.0 6.9 91.1
(3) 2.4 MW 2009 2010 2011 2012 2013 2014 2015 2016 2017 2018 2019 2020 Total
Capapcity (kW) 300 300 300 300 200 200 200 200 200 200 2,400
Project Cost(million US$)
6.1 6.0 5.9 5.8 3.8 3.7 3.7 3.6 3.5 3.4 45.6
Source : Prepared by the Study Team
5.3 Financial Analysis
5.3.1 Preconditions
(1) Project Period
The project period is 25 years from 2010 to 2034.
(2) Cost
Financial cost consists of investment cost, replacement cost, operation and maintenance cost and
import duties. The preconditions for calculating the costs are as indicated in Section 5.2, while the cost
of introducing the grid-connected PV system is assumed to go down every year in line with the
scenario of PV system cost reduction in the NEDO roadmap. Furthermore, the Maldives has no
corporation tax system as of May 2009, however, such a tax is scheduled for introduction in 2010 and
the maximum tax rate will be set at 15% of profits. However, since it is not clear whether the
corporation tax will be applied to STELCO, financial analysis is conducted assuming that no
corporation tax is levied. Under the case of installation by STELCO and private sector, power
purchasing from the PV system installed by the private sector, it is assumed that the power purchasing
from the private sector is only for excess power from the viewpoint of demand control (see Section
8.2.3, Chapter 8 for the detail institutional framework). It is assumed that rate of excess power
purchasing is 20 percent and purchasing price is MRf 3/kWh which is average of the unit production
cost for 2006 and 20071. In this case, part of the power generated by the PV system will be consumed
at source. STELCO do not need to supply power equivalent to the consumption at source. Therefore,
the operation and maintenance cost for the volume of power generation is counted as negative cost.
1 The purchasing price at the same as or less than the unit production cost is preferable for STELCO. The unit production cost depends on diesel price for the year. As the diesel price range in 2009 is similar to that in 2006 and 2007 so that average for two years is adopted.
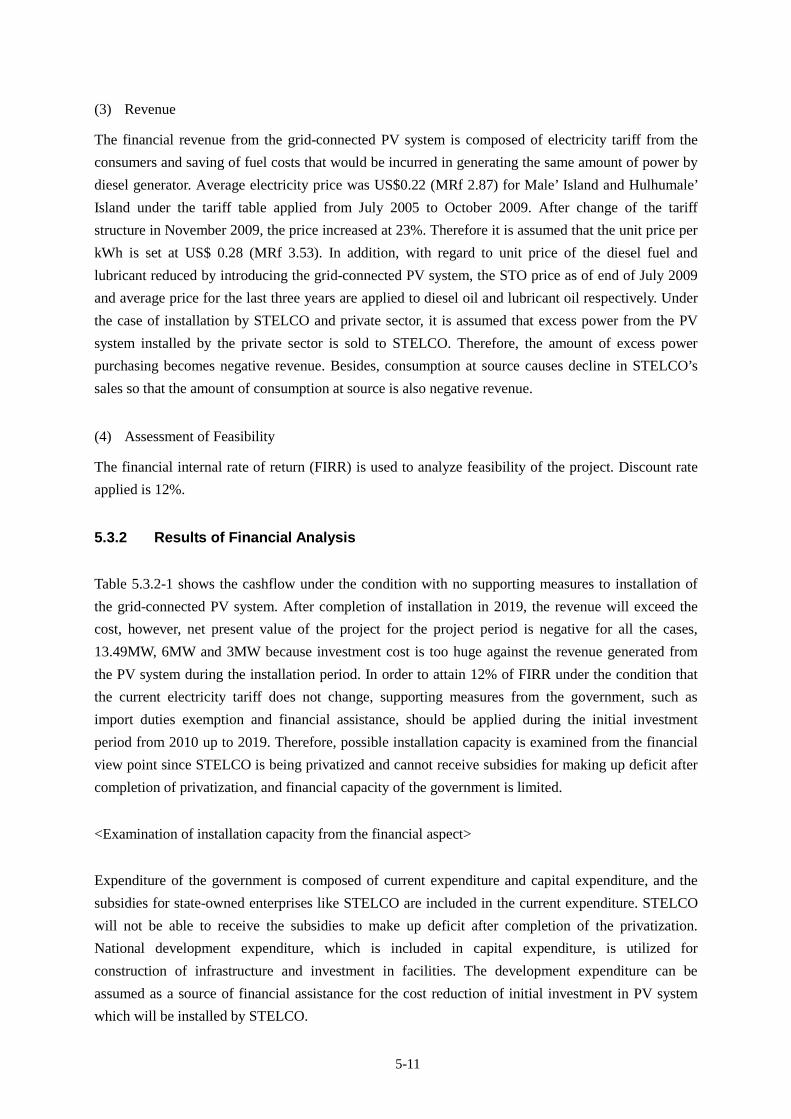
5-11
(3) Revenue
The financial revenue from the grid-connected PV system is composed of electricity tariff from the
consumers and saving of fuel costs that would be incurred in generating the same amount of power by
diesel generator. Average electricity price was US$0.22 (MRf 2.87) for Male’ Island and Hulhumale’
Island under the tariff table applied from July 2005 to October 2009. After change of the tariff
structure in November 2009, the price increased at 23%. Therefore it is assumed that the unit price per
kWh is set at US$ 0.28 (MRf 3.53). In addition, with regard to unit price of the diesel fuel and
lubricant reduced by introducing the grid-connected PV system, the STO price as of end of July 2009
and average price for the last three years are applied to diesel oil and lubricant oil respectively. Under
the case of installation by STELCO and private sector, it is assumed that excess power from the PV
system installed by the private sector is sold to STELCO. Therefore, the amount of excess power
purchasing becomes negative revenue. Besides, consumption at source causes decline in STELCO’s
sales so that the amount of consumption at source is also negative revenue.
(4) Assessment of Feasibility
The financial internal rate of return (FIRR) is used to analyze feasibility of the project. Discount rate
applied is 12%.
5.3.2 Results of Financial Analysis
Table 5.3.2-1 shows the cashflow under the condition with no supporting measures to installation of
the grid-connected PV system. After completion of installation in 2019, the revenue will exceed the
cost, however, net present value of the project for the project period is negative for all the cases,
13.49MW, 6MW and 3MW because investment cost is too huge against the revenue generated from
the PV system during the installation period. In order to attain 12% of FIRR under the condition that
the current electricity tariff does not change, supporting measures from the government, such as
import duties exemption and financial assistance, should be applied during the initial investment
period from 2010 up to 2019. Therefore, possible installation capacity is examined from the financial
view point since STELCO is being privatized and cannot receive subsidies for making up deficit after
completion of privatization, and financial capacity of the government is limited.
<Examination of installation capacity from the financial aspect>
Expenditure of the government is composed of current expenditure and capital expenditure, and the
subsidies for state-owned enterprises like STELCO are included in the current expenditure. STELCO
will not be able to receive the subsidies to make up deficit after completion of the privatization.
National development expenditure, which is included in capital expenditure, is utilized for
construction of infrastructure and investment in facilities. The development expenditure can be
assumed as a source of financial assistance for the cost reduction of initial investment in PV system
which will be installed by STELCO.
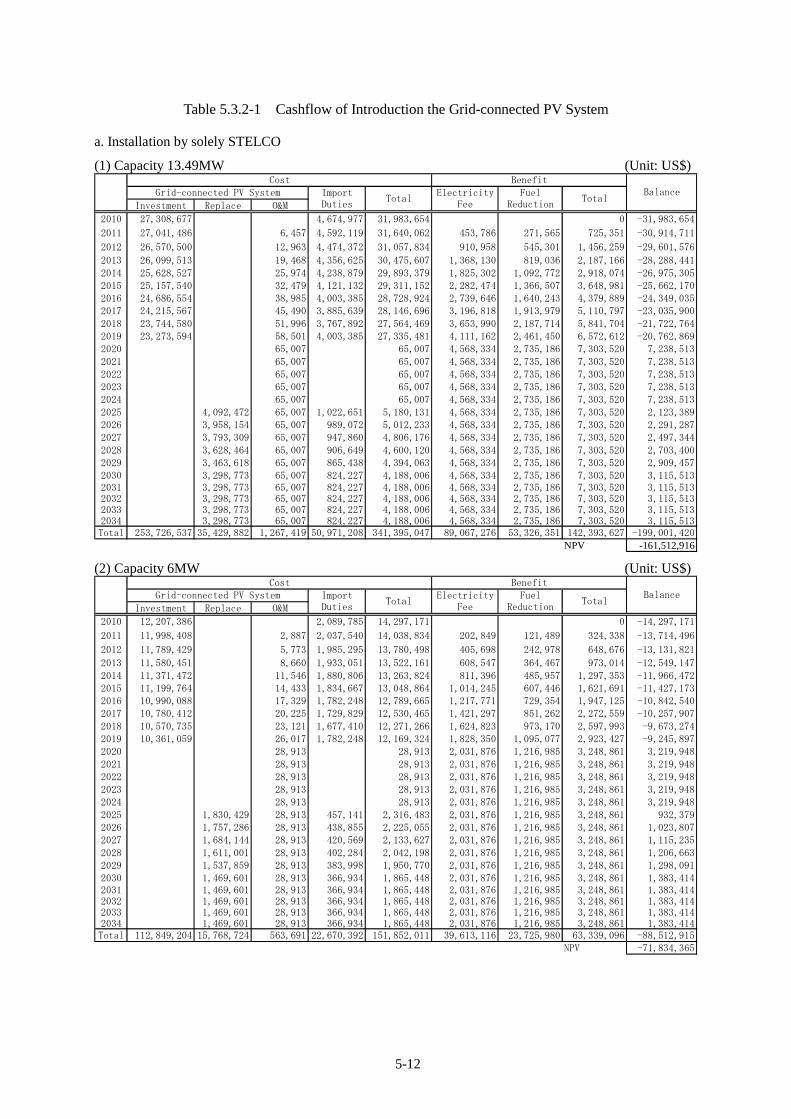
5-12
Table 5.3.2-1 Cashflow of Introduction the Grid-connected PV System
a. Installation by solely STELCO
(1) Capacity 13.49MW (Unit: US$)
Investment Replace O&M
2010 27,308,677 4,674,977 31,983,654 0 -31,983,654
2011 27,041,486 6,457 4,592,119 31,640,062 453,786 271,565 725,351 -30,914,711
2012 26,570,500 12,963 4,474,372 31,057,834 910,958 545,301 1,456,259 -29,601,576
2013 26,099,513 19,468 4,356,625 30,475,607 1,368,130 819,036 2,187,166 -28,288,4412014 25,628,527 25,974 4,238,879 29,893,379 1,825,302 1,092,772 2,918,074 -26,975,3052015 25,157,540 32,479 4,121,132 29,311,152 2,282,474 1,366,507 3,648,981 -25,662,1702016 24,686,554 38,985 4,003,385 28,728,924 2,739,646 1,640,243 4,379,889 -24,349,0352017 24,215,567 45,490 3,885,639 28,146,696 3,196,818 1,913,979 5,110,797 -23,035,9002018 23,744,580 51,996 3,767,892 27,564,469 3,653,990 2,187,714 5,841,704 -21,722,7642019 23,273,594 58,501 4,003,385 27,335,481 4,111,162 2,461,450 6,572,612 -20,762,8692020 65,007 65,007 4,568,334 2,735,186 7,303,520 7,238,5132021 65,007 65,007 4,568,334 2,735,186 7,303,520 7,238,5132022 65,007 65,007 4,568,334 2,735,186 7,303,520 7,238,5132023 65,007 65,007 4,568,334 2,735,186 7,303,520 7,238,5132024 65,007 65,007 4,568,334 2,735,186 7,303,520 7,238,5132025 4,092,472 65,007 1,022,651 5,180,131 4,568,334 2,735,186 7,303,520 2,123,3892026 3,958,154 65,007 989,072 5,012,233 4,568,334 2,735,186 7,303,520 2,291,2872027 3,793,309 65,007 947,860 4,806,176 4,568,334 2,735,186 7,303,520 2,497,3442028 3,628,464 65,007 906,649 4,600,120 4,568,334 2,735,186 7,303,520 2,703,4002029 3,463,618 65,007 865,438 4,394,063 4,568,334 2,735,186 7,303,520 2,909,4572030 3,298,773 65,007 824,227 4,188,006 4,568,334 2,735,186 7,303,520 3,115,5132031 3,298,773 65,007 824,227 4,188,006 4,568,334 2,735,186 7,303,520 3,115,5132032 3,298,773 65,007 824,227 4,188,006 4,568,334 2,735,186 7,303,520 3,115,5132033 3,298,773 65,007 824,227 4,188,006 4,568,334 2,735,186 7,303,520 3,115,5132034 3,298,773 65,007 824,227 4,188,006 4,568,334 2,735,186 7,303,520 3,115,513Total 253,726,537 35,429,882 1,267,419 50,971,208 341,395,047 89,067,276 53,326,351 142,393,627 -199,001,420
NPV -161,512,916
FuelReduction
TotalTotal
Cost BenefitImportDuties
Grid-connected PV System ElectricityFee
Balance
(2) Capacity 6MW (Unit: US$)
Investment Replace O&M
2010 12,207,386 2,089,785 14,297,171 0 -14,297,171
2011 11,998,408 2,887 2,037,540 14,038,834 202,849 121,489 324,338 -13,714,496
2012 11,789,429 5,773 1,985,295 13,780,498 405,698 242,978 648,676 -13,131,821
2013 11,580,451 8,660 1,933,051 13,522,161 608,547 364,467 973,014 -12,549,1472014 11,371,472 11,546 1,880,806 13,263,824 811,396 485,957 1,297,353 -11,966,4722015 11,199,764 14,433 1,834,667 13,048,864 1,014,245 607,446 1,621,691 -11,427,1732016 10,990,088 17,329 1,782,248 12,789,665 1,217,771 729,354 1,947,125 -10,842,5402017 10,780,412 20,225 1,729,829 12,530,465 1,421,297 851,262 2,272,559 -10,257,9072018 10,570,735 23,121 1,677,410 12,271,266 1,624,823 973,170 2,597,993 -9,673,2742019 10,361,059 26,017 1,782,248 12,169,324 1,828,350 1,095,077 2,923,427 -9,245,8972020 28,913 28,913 2,031,876 1,216,985 3,248,861 3,219,9482021 28,913 28,913 2,031,876 1,216,985 3,248,861 3,219,9482022 28,913 28,913 2,031,876 1,216,985 3,248,861 3,219,9482023 28,913 28,913 2,031,876 1,216,985 3,248,861 3,219,9482024 28,913 28,913 2,031,876 1,216,985 3,248,861 3,219,9482025 1,830,429 28,913 457,141 2,316,483 2,031,876 1,216,985 3,248,861 932,3792026 1,757,286 28,913 438,855 2,225,055 2,031,876 1,216,985 3,248,861 1,023,8072027 1,684,144 28,913 420,569 2,133,627 2,031,876 1,216,985 3,248,861 1,115,2352028 1,611,001 28,913 402,284 2,042,198 2,031,876 1,216,985 3,248,861 1,206,6632029 1,537,859 28,913 383,998 1,950,770 2,031,876 1,216,985 3,248,861 1,298,0912030 1,469,601 28,913 366,934 1,865,448 2,031,876 1,216,985 3,248,861 1,383,4142031 1,469,601 28,913 366,934 1,865,448 2,031,876 1,216,985 3,248,861 1,383,4142032 1,469,601 28,913 366,934 1,865,448 2,031,876 1,216,985 3,248,861 1,383,4142033 1,469,601 28,913 366,934 1,865,448 2,031,876 1,216,985 3,248,861 1,383,4142034 1,469,601 28,913 366,934 1,865,448 2,031,876 1,216,985 3,248,861 1,383,414Total 112,849,204 15,768,724 563,691 22,670,392 151,852,011 39,613,116 23,725,980 63,339,096 -88,512,915
NPV -71,834,365
BalanceElectricityFee
FuelReduction
TotalTotal
Cost BenefitImportDuties
Grid-connected PV System
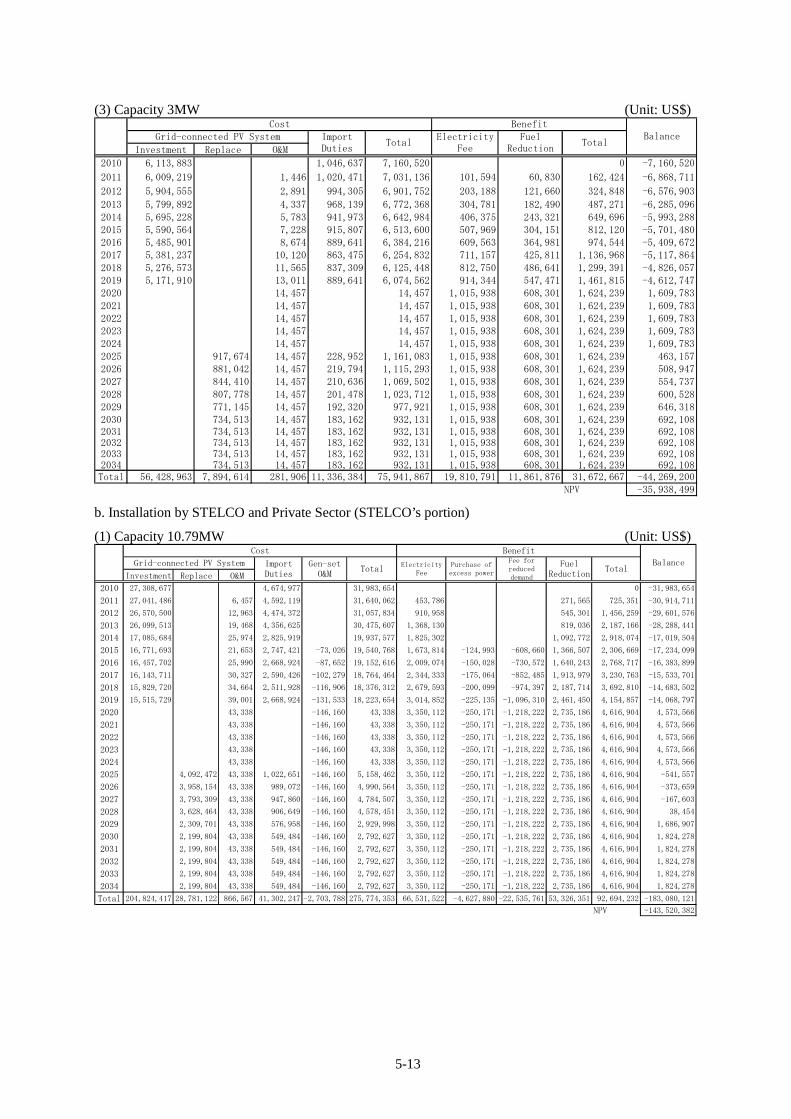
5-13
(3) Capacity 3MW (Unit: US$)
Investment Replace O&M
2010 6,113,883 1,046,637 7,160,520 0 -7,160,520
2011 6,009,219 1,446 1,020,471 7,031,136 101,594 60,830 162,424 -6,868,711
2012 5,904,555 2,891 994,305 6,901,752 203,188 121,660 324,848 -6,576,903
2013 5,799,892 4,337 968,139 6,772,368 304,781 182,490 487,271 -6,285,0962014 5,695,228 5,783 941,973 6,642,984 406,375 243,321 649,696 -5,993,2882015 5,590,564 7,228 915,807 6,513,600 507,969 304,151 812,120 -5,701,4802016 5,485,901 8,674 889,641 6,384,216 609,563 364,981 974,544 -5,409,6722017 5,381,237 10,120 863,475 6,254,832 711,157 425,811 1,136,968 -5,117,8642018 5,276,573 11,565 837,309 6,125,448 812,750 486,641 1,299,391 -4,826,0572019 5,171,910 13,011 889,641 6,074,562 914,344 547,471 1,461,815 -4,612,7472020 14,457 14,457 1,015,938 608,301 1,624,239 1,609,7832021 14,457 14,457 1,015,938 608,301 1,624,239 1,609,7832022 14,457 14,457 1,015,938 608,301 1,624,239 1,609,7832023 14,457 14,457 1,015,938 608,301 1,624,239 1,609,7832024 14,457 14,457 1,015,938 608,301 1,624,239 1,609,7832025 917,674 14,457 228,952 1,161,083 1,015,938 608,301 1,624,239 463,1572026 881,042 14,457 219,794 1,115,293 1,015,938 608,301 1,624,239 508,9472027 844,410 14,457 210,636 1,069,502 1,015,938 608,301 1,624,239 554,7372028 807,778 14,457 201,478 1,023,712 1,015,938 608,301 1,624,239 600,5282029 771,145 14,457 192,320 977,921 1,015,938 608,301 1,624,239 646,3182030 734,513 14,457 183,162 932,131 1,015,938 608,301 1,624,239 692,1082031 734,513 14,457 183,162 932,131 1,015,938 608,301 1,624,239 692,1082032 734,513 14,457 183,162 932,131 1,015,938 608,301 1,624,239 692,1082033 734,513 14,457 183,162 932,131 1,015,938 608,301 1,624,239 692,1082034 734,513 14,457 183,162 932,131 1,015,938 608,301 1,624,239 692,108Total 56,428,963 7,894,614 281,906 11,336,384 75,941,867 19,810,791 11,861,876 31,672,667 -44,269,200
NPV -35,938,499
FuelReduction
TotalTotal
Cost BenefitImportDuties
Grid-connected PV System ElectricityFee
Balance
b. Installation by STELCO and Private Sector (STELCO’s portion)
(1) Capacity 10.79MW (Unit: US$)
Investment Replace O&M
2010 27,308,677 4,674,977 31,983,654 0 -31,983,654
2011 27,041,486 6,457 4,592,119 31,640,062 453,786 271,565 725,351 -30,914,711
2012 26,570,500 12,963 4,474,372 31,057,834 910,958 545,301 1,456,259 -29,601,576
2013 26,099,513 19,468 4,356,625 30,475,607 1,368,130 819,036 2,187,166 -28,288,441
2014 17,085,684 25,974 2,825,919 19,937,577 1,825,302 1,092,772 2,918,074 -17,019,504
2015 16,771,693 21,653 2,747,421 -73,026 19,540,768 1,673,814 -124,993 -608,660 1,366,507 2,306,669 -17,234,099
2016 16,457,702 25,990 2,668,924 -87,652 19,152,616 2,009,074 -150,028 -730,572 1,640,243 2,768,717 -16,383,899
2017 16,143,711 30,327 2,590,426 -102,279 18,764,464 2,344,333 -175,064 -852,485 1,913,979 3,230,763 -15,533,701
2018 15,829,720 34,664 2,511,928 -116,906 18,376,312 2,679,593 -200,099 -974,397 2,187,714 3,692,810 -14,683,502
2019 15,515,729 39,001 2,668,924 -131,533 18,223,654 3,014,852 -225,135 -1,096,310 2,461,450 4,154,857 -14,068,797
2020 43,338 -146,160 43,338 3,350,112 -250,171 -1,218,222 2,735,186 4,616,904 4,573,566
2021 43,338 -146,160 43,338 3,350,112 -250,171 -1,218,222 2,735,186 4,616,904 4,573,566
2022 43,338 -146,160 43,338 3,350,112 -250,171 -1,218,222 2,735,186 4,616,904 4,573,566
2023 43,338 -146,160 43,338 3,350,112 -250,171 -1,218,222 2,735,186 4,616,904 4,573,566
2024 43,338 -146,160 43,338 3,350,112 -250,171 -1,218,222 2,735,186 4,616,904 4,573,566
2025 4,092,472 43,338 1,022,651 -146,160 5,158,462 3,350,112 -250,171 -1,218,222 2,735,186 4,616,904 -541,557
2026 3,958,154 43,338 989,072 -146,160 4,990,564 3,350,112 -250,171 -1,218,222 2,735,186 4,616,904 -373,659
2027 3,793,309 43,338 947,860 -146,160 4,784,507 3,350,112 -250,171 -1,218,222 2,735,186 4,616,904 -167,603
2028 3,628,464 43,338 906,649 -146,160 4,578,451 3,350,112 -250,171 -1,218,222 2,735,186 4,616,904 38,454
2029 2,309,701 43,338 576,958 -146,160 2,929,998 3,350,112 -250,171 -1,218,222 2,735,186 4,616,904 1,686,907
2030 2,199,804 43,338 549,484 -146,160 2,792,627 3,350,112 -250,171 -1,218,222 2,735,186 4,616,904 1,824,278
2031 2,199,804 43,338 549,484 -146,160 2,792,627 3,350,112 -250,171 -1,218,222 2,735,186 4,616,904 1,824,278
2032 2,199,804 43,338 549,484 -146,160 2,792,627 3,350,112 -250,171 -1,218,222 2,735,186 4,616,904 1,824,278
2033 2,199,804 43,338 549,484 -146,160 2,792,627 3,350,112 -250,171 -1,218,222 2,735,186 4,616,904 1,824,278
2034 2,199,804 43,338 549,484 -146,160 2,792,627 3,350,112 -250,171 -1,218,222 2,735,186 4,616,904 1,824,278
Total 204,824,417 28,781,122 866,567 41,302,247 -2,703,788 275,774,353 66,531,522 -4,627,880 -22,535,761 53,326,351 92,694,232 -183,080,121
NPV -143,520,382
FuelReduction
TotalTotal
Cost Benefit
ImportDuties
Grid-connected PV System Purchase ofexcess power
Fee forreduceddemand
ElectricityFee
Gen-setO&M
Balance
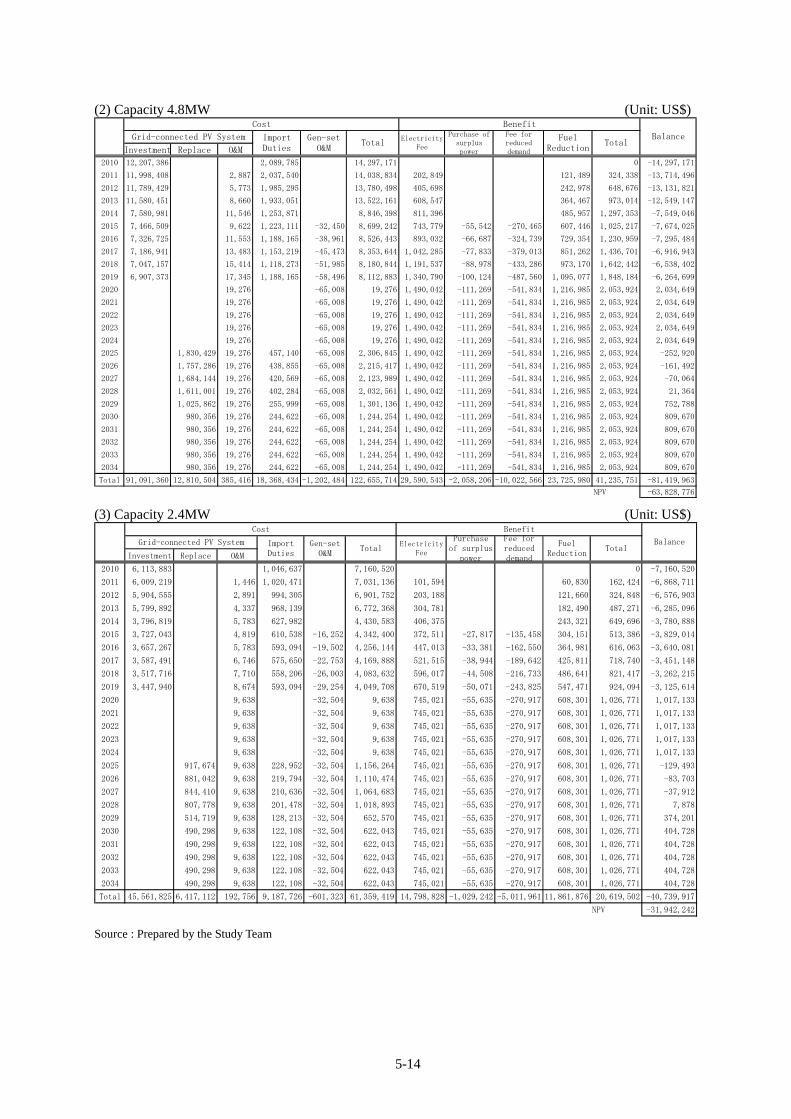
5-14
(2) Capacity 4.8MW (Unit: US$)
Investment Replace O&M
2010 12,207,386 2,089,785 14,297,171 0 -14,297,171
2011 11,998,408 2,887 2,037,540 14,038,834 202,849 121,489 324,338 -13,714,496
2012 11,789,429 5,773 1,985,295 13,780,498 405,698 242,978 648,676 -13,131,821
2013 11,580,451 8,660 1,933,051 13,522,161 608,547 364,467 973,014 -12,549,147
2014 7,580,981 11,546 1,253,871 8,846,398 811,396 485,957 1,297,353 -7,549,046
2015 7,466,509 9,622 1,223,111 -32,450 8,699,242 743,779 -55,542 -270,465 607,446 1,025,217 -7,674,025
2016 7,326,725 11,553 1,188,165 -38,961 8,526,443 893,032 -66,687 -324,739 729,354 1,230,959 -7,295,484
2017 7,186,941 13,483 1,153,219 -45,473 8,353,644 1,042,285 -77,833 -379,013 851,262 1,436,701 -6,916,943
2018 7,047,157 15,414 1,118,273 -51,985 8,180,844 1,191,537 -88,978 -433,286 973,170 1,642,442 -6,538,402
2019 6,907,373 17,345 1,188,165 -58,496 8,112,883 1,340,790 -100,124 -487,560 1,095,077 1,848,184 -6,264,699
2020 19,276 -65,008 19,276 1,490,042 -111,269 -541,834 1,216,985 2,053,924 2,034,649
2021 19,276 -65,008 19,276 1,490,042 -111,269 -541,834 1,216,985 2,053,924 2,034,649
2022 19,276 -65,008 19,276 1,490,042 -111,269 -541,834 1,216,985 2,053,924 2,034,649
2023 19,276 -65,008 19,276 1,490,042 -111,269 -541,834 1,216,985 2,053,924 2,034,649
2024 19,276 -65,008 19,276 1,490,042 -111,269 -541,834 1,216,985 2,053,924 2,034,649
2025 1,830,429 19,276 457,140 -65,008 2,306,845 1,490,042 -111,269 -541,834 1,216,985 2,053,924 -252,920
2026 1,757,286 19,276 438,855 -65,008 2,215,417 1,490,042 -111,269 -541,834 1,216,985 2,053,924 -161,492
2027 1,684,144 19,276 420,569 -65,008 2,123,989 1,490,042 -111,269 -541,834 1,216,985 2,053,924 -70,064
2028 1,611,001 19,276 402,284 -65,008 2,032,561 1,490,042 -111,269 -541,834 1,216,985 2,053,924 21,364
2029 1,025,862 19,276 255,999 -65,008 1,301,136 1,490,042 -111,269 -541,834 1,216,985 2,053,924 752,788
2030 980,356 19,276 244,622 -65,008 1,244,254 1,490,042 -111,269 -541,834 1,216,985 2,053,924 809,670
2031 980,356 19,276 244,622 -65,008 1,244,254 1,490,042 -111,269 -541,834 1,216,985 2,053,924 809,670
2032 980,356 19,276 244,622 -65,008 1,244,254 1,490,042 -111,269 -541,834 1,216,985 2,053,924 809,670
2033 980,356 19,276 244,622 -65,008 1,244,254 1,490,042 -111,269 -541,834 1,216,985 2,053,924 809,670
2034 980,356 19,276 244,622 -65,008 1,244,254 1,490,042 -111,269 -541,834 1,216,985 2,053,924 809,670
Total 91,091,360 12,810,504 385,416 18,368,434 -1,202,484 122,655,714 29,590,543 -2,058,206 -10,022,566 23,725,980 41,235,751 -81,419,963
NPV -63,828,776
FuelReduction
TotalTotal
Cost Benefit
ImportDuties
Grid-connected PV System Gen-setO&M
Purchase ofsurpluspower
Fee forreduceddemand
ElectricityFee
Balance
(3) Capacity 2.4MW (Unit: US$)
Investment Replace O&M
2010 6,113,883 1,046,637 7,160,520 0 -7,160,520
2011 6,009,219 1,446 1,020,471 7,031,136 101,594 60,830 162,424 -6,868,711
2012 5,904,555 2,891 994,305 6,901,752 203,188 121,660 324,848 -6,576,903
2013 5,799,892 4,337 968,139 6,772,368 304,781 182,490 487,271 -6,285,096
2014 3,796,819 5,783 627,982 4,430,583 406,375 243,321 649,696 -3,780,888
2015 3,727,043 4,819 610,538 -16,252 4,342,400 372,511 -27,817 -135,458 304,151 513,386 -3,829,014
2016 3,657,267 5,783 593,094 -19,502 4,256,144 447,013 -33,381 -162,550 364,981 616,063 -3,640,081
2017 3,587,491 6,746 575,650 -22,753 4,169,888 521,515 -38,944 -189,642 425,811 718,740 -3,451,148
2018 3,517,716 7,710 558,206 -26,003 4,083,632 596,017 -44,508 -216,733 486,641 821,417 -3,262,215
2019 3,447,940 8,674 593,094 -29,254 4,049,708 670,519 -50,071 -243,825 547,471 924,094 -3,125,614
2020 9,638 -32,504 9,638 745,021 -55,635 -270,917 608,301 1,026,771 1,017,133
2021 9,638 -32,504 9,638 745,021 -55,635 -270,917 608,301 1,026,771 1,017,133
2022 9,638 -32,504 9,638 745,021 -55,635 -270,917 608,301 1,026,771 1,017,133
2023 9,638 -32,504 9,638 745,021 -55,635 -270,917 608,301 1,026,771 1,017,133
2024 9,638 -32,504 9,638 745,021 -55,635 -270,917 608,301 1,026,771 1,017,133
2025 917,674 9,638 228,952 -32,504 1,156,264 745,021 -55,635 -270,917 608,301 1,026,771 -129,493
2026 881,042 9,638 219,794 -32,504 1,110,474 745,021 -55,635 -270,917 608,301 1,026,771 -83,703
2027 844,410 9,638 210,636 -32,504 1,064,683 745,021 -55,635 -270,917 608,301 1,026,771 -37,912
2028 807,778 9,638 201,478 -32,504 1,018,893 745,021 -55,635 -270,917 608,301 1,026,771 7,878
2029 514,719 9,638 128,213 -32,504 652,570 745,021 -55,635 -270,917 608,301 1,026,771 374,201
2030 490,298 9,638 122,108 -32,504 622,043 745,021 -55,635 -270,917 608,301 1,026,771 404,728
2031 490,298 9,638 122,108 -32,504 622,043 745,021 -55,635 -270,917 608,301 1,026,771 404,728
2032 490,298 9,638 122,108 -32,504 622,043 745,021 -55,635 -270,917 608,301 1,026,771 404,728
2033 490,298 9,638 122,108 -32,504 622,043 745,021 -55,635 -270,917 608,301 1,026,771 404,728
2034 490,298 9,638 122,108 -32,504 622,043 745,021 -55,635 -270,917 608,301 1,026,771 404,728
Total 45,561,825 6,417,112 192,756 9,187,726 -601,323 61,359,419 14,798,828 -1,029,242 -5,011,961 11,861,876 20,619,502 -40,739,917
NPV -31,942,242
BalanceElectricityFee
Gen-setO&M
FuelReduction
TotalTotal
Cost Benefit
ImportDuties
Grid-connected PV System Purchaseof surplus
power
Fee forreduceddemand
Source : Prepared by the Study Team
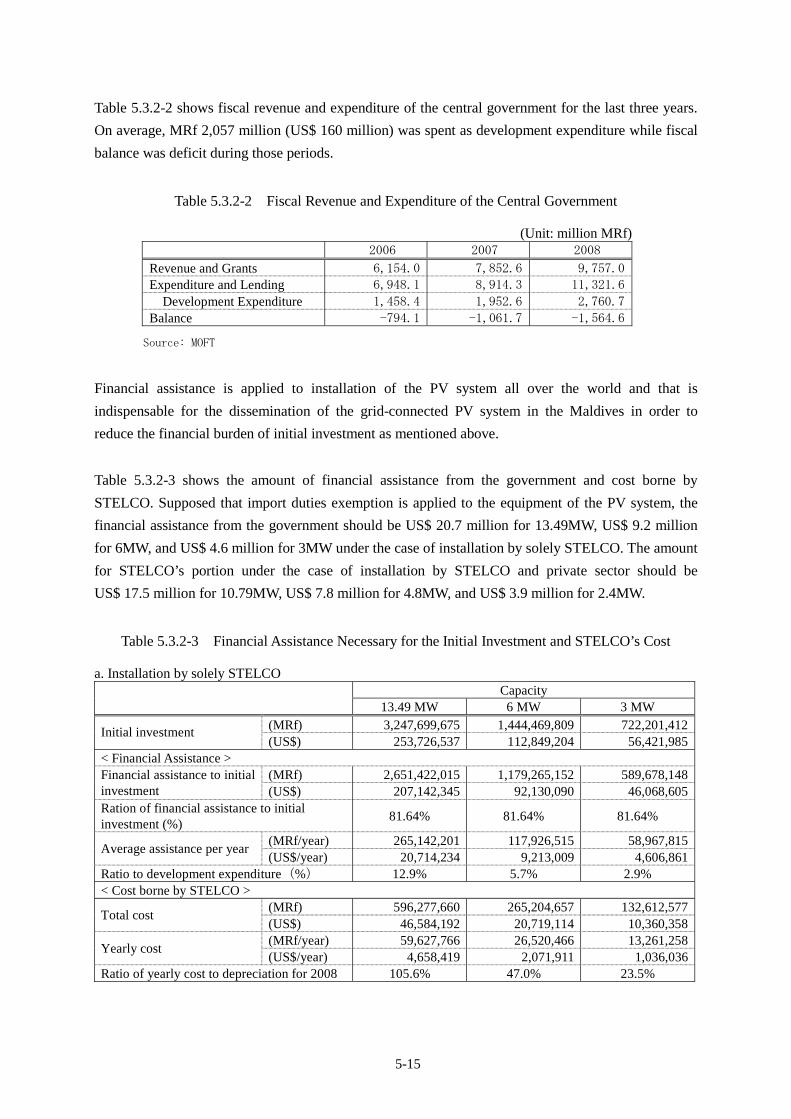
5-15
Table 5.3.2-2 shows fiscal revenue and expenditure of the central government for the last three years.
On average, MRf 2,057 million (US$ 160 million) was spent as development expenditure while fiscal
balance was deficit during those periods.
Table 5.3.2-2 Fiscal Revenue and Expenditure of the Central Government
(Unit: million MRf) 2006 2007 2008
Revenue and Grants 6,154.0 7,852.6 9,757.0Expenditure and Lending 6,948.1 8,914.3 11,321.6
Development Expenditure 1,458.4 1,952.6 2,760.7
Balance -794.1 -1,061.7 -1,564.6
Source: MOFT
Financial assistance is applied to installation of the PV system all over the world and that is
indispensable for the dissemination of the grid-connected PV system in the Maldives in order to
reduce the financial burden of initial investment as mentioned above.
Table 5.3.2-3 shows the amount of financial assistance from the government and cost borne by
STELCO. Supposed that import duties exemption is applied to the equipment of the PV system, the
financial assistance from the government should be US$ 20.7 million for 13.49MW, US$ 9.2 million
for 6MW, and US$ 4.6 million for 3MW under the case of installation by solely STELCO. The amount
for STELCO’s portion under the case of installation by STELCO and private sector should be
US$ 17.5 million for 10.79MW, US$ 7.8 million for 4.8MW, and US$ 3.9 million for 2.4MW.
Table 5.3.2-3 Financial Assistance Necessary for the Initial Investment and STELCO’s Cost
a. Installation by solely STELCO Capacity
13.49 MW 6 MW 3 MW
(MRf) 3,247,699,675 1,444,469,809 722,201,412Initial investment (US$) 253,726,537 112,849,204 56,421,985
< Financial Assistance > (MRf) 2,651,422,015 1,179,265,152 589,678,148Financial assistance to initial
investment (US$) 207,142,345 92,130,090 46,068,605Ration of financial assistance to initial investment (%)
81.64% 81.64% 81.64%
(MRf/year) 265,142,201 117,926,515 58,967,815Average assistance per year
(US$/year) 20,714,234 9,213,009 4,606,861Ratio to development expenditure(%) 12.9% 5.7% 2.9% < Cost borne by STELCO >
(MRf) 596,277,660 265,204,657 132,612,577Total cost
(US$) 46,584,192 20,719,114 10,360,358(MRf/year) 59,627,766 26,520,466 13,261,258
Yearly cost (US$/year) 4,658,419 2,071,911 1,036,036
Ratio of yearly cost to depreciation for 2008 105.6% 47.0% 23.5%
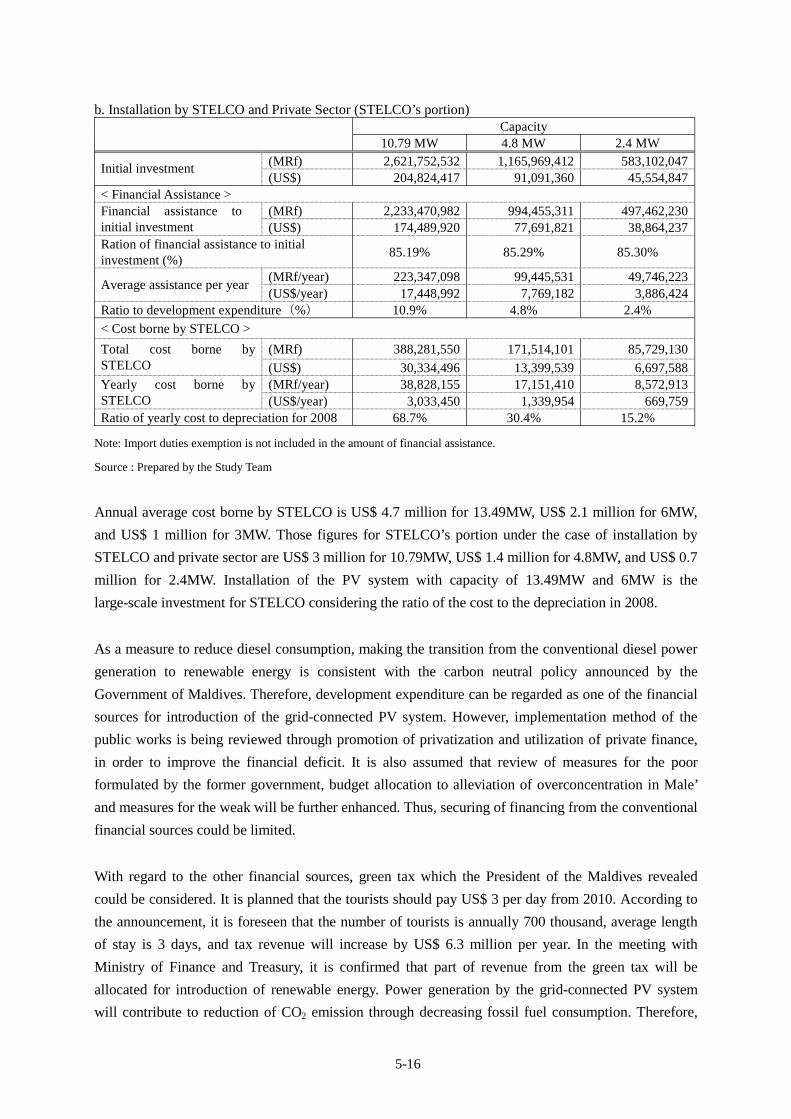
5-16
b. Installation by STELCO and Private Sector (STELCO’s portion) Capacity
10.79 MW 4.8 MW 2.4 MW
(MRf) 2,621,752,532 1,165,969,412 583,102,047Initial investment (US$) 204,824,417 91,091,360 45,554,847
< Financial Assistance > (MRf) 2,233,470,982 994,455,311 497,462,230Financial assistance to
initial investment (US$) 174,489,920 77,691,821 38,864,237Ration of financial assistance to initial investment (%)
85.19% 85.29% 85.30%
(MRf/year) 223,347,098 99,445,531 49,746,223Average assistance per year
(US$/year) 17,448,992 7,769,182 3,886,424Ratio to development expenditure(%) 10.9% 4.8% 2.4%
< Cost borne by STELCO >
(MRf) 388,281,550 171,514,101 85,729,130Total cost borne by STELCO (US$) 30,334,496 13,399,539 6,697,588
(MRf/year) 38,828,155 17,151,410 8,572,913Yearly cost borne by STELCO (US$/year) 3,033,450 1,339,954 669,759Ratio of yearly cost to depreciation for 2008 68.7% 30.4% 15.2%
Note: Import duties exemption is not included in the amount of financial assistance.
Source : Prepared by the Study Team
Annual average cost borne by STELCO is US$ 4.7 million for 13.49MW, US$ 2.1 million for 6MW,
and US$ 1 million for 3MW. Those figures for STELCO’s portion under the case of installation by
STELCO and private sector are US$ 3 million for 10.79MW, US$ 1.4 million for 4.8MW, and US$ 0.7
million for 2.4MW. Installation of the PV system with capacity of 13.49MW and 6MW is the
large-scale investment for STELCO considering the ratio of the cost to the depreciation in 2008.
As a measure to reduce diesel consumption, making the transition from the conventional diesel power
generation to renewable energy is consistent with the carbon neutral policy announced by the
Government of Maldives. Therefore, development expenditure can be regarded as one of the financial
sources for introduction of the grid-connected PV system. However, implementation method of the
public works is being reviewed through promotion of privatization and utilization of private finance,
in order to improve the financial deficit. It is also assumed that review of measures for the poor
formulated by the former government, budget allocation to alleviation of overconcentration in Male’
and measures for the weak will be further enhanced. Thus, securing of financing from the conventional
financial sources could be limited.
With regard to the other financial sources, green tax which the President of the Maldives revealed
could be considered. It is planned that the tourists should pay US$ 3 per day from 2010. According to
the announcement, it is foreseen that the number of tourists is annually 700 thousand, average length
of stay is 3 days, and tax revenue will increase by US$ 6.3 million per year. In the meeting with
Ministry of Finance and Treasury, it is confirmed that part of revenue from the green tax will be
allocated for introduction of renewable energy. Power generation by the grid-connected PV system
will contribute to reduction of CO2 emission through decreasing fossil fuel consumption. Therefore,

5-17
utilization of the tax revenue for introduction of the PV system seems to be consistent with the
objective of the green tax.
For the capacity of 13.49MW and 6MW, the annual average amount of financial assistance to the
initial investment cost exceeds the revenue of 6.3 million US$ from the green tax. For the capacity of
3MW, the annual average amount of financial assistance to the initial investment cost is US$ 4.6
million under the case of installation by solely STELCO, which is equivalent to about 73 percent of
the annual revenue from the green tax. Installation of the PV system with the capacity of 3MW can be
realized when the amount can be allocated for that every year. Under the case of installation by
STELCO and private sector, STELCO’s portion is 2.4MW and the financial assistance for the initial
investment from the government is US$ 3.9 million, which is equivalent to about 61 percent of the
annual revenue from the green tax. As explained above, the maximum possible capacity is 13.49MW
in Male’ and Hulhumale, however, the capacity over 10MW is very huge in the world. Considering the
financial constraints of both the government and STELCO mentioned above, 3MW is the installation
capacity which can be realized with utilization of green tax as a source of financial assistance from the
government. Table 5.3.2-4 shows cashflow for introduction of the grid-connected PV system with
capacity of 3MW under the condition that import duties exemption and financial assistance from the
government is provided to the initial investment cost. Table 5.3.2-4 b. shows the results of analysis
under the conditions that excess power from power generation by privately installed PV system is 20%
and purchasing price is MRf 3/kWh which is equivalent to the unit production cost.
Table 5.3.2-4 Cashflow for Introduction of the Grid-Connected PV System with Capacity of 3MW
a. Installation by solely STELCO (Unit: US$)
Investment Replace O&M
2010 1,122,509 1,122,509 0 -1,122,509
2011 1,103,293 1,446 1,104,738 101,594 60,830 162,424 -942,314
2012 1,084,076 2,891 1,086,968 203,188 121,660 324,848 -762,119
2013 1,064,860 4,337 1,069,197 304,781 182,490 487,271 -581,9262014 1,045,644 5,783 1,051,427 406,375 243,321 649,696 -401,7312015 1,026,428 7,228 1,033,656 507,969 304,151 812,120 -221,5362016 1,007,211 8,674 1,015,885 609,563 364,981 974,544 -41,3422017 987,995 10,120 998,115 711,157 425,811 1,136,968 138,8532018 968,779 11,565 980,344 812,750 486,641 1,299,391 319,0472019 949,563 13,011 962,574 914,344 547,471 1,461,815 499,2422020 14,457 14,457 1,015,938 608,301 1,624,239 1,609,7832021 14,457 14,457 1,015,938 608,301 1,624,239 1,609,7832022 14,457 14,457 1,015,938 608,301 1,624,239 1,609,7832023 14,457 14,457 1,015,938 608,301 1,624,239 1,609,7832024 14,457 14,457 1,015,938 608,301 1,624,239 1,609,7832025 917,674 14,457 932,131 1,015,938 608,301 1,624,239 692,1082026 881,042 14,457 895,499 1,015,938 608,301 1,624,239 728,7412027 844,410 14,457 858,867 1,015,938 608,301 1,624,239 765,3732028 807,778 14,457 822,234 1,015,938 608,301 1,624,239 802,0052029 771,145 14,457 785,602 1,015,938 608,301 1,624,239 838,6372030 734,513 14,457 748,970 1,015,938 608,301 1,624,239 875,2702031 734,513 14,457 748,970 1,015,938 608,301 1,624,239 875,2702032 734,513 14,457 748,970 1,015,938 608,301 1,624,239 875,2702033 734,513 14,457 748,970 1,015,938 608,301 1,624,239 875,2702034 734,513 14,457 748,970 1,015,938 608,301 1,624,239 875,270Total 10,360,358 7,894,614 281,906 0 18,536,877 19,810,791 11,861,876 31,672,667 13,135,790
NPV 1,496FIRR 12.00%
FuelReduction
TotalTotal
Cost BenefitImportDuties
Grid-connected PV System ElectricityFee
Balance

5-18
b. Installation by STELCO and Private Sector (STELCO’s portion 2.4MW) (Unit: US$)
Investment Replace O&M
2010 898,741 898,741 0 -898,741
2011 883,355 1,446 884,801 101,594 60,830 162,424 -722,377
2012 867,970 2,891 870,861 203,188 121,660 324,848 -546,013
2013 852,584 4,337 856,921 304,781 182,490 487,271 -369,650
2014 558,132 5,783 563,915 406,375 243,321 649,696 85,781
2015 547,875 4,819 -16,252 536,442 372,511 -27,817 -135,458 304,151 513,386 -23,056
2016 537,618 5,783 -19,502 523,899 447,013 -33,381 -162,550 364,981 616,063 92,164
2017 527,361 6,746 -22,753 511,355 521,515 -38,944 -189,642 425,811 718,740 207,385
2018 517,104 7,710 -26,003 498,811 596,017 -44,508 -216,733 486,641 821,417 322,606
2019 506,847 8,674 -29,254 486,268 670,519 -50,071 -243,825 547,471 924,094 437,826
2020 9,638 -32,504 -22,866 745,021 -55,635 -270,917 608,301 1,026,771 1,049,637
2021 9,638 -32,504 -22,866 745,021 -55,635 -270,917 608,301 1,026,771 1,049,637
2022 9,638 -32,504 -22,866 745,021 -55,635 -270,917 608,301 1,026,771 1,049,637
2023 9,638 -32,504 -22,866 745,021 -55,635 -270,917 608,301 1,026,771 1,049,637
2024 9,638 -32,504 -22,866 745,021 -55,635 -270,917 608,301 1,026,771 1,049,637
2025 917,674 9,638 -32,504 894,808 745,021 -55,635 -270,917 608,301 1,026,771 131,963
2026 881,042 9,638 -32,504 858,176 745,021 -55,635 -270,917 608,301 1,026,771 168,595
2027 844,410 9,638 -32,504 821,544 745,021 -55,635 -270,917 608,301 1,026,771 205,227
2028 807,778 9,638 -32,504 784,911 745,021 -55,635 -270,917 608,301 1,026,771 241,859
2029 514,719 9,638 -32,504 491,853 745,021 -55,635 -270,917 608,301 1,026,771 534,918
2030 490,298 9,638 -32,504 467,432 745,021 -55,635 -270,917 608,301 1,026,771 559,339
2031 490,298 9,638 -32,504 467,432 745,021 -55,635 -270,917 608,301 1,026,771 559,339
2032 490,298 9,638 -32,504 467,432 745,021 -55,635 -270,917 608,301 1,026,771 559,339
2033 490,298 9,638 -32,504 467,432 745,021 -55,635 -270,917 608,301 1,026,771 559,339
2034 490,298 9,638 -32,504 467,432 745,021 -55,635 -270,917 608,301 1,026,771 559,339
Total 6,697,588 6,417,112 192,756 -601,323 0 12,706,133 14,798,828 -1,029,242 -5,011,961 11,861,876 20,619,502 7,913,369
NPV 1,616FIRR 12.01%
ImportDuties
BalanceElectricityFee
Total
Cost Benefit
Gen-setO&M
Grid-connected PV System FuelReduction
TotalPurchase of
surpluspower
Fee forreduceddemand
Source : Prepared by the Study Team
Next, cases of different contribution rates from the green tax for financial assistance are examined. As
mentioned above, 3MW of the PV system can be installed under the case of installation by solely
STELCO when 4.6 million US$ is provided, which is equivalent to 73 % of annual tax revenue from
the green tax. However, if the percentage decreases to 50 or 30 %, shortfall should be covered by any
other financial sources. As shown in Table 5.3.2-5, under the case of installation by solely STELCO,
allowable amount and shortfall is 3.2 million US$ and 1.5 million US$ for contribution rate of 50%,
and 1.9 million US$ and 2.7 million US$ for contribution rate of 30% respectively. In the same way,
shortfall is 0.7 million US$ for 50% and 2 million US$ for 30% to the STELCO’s portion under the
case of installation by STELCO and private sector.
As discussed, the Government of Maldives is promoting the financial reform and provision of
large-scale financial assistance from the national development expenditure to the initial investment
would be difficult. However, part of the financial assistance, which could not be covered by the other
financial sources, would be derived from the development expenditure. Ratio of the shortfall to the
development expenditure is within the range between 0.5 percent and 1.7 percent for the case of
contribution rates of 50% and 30% respectively. The percentage is less than the figures shown in Table
5.3.2-3 b., which is under the case of providing all the assistance from the development expenditure.
Therefore, the national development expenditure also can be considered as a financial source for
alleviation of financial burden on initial investment, combined with the other financial sources.
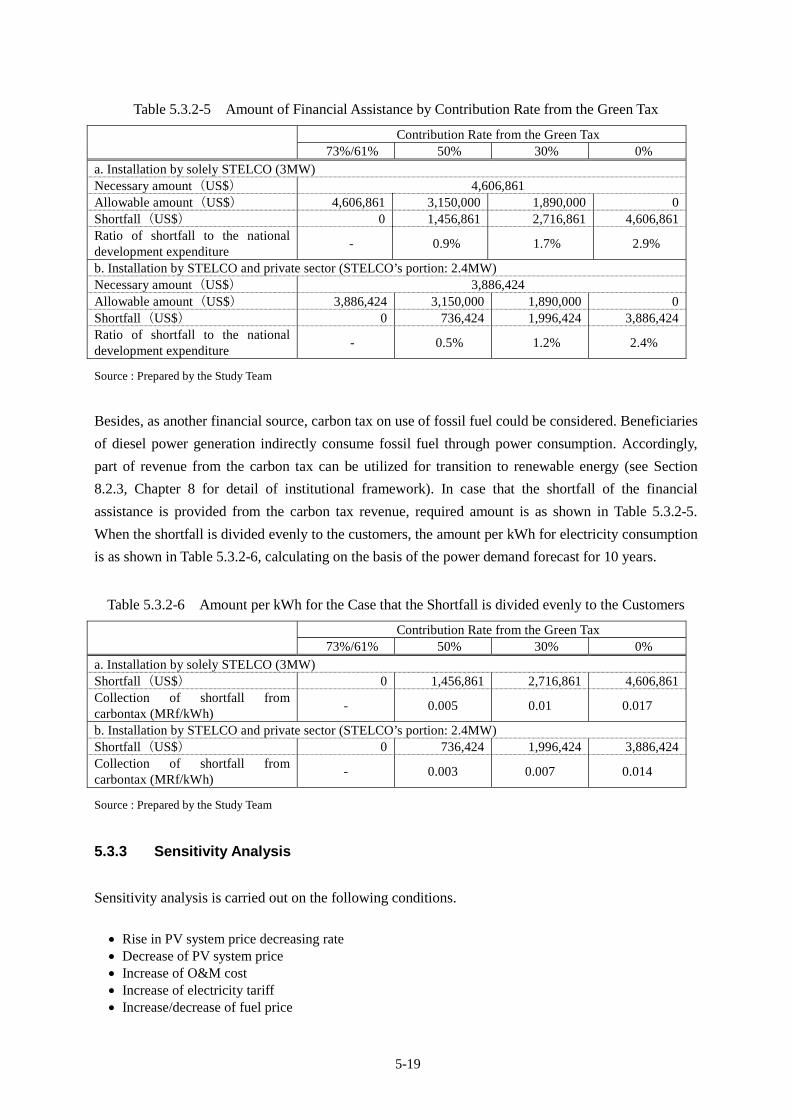
5-19
Table 5.3.2-5 Amount of Financial Assistance by Contribution Rate from the Green Tax
Contribution Rate from the Green Tax 73%/61% 50% 30% 0%
a. Installation by solely STELCO (3MW) Necessary amount(US$) 4,606,861 Allowable amount(US$) 4,606,861 3,150,000 1,890,000 0Shortfall(US$) 0 1,456,861 2,716,861 4,606,861Ratio of shortfall to the national development expenditure
- 0.9% 1.7% 2.9%
b. Installation by STELCO and private sector (STELCO’s portion: 2.4MW) Necessary amount(US$) 3,886,424 Allowable amount(US$) 3,886,424 3,150,000 1,890,000 0Shortfall(US$) 0 736,424 1,996,424 3,886,424Ratio of shortfall to the national development expenditure
- 0.5% 1.2% 2.4%
Source : Prepared by the Study Team
Besides, as another financial source, carbon tax on use of fossil fuel could be considered. Beneficiaries
of diesel power generation indirectly consume fossil fuel through power consumption. Accordingly,
part of revenue from the carbon tax can be utilized for transition to renewable energy (see Section
8.2.3, Chapter 8 for detail of institutional framework). In case that the shortfall of the financial
assistance is provided from the carbon tax revenue, required amount is as shown in Table 5.3.2-5.
When the shortfall is divided evenly to the customers, the amount per kWh for electricity consumption
is as shown in Table 5.3.2-6, calculating on the basis of the power demand forecast for 10 years.
Table 5.3.2-6 Amount per kWh for the Case that the Shortfall is divided evenly to the Customers
Contribution Rate from the Green Tax 73%/61% 50% 30% 0%
a. Installation by solely STELCO (3MW) Shortfall(US$) 0 1,456,861 2,716,861 4,606,861Collection of shortfall from carbontax (MRf/kWh)
- 0.005 0.01 0.017
b. Installation by STELCO and private sector (STELCO’s portion: 2.4MW) Shortfall(US$) 0 736,424 1,996,424 3,886,424Collection of shortfall from carbontax (MRf/kWh)
- 0.003 0.007 0.014
Source : Prepared by the Study Team
5.3.3 Sensitivity Analysis
Sensitivity analysis is carried out on the following conditions.
Rise in PV system price decreasing rate Decrease of PV system price Increase of O&M cost Increase of electricity tariff Increase/decrease of fuel price

5-20
Regarding the rise in decreasing rate of the PV system price, the case that increase of supply in Japan,
Europe and U.S. and commencement of production in emerging countries like India and China expand
the production in the world and the system price decrease faster than that described in the NEDO’s PV
Road Map is examined. As for the base case, PV system price decreasing rate is 2.5% per year in line
with the PV Road Map. The cases of 3 percent and 3.5 percent up to 2020 are examined in the
sensitivity analysis. Table 5.3.3-1 shows the results of the analysis.
Table 5.3.3-1 Results of the Cases of Rise in Decreasing Rate of the PV System Price
Installation by solely STELCO (3MW) Installation by STELCO and Private Sector
(STELCO’s Portion) (2.4MW) Decreasing
Rate FIRR (%) Ratio of Financial Assistance
which meet FIRR12% (%) FIRR (%)
Ratio of Financial Assistance which meet FIRR12% (%)
Base Case (2.5%)
12.00 81.64 12.01 85.30
3.0% 12.25 81.40 12.23 85.13 3.5% 12.50 81.15 12.46 84.96
Source : Prepared by the Study Team
Cases where the unit system cost is 5 percent and 10 percent less are examined. Decreasing rate of the
unit price is 2.5 percent per year as set in the NEDO’s PV Road Map. Table 5.3.3-2 shows the results
of the analysis.
Table 5.3.3-2 Results of the Cases of Initial Unit Price Decrease in PV System
Installation by solely STELCO (3MW) Installation by STELCO and Private Sector
(STELCO’s Portion) (2.4MW) Decreasing
Rate FIRR (%) Ratio of Financial Assistance
which meet FIRR12% (%) FIRR (%)
Ratio of Financial Assistance which meet FIRR12% (%)
Base Case 12.00 81.64 12.01 85.30 5% less 12.77 80.88 12.86 84.66 10% less 13.56 80.06 13.75 83.97
Source : Prepared by the Study Team
Regarding the O&M cost, the cases of 10 percent and 20 percent more than the base case are
examined. Table 5.3.3-3 shows the results of the analysis.
Table 5.3.3-3 Results of the Cases of Increase in O&M Cost
Installation by solely STELCO (3MW) Installation by STELCO and Private Sector
(STELCO’s Portion) (2.4MW) O&M Cost
FIRR (%) Ratio of Financial Assistance
which meet FIRR12% (%) FIRR (%)
Ratio of Financial Assistance which meet FIRR12% (%)
Base Case 12.00 81.64 12.01 85.30 10% up 11.99 81.66 11.99 83.32 20% up 11.97 81.68 11.96 85.33
Source : Prepared by the Study Team

5-21
Although the electricity tariff is currently being reviewed and the tariff table will not be reviewed
again for certain time, the cases of 10 percent and 20 percent increase are examined. Table 5.3.3-4
shows the results of the analysis.
Table 5.3.3-4 Results of the Cases of Increase in Electricity Tariff
Installation by solely STELCO (3MW) Installation by STELCO and Private Sector
(STELCO’s Portion) (2.4MW) Electricity
Tariff FIRR (%) Ratio of Financial Assistance
which meet FIRR12% (%) FIRR (%)
Ratio of Financial Assistance which meet FIRR12% (%)
Base Case 12.00 81.64 12.01 85.30 10% up 12.95 80.70 12.82 84.69 20% up 14.31 79.28 14.37 83.79
Source : Prepared by the Study Team
With regard to the fuel price, the cases of 2 percent increase and 1 percent decrease per year are
examined for the sensitivity analysis. Table 5.3.3-5 shows the results of the analysis.
Table 5.3.3-5 Results of the Cases of Increase/Decrease in Fuel Price
Installation by solely STELCO (3MW) Installation by STELCO and Private Sector
(STELCO’s Portion) (2.4MW) Fuel Price
FIRR (%) Ratio of Financial Assistance
which meet FIRR12% (%) FIRR (%)
Ratio of Financial Assistance which meet FIRR12% (%)
Base Case 12.00 81.64 12.01 85.30 2% up 13.51 80.08 14.35 83.44 1% down 11.30 82.32 10.87 86.10
Source : Prepared by the Study Team
For the case of installation by STELCO and private sector, the volume of power purchasing and the
price also have a major impact on the results of the analysis, therefore, the cases of double the average
electricity price and less than unit production cost (90%) for the purchasing price, and 50 percent and
100 percent (purchasing all generated power) for the rate of excess power are examined, while those
figures are 20 percent of excess power and MRf 3/kWh for the base case. As shown in Table 5.3.3-6,
under the case of double the average electricity price, FIRR is less than 12 percent for each rate of
excess power. For the cases of less than the unit production cost, FIRR exceeds 12 percent for each
rate of excess power. For the base case, increase of the rate of excess power causes increase of the
FIRR.
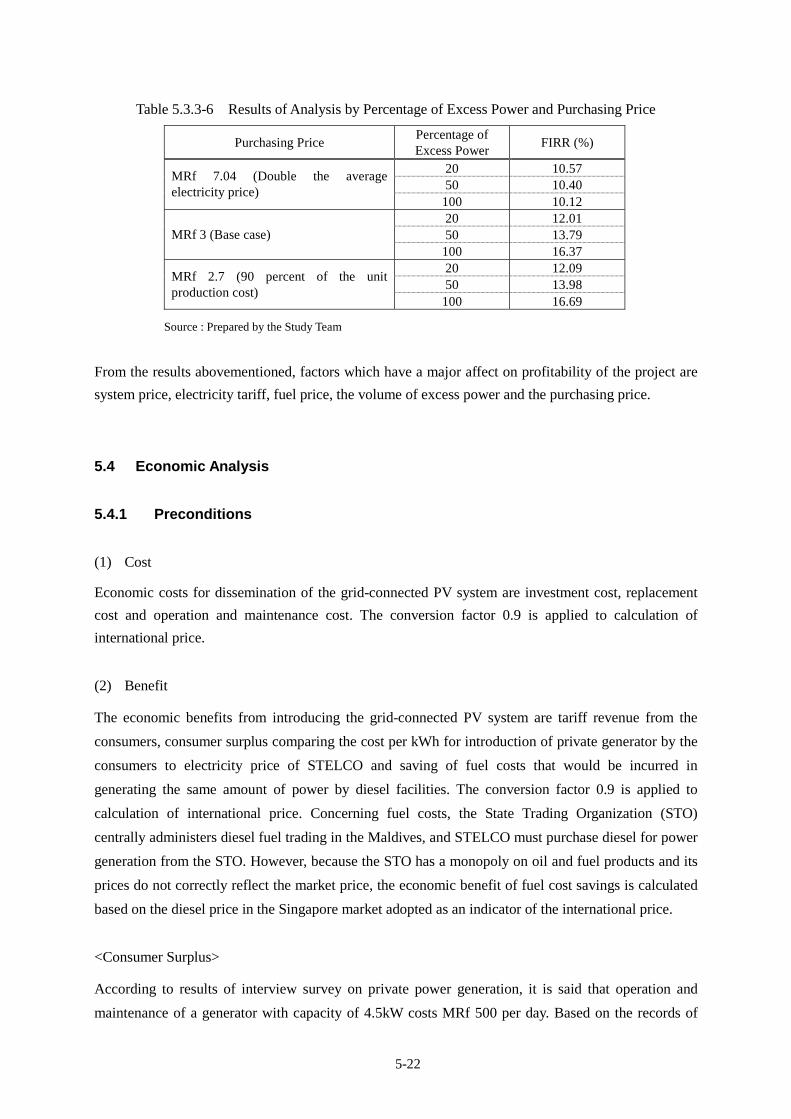
5-22
Table 5.3.3-6 Results of Analysis by Percentage of Excess Power and Purchasing Price
Purchasing Price Percentage of Excess Power
FIRR (%)
20 10.57 50 10.40
MRf 7.04 (Double the average electricity price)
100 10.12 20 12.01 50 13.79 MRf 3 (Base case)
100 16.37 20 12.09 50 13.98
MRf 2.7 (90 percent of the unit production cost)
100 16.69
Source : Prepared by the Study Team
From the results abovementioned, factors which have a major affect on profitability of the project are
system price, electricity tariff, fuel price, the volume of excess power and the purchasing price.
5.4 Economic Analysis
5.4.1 Preconditions
(1) Cost
Economic costs for dissemination of the grid-connected PV system are investment cost, replacement
cost and operation and maintenance cost. The conversion factor 0.9 is applied to calculation of
international price.
(2) Benefit
The economic benefits from introducing the grid-connected PV system are tariff revenue from the
consumers, consumer surplus comparing the cost per kWh for introduction of private generator by the
consumers to electricity price of STELCO and saving of fuel costs that would be incurred in
generating the same amount of power by diesel facilities. The conversion factor 0.9 is applied to
calculation of international price. Concerning fuel costs, the State Trading Organization (STO)
centrally administers diesel fuel trading in the Maldives, and STELCO must purchase diesel for power
generation from the STO. However, because the STO has a monopoly on oil and fuel products and its
prices do not correctly reflect the market price, the economic benefit of fuel cost savings is calculated
based on the diesel price in the Singapore market adopted as an indicator of the international price.
<Consumer Surplus>
According to results of interview survey on private power generation, it is said that operation and
maintenance of a generator with capacity of 4.5kW costs MRf 500 per day. Based on the records of
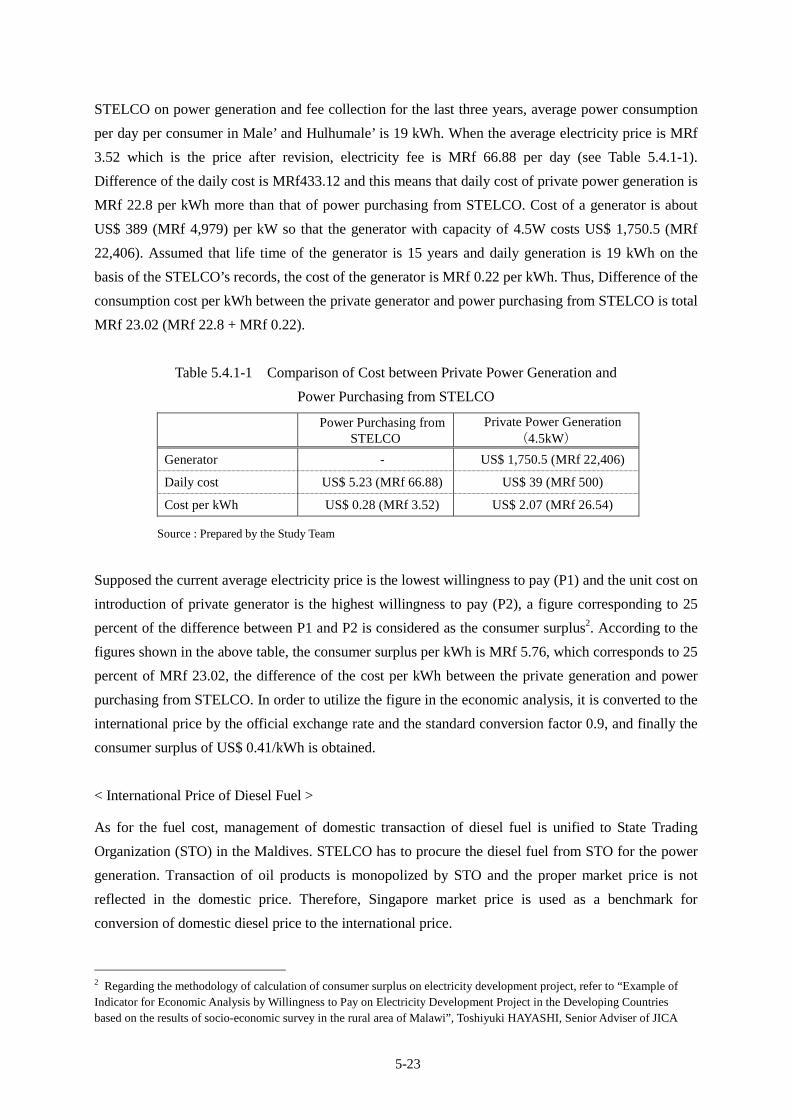
5-23
STELCO on power generation and fee collection for the last three years, average power consumption
per day per consumer in Male’ and Hulhumale’ is 19 kWh. When the average electricity price is MRf
3.52 which is the price after revision, electricity fee is MRf 66.88 per day (see Table 5.4.1-1).
Difference of the daily cost is MRf433.12 and this means that daily cost of private power generation is
MRf 22.8 per kWh more than that of power purchasing from STELCO. Cost of a generator is about
US$ 389 (MRf 4,979) per kW so that the generator with capacity of 4.5W costs US$ 1,750.5 (MRf
22,406). Assumed that life time of the generator is 15 years and daily generation is 19 kWh on the
basis of the STELCO’s records, the cost of the generator is MRf 0.22 per kWh. Thus, Difference of the
consumption cost per kWh between the private generator and power purchasing from STELCO is total
MRf 23.02 (MRf 22.8 + MRf 0.22).
Table 5.4.1-1 Comparison of Cost between Private Power Generation and
Power Purchasing from STELCO
Power Purchasing from
STELCO Private Power Generation
(4.5kW)
Generator - US$ 1,750.5 (MRf 22,406)
Daily cost US$ 5.23 (MRf 66.88) US$ 39 (MRf 500)
Cost per kWh US$ 0.28 (MRf 3.52) US$ 2.07 (MRf 26.54)
Source : Prepared by the Study Team
Supposed the current average electricity price is the lowest willingness to pay (P1) and the unit cost on
introduction of private generator is the highest willingness to pay (P2), a figure corresponding to 25
percent of the difference between P1 and P2 is considered as the consumer surplus2. According to the
figures shown in the above table, the consumer surplus per kWh is MRf 5.76, which corresponds to 25
percent of MRf 23.02, the difference of the cost per kWh between the private generation and power
purchasing from STELCO. In order to utilize the figure in the economic analysis, it is converted to the
international price by the official exchange rate and the standard conversion factor 0.9, and finally the
consumer surplus of US$ 0.41/kWh is obtained.
< International Price of Diesel Fuel >
As for the fuel cost, management of domestic transaction of diesel fuel is unified to State Trading
Organization (STO) in the Maldives. STELCO has to procure the diesel fuel from STO for the power
generation. Transaction of oil products is monopolized by STO and the proper market price is not
reflected in the domestic price. Therefore, Singapore market price is used as a benchmark for
conversion of domestic diesel price to the international price.
2 Regarding the methodology of calculation of consumer surplus on electricity development project, refer to “Example of Indicator for Economic Analysis by Willingness to Pay on Electricity Development Project in the Developing Countries based on the results of socio-economic survey in the rural area of Malawi”, Toshiyuki HAYASHI, Senior Adviser of JICA

5-24
The trend of diesel fuel price is as shown in Figure 3.3.3-1 and fluctuation of the STO price and the
Singapore market price shows almost the same trend. With regard to the difference between those
prices from 2004 onward, the Singapore market price is 75 percent of the STO price on average, while
the amount increased in a phase of downturn in Singapore market price. Therefore, coefficient of 0.75
is used for conversion of the diesel fuel price to the international price.
(3) Assessment of Feasibility
The economic internal rate of return (EIRR) is used to analyze feasibility of the project. 12 % of the
discount rate is applied to the assessment.
5.4.2 Results of Economic Analysis
As shown in Table 5.4.2-1, supposed that the financial assistance which meets FIRR 12 percent is
provided by the government to the initial investment cost of the capacity 3MW, EIRR is 23.50 percent
for the case of installation by solely STELCO and 27.93 percent for the STELCO’s portion under the
case of installation by STELCO and private sector. Both the installation patterns turned out to be
economically feasible for the base case.
Table 5.4.2-1 Results of Economic Analysis for the Capacity of 3MW
a. Installation by solely STELCO (Unit: US$)
Investment Replace O&M
2010 1,118,731 1,118,731 0 -1,118,731
2011 1,099,514 1,117 1,100,632 77,898 140,217 43,901 262,016 -838,616
2012 1,080,298 2,219 1,082,517 154,712 278,482 87,255 520,449 -562,069
2013 1,061,082 3,346 1,064,428 233,295 419,932 131,596 784,823 -279,6052014 1,041,866 4,474 1,046,339 311,879 561,382 175,937 1,049,198 2,8592015 1,022,649 5,601 1,028,250 390,462 702,832 220,278 1,313,572 285,3222016 1,003,433 6,728 1,010,161 469,046 844,282 264,619 1,577,947 567,7862017 984,217 7,855 992,072 547,629 985,732 308,960 1,842,322 850,2502018 965,001 8,982 973,983 626,212 1,127,182 353,301 2,106,696 1,132,7132019 945,784 10,109 955,894 704,796 1,268,632 397,643 2,371,071 1,415,1772020 11,237 11,237 783,379 1,410,083 441,984 2,635,445 2,624,2092021 11,237 11,237 783,379 1,410,083 441,984 2,635,445 2,624,2092022 11,237 11,237 783,379 1,410,083 441,984 2,635,445 2,624,2092023 11,237 11,237 783,379 1,410,083 441,984 2,635,445 2,624,2092024 11,237 11,237 783,379 1,410,083 441,984 2,635,445 2,624,2092025 917,650 11,237 928,887 783,379 1,410,083 441,984 2,635,445 1,706,5582026 881,018 11,237 892,255 783,379 1,410,083 441,984 2,635,445 1,743,1902027 844,386 11,237 855,622 783,379 1,410,083 441,984 2,635,445 1,779,8232028 807,754 11,237 818,990 783,379 1,410,083 441,984 2,635,445 1,816,4552029 771,121 11,237 782,358 783,379 1,410,083 441,984 2,635,445 1,853,0872030 734,489 11,237 745,726 783,379 1,410,083 441,984 2,635,445 1,889,7202031 734,489 11,237 745,726 783,379 1,410,083 441,984 2,635,445 1,889,7202032 734,489 11,237 745,726 783,379 1,410,083 441,984 2,635,445 1,889,7202033 734,489 11,237 745,726 783,379 1,410,083 441,984 2,635,445 1,889,7202034 734,489 11,237 745,726 783,379 1,410,083 441,984 2,635,445 1,889,720Total 10,322,576 7,894,374 218,981 18,435,931 15,266,614 27,479,912 8,613,245 51,359,772 32,923,841
NPV 4,798,105EIRR 23.50%
TotalTotalBalance
Cost BenefitGrid-connected PV System Consumer
SurplusFuel
ReductionElectricity
Fee

5-25
b. Installation by STELCO and Private Sector (STELCO’s portion) (Unit: US$)
Investment Replace O&M
2010 895,716 895,716 0 -895,716
2011 880,330 1,242 881,572 77,898 140,217 43,901 262,016 -619,556
2012 864,945 2,466 867,410 154,712 278,482 87,255 520,449 -346,962
2013 849,559 3,718 853,277 233,295 419,932 131,596 784,823 -68,4542014 834,174 4,971 839,144 311,879 561,382 175,937 1,049,198 210,0542015 818,788 6,223 -13,992 825,011 416,493 702,832 -24,295 -115,693 220,278 1,199,615 374,6042016 803,402 7,475 -16,807 810,878 500,315 844,282 -29,185 -138,976 264,619 1,441,055 630,1772017 788,017 8,728 -19,623 796,745 584,138 985,732 -34,075 -162,260 308,960 1,682,495 885,7512018 772,631 9,980 -22,439 782,612 667,960 1,127,182 -38,964 -185,544 353,301 1,923,935 1,141,3242019 757,246 11,233 -25,255 768,478 751,782 1,268,632 -43,854 -208,828 397,643 2,165,375 1,396,8962020 12,485 -28,071 12,485 835,604 1,410,083 -48,744 -232,112 441,984 2,406,814 2,394,3292021 12,485 -28,071 12,485 835,604 1,410,083 -48,744 -232,112 441,984 2,406,814 2,394,3292022 12,485 -28,071 12,485 835,604 1,410,083 -48,744 -232,112 441,984 2,406,814 2,394,3292023 12,485 -28,071 12,485 835,604 1,410,083 -48,744 -232,112 441,984 2,406,814 2,394,3292024 12,485 -28,071 12,485 835,604 1,410,083 -48,744 -232,112 441,984 2,406,814 2,394,3292025 917,650 12,485 -28,071 930,135 835,604 1,410,083 -48,744 -232,112 441,984 2,406,814 1,476,6792026 881,018 12,485 -28,071 893,503 835,604 1,410,083 -48,744 -232,112 441,984 2,406,814 1,513,3112027 844,386 12,485 -28,071 856,871 835,604 1,410,083 -48,744 -232,112 441,984 2,406,814 1,549,9432028 807,754 12,485 -28,071 820,239 835,604 1,410,083 -48,744 -232,112 441,984 2,406,814 1,586,5762029 771,121 12,485 -28,071 783,606 835,604 1,410,083 -48,744 -232,112 441,984 2,406,814 1,623,2082030 734,489 12,485 -28,071 746,974 835,604 1,410,083 -48,744 -232,112 441,984 2,406,814 1,659,8402031 734,489 12,485 -28,071 746,974 835,604 1,410,083 -48,744 -232,112 441,984 2,406,814 1,659,8402032 734,489 12,485 -28,071 746,974 835,604 1,410,083 -48,744 -232,112 441,984 2,406,814 1,659,8402033 734,489 12,485 -28,071 746,974 835,604 1,410,083 -48,744 -232,112 441,984 2,406,814 1,659,8402034 734,489 12,485 -28,071 746,974 835,604 1,410,083 -48,744 -232,112 441,984 2,406,814 1,659,840Total 8,264,808 7,894,374 243,312 -519,183 16,402,493 16,232,532 27,479,912 -901,527 -4,292,988 8,613,245 47,131,175 30,728,681
NPV 5,200,776EIRR 27.93%
Cost BenefitGrid-connected PV System Consumer
SurplusFuel
Reduction
Reductionof Gen-set
O&M
BalanceTotalTotal
Purchase ofsurpluspower
Fee forreduceddemand
Electricity Fee
Source : Prepared by the Study Team
5.4.3 Sensitivity Analysis
Sensitivity analysis is carried out on the following conditions in the same way of the financial
analysis.
Rise in PV system price decreasing rate Decrease of PV system price Increase of O&M cost Increase of electricity tariff Increase/decrease of fuel price
As for the base case of the rise in decreasing rate of the PV system price, PV system price decreasing
rate is 2.5% per year in line with the PV Road Map. The cases of 3 percent and 3.5 percent up to 2020
are examined in the sensitivity analysis. Table 5.4.3-1 shows the results of the analysis.
Table 5.4.3-1 Results of the Cases of Rise in Decreasing Rate of the PV System Price
EIRR (%)
Decreasing Rate Installation by solely STELCO (3MW)
Installation by STELCO and Private Sector (STELCO’s Portion) (2.4MW)
Base Case (2.5%) 23.50 27.93
3.0% 23.77 28.22
3.5% 24.04 28.52
Source : Prepared by the Study Team

5-26
Cases where the unit system cost is 5 percent and 10 percent less are examined. Decreasing rate of the
unit price is 2.5 percent per year as set in the NEDO’s PV Road Map. Table 5.4.3-2 shows the results
of the analysis.
Table 5.4.3-2 Results of the Cases of Initial Unit Price Decrease in PV System
EIRR (%)
Decreasing Rate Installation by solely STELCO (3MW)
Installation by STELCO and Private Sector (STELCO’s Portion) (2.4MW)
Base Case 23.50 27.93
5% less 24.44 29.03
10% less 25.43 30.20
Source : Prepared by the Study Team
Regarding the O&M cost, the cases of 10 percent and 20 percent more than the base case are
examined. Table 5.4.3-3 shows the results of the analysis.
Table 5.4.3-3 Results of the Cases of Increase in O&M Cost
EIRR (%)
O&M Cost Installation by solely STELCO (3MW)
Installation by STELCO and Private Sector (STELCO’s Portion) (2.4MW)
Base Case 23.50 27.93 10% up 23.49 27.91 20% up 23.48 27.90
Source : Prepared by the Study Team
Although the electricity tariff is currently being reviewed and the tariff table will not be reviewed
again for certain time, the cases of 10 percent and 20 percent increase are examined. Table 5.4.3-4
shows the results of the analysis.
Table 5.4.3-4 Results of the Cases of Increase in Electricity Tariff
EIRR (%)
Electricity Tariff Installation by solely STELCO (3MW)
Installation by STELCO and Private Sector (STELCO’s Portion) (2.4MW)
Base Case 23.50 27.93 10% up 23.89 28.29 20% up 24.63 29.04
Source : Prepared by the Study Team
With regard to the fuel price, the cases of 2 percent increase and 1 percent decrease per year are
examined for the sensitivity analysis. Table 5.4.3-5 shows the results of the analysis.

5-27
Table 5.4.3-5 Results of the Cases of Increase/Decrease in Fuel Price
EIRR (%)
Fuel Price Installation by solely STELCO (3MW)
Installation by STELCO and Private Sector (STELCO’s Portion) (2.4MW)
Base Case 23.50 27.93 2% up 24.24 28.80 1% down 23.16 27.53
Source : Prepared by the Study Team
For the case of installation by STELCO and private sector, the volume of power purchasing and the
price also have a major impact on the results of the analysis, therefore, the cases of double the average
electricity price and less than unit production cost (90%) for the purchasing price, and 50 percent and
100 percent for the rate of excess power are examined, while those figures are 20 percent of excess
power and MRf 3/kWh for the base case. As shown in Table 5.4.3.-6, under the case of double the
average electricity price, FIRR is less than 12 percent for each rate of excess power exceeds 20
percent. For the cases of less than the unit production cost, FIRR always exceeds 12 percent for each
rate of excess power. For the base case, increase of the rate of excess power causes increase of the
FIRR.
Table 5.4.3-6 Results of Analysis by Percentage of Excess Power and Purchasing Price
Purchasing Price Percentage of Excess Power EIRR (%)
20 27.35 50 27.27
MRF 7.46 (Double the average electricity price)
100 27.15 20 27.93 50 28.70 MRF 3 (Base case)
100 29.94 20 27.97 50 28.80
MRF 2.7 (90 percent of the unit production cost)
100 30.12
Source : Prepared by the Study Team
5.4.4 Examination of Profitability on Private Investment in the PV System
With regard to dissemination of the grid-connected PV system in Male’ and Hulhumale’, investment
profitability for the case of installation by private sector is examined. Assumptions for the analysis are
as follows.
PV system cost: US$ 18,950/kW including construction and installation works, etc. (calculated on
the basis of the cost estimate of the project), and 25% of import duties on the price
of equipment
Operation and maintenance: US$ 0.004/kWh

5-28
Lifetime of major components: 30 years for PV panels and 15 years for the other components
Implementing body: Private business in Male’ and Hulhumale’
Annual average power consumption: 11,000kWh/year
Ratio of excess power: 20% of power generation by the PV system
Capacity: 2kW
Discount rate: 6.5% (Interest rate of time deposit of commercial banks)
Under the conditions abovementioned, consumption volume at source is about 9,700kWh per year,
which is equivalent to 90 percent of annual average power consumption. Supposed that the ratio of
excess power is fixed at 20 percent, total benefit (loss) during the investment period is as shown in
Table 5.4.4-1 for several cases of the excess power purchasing price and the investment period.
Table 5.4.4- 1 Results of Investment Profitability of Private Investment in the PV System
Ration of Excess
Power Purchasing Price FIRR (%)
NPV (US$)
Total Benefit during the Investment
Period (US$) Investment Period 15 years
Double the average electricity tariff 6.25 -547 19,355Same as the unit production cost 2.62 -8,298 7,74420% 90% of the unit production cost 2.38 -8,783 7,018
Investment Period 10 years Double the average electricity tariff -0.33 -9,958 -602Same as the unit production cost -4.79 -15,884 -8,343
20%
90% of the unit production cost -5.08 -16,254 -8,826
Source : Prepared by the Study Team
In the case of installation by STELCO and private sector, FIRR turns out to be 6.25 under the
conditions that investment period is 15 years, excess power is 20 percent and purchasing price is
double the average electricity tariff. The figure is slightly less than 6.5 of the discount rate. In order to
improve the profitability of the investment, it is necessary to raise the purchasing price or to make the
investment period long. There is not advantage for STELCO on increases in the purchasing price and
long investment period is not preferable for the investors. However, as mentioned in Section 8.2.3,
Chapter 8, those who are going to invest in renewable energy in the Maldives do not always
emphasize the profitability, but also give importance to reduction of electricity bill and environmental
protection. Therefore, when the priority is placed on not profitability but recovery of the investment
cost, total revenue of US$ 7,018 can be obtained for the case of the investment period 15 years even
though the purchasing price of the excess power is 90 percent of the unit production cost. If the period
is set at 10 years, the total revenue during the investment period is negative for every condition.

5-29
5.5 Assessment of Impact on Investment Profitability of CDM Project
Implementation
One method for improving the profitability of investment into the grid-connected PV system is to
register the CO2 emission reductions arising from the reduction in diesel power generation as a CDM
project, and to sell the CERs that can be dealt through the project registration. However, in order to
realize implementation as a CDM project, it is necessary to undergo a series of procedures ranging
from project design document (PDD) preparation to validation, registration and verification. If the
revenue from CER sales exceeds the costs of these procedures, the attempt to improve the investment
profitability through implementation as a CDM project will be an effective measure. Therefore, in
order to verify the improvement in investment profitability resulting from CDM project
implementation, it is necessary to grasp CER trading price movements in markets and the cost of
project registration.
5.5.1 Movements in the CER Trading Price
Figure 5.5.1-1 shows movements in CER futures trading quantities and prices on the European
Climate Exchange (ECX), which is one of the European markets that have a great impact on emission
credit prices. The price of CER futures trading showed a steady decline from July 2008 to February
2009, however, it started increasing again from March 2009. Concerning this price increase from
March 2009, according to the Mitsui Sumitomo Bank newsletter, “Climate Change and Emission
Credit Trading Vol. 15,” since companies who had more emissions quotas than actual emissions at the
end of April 2009 (the due date for the EU-ETS) had to purchase the necessary quantity of EUAs in
the markets during that month, they were willing to purchase even at high prices. Since the price of
CERs is linked to the price of EUAs, a similar trend can be seen in the price of CERs. Moreover,
another factor behind the rise in CER prices has been the fact that increase in the price of crude oil has
triggered major price hikes in natural gas, thereby leading to a stronger desire among power
companies to purchase emission credits with a view to boosting coal-fired power generation.
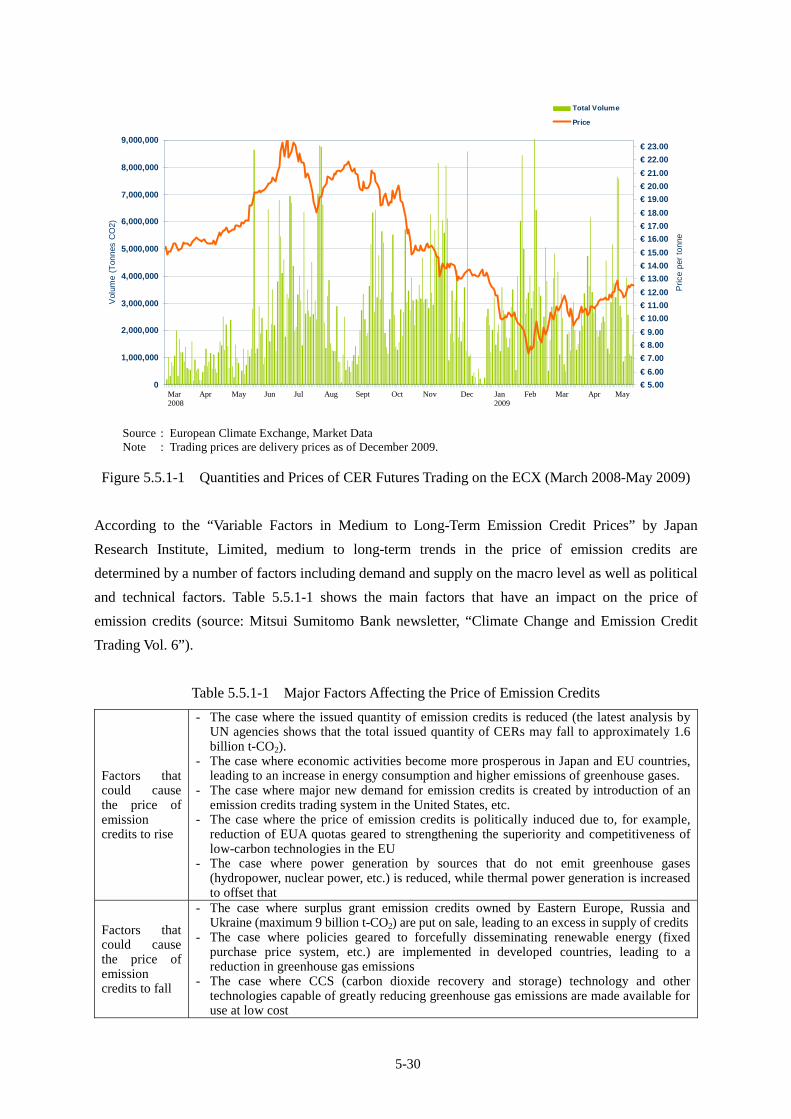
5-30
0
1,000,000
2,000,000
3,000,000
4,000,000
5,000,000
6,000,000
7,000,000
8,000,000
9,000,000
Vol
ume
(Ton
nes
CO
2)
€ 5.00
€ 6.00
€ 7.00
€ 8.00
€ 9.00
€ 10.00
€ 11.00
€ 12.00
€ 13.00
€ 14.00
€ 15.00
€ 16.00
€ 17.00
€ 18.00
€ 19.00
€ 20.00
€ 21.00
€ 22.00
€ 23.00
Pric
e pe
r to
nne
Total Volume
Price
Source : European Climate Exchange, Market Data Note : Trading prices are delivery prices as of December 2009.
Figure 5.5.1-1 Quantities and Prices of CER Futures Trading on the ECX (March 2008-May 2009)
According to the “Variable Factors in Medium to Long-Term Emission Credit Prices” by Japan
Research Institute, Limited, medium to long-term trends in the price of emission credits are
determined by a number of factors including demand and supply on the macro level as well as political
and technical factors. Table 5.5.1-1 shows the main factors that have an impact on the price of
emission credits (source: Mitsui Sumitomo Bank newsletter, “Climate Change and Emission Credit
Trading Vol. 6”).
Table 5.5.1-1 Major Factors Affecting the Price of Emission Credits
Factors that could cause the price of emission credits to rise
- The case where the issued quantity of emission credits is reduced (the latest analysis by UN agencies shows that the total issued quantity of CERs may fall to approximately 1.6 billion t-CO2).
- The case where economic activities become more prosperous in Japan and EU countries, leading to an increase in energy consumption and higher emissions of greenhouse gases.
- The case where major new demand for emission credits is created by introduction of an emission credits trading system in the United States, etc.
- The case where the price of emission credits is politically induced due to, for example, reduction of EUA quotas geared to strengthening the superiority and competitiveness of low-carbon technologies in the EU
- The case where power generation by sources that do not emit greenhouse gases (hydropower, nuclear power, etc.) is reduced, while thermal power generation is increased to offset that
Factors that could cause the price of emission credits to fall
- The case where surplus grant emission credits owned by Eastern Europe, Russia and Ukraine (maximum 9 billion t-CO2) are put on sale, leading to an excess in supply of credits
- The case where policies geared to forcefully disseminating renewable energy (fixed purchase price system, etc.) are implemented in developed countries, leading to a reduction in greenhouse gas emissions
- The case where CCS (carbon dioxide recovery and storage) technology and other technologies capable of greatly reducing greenhouse gas emissions are made available for use at low cost
Mar Apr May Jun Jul Aug Sept Oct Nov Dec Jan Feb Mar Apr May 2008 2009
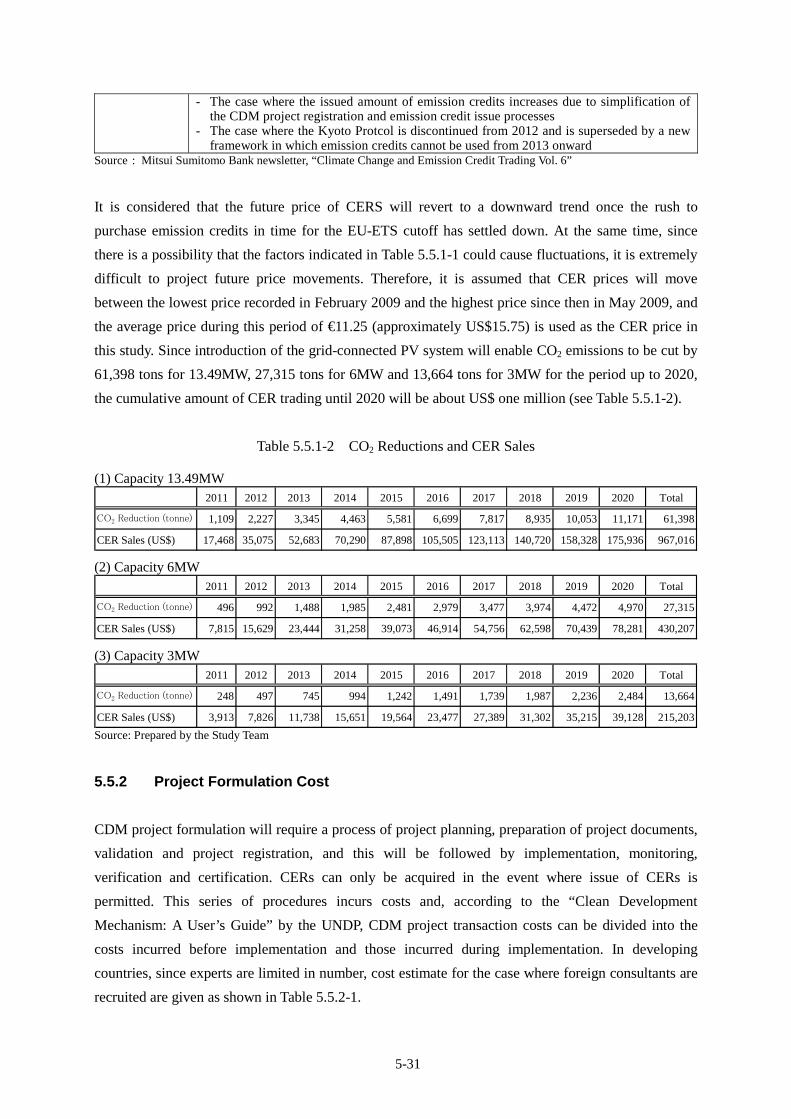
5-31
- The case where the issued amount of emission credits increases due to simplification of the CDM project registration and emission credit issue processes
- The case where the Kyoto Protcol is discontinued from 2012 and is superseded by a new framework in which emission credits cannot be used from 2013 onward
Source : Mitsui Sumitomo Bank newsletter, “Climate Change and Emission Credit Trading Vol. 6”
It is considered that the future price of CERS will revert to a downward trend once the rush to
purchase emission credits in time for the EU-ETS cutoff has settled down. At the same time, since
there is a possibility that the factors indicated in Table 5.5.1-1 could cause fluctuations, it is extremely
difficult to project future price movements. Therefore, it is assumed that CER prices will move
between the lowest price recorded in February 2009 and the highest price since then in May 2009, and
the average price during this period of €11.25 (approximately US$15.75) is used as the CER price in
this study. Since introduction of the grid-connected PV system will enable CO2 emissions to be cut by
61,398 tons for 13.49MW, 27,315 tons for 6MW and 13,664 tons for 3MW for the period up to 2020,
the cumulative amount of CER trading until 2020 will be about US$ one million (see Table 5.5.1-2).
Table 5.5.1-2 CO2 Reductions and CER Sales
(1) Capacity 13.49MW 2011 2012 2013 2014 2015 2016 2017 2018 2019 2020 Total
CO2 Reduction (tonne) 1,109 2,227 3,345 4,463 5,581 6,699 7,817 8,935 10,053 11,171 61,398
CER Sales (US$) 17,468 35,075 52,683 70,290 87,898 105,505 123,113 140,720 158,328 175,936 967,016
(2) Capacity 6MW 2011 2012 2013 2014 2015 2016 2017 2018 2019 2020 Total
CO2 Reduction (tonne) 496 992 1,488 1,985 2,481 2,979 3,477 3,974 4,472 4,970 27,315
CER Sales (US$) 7,815 15,629 23,444 31,258 39,073 46,914 54,756 62,598 70,439 78,281 430,207
(3) Capacity 3MW 2011 2012 2013 2014 2015 2016 2017 2018 2019 2020 Total
CO2 Reduction (tonne) 248 497 745 994 1,242 1,491 1,739 1,987 2,236 2,484 13,664
CER Sales (US$) 3,913 7,826 11,738 15,651 19,564 23,477 27,389 31,302 35,215 39,128 215,203 Source: Prepared by the Study Team
5.5.2 Project Formulation Cost
CDM project formulation will require a process of project planning, preparation of project documents,
validation and project registration, and this will be followed by implementation, monitoring,
verification and certification. CERs can only be acquired in the event where issue of CERs is
permitted. This series of procedures incurs costs and, according to the “Clean Development
Mechanism: A User’s Guide” by the UNDP, CDM project transaction costs can be divided into the
costs incurred before implementation and those incurred during implementation. In developing
countries, since experts are limited in number, cost estimate for the case where foreign consultants are
recruited are given as shown in Table 5.5.2-1.

5-32
Table 5.5.2-1 Transaction Costs of CDM Project Formulation
Cost Item Cost (US$) 1. Pre-operational stage
(1) Feasibility assessment 5,000-20,000 (2) Preparation of project design document (PDD) 25,000-40,000 (3) Validation 10,000-15,000 (4) Registration 10,000* per year (5) Legal work 20,000-25,000
2. Operational stage (1) Rewards for CER sales success 5-10% of CER value (2) Risk mitigation 1-3% of CER value (3) Monitoring and verification 3,000-15,000 per year
Source : UNDP, The Clean Development Mechanism: A User’s Guide, Chapter 5 Note : Applied when the CO2 reduction is 10,000~15,000 tons per year.
Since total introduction capacity of the grid-connected PV system under the project is less than 15
MW, it is expected that the project will be implemented as a small-scale CDM project. Therefore, the
minimum level in the range of cost estimate shown in the UNDP guide is adopted as the
pre-operational costs, while the lowest rates is adopted for CER sales rewards and risk management in
the operational stage. However, concerning the monitoring and verification, since an annual cost of
US$3,000 for foreign consultants is unrealistic, a cost of US$10,000 is assumed in this study. Table
5.5.2-2 shows the transaction costs in the pre-operational and operational stages.
Table 5.5.2-2 Transaction Costs in Small-Scale CDM Project Formulation
Cost Item Rough Cost (US$) 1. Pre-operational stage
(1) Feasibility assessment 5,000 (2) Preparation of Project design document (PDD) 25,000 (3) Validation 10,000 (4) Registration 10,000 per year (5) Legal work 20,000
2. Operational stage (1) Rewards for CER sales success 5% of CER value (2) Risk mitigation 1% of CER value (3) Monitoring and verification 10,000 per year
Source : Prepared by the Study Team based on The Clean Development Mechanism: A User’s Guide, Chapter 5, UNDP
Accordingly, the cost of CDM project formulation will be US$70,000 in the pre-operational stage and
the cost during the operational stage (until 2020) will be as shown in Table 5.5.2-3.

5-33
Table 5.5.2-3 Costs in the Operational Stage (until 2020)
a. Installation by solely STELCO
(1) Capacity 13.49MW (Unit: US$) 2011 2012 2013 2014 2015 2016 2017 2018 2019 2020 Total
Success Fee 873 1,754 2,634 3,515 4,395 5,275 6,156 7,036 7,916 8,797 48,351
Risk Management 175 351 527 703 879 1055 1231 1407 1583 1759 9,670
Monitoring & Verification 10,000 10,000 10,000 10,000 10,000 10,000 10,000 10,000 10,000 10,000 100,000
(2) Capacity 6MW (Unit: US$) 2011 2012 2013 2014 2015 2016 2017 2018 2019 2020 Total
Success Fee 391 781 1,172 1,563 1,954 2,346 2,738 3,130 3,522 3,914 21,511
Risk Management 78 156 234 313 391 469 548 626 704 783 4,302
Monitoring & Verification 10,000 10,000 10,000 10,000 10,000 10,000 10,000 10,000 10,000 10,000 100,000
(3) Capacity 3MW (Unit: US$) 2011 2012 2013 2014 2015 2016 2017 2018 2019 2020 Total
Success Fee 196 391 587 783 978 1,174 1,369 1,565 1,761 1,956 10,760
Risk Management 39 78 117 157 196 235 274 313 352 391 2,152
Monitoring & Verification 10,000 10,000 10,000 10,000 10,000 10,000 10,000 10,000 10,000 10,000 100,000
b. Installation by STELCO and Private Sector (STELCO’s Portion)
(1) Capacity 10.79MW (Unit: US$) 2011 2012 2013 2014 2015 2016 2017 2018 2019 2020 Total
Success Fee 873 1,754 2,634 3,515 2,930 3,517 4,104 4,691 5,278 5,865 35,161
Risk Management 175 351 527 703 586 703 821 938 1056 1,173 7,033
Monitoring & Verification 10,000 10,000 10,000 10,000 10,000 10,000 10,000 10,000 10,000 10,000 100,000
(2) Capacity 4.8 MW (Unit: US$) 2011 2012 2013 2014 2015 2016 2017 2018 2019 2020 Total
Success Fee 391 781 1,172 1,563 1,302 1,564 1,825 2,087 2,348 2,609 15,642
Risk Management 78 156 234 313 260 313 365 417 470 522 3,128
Monitoring & Verification 10,000 10,000 10,000 10,000 10,000 10,000 10,000 10,000 10,000 10,000 100,000
(3) Capacity 2.4MW (Unit: US$) 2011 2012 2013 2014 2015 2016 2017 2018 2019 2020 Total
Success Fee 196 391 587 783 652 783 913 1,043 1,174 1,304 7,826
Risk Management 39 78 117 157 130 157 183 209 235 261 1,566
Monitoring & Verification 10,000 10,000 10,000 10,000 10,000 10,000 10,000 10,000 10,000 10,000 100,000 Source: Prepared by the Study Team
5.5.3 Profit from CDM Project Formulation
Table 5.5.3-1 shows profits in the case where the PV system is installed by solely STELCO and the
project is implemented as a CDM project. The cost for the process of project formulation and
registration will incur at the first year, and the cost for registration, monitoring, verification and others
like rewards for CERs sales success and risk mitigation will incur from the second year. CER trading
will be conducted from the second year when power generation by the installed PV system will be
commenced. Considering the balance for the capacity 13.49MW, the annual revenue will exceed the
annual cost from the third year under the both cases of installation by solely STELCO and installation

5-34
by STELCO and private sector, while the cumulative balance up to 2020 is US$ 638,995 and
US$ 390,989 respectively.
Table 5.5.3-1 Profit from CDM Project Formulation
a. Installation by solely STELCO
(1) Capacity 13.49MW (Unit: US$) 2010 2011 2012 2013 2014 2015 2016 2017 2018 2019 2020 Total
RevenueCER sales (US$) 17,468 35,075 52,683 70,290 87,898 105,505 123,113 140,720 158,328 175,936 967,016
CostProject formulation 60,000 60,000Registration 10,000 10,000 10,000 10,000 10,000 10,000 10,000 10,000 10,000 10,000 10,000 110,000Monitroing & Verification 10,000 10,000 10,000 10,000 10,000 10,000 10,000 10,000 10,000 10,000 100,000Other 1,048 2,105 3,161 4,218 5,274 6,330 7,387 8,443 9,499 10,556 58,021
Sub-Total 70,000 21,048 22,105 23,161 24,218 25,274 26,330 27,387 28,443 29,499 30,556 328,021
Profit (Loss) -70,000 -3,580 12,970 29,522 46,072 62,624 79,175 95,726 112,277 128,829 145,380 638,995
(2) Capacity 6MW (Unit: US$) 2010 2011 2012 2013 2014 2015 2016 2017 2018 2019 2020 Total
RevenueCER sales (US$) 7,815 15,629 23,444 31,258 39,073 46,914 54,756 62,598 70,439 78,281 430,207
CostProject formulation 60,000 60,000Registration 10,000 10,000 10,000 10,000 10,000 10,000 10,000 10,000 10,000 10,000 10,000 110,000Monitroing & Verification 10,000 10,000 10,000 10,000 10,000 10,000 10,000 10,000 10,000 10,000 100,000Other 469 937 1,406 1,876 2,345 2,815 3,286 3,756 4,226 4,697 25,813
Sub-Total 70,000 20,469 20,937 21,406 21,876 22,345 22,815 23,286 23,756 24,226 24,697 295,813
Profit (Loss) -70,000 -12,654 -5,308 2,038 9,382 16,728 24,099 31,470 38,842 46,213 53,584 134,394
(3) Capacity 3MW (Unit: US$) 2010 2011 2012 2013 2014 2015 2016 2017 2018 2019 2020 Total
RevenueCER sales (US$) 3,913 7,826 11,738 15,651 19,564 23,477 27,389 31,302 35,215 39,128 215,203
CostProject formulation 60,000 60,000Registration 10,000 10,000 10,000 10,000 10,000 10,000 10,000 10,000 10,000 10,000 10,000 110,000Monitroing & Verification 10,000 10,000 10,000 10,000 10,000 10,000 10,000 10,000 10,000 10,000 100,000Other 235 469 704 940 1,174 1,409 1,643 1,878 2,113 2,347 12,912
Sub-Total 70,000 20,235 20,469 20,704 20,940 21,174 21,409 21,643 21,878 22,113 22,347 282,912
Profit (Loss) -70,000 -16,322 -12,643 -8,966 -5,289 -1,610 2,068 5,746 9,424 13,102 16,781 -67,709
b. Installation by STELCO and Private Sector (STELCO’s portion)
(1) Capacity 10.79MW (Unit: US$) 2010 2011 2012 2013 2014 2015 2016 2017 2018 2019 2020 Total
RevenueCER sales (US$) 17,468 35,075 52,683 70,290 58,599 70,337 82,075 93,814 105,552 117,290 703,183
CostProject formulation 60,000 60,000Registration 10,000 10,000 10,000 10,000 10,000 10,000 10,000 10,000 10,000 10,000 10,000 110,000Monitroing & Verification 10,000 10,000 10,000 10,000 10,000 10,000 10,000 10,000 10,000 10,000 100,000Other 1,048 2,105 3,161 4,218 3,516 4,220 4,925 5,629 6,334 7,038 42,194
Sub-Total 70,000 21,048 22,105 23,161 24,218 23,516 24,220 24,925 25,629 26,334 27,038 312,194
Profit (Loss) -70,000 -3,580 12,970 29,522 46,072 35,083 46,117 57,150 68,185 79,218 90,252 390,989
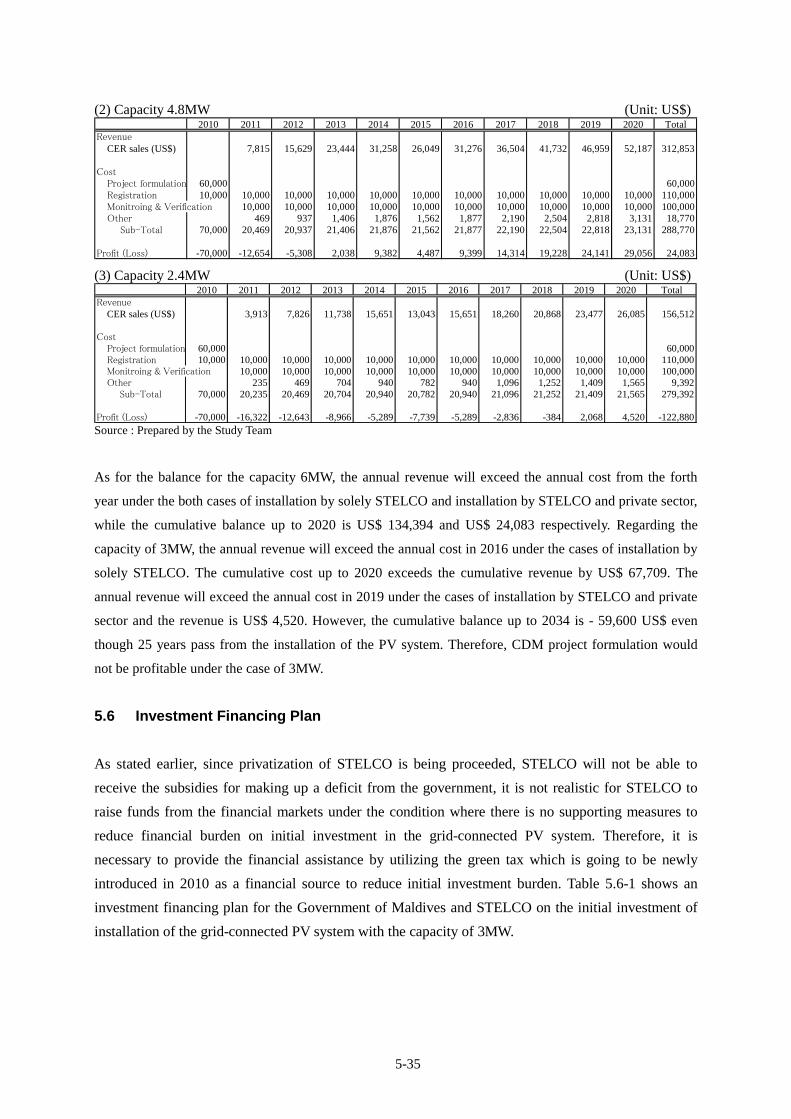
5-35
(2) Capacity 4.8MW (Unit: US$) 2010 2011 2012 2013 2014 2015 2016 2017 2018 2019 2020 Total
RevenueCER sales (US$) 7,815 15,629 23,444 31,258 26,049 31,276 36,504 41,732 46,959 52,187 312,853
CostProject formulation 60,000 60,000Registration 10,000 10,000 10,000 10,000 10,000 10,000 10,000 10,000 10,000 10,000 10,000 110,000Monitroing & Verification 10,000 10,000 10,000 10,000 10,000 10,000 10,000 10,000 10,000 10,000 100,000Other 469 937 1,406 1,876 1,562 1,877 2,190 2,504 2,818 3,131 18,770
Sub-Total 70,000 20,469 20,937 21,406 21,876 21,562 21,877 22,190 22,504 22,818 23,131 288,770
Profit (Loss) -70,000 -12,654 -5,308 2,038 9,382 4,487 9,399 14,314 19,228 24,141 29,056 24,083
(3) Capacity 2.4MW (Unit: US$) 2010 2011 2012 2013 2014 2015 2016 2017 2018 2019 2020 Total
RevenueCER sales (US$) 3,913 7,826 11,738 15,651 13,043 15,651 18,260 20,868 23,477 26,085 156,512
CostProject formulation 60,000 60,000Registration 10,000 10,000 10,000 10,000 10,000 10,000 10,000 10,000 10,000 10,000 10,000 110,000Monitroing & Verification 10,000 10,000 10,000 10,000 10,000 10,000 10,000 10,000 10,000 10,000 100,000Other 235 469 704 940 782 940 1,096 1,252 1,409 1,565 9,392
Sub-Total 70,000 20,235 20,469 20,704 20,940 20,782 20,940 21,096 21,252 21,409 21,565 279,392
Profit (Loss) -70,000 -16,322 -12,643 -8,966 -5,289 -7,739 -5,289 -2,836 -384 2,068 4,520 -122,880 Source : Prepared by the Study Team
As for the balance for the capacity 6MW, the annual revenue will exceed the annual cost from the forth
year under the both cases of installation by solely STELCO and installation by STELCO and private sector,
while the cumulative balance up to 2020 is US$ 134,394 and US$ 24,083 respectively. Regarding the
capacity of 3MW, the annual revenue will exceed the annual cost in 2016 under the cases of installation by
solely STELCO. The cumulative cost up to 2020 exceeds the cumulative revenue by US$ 67,709. The
annual revenue will exceed the annual cost in 2019 under the cases of installation by STELCO and private
sector and the revenue is US$ 4,520. However, the cumulative balance up to 2034 is - 59,600 US$ even
though 25 years pass from the installation of the PV system. Therefore, CDM project formulation would
not be profitable under the case of 3MW.
5.6 Investment Financing Plan
As stated earlier, since privatization of STELCO is being proceeded, STELCO will not be able to
receive the subsidies for making up a deficit from the government, it is not realistic for STELCO to
raise funds from the financial markets under the condition where there is no supporting measures to
reduce financial burden on initial investment in the grid-connected PV system. Therefore, it is
necessary to provide the financial assistance by utilizing the green tax which is going to be newly
introduced in 2010 as a financial source to reduce initial investment burden. Table 5.6-1 shows an
investment financing plan for the Government of Maldives and STELCO on the initial investment of
installation of the grid-connected PV system with the capacity of 3MW.

5-36
Table 5.6-1 Investment Financing Plan for Installation of PV System with Capacity of 3MW
a. Installation by solely STELCO
2010 2011 2012 2013 2014 2015 2016 2017 2018 2019 2020 Total
Capacity (kW) 300 300 300 300 300 300 300 300 300 300 3,000
Financial Assistance(million US$)
4.99 4.91 4.82 4.74 4.65 4.56 4.48 4.39 4.31 4.22 46.07
STELCO (million US$) 1.12 1.10 1.08 1.06 1.05 1.03 1.01 0.99 0.97 0.95 10.36
Total 6.11 6.01 5.90 5.80 5.70 5.59 5.49 5.38 5.28 5.17 56.43
b. Installation by STELCO and Private Sector (STELCO’s portion)
2010 2011 2012 2013 2014 2015 2016 2017 2018 2019 2020 Total
Capacity (kW) 300 300 300 300 200 200 200 200 200 200 2,400
Financial Assistance(million US$)
5.22 5.13 5.04 4.95 3.24 3.18 3.12 3.06 3.00 2.94 38.86
STELCO (million US$) 0.90 0.88 0.87 0.85 0.56 0.55 0.54 0.53 0.52 0.51 6.70
Total 6.11 6.01 5.90 5.80 3.80 3.73 3.66 3.59 3.52 3.45 45.56
Source : Prepared by the Study Team
A partner of privatization of STELCO is expected not only to manage the existing electricity power
generation and distribution system and improvement of operational efficiency but also to develop
power generation facilities using renewable energy sources. In the meeting with the authorities
concerned, it is identified that they expect the partner to invest in STELCO’s portion of the PV system
installation. Therefore, the financial contribution from the partner is assumed as financial source for
the STELCO’s portion in this study.
Table 5.6-2 shows the financial projection of STELCO up to 2020 for the case of installation of the
grid-connected PV system with capacity of 3MW by STELCO and private sector. The deficit is large
due to huge construction cost of the 4th power development project in 2009 and 2010. However, the
balance will become positive finally after 2012 even though the business profit tax is imposed on the
profit at the maximum tax rate of 15%.

5-37
Table 5.6-2 Financial Projection of STELCO
(Unit: Million MRf) 2009 2010 2011 2012 2013 2014 2015 2016 2017 2018 2019 2020
1. Revenue(1) Turnover 702 934 1,005 1,075 1,148 1,225 1,306 1,395 1,491 1,598 1,716 1,850
Total Revenue 702 934 1,005 1,075 1,148 1,225 1,306 1,395 1,491 1,598 1,716 1,8502. Expenses(1) Investment 304 336 77 76 74 49 48 47 46 45 44 0
Generator 304 258 0 0 0 0 0 0 0 0 0 0PV System 0 78 77 76 74 49 48 47 46 45 44 0
(2) Fuel 531 582 628 674 725 780 841 909 985 1,072 1,171 1,287 Diesel 523 574 619 665 714 769 829 895 971 1,056 1,154 1,268 Lube Oil 7 8 9 9 10 11 12 13 14 16 17 19(3) Operation & Maintenance 80 86 92 99 106 113 120 129 137 147 158 171
Generator 80 86 92 99 106 113 120 128 137 147 158 171PV System 0.0 0.0 0.0 0.0 0.1 0.1 0.1 0.1 0.1 0.1 0.1 0.1
(4) Replacement 0 0 0 0 0 0 0 0 0 0 0 0(5) Administration 93 100 107 115 122 130 139 149 159 170 183 197(6) Other Expenses 18 18 18 18 18 18 18 18 18 18 18 18(7) Credit Cost 20 20 20 20 20 20 20 20 20 20 20 20(8) Excess Power Purchasing 0.0 0.0 0.0 0.0 0.0 0.0 0.4 0.4 0.5 0.6 0.7 0.7(9) Depreciation 28 47 52 57 62 65 68 71 74 77 80 80
Total Enpenses 1,072 1,189 994 1,058 1,127 1,175 1,255 1,342 1,440 1,550 1,675 1,773
Profit/Loss -371 -255 11 17 22 51 51 53 51 47 41 77Business profit tax (from 2010) 0 2 2 3 8 8 8 8 7 6 12Revenue/loss after tax -371 -255 9 14 18 43 44 45 43 40 35 65 Source : Prepared by the Study Team Notes 1: Investment cost of Gen-set for 2009 is based on the contract amount of the 4th Power Development Project.
Investment cost of Gen-set for 2010 is estimated on the basis of data of the 4th Power Development Project. 2: Replacement cost for the new investment doe not occur during this period. 3: Administration cost, other expenses and credit cost is the average figure for the last five years. 4: Depreciation is based on the STELCO’s straight line method (6.67% per year).
5.7 Budget to be prepared for Execution of Each Measure
Budget necessary for execution of each measure is as follows
(1) Import Duties Exemption
Total amount of import duties to be exempted in case of the capacity 3MW : US$ 11,336,384
Import duties for 2.4MW of the STELCO’s portion for Measure D : US$ 9,187,726
(2) Financial Assistance (Green Tax and Development Expenditure) and Carbon Tax
For the case of installation by STELCO and provate sector (Measure D), the financial assistance for
the STELCO’S portion is as follows (see Table 5.7-1.).
Total amount of financial assistance to initial investment : US$ 38,864,237
Annual average amount (Total amount is divided by 10) : US$ 3,886,424

5-38
Annual amount from green tax : 61% of green tax revenue
Annual amount from development expenditure : 2.4% of development expenditure
<Contribution Ratio of Green Tax and Shortfall>
61% from green tax = US$ 3,886,424 No shortfall
50% from green tax = US$ 3,150,000 Shortfall US$ 736,424
30% from green tax = US$ 1,890,000 Shortfall US$ 1,996,424
0% from green tax = US$ 0 Shortfall US$ 3,886,424
<Contribution from Green Tax for Shortfall>
61% from green tax No shortfall
50% from green tax Necessary amount US$ 736,424
30% from green tax Necessary amount US$ 1,996,424
0% from green tax Necessary amount US$ 3,886,424
<Contribution from Carbon Tax for Shortfall and the Amount/kWh >
61% from green tax No shortfall
50% from green tax Necessary amount US$ 736,424 = MRf 0.003/kWh
30% from green tax Necessary amount US$ 1,996,424 = MRf 0.007/kWh
0% from green tax Necessary amount US$ 3,886,424 = MRf 0.014/kWh
Table 5.7- 1 Contribution Ratio from Green Tax and Shortfall
Contribution Ratio from Green Tax STELCO’s portion (2.4MW) for the
case of installation by STELCO and
private sector 61% 50% 30% 0%
Necessary amount (US$) 3,886,424
Allowable amount (US$) 3,886,424 3,150,000 1,890,000 0
Shortfall (US$) 0 736,424 1,996,424 3,886,424
Ratio of shortfall to development
expenditure - 0.5% 1.2% 2.4%
Collection of shortfall from carbon tax
(MRf/kWh) (for 10 years) - 0.003 0.007 0.014
Source : Prepared by the Study Team
(3) Amount to be paid by STELCO for Excess Power Purchasing
Conditions of excess power purchasing by STELCO, purchased amount and purchasing price are as
follows.

5-39
Assumptions:
- The amount of excess power purchasing is 20 percent.
- Purchasing price is MRf 3/kWh, which is equivalent to the unit production cost.
Total purchased power (from 2015 to 2020) : 1,088,505kWh
Necessary budget for purchasing (from 2015 to 2020) : US$ 250,356

CHAPTER 6 DETAILED DESIGN OF THE PILOT PROJECT
6.1 Examination and Selection of Pilot Project sites
Comparative examination was carried out according to the “Evaluation of potential sites in Male’ Island
and Hulhumale’ Island” at the beginning of the report on the 14 potential sites that were selected in
Chapter 4.4, and the sites were ranked in the order of priority. 6 out of 14 sites were selected as pilot
project sites after being ranked highly according to the following criteria. Table 6.1-2 shows the reasons
behind the selection of the pilot project sites, Figure 6.1-1 shows the location map of the sites.
Table 6.1-1 Selection Criteria of Pilot Project sites
① PV system capacity is relatively large. ② Can be a model case for other potential sites. ③ Engineers or technicians who can appropriately implement PV system maintenance can be secured. ④ Reliability of the distribution system is not extremely low. ⑤ PR effect is large and access to the facilities is easy.
Source : Prepared by the Study Team
Table 6.1-2 Pilot Project Sites
No Site Output Capacity (kWp) Reasons for Selection
1 STELCO Building 45 kWp It satisfies selection criteria ②, ③, ④ and ⑤; there are no solar irradiation obstructions, and it is easy to establish a maintenance setup using the company employees.
2 Kalaafaanu School 85 kWp
It satisfies selection criteria ①, ②, ③ and ⑤, and it is easy to establish a maintenance setup because of proximity to STELCO. Moreover, being a school that was constructed under Japanese grant aid, As-built documents are available, making it easy to plan renovations and reinforcement. Also, the structural strength is deemed to be reliable.
3 Maldives Center for Social Education 100 kWp
It satisfies all the selection criteria. In particular, since sports events and so on are staged here, it will have a high PR effect. Moreover, being a school that was constructed under Japanese grant aid, As-built documents are available, making it easy to plan renovations and reinforcement. Also, the structural strength is deemed to be reliable.
4 Thaajuddeen School 130 kWp
It satisfies selection criteria ① , ② , ④ and ⑤ and has the largest PV output of the six sites. Moreover, being a school that was constructed under Japanese grant aid, As-built documents are available, making it easy to plan renovations and reinforcement. Also, the structural strength is deemed to be reliable.
5 New Secondary School for Girls 100 kWp
It satisfies selection criteria ①, ②, ④ and ⑤, and since it is located adjacent to Site No. 3, it will have a high PR effect. Moreover, being a school that was constructed under Japanese grant aid, As-built documents are available, making it easy to plan renovations and reinforcement. Also, the structural strength is deemed to be reliable.
6 President’s Office 20 kWp
It satisfies selection criteria ②, ③, ④ and ⑤, and it is easy to establish a maintenance setup because the facility has its own maintenance staff. Also, installation a PV system in the presidential office will have a high PR effect.
Source : Prepared by the Study Team
6-1

President s Office
Kalaafaanu School
New Secondary School for Girls
Thaajuddeen School
Maldives Center for Social Education
STELCO Building
Source : Prepared by the Study Team
Figure 6.1-1 Map of the Pilot Project Sites
6.2 Detailed Design Procedure for the Pilot Project Sites
In conducting detailed design of pilot project sites, the detailed site surveys, the detailed specifications
examination of equipment, equipment layout design and preparation of design documents, etc. will be
carried out according to the following procedure.
Source : Prepared by the Study Team
Figure 6.2-1 Detailed Design Procedure of the Pilot project
Detailed site survey, equipment layout design
In addition to the survey implemented when selecting the potential sites, implement a detailed survey taking the PV stand attachment method (including structural examination), other electrical equipments installation method and connection method to existing distribution lines, etc. into account, and design the equipment layout and cable route.
Preparation of design documents
In addition to the above survey findings, prepare design drawings.
Project outline design
Detailed site surveys ▪ PV installation sites ▪ Peripheral equipment
installation sites ▪ Distribution line connections
Projects process examination, project cost estimation
Based on the above survey results, compile the works schedule upon taking the equipment manufacturing period, transport conditions and installation works into account. Moreover, based on the information in the detailed design, calculate the works quantities and estimate the project cost of the projects.
Design documents preparation
Equipment layout design ▪ PV arrangement and racks ▪ Peripheral equipment layout ▪ Cable routes
Project schedule examination
Project cost estimation
Detailed implementation plan of the Pilot project
6-2
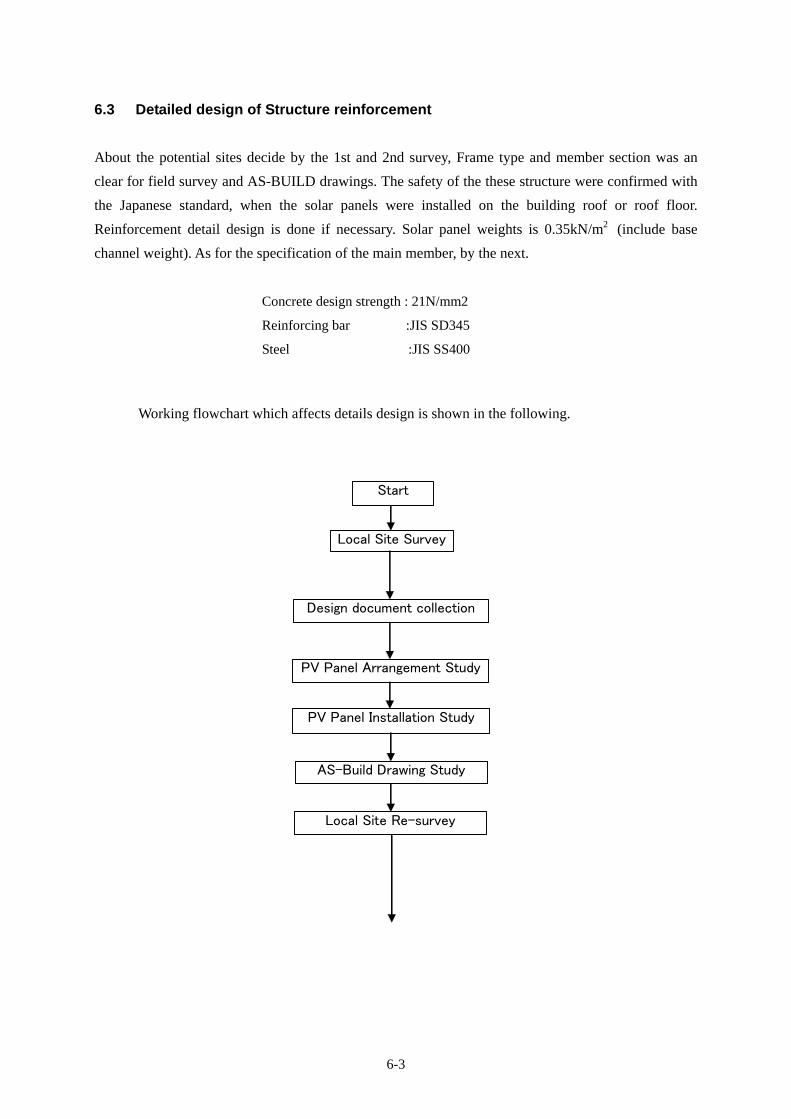
6.3 Detailed design of Structure reinforcement
About the potential sites decide by the 1st and 2nd survey, Frame type and member section was an
clear for field survey and AS-BUILD drawings. The safety of the these structure were confirmed with
the Japanese standard, when the solar panels were installed on the building roof or roof floor.
Reinforcement detail design is done if necessary. Solar panel weights is 0.35kN/m2 (include base
channel weight). As for the specification of the main member, by the next.
Concrete design strength : 21N/mm2
Reinforcing bar :JIS SD345
Steel :JIS SS400
Working flowchart which affects details design is shown in the following.
Start
Local Site Survey
Design document collection
PV Panel Arrangement Study
PV Panel Installation Study
AS-Build Drawing Study
Local Site Re-survey
6-3

Ground Type Roof Floor Type
Roof Top Type
OK
NG
OK
NG
Decision of theInstallation for
PV Panel
Design of Panel SupportStructure and Foundation
Confirmation ofStress for Roof
and Purlin
Design of PanelSupport Structure
Reinforcement Study
Confirmation ofStress for Sub Beamand Main Structure
Reinforcement Study
Draw a Design document
Construction Plan Study
Rough EstimateConstruction Cost
Figure 6.3-1 Working flowchart which affects details design
6-4

Table 6.3-1 Detail examination result for Building in the Pilot Project Sites
Site Name AS-Build
Drawing,
Completed
year
Support Type Surface
Condition
Contents of
Repair and
Reinforcement
Examination
Result for
Main Structure
STELCO
Building
Ready,2000 Roof Floor Some of the Tile
come off
Construction of
Panel Support
Structure,
Footing, and
waterproofing
No problem
Kalaafaanu
School
Ready,1989 Roof top Bad Roofing Exchange of the
roof material
No problem
Maldives Center
for Social
Education
Ready,1992 Roof top Depleted Roofing
for age passes
Exchange of the
roof material
No problem
Thaajuddeen
School
Ready,2004 Roof top No problem Coating improvement of roof (Prevention of deterioration)
No problem
New Secondary
School for Girls
Ready,2009 Roof top No problem Unnecessary No problem
President’s office Ready,2002 Roof top No problem Coating
improvement of
roof (Prevention
of deterioration)
No problem
As it is shown in the above table, the reinforcement of Main Structure is unnecessary in all site.
However, completed year was not same in each building, and there was the deterioration of the roof
material. So, It was decided that each building replaced all the roof materials. (Kalaafaanu School,
Maldives Center for Social Education) Then, the roof of the Thaajuddeen School and the President’s
Office does coating improvement.
6-5

6.4 Technical Transfer of the Detailed Design Technique
6.4.1 Concept of the Technical Transfer for Detailed Design
Since the goal of the technical transfer for detailed design is to enable employees of MHTE and
STELCO to understand the detailed design procedure of as described in 6.2, work was divided
according to the technical level of each staff member and the technical transfer was conducted while
jointly implementing the practical duties and field surveys.
6.4.2 Contents of the Technical Transfer for Detailed Design
The Study Team implemented technical transfer of the following field survey items and results
analysis methods through the detailed design process.
(1) Information collection (acquisition of basic data) (Existing design documents, existing distribution network drawings, solar radiation data, etc.)
(2) Field survey method (Identification of connection parts, examination of solar radiation obstructions, confirmation of existing electricity rooms, etc., and examination of cable routes, etc.)
(3) Analysis of field survey findings (Examination of panel arrangement, PV output, equipment arrangement, cable routes, etc.)
(4) Summarization of survey results (Compilation of the technical specifications)
6.4.3 Report of the Technical Transfer for Detailed Design
(1) Information Collection
The Study Team offered the guidance to the counterparts on the method for collecting the
minimum basic information required for advancing the field surveys and detailed design of the
grid-connected PV systems, and the Study Team and counterparts jointly implemented the
information collection work. The following photograph shows the data logger being attached for
collecting solar irradiation data on Hulhumale’ Island.
6-6

(2) Field Survey Method
The Study Team formed a working group with the staff of the MHTE and STELCO and jointly
implemented the detailed study and design of the 45 kWp grid-connected PV system planned on
the STELCO Company building. The planned cable rough drawings for this building and similar
data, the field survey methods (equipment layout, cable routes, etc.) were conducted and the data
needed for detailed design were collected.
STELCO Lecture and Survey Conditions at the STELCO Building
(3) Analysis of Field Survey Results
The results obtained from the above survey, the counterparts prepared the PV layout and
structural drawings, and the Study Team assisted in calculating the work quantities from those
drawings and finishing the work in a joint effort.
Guidance on Preparation of PV Panel Layout Drawing using CAD Software
Furthermore, in order to improve the understanding regarding operation and maintenance of the
grid-connected PV system in addition to planning and design, the Study Team conducted
guidance on operation and maintenance technology utilizing the PV and DEG hybrid system on
Mandau Island and the grid-connected PV system on Lahm Atoll.
6-7

6.5 Beneficial Effects of Grid-Connected PV System Introduction
6.5.1 Estimated PV Power Generation
The annual power generation on each pilot project site was estimated by the following formula:
Ep = Σ HA / Gs * K * P
Where, Ep = Estimated annual PV power generation (kWh/year)
HA = Monthly average insolation at location (kWh/m2/day)
Gs = Irradiance @ STC (Standard Testing Condition) (kW/m2) = 1 (kW/m2)
K = Loss coefficient = Kd * Kt * ηINV*ηTR
* PV loss coefficient Kd : Dirt on solar surface, loss caused by
irradiance fluctuation, difference of PV
characteristics. Usually 0.8.
* Temperature correction coefficient Kt : Correction coefficient to consider the
change of PV efficiency by heat.
Kt = 1 + α (Tm - 25) / 100
Where,
α: Peak output temperature coefficient
(%・℃-1) = - 0.5 (%-℃-1)
[Crystalline Silicon]
Tm: Module temperature (℃) = Tav + ΔT
Tav: Monthly average temperature (℃)
ΔT: Module temperature increase (℃)
Open rear type 18.4 Roof installed type 21.5
* Inverter efficiency ηINV : Inverter efficiency: Usually 0.95
* Transformer efficiency ηTR : Transformer efficiency:
set at 0.98 here considering that on-load
and off-load loss are constant
Σ indicates the integrated value of estimated power generation for each month.
For simplification, the horizontal surface amount of solar radiation was adopted when calculating the
monthly average amount of solar radiation on the installed surface, and the impacts of obstructions
discussed in 4.3 were taken into account. Concerning the impact of shade, this is conventionally
examined upon considering the direct connection of PV modules, however, for the sake of
simplification, in cases where roofs contain partial solar radiation obstructions; conservative values
were calculated assuming the whole roof to be affected.
6-8

Table 6.5.1-1 Annual PV Power Generation at Each Pilot Project Site
Island Site NamePV Capacity
[kWp]
Annual PowerGeneration[kWh/year]
STELCO Building 45 45,739Kalaafaanu School 85 117,069Maldives Center for Education 100 120,945Thaajuddeen School 130 157,228New Secondary School for Girls 100 90,778President's Office 20 24,189Total 480 555,948
Male'
Source : Prepared by the Study Team
0.0
20.0
40.0
60.0
80.0
100.0
120.0
140.0
160.0
180.0
0
500
1,000
1,500
2,000
2,500
3,000
3,500
4,000
4,500
5,000
Jan Feb Mar Apr May Jun Jul Aug Sep Oct Nov Dec
Month
ly In
tegr
ate
d G
robal S
ola
r
Irra
diation
[kW
h/㎡
]
Est
imate
d P
ow
er G
ener
ation
[kW
h]
Source : Prepared by the Study Team
Figure 6.5.1-1 Estimated Monthly PV Power Generation (STELCO Building)
0.0
20.0
40.0
60.0
80.0
100.0
120.0
140.0
160.0
180.0
200.0
0
2,000
4,000
6,000
8,000
10,000
12,000
14,000
Jan Feb Mar Apr May Jun Jul Aug Sep Oct Nov Dec
Mon
thly
Inte
grate
d G
robal S
olar
Irra
dia
tion [k
Wh
/㎡]
Est
imate
d P
ow
er
Gener
atio
n [kW
h]
Source : Prepared by the Study Team
Figure 6.5.1-2 Estimated Monthly PV Power Generation (Kalaafaanu School)
6-9
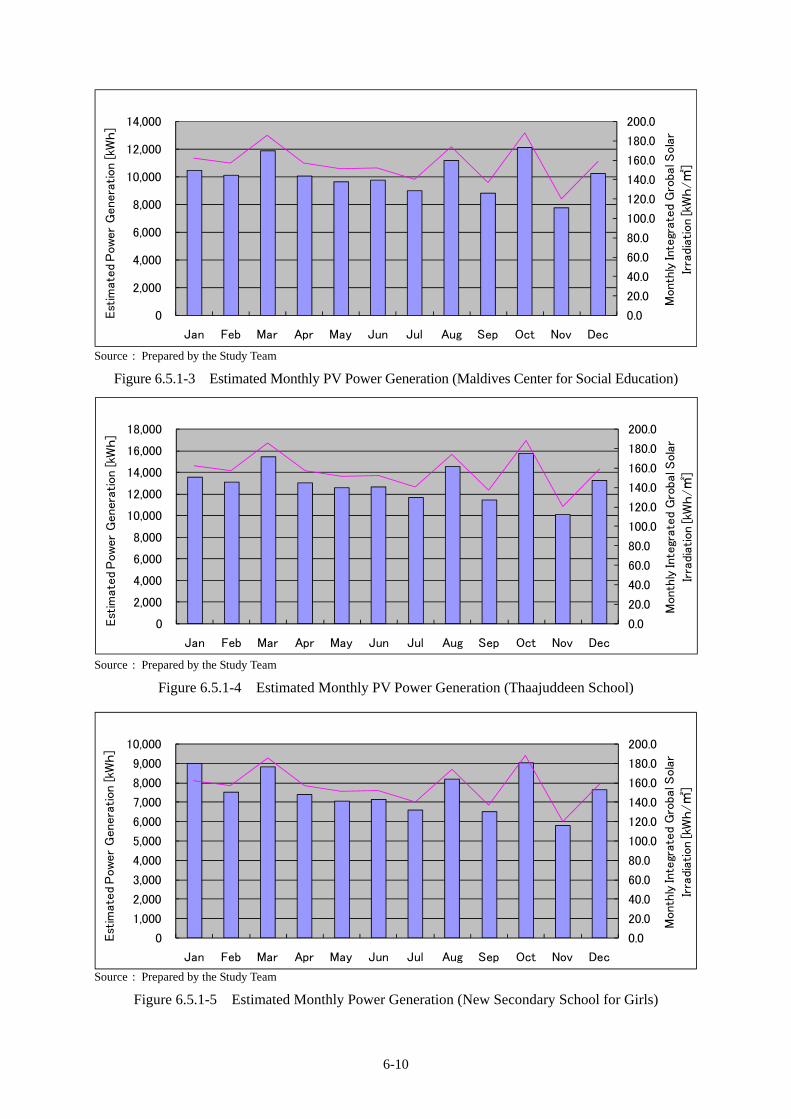
0.0
20.0
40.0
60.0
80.0
100.0
120.0
140.0
160.0
180.0
200.0
0
2,000
4,000
6,000
8,000
10,000
12,000
14,000
Jan Feb Mar Apr May Jun Jul Aug Sep Oct Nov Dec
Month
ly In
tegr
ate
d G
robal S
ola
r
Irra
dia
tion
[kW
h/㎡
]
Est
imate
d P
ow
er G
ener
ation
[kW
h]
Source : Prepared by the Study Team
Figure 6.5.1-3 Estimated Monthly PV Power Generation (Maldives Center for Social Education)
0.0
20.0
40.0
60.0
80.0
100.0
120.0
140.0
160.0
180.0
200.0
0
2,000
4,000
6,000
8,000
10,000
12,000
14,000
16,000
18,000
Jan Feb Mar Apr May Jun Jul Aug Sep Oct Nov Dec
Month
ly In
tegr
ate
d G
robal S
ola
r
Irra
dia
tion
[kW
h/㎡
]
Est
imate
d P
ow
er G
ener
ation
[kW
h]
Source : Prepared by the Study Team
Figure 6.5.1-4 Estimated Monthly PV Power Generation (Thaajuddeen School)
0.0
20.0
40.0
60.0
80.0
100.0
120.0
140.0
160.0
180.0
200.0
0
1,000
2,000
3,000
4,000
5,000
6,000
7,000
8,000
9,000
10,000
Jan Feb Mar Apr May Jun Jul Aug Sep Oct Nov Dec
Mon
thly
Inte
grate
d G
robal S
ola
r
Irra
diation
[kW
h/㎡
]
Est
imate
d P
ow
er
Gen
era
tion
[kW
h]
Source : Prepared by the Study Team
Figure 6.5.1-5 Estimated Monthly Power Generation (New Secondary School for Girls)
6-10

0.0
20.0
40.0
60.0
80.0
100.0
120.0
140.0
160.0
180.0
200.0
0
500
1,000
1,500
2,000
2,500
3,000
Jan Feb Mar Apr May Jun Jul Aug Sep Oct Nov Dec
Mon
thly
Inte
grate
d G
robal S
ola
r
Irra
dia
tion
[kW
h/㎡
]
Est
imate
d P
ow
er
Gen
era
tion
[kW
h]
Source : Prepared by the Study Team
Figure 6.5.1-6 Estimated Monthly PV Power Generation (President’s Office)
Assuming that the installation of grid-connected PV systems to the pilot project sites on Male’ Island
is completed by 2011, the cumulative power generation will be as follows:
Cumulative power generation by 2020 = Pilot project of total annual PV Power generation x
10 years
= 555,948 kWh x 10
= 5,559,480 kWh
6.5.2 Saving on Diesel Fuel Consumption
Using the same technique as described in 4.11.2, the effect in terms of diesel fuel consumption saving
was calculated. By using the fuel consumption coefficient on Male’ Island of 0.26 [liter/kWh], the
annual diesel fuel saving works out as follows:
Annual diesel fuel saving = Annual PV Power Generation on pilot project sites x 0.26
= 555,948 kWh x 0.26 liter/kWh
= 144,546 liter
Accordingly, the cumulative saving on diesel fuel consumption over than 10 years to 2020 are
1,445,460 liters.
6.5.3 CO2 Emission Reductions
Based on the diesel fuel savings as calculated in 6.5.2, the following coefficient was used to calculate
the amount of CO2 emission reductions
6-11

6-12
CO2 reduction [kg] = Light oil CO2 emission coefficient* x Diesel fuel saving
= 2.62 [kg-CO2/liter] x Diesel fuel saving [liter]
* Concerning to the emission coefficient, the Total Emissions Calculation Method Guidelines of
the Ministry of Environment were quoted.
As a result, it is estimated that the annual CO2 emission reductions at the pilot project sites are 379
tons, and that the total CO2 emission reductions over than 10 years up to 2020 are 3,790 tons.
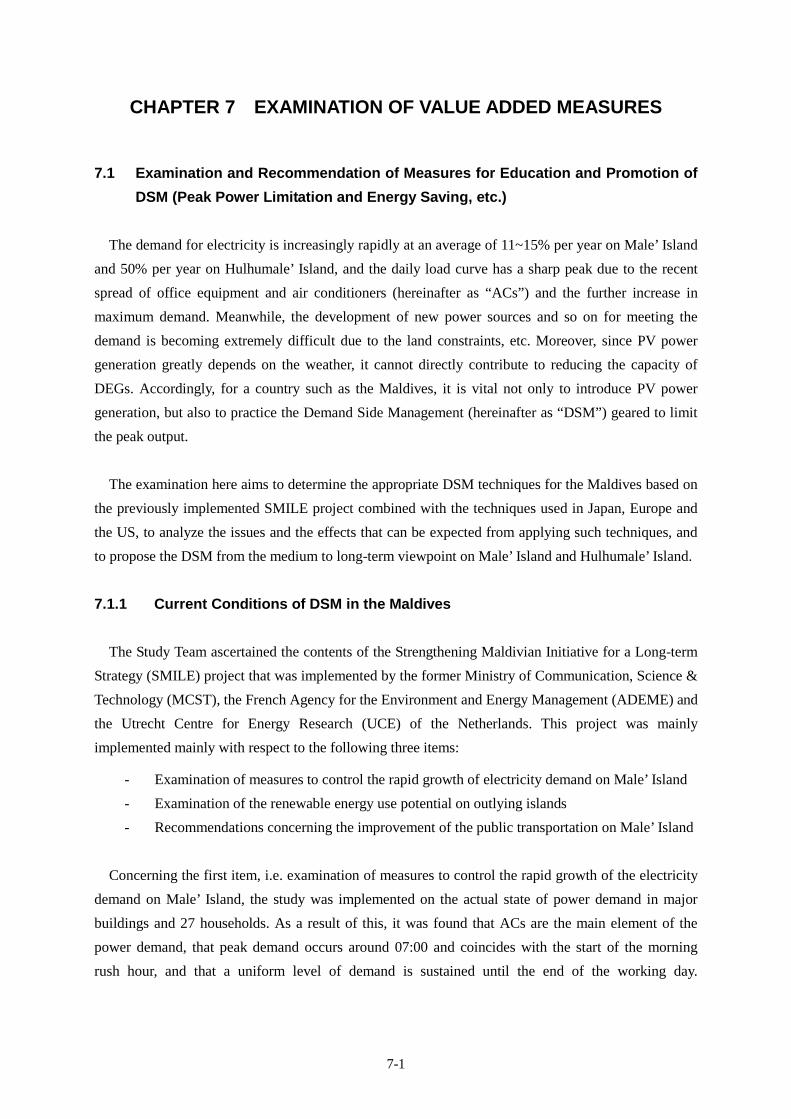
7-1
CHAPTER 7 EXAMINATION OF VALUE ADDED MEASURES
7.1 Examination and Recommendation of Measures for Education and Promotion of
DSM (Peak Power Limitation and Energy Saving, etc.)
The demand for electricity is increasingly rapidly at an average of 11~15% per year on Male’ Island
and 50% per year on Hulhumale’ Island, and the daily load curve has a sharp peak due to the recent
spread of office equipment and air conditioners (hereinafter as “ACs”) and the further increase in
maximum demand. Meanwhile, the development of new power sources and so on for meeting the
demand is becoming extremely difficult due to the land constraints, etc. Moreover, since PV power
generation greatly depends on the weather, it cannot directly contribute to reducing the capacity of
DEGs. Accordingly, for a country such as the Maldives, it is vital not only to introduce PV power
generation, but also to practice the Demand Side Management (hereinafter as “DSM”) geared to limit
the peak output.
The examination here aims to determine the appropriate DSM techniques for the Maldives based on
the previously implemented SMILE project combined with the techniques used in Japan, Europe and
the US, to analyze the issues and the effects that can be expected from applying such techniques, and
to propose the DSM from the medium to long-term viewpoint on Male’ Island and Hulhumale’ Island.
7.1.1 Current Conditions of DSM in the Maldives
The Study Team ascertained the contents of the Strengthening Maldivian Initiative for a Long-term
Strategy (SMILE) project that was implemented by the former Ministry of Communication, Science &
Technology (MCST), the French Agency for the Environment and Energy Management (ADEME) and
the Utrecht Centre for Energy Research (UCE) of the Netherlands. This project was mainly
implemented mainly with respect to the following three items:
- Examination of measures to control the rapid growth of electricity demand on Male’ Island
- Examination of the renewable energy use potential on outlying islands
- Recommendations concerning the improvement of the public transportation on Male’ Island
Concerning the first item, i.e. examination of measures to control the rapid growth of the electricity
demand on Male’ Island, the study was implemented on the actual state of power demand in major
buildings and 27 households. As a result of this, it was found that ACs are the main element of the
power demand, that peak demand occurs around 07:00 and coincides with the start of the morning
rush hour, and that a uniform level of demand is sustained until the end of the working day.
7-2
Accordingly, the study focused on the steps to limit the demand by ACs and recommended the
concrete techniques for that purpose.
This study, jointly implemented by STELCO and the MSCT, targeted 27 households and primary commercial and public facilities, and it investigated conditions of ownership and use of electrical equipment. The findings regarding ordinary households on Male’ Island were as follows:
- Electrical appliance ownership in general households is on the same level as in Europe: households on average own a washing machine, refrigerator, TV and DVD player, etc.
- Electrical appliances are extremely new, indicating better lifestyles and improving products on markets in recent years.
- However, it is rare for ordinary households to own air conditioners.
Meanwhile, survey of commercial and public facilities (STELCO, Port Authority, Bank of Maldives and MCST) showed that air conditioners are used from 07:00 and a uniform level of power consumption is maintained during working hours.
Source : SMILE Project
Fig. 7.1.1-1 Results of Power Consumption Survey in 27 Households and Commercial
and Public Facilities in the SMILE Project
Moreover, STELCO itself is working on the steps to educate people about DSM, and its major
activities in this area are as follows. However, it has had to suspend activities since 2006 because of
the deterioration in its financial situation. It hopes to resume these measures at some point, however,
there is no immediate prospect due to the difficulty in raising funds.
<Main DSM enlightenment activities by STELCO>
- Placing of the DSM posters at key points (government buildings, hospitals, schools, trunk
roads, etc.) through Male’ City
- Staging of the DSM events and distributing of the DSM posters and stickers on artificial
beaches
- Broadcasting of the commercials geared to promote the DSM on TV
- Implementing the DSM lectures by STELCO employees at schools
Fig. 7.1.1-2 DSM Education Poster Source: STELCO

7-3
7.1.2 DSM Techniques Appropriate to the Maldives
(1) Analysis of DSM Techniques
The DSM techniques aim to form efficient and desirable supply and demand relationship by
controlling the demand through the approaches to the consumers. Electric power company can
realize postpone constructing new power plants, energy saving and reduction of the environmental
burden by implement of energy efficiency and load leveling. Consumers also can reduce the
expenditure for electricity by the installation of the electric equipment with high energy saving
effect and the adjustment of time zone to utilize electricity. Table 7.1.2-1 summarizes the DSM
techniques by its types.
Table 7.1.2-1 Purpose of DSM Techniques
Type Method Image
① Reduction of
power consumption
Reducing actual power consumption through using high efficiency technology on refrigerators and TVs, etc.
② Reduction of peak
load
Prohibiting use of washing machines and air conditioners, etc. at times of peak power consumption; and using low power consuming technology to reduce peak load
③
Shifting of peak load
Shifting the peak power consumption time frame by adopting time-based electricity tariffs and seasonal tariffs
(2) Examination of Concrete DSM Techniques (Supply Side and Demand Side) appropriate to
Male’ Island and Hulhumale’ Island
Electricity demand seems to grow dramatically in Male’ and Hulhumare’ Island in the future, it is
necessary to construct an ideal structure of the electricity consumption from the view point of the
effectiveness of utilization of the power system by implementing the DSM shown in Table 7.1.2-1
comprehensively and effectively. Among them, to cover the future electricity demand by utilizing
electricity in the night time, in the other words, ③Shifting of peak load in Table 7.1.2-1 can be said as the
desirable load curve especially in Male island which has the difficulty in developing of new power sources
due to the land constraints. Because this load curve can improve the load rate and the utilization rate of
power generators and postpone the life time of power generators. The different DSM techniques are
Daytime NightNight
Power
Time
Source : Prepared by the Study Team
7-4
desirable for Male’ and Hulhumare’, because Male’ and Hulhumare’ Island have the difference in the
situation of the demand and supply of electricity. However, we summarize the appropriate DSM
techniques by focusing on not only Male’ and Hulhumare’ Island but also 7 provinces, here. Because
now the new governmental manifest concept which divides the all land in the Maldives into 7 provinces
is moving ahead step by step and the legal systems which regulate these provinces complementary are
also being arranged step by step. In addition, the resort islands are not taken into this consideration here,
because they are outside the government’s jurisdiction at present.
Concerning the tight budget of the government and the tight man power in the Maldives, the
appropriate DSM techniques are shown in Table 7.1.2-2.
Table 7.1.2-2 Examples of Concrete DSM Techniques (Supply Side and Demand Side)
Appropriate to the Maldives
DSM Techniques Implementer
Enlightenment Activities ・Introduction of Official recommended electric appliance MHTE
Inserting in Compliance
Document in Building Code
・Construction of building with High heat insulating effect
・Design of proper AC system, Air ventilation system and
Lighting system
MEA
Revision of Building Code ・Obligation of Introduction of Official Authorized electric
appliance MEA
Introduction of Energy
managers ・Implementation of Regular energy audit
MHTE
Utility Co.
Construction of Energy
Conservation Act
・Obligation of Introduction of 1 Energy managers in each
Utility company, if necessary
・Obligation of Regular energy audit by Energy
managers in each province
・Setting of standard value of Energy saving
・Introduction of Energy saving Grading
MHTE
MEA
Addition of Type of Electric
tariff
・Introduction of Basic rate according to Demand
・Introduction of Time of Using of Electricity
MEA
Utility Co.
①Enlightenment Activities
Introduction of Official recommended electric appliance is proposed as the concrete strategy, here. This
tries to enlighten DSM techniques by inserting official recommended electric appliances which the
Ministry in charge of energy saving recommends on HP of that Ministry. Recommendation points, Energy
Source : Prepared by the Study Team

7-5
saving effect and cost and so on with the energy labels also are inserted on the HP with the introduction of
the official recommended electric appliances. They will contribute to enhance the enlightenment activities
of the DSM through the HP. Regarding the selection way of the official recommended electric appliances,
the Ministry in charge of the energy saving will announce the manufacturers or the retail stores to submit
the applications which describe the recommended electric appliances, their effect of the saving energy and
their costs, etc. and review the applications.
In the future, “Recommended” will be changed to “Authorized” at the time of the revision of the
building code and the building code will obligate to install them when the new-building and the
reconstruction of the public building
②Inserting in Compliance Document in Building Code
Although this will be explained in 7.1.3 Legal Systems in detail, Revision of Building code including the
construction of buildings with the high insulating effect, etc. is proposed, here. The revision of the building
code can improve the efficiency of the operation of the electric appliances inside the building. It can
contribute to mitigate the total energy consumption inside the building and peak load. Therefore, it can
contribute to mitigate the rapid growth of the electricity demand and supply in Male’ island and Hulhumale’
island.
Although the building code has already been established in August 2008 in the Maldives, the compliance
documents which describe the details are being made by July 2010. The ministry or the department in
charge of issuing the compliance documents is described in the building code, and the Ministry in charge of
these items (“Construction of building with High heat insulating effect” and “Design of proper AC system,
Air ventilation system and Lighting system”) in Table 7.1.2-2 is MEA.(G8:Artificial light, H1:Energy
Efficiency in the building code are corresponded to “Construction of building with High heat insulating
effect” and “Design of proper AC system, Air ventilation system and Lighting system”)Therefore, we
The Ministry in charge
Manufacturer(Retail store)
Review by the Ministry
Inserting HP
announce
Submission of application
approval
Fig. 7.1.2-1 Steps for inserting HP
Source : Prepared by the Study Team
7-6
proposed to insert “Construction of building with High heat insulating effect” and “Design of proper AC
system, Air ventilation system and Lighting system” into the compliance documents which are being made
now.
③Revision of Building Code
“Obligation of Introduction of Official Authorized electric appliance” is proposed here as concrete
strategy. As ①Enlightenment Activities has already described, this is mandate for “Introduction of Official
Authorized electric appliance” when the new-building and the reconstruction of the public building by
changing “Recommended” to “Authorized.” A few years will be necessary to collect the data and analyze
them for changing “Recommended” to “Authorized”, therefore, “Revision of Building code” is estimated to
be conducted in approximately 5 years.
④Introduction of Energy managers
“Energy managers” are the persons who implement the regular energy audit. The regular energy audit is
the audit which can contribute to improve the efficiency of the energy use in the target facilities. The
concrete contents of the energy audit are to check the temperature and the maintenance situation of the air
conditioners, to introduce the government recommended/authorized electric appliances and the successful
examples of the DSM, etc. It is desirable in our proposal that the energy audit is not the enforced style such
as the inspection but is the acceptant style for the customers such as the diagnosis which can contribute to
reduce the electric tariff.
The qualified system for the energy managers such as Japanese style does not exist in the Maldives and
there are few engineers who have the knowledge of energy in the Maldives. Therefore, on the early step of
“Introduction of Energy managers”, STELCO will introduce 2 persons as the energy managers and they
will implement the trial energy audit in Male’ and Hulhumale’ island for the training of acquiring basic
knowledge.
On the next step, by evaluating the result of the trial and by considering the necessity of the regular
energy audit and the necessary cost, “Construction of Energy Conservation Act” will obligate to introduce 1
energy manager into each utility company in 7 provinces, if necessary and will be responsible for the main
buildings which have more load than the standard in each province to implement the regular energy audit.
Accordingly, 2 persons in STELCO, 1 person in each utility company except STELCO and 1 person in the
Ministry in charge of energy saving will be introduced as the energy managers in the future. And the energy
managers will be obligated to submit the annual report for their activities to the energy manager in the
Ministry.
Although the setting of the standard value of the energy saving also is proposed together in
“Construction of Energy Conservation Act”, the standard value will be set based on the analysis of the data
which will be collected by the regular energy audit.

7-7
⑤Construction of Energy Conservation Act
As being explained in ④Introduction of Energy managers is proposed here, which will obligate to
introduce 1 energy manager into each utility company in 7 provinces, if necessary and will be responsible
for the main buildings which have more load than the standard in each province to implement the regular
energy audit by evaluating the result of the trial energy audit in Male’ and Hulhumale’ island and by
considering the necessity of the regular energy audit and the necessary cost. And the standard value of the
energy saving also will be set in this Energy Conservation Act (e.g.; within 300W/m2 of the energy
consumption for a large factory). In addition, the grading will be implemented according to the efficient
rate compared with the standard value to enhance the voluntary effort for environment. (e.g.; 5 –star rank
will be given to the building which has the energy saving rate more than half of the standard value). On the
other hand, the setting of the penalty against the building which has the energy saving rate more than the
standard value will be the effective measure.
⑥Addition of Types of Electric tariff
Here, “Introduction of Basic rate according to Demand” and “Introduction of Time of Using of
Electricity” are proposed. The feature and effect of each electric tariff is as follows.
⑥-1 Introduction of Basic rate according to Demand
Although the present electric tariff in the Maldives is composed of only specific tariffs, “Basic rate
according to Demand” is to conclude the demand contract according to the capacity of the electric facilities
between customers and an electric power company, the basic rate is imposed according to the electricity
demand (contract demand). This contract decides the power which a contractor can utilize at one time
between a contractor and an electric company in advance and can contribute to control the electric demand
by an electric power company. This electric tariff had been introduced in Japan from early on, and it can
contribute for electric companies to control the electric demand in Japan. The suitable introduction of this
electric tariff in Male’ island and Hulhumale’ island is to target the main commercial and public facilities,
to install the demand meters into them and to impose the electric tariff according to the demand by
applying the basic rate. Therefore, this electric tariff can be said the effective DSM in Male’ island and
Hulhumale’ island for little burden to the cost and the man power, although there are a few items (e.g.;
setting price of the basic rate) to be considered.
⑥-2 Introduction of Time of Using of Electricity
This sets the different electric tariff according to the time zone of using electricity. The electricity
tariff is approx. 2.2 MRf/kWh in the daytime and approx. 1.1MRf/kWh in the night time in Japan.
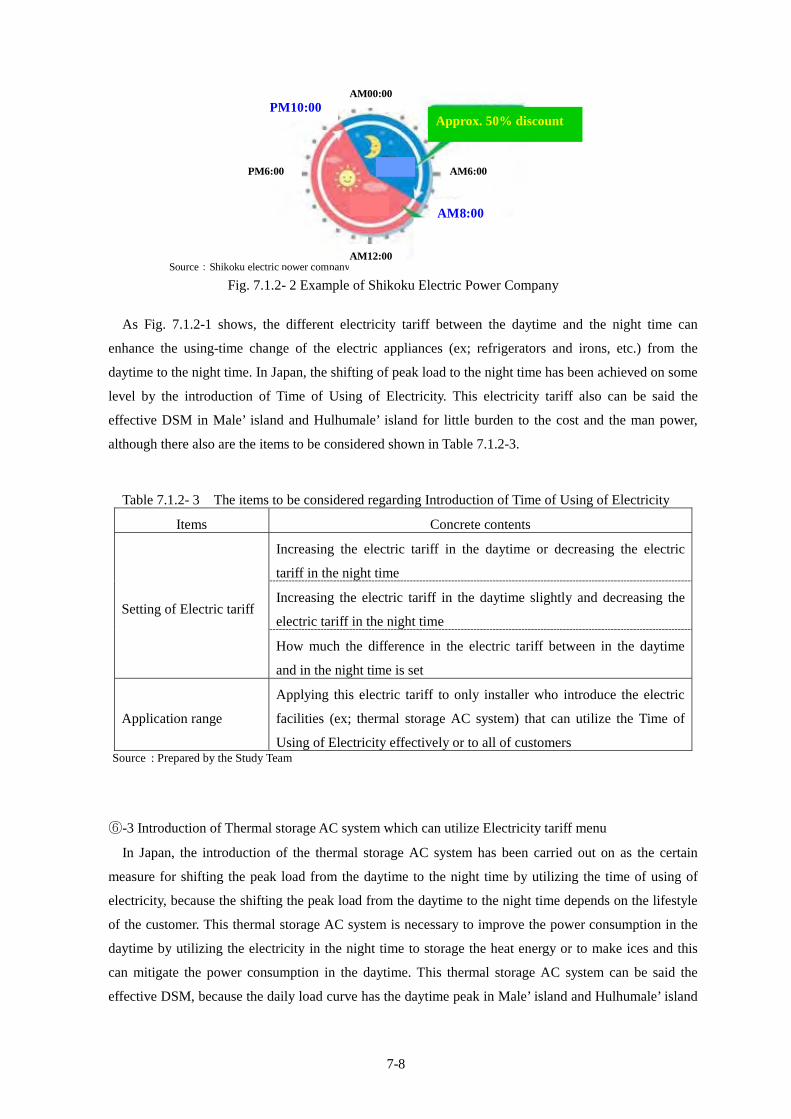
7-8
As Fig. 7.1.2-1 shows, the different electricity tariff between the daytime and the night time can
enhance the using-time change of the electric appliances (ex; refrigerators and irons, etc.) from the
daytime to the night time. In Japan, the shifting of peak load to the night time has been achieved on some
level by the introduction of Time of Using of Electricity. This electricity tariff also can be said the
effective DSM in Male’ island and Hulhumale’ island for little burden to the cost and the man power,
although there also are the items to be considered shown in Table 7.1.2-3.
Table 7.1.2- 3 The items to be considered regarding Introduction of Time of Using of Electricity
Items Concrete contents
Increasing the electric tariff in the daytime or decreasing the electric
tariff in the night time
Increasing the electric tariff in the daytime slightly and decreasing the
electric tariff in the night time Setting of Electric tariff
How much the difference in the electric tariff between in the daytime
and in the night time is set
Application range
Applying this electric tariff to only installer who introduce the electric
facilities (ex; thermal storage AC system) that can utilize the Time of
Using of Electricity effectively or to all of customers Source : Prepared by the Study Team
⑥-3 Introduction of Thermal storage AC system which can utilize Electricity tariff menu
In Japan, the introduction of the thermal storage AC system has been carried out on as the certain
measure for shifting the peak load from the daytime to the night time by utilizing the time of using of
electricity, because the shifting the peak load from the daytime to the night time depends on the lifestyle
of the customer. This thermal storage AC system is necessary to improve the power consumption in the
daytime by utilizing the electricity in the night time to storage the heat energy or to make ices and this
can mitigate the power consumption in the daytime. This thermal storage AC system can be said the
effective DSM, because the daily load curve has the daytime peak in Male’ island and Hulhumale’ island
Fig. 7.1.2- 2 Example of Shikoku Electric Power Company
Approx. 50% discount
Source:Shikoku electric power company
PM10:00
AM8:00
AM6:00PM6:00
AM00:00
AM12:00

7-9
and approx. 50% of it is AC system load in the commercial and public facilities. And this thermal storage
AC system can contribute to mitigate the capacity of AC system and can utilizes the basic rate according
to the demand effectively.
⑥-3-1 Thermal storage AC system
This system is the high efficient and the clean energy system, because this system utilizes the heat
energy stored in the night time by the electricity in the night time for the operation of ACs in the
daytime.
⑥-3-2 Concept of Thermal storage AC system operation
This system utilizes the heat energy stored in the night time for the operation of ACs in the daytime.
The necessary energy of the operation of AC in the daytime can be mitigated. In the other words, the
necessary capacity of AC can be mitigated.
⑥-3-3 Merits of Thermal storage AC system
a)Cost reduction
Night Outside facility Storage
facility
Inside facility
Storage facility
Inside facility
Outside facility
Source:Shikoku electric power company
Daytime
Daily AC load
Operation
for storage
of Cool heat
Operation for making of Cool heat
to be consumed immediately
Utilizationof stored Cool heat
Using time of AC
Necessary capacity of A
C system
with
out therm
al storage
Red
uction
of A
C system
C
apacity
AC
system
Capacity w
ith therm
al storage
Source:Shikoku electric power company

7-10
The Japanese electricity tariff has two types; “basic rate according to demand” and “cheap
electricity tariff for the night time.” The thermal storage AC system can mitigate the capacity of AC
and can reduce the basic rate. And the thermal storage AC system also can reduce the cost for the
operation of AC by covering the part of the necessary power of AC in the daytime by the cheap
electricity tariff in the night time.
b)Capacity reduction
As ⑥-3-2 Concept of Thermal storage AC system operation shows, The thermal storage AC
system can mitigate the capacity of AC by utilizing the heat energy stored in the night time for the
operation of AC in the daytime.
c)Wealth of types
The suitable type or size of thermal storage AC system according to the target building can be
selected, because there are many types. “Eco・Ice mini” and ”Building Multi Type” are small size
and can be installed easily when not only new-built but also reconstruction. It can be thought that
these two types will be able to produce enough effect. Because the densities of the buildings are
very high and the total floor spaces of them are very small in Male’ Island.
d)Contribution to Energy saving
This system can contribute to the energy saving, because this system can store the heat energy by
the efficient rated operation in the night time.
e)Environmental friendly
The load factor of the power generators can be improved by the efficient rated operation in the
night time and contribute to reduce the CO2 emission.
Cool media piping
Source:Shikoku electric power company
Heat storage facility
Outside facility
Inside facility
Outside facility
Eco-Ice Mini
Heat storage facility
Heat storage facility
Waterpiping
Inside unit
Inside unit
Heat resource facility
Heat resourcefacility
Cool media piping
Duct
Duct
AC
AC
AC
Duct
Duct
Duct
Duct
AC
Heat storage facility Heat storage facility
Heat resourcefacility Water
piping
Building-Multi Type Unit Type Introduction with
Construction of Building
Ice heat storage Eco-Ice system Ice Heat Storage System
Deconcentration System Concentration System
Cool media piping
Underground slab
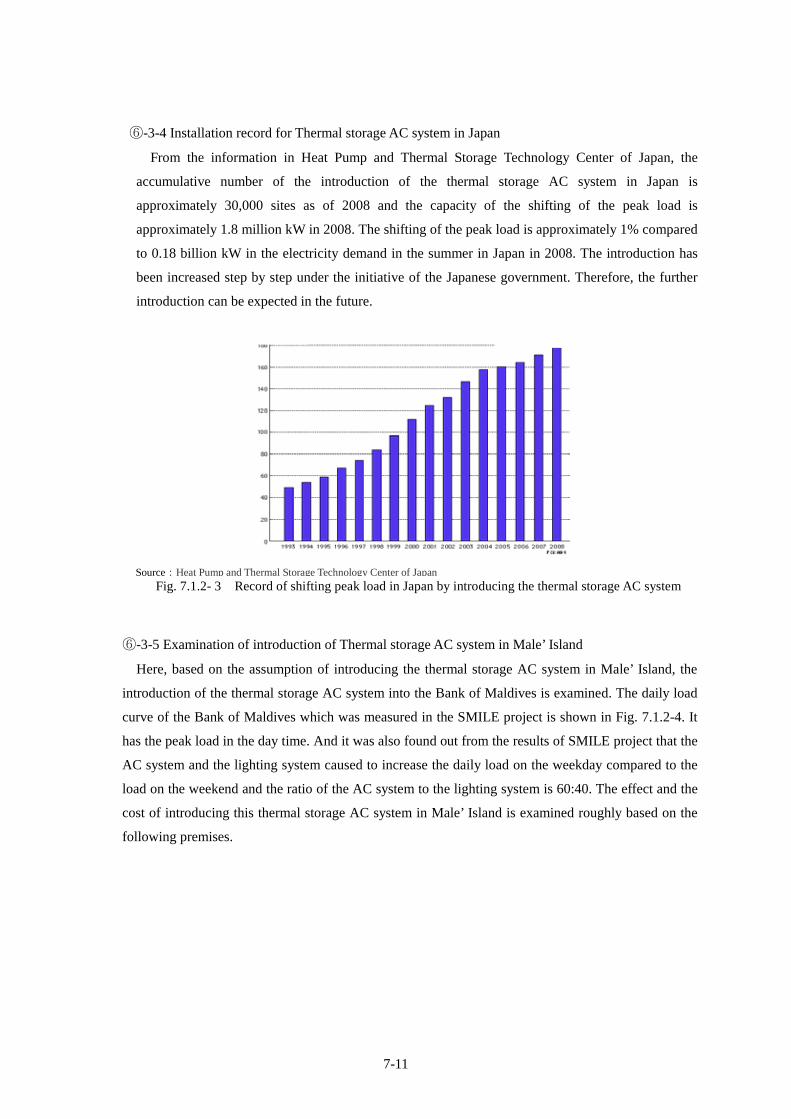
7-11
⑥-3-4 Installation record for Thermal storage AC system in Japan
From the information in Heat Pump and Thermal Storage Technology Center of Japan, the
accumulative number of the introduction of the thermal storage AC system in Japan is
approximately 30,000 sites as of 2008 and the capacity of the shifting of the peak load is
approximately 1.8 million kW in 2008. The shifting of the peak load is approximately 1% compared
to 0.18 billion kW in the electricity demand in the summer in Japan in 2008. The introduction has
been increased step by step under the initiative of the Japanese government. Therefore, the further
introduction can be expected in the future.
⑥-3-5 Examination of introduction of Thermal storage AC system in Male’ Island
Here, based on the assumption of introducing the thermal storage AC system in Male’ Island, the
introduction of the thermal storage AC system into the Bank of Maldives is examined. The daily load
curve of the Bank of Maldives which was measured in the SMILE project is shown in Fig. 7.1.2-4. It
has the peak load in the day time. And it was also found out from the results of SMILE project that the
AC system and the lighting system caused to increase the daily load on the weekday compared to the
load on the weekend and the ratio of the AC system to the lighting system is 60:40. The effect and the
cost of introducing this thermal storage AC system in Male’ Island is examined roughly based on the
following premises.
Fig. 7.1.2- 3 Record of shifting peak load in Japan by introducing the thermal storage AC system Source:Heat Pump and Thermal Storage Technology Center of Japan
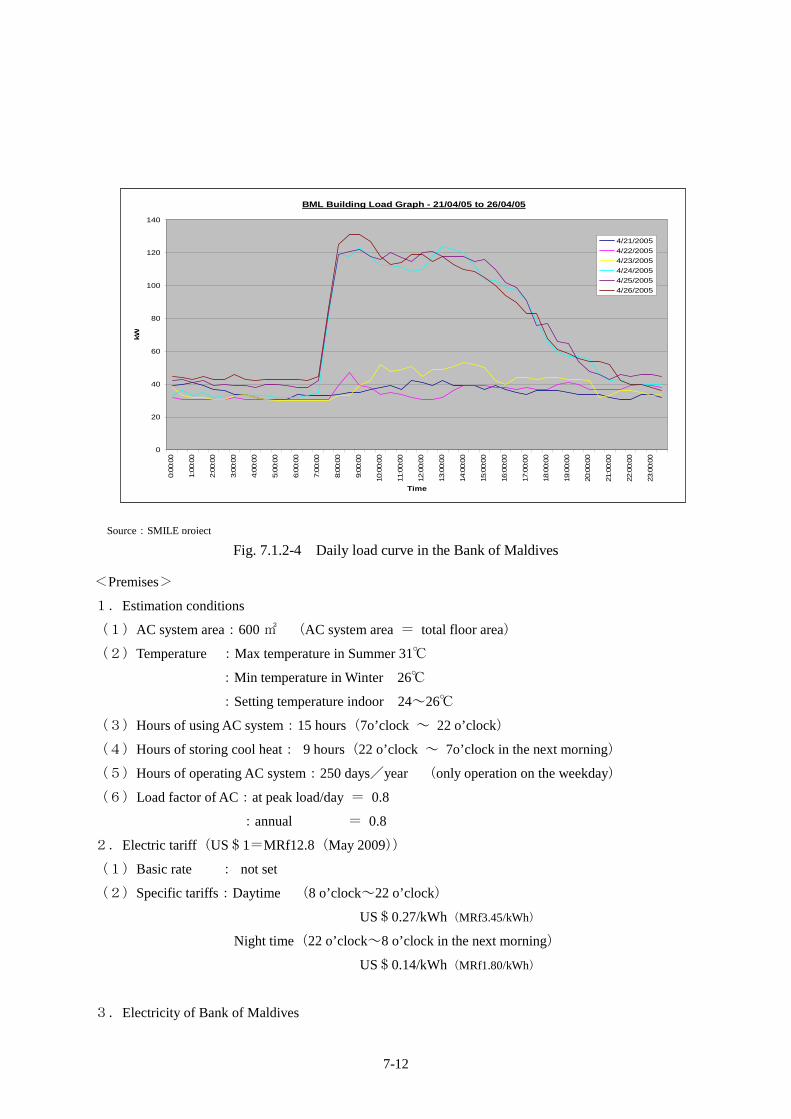
7-12
Fig. 7.1.2-4 Daily load curve in the Bank of Maldives
<Premises>
1.Estimation conditions
(1)AC system area:600 ㎡ (AC system area = total floor area)
(2)Temperature :Max temperature in Summer 31℃
:Min temperature in Winter 26℃
:Setting temperature indoor 24~26℃
(3)Hours of using AC system:15 hours(7o’clock ~ 22 o’clock)
(4)Hours of storing cool heat: 9 hours(22 o’clock ~ 7o’clock in the next morning)
(5)Hours of operating AC system:250 days/year (only operation on the weekday)
(6)Load factor of AC:at peak load/day = 0.8
:annual = 0.8
2.Electric tariff(US$1=MRf12.8(May 2009))
(1)Basic rate : not set
(2)Specific tariffs:Daytime (8 o’clock~22 o’clock)
US$0.27/kWh(MRf3.45/kWh)
Night time(22 o’clock~8 o’clock in the next morning)
US$0.14/kWh(MRf1.80/kWh)
3.Electricity of Bank of Maldives
Source:SMILE project
BML Building Load Graph - 21/04/05 to 26/04/05
0
20
40
60
80
100
120
140
0:00
:00
1:00
:00
2:00
:00
3:00
:00
4:00
:00
5:00
:00
6:00
:00
7:00
:00
8:00
:00
9:00
:00
10:0
0:00
11:0
0:00
12:0
0:00
13:0
0:00
14:0
0:00
15:0
0:00
16:0
0:00
17:0
0:00
18:0
0:00
19:0
0:00
20:0
0:00
21:0
0:00
22:0
0:00
23:0
0:00
Time
kW
4/21/2005
4/22/2005
4/23/2005
4/24/2005
4/25/2005
4/26/2005

7-13
(1)Peak load :approx. 135kW
(2)Off-peak load:approx. 40kW
(3)Rate of power consumption of AC system and Lighting system:60%:40%
(4)Shifting of power consumption:shifting 30% of power consumption in the day time to the night time
(5)Reduction amount of Peak load:30%
4.Introducing facilities(applying the system cost ant the installation cost in Japan)
(1)System type :Ice storage Building-Multi AC system(Cooling capacity 56kW)3units
(2)System cost :US$48,000/unit
(including only the outside facilities and the storage system (not including the inside facilities))
(3)Installation cost:US$2,700/unit
(4)O&M cost :1% of System cost + Installation cost
5.STELCO
(1)Investment for introducing the diesel generators:US$2,520/kW
6.Electricity in Male’ Island
(1)Peal load in Male :approx. 32MW(2008)
(2)Rate of main buildings : 80%
(3)Rate of capacity of AC system and Lighting system:60%:40%
(4)Rate of power consumption of AC system and Lighting system:60%:40%
(5)Diversity factor of peal load :0.8
(6)Generated electric energy in Male:195,106MWh(2008)
○Effect
Electric power for AC system in peak load :(135kW - 40kW)* 0.6 = 57kW
System capacity of AC system in peak load:57kW * 3 = 171kW
Daily energy for AC system :171kW * 15h * 0.8 = 2,052kWh/day
Shifting electric power for AC system to the night time
:2,052kWh/day * 0.3 = 616kWh/day
○Cost
Customer
System cost :US$48,000/unit * 3units = US$144,000(1,843,200MRf)
Installation cost:US$ 2,700/unit * 3units = US$ 8,100( 103,680MRf)
O&M cost : US$ 1,521( 19,469MRf)
Total : US$153,621(1,966,349MRf)

7-14
Amount of difference of electric tariff per day:
616kWh/day * (US$0.27/kWh ― US$0.14/kWh) = US$80/day
Amount of difference of electric tariff per year:
US$80/day * 250days * 0.8 = US$16,000/year
Payback period:US$153,621 ÷ US$16,000 = approx. 10years
From the result of the above rough examination, the effect is to shift approx. 620kWh/day to the night
time based on the assumption of introducing the appropriate type and size of the thermal storage AC system
(Ice storage Building-Multi AC system)for the Bank of Maldives and of shifting 30% of the power
consumption from the daytime to the night time. And the cost of the customer is to pay back the cost of this
system in approx. 10 years, if the electricity tariff in the night time is set half of the electric tariff in the
daytime.
Electric power company
In the above, the cost for the customer(Bank of Maldives) was estimated. Here, the cost for the
electric power company is estimated.
○Rescheduled equipment investment by mitigating the peak load
The reduction amount of the peak load is 30%, if the thermal storage C system is introduced into the
Bank of Maldives, the introduction of the appropriate size of the thermal storage system into 30% of the
main buildings, and the same kind of the effect are assumed, here.
The amount of mitigating the peak load in Male’:
32MW * 0.8(Rate of main buildings to peak load)* 0.6(Rate of capacity of AC system to peak load)* 0.8
(Diversity factor of peal load)* 0.3(30% of main buildings)* 0.3(Reduction amount of Peak load)= 1.1MW
Rescheduled equipment investment by mitigating the peak load:
1.1MW * 1000 * US$2,520/kW = US$2,772,000
○Income reduction by introducing the Time of Using of Electricity
Shifting electric power for AC system to the night time in the case of introducing the thermal storage
AC system into the Bank of Maldives is estimated 616kWh/day. The introduction of the appropriate size
of the thermal storage system into 30% of the main buildings and the same kind of the effect of the Bank
of Maldives are assumed, here. And the power consumption in the main buildings is assumed as the
Business(27%) + the Business Special(7%) + the Government(17%) in Fig. 3.3.2-7.

7-15
Shifting yearly electric power for AC system to the night time in Male’:
195,106MWh/year * 0.51(Power consumption of main buildings)* 0.6(Rate of power consumption of AC
system)* 0.3(30% of main buildings)* 0.3(Shifting of power consumption)= 5,373MWh/year
Income reduction by introducing the Time of Using of Electricity:
5,373MWh * 1000 * (US$0.27/kWh ― US$0.14/kWh) = US$698,490/year
From the result of the above rough examination, in the view point of the cost for the electric power
company, on the assumption that 30% of the main buildings in Male’s Island will introduce the appropriate
sizes of the thermal storage AC systems, the merit of rescheduled equipment investment by mitigating the
peak load is approximately US$3 million, and the income reduction by introducing the Time of Using of
Electricity is approximately US$0.7 million/year.
7.1.3 LEGAL SYSTEMS
Here, the necessary legal systems for the dissemination of the DSM in the Maldives are analyzed. As
described in 3.1.1, the legal systems regarding the energy and power sector in the Maldives are only “Law
governing public services” and “Regulations on public supply of electricity in Male’ and outer Atolls”,
therefore, the legal system concerned with the DSM directly does not exist. And regarding the
construction, although the building code was established in August 2008, it provides just a rough
performance stipulation. Therefore, the legal system concerned with the DSM does not actually exist as
well.
The Japanese legal system regarding the DSM is “Act on the Relational Use of Energy(hereinafter as
“Japanese Energy Conservation Act”).” For the purpose of securing the efficient use of the fuel resource
in the outside and inside economic and social aspect regarding energy, the measures and the penalties
regarding the relational use of energy in factory, building and machinery and appliances, etc. are
prescribed in this act, and this act can be useful for “Construction of Energy Conservation Act,” ”
Inserting in Compliance Document in Building Code” and ” Revision of Building Code” in Table 7.1.2-2.
Regarding “Construction of Energy Conservation Act”, the useful parts in the Japanese Energy
Conversation Act are, by picking up from the parts regarding the factories, to obligate the factories which
have the annual energy consumption more than a certain value to introduce the energy manager, to make
and submit the medium & long-term plan regarding the energy use and to report the results regularly.
Although these elements are very effective in the Maldives due to the land constraints, but “Construction
of Energy Conservation Act” is proposed as the more appropriate DSM measure from the view point of
the cost and the man power, which will obligate to the main buildings which have more load than the
standard in each province to implement the regular energy audit by energy managers introduced in each
utility company based on evaluating the result of the trial energy audit in Male’ and Hulhumale’ island and
considering the necessity of the regular energy audit and the necessary cost. And the standard value of the
energy saving also will be set in this Energy Conservation Act (e.g.; within 300W/m2 of energy
consumption for large factory). In addition, the grading will be implemented according to the efficient rate

7-16
compared with the standard value to enhance the voluntary effort for environment (e.g.; 5 stars will be
given to the building which has the energy saving rate more than half of the standard value). On the other
hand, the setting of the penalty against the building which has the energy saving rate more than the
standard value will be the effective measure.
The main elements in the Japanese Energy Conservation Act are shown in Table 7.1.3-1 as the reference.
Table7.1.3-1 The main elements for the designated factories
in the Japanese Energy Conservation Act Article General outline
Article 5 The judgmental
standard for business person
Concerning the decision way of the judgmental standard for business person (Decision way of the judgmental standard:The minister of Economic, trade and industry
settles the judgmental standard for the business person who utilizes the energy in the factory and publishes it in order to rationalize and utilize the energy efficiently in the factory.)
Article 7 The designation of the energy management factory
Concerning the designation of the energy management factory (Designation:The minister of Economic, Trade and Industry designates the factory which
consumes the energy more than the standard value prescribed in the government ordinance as the factory which needs to promote the energy using rationalization in specific.)
Article 8 Energy managers
Concerning the introduction of the energy managers (Introduction:The designated factory is obligated to introduce the energy managers.)
Article 14 The formulation of the medium and long-term plan
Concerning the formulation of the medium and long-term plan (Plan formulation:The designated factory should submit the medium and long-term plan for the energy using rationalization to the minister in charge.)
Article 15 Regular report
Concerning the regular report (Report:The designated factory should report the energy consumption, the utilization situation for the other energy, the equipments which consume energy , the introduction, the improvement and the elimination of the equipment regarding the energy using rationalization.)
Source:created by the Study team from the Act on the Relational Use of Energy in Japan
Regarding “Inserting in Compliance Document in Building Code” and ” Revision of Building Code”, the
useful parts in the Japanese Energy Conversation Act are to prevent the heat loss from the outer wall of the
construction, etc. and to make an effort to introduce the efficient air-conditioning facilities. To regulate the
construction of the buildings which can save energy and the introduction of the energy efficient electric
appliances is very effective measure like the Japanese Energy Conservation Act. Therefore, based on the
Japanese Energy Conservation Act, the inserting the construction of the building with high heat insulating
effect and the design of the proper AC system, the proper air ventilation system and the proper lighting
system in the compliance document in the building code” by focusing on the new-built and the
reconstruction is proposed, here. And to obligate the introduction of the official authorized electric
appliance when the public buildings will be new built or reconstructed by the revised building code is
proposed as well.

7-17
Table7.1.3-2 The main elements for the construction
in the Japanese Energy Conservation Act Article General outline
Article 72 The effort of the constructors, etc.
Concerning the effort of the constructors (Effort target:The constructors should make their effort to contribute to the energy using
rationalization in the construction by preventing the heat loss through the outer wall or the windows and implementing the measures of the energy using rationalization for AC in the construction.)
Article 73 The judgmental standard for the constructor and the owner of the specific construction
Concerning the judgmental standard for the constructor and the owner of the specific construction
(Judgmental standard:The minister in charge settles the judgmental standard for the constructor and the owner of the major construction and public it in order to rationalize and utilize the energy efficiently in the construction.)
Article 75 The application and the direction, etc. for the specific construction
Concerning the application and the direction for the specific construction (Application:The specific construction should submit the application concerning the items of the design and the construction to the administrative government agency.)
Article 76 The admonition and
the mandate for the improvement of the performance
Concerning the admonition and the mandate for the improvement of the performance (Admonition:The minister in charge can admonish the constructor to improve the
performance of the new construction, if the necessity of the improvement can be recognized in the new construction.)
Source:created by the Study team from the Act on the Relational Use of Energy in Japan
7.1.4 Staging of Seminars
Enlightenment activities are essential for effectively advancing the DSM. Therefore, in the Study,
enlightenment activities will be implemented with so as to widely inform the people of the Maldives
about the DSM and ensure that power consumption limitation and shift measures efficiently produce
results. In order to effectively disseminate information, seminars on methods for improving use of
major electrical appliances were conducted in this study, targeting general citizens and resort
operators. Through these seminars, the understanding and the awareness of the importance of the DSM
was enhanced in the Maldives. The specific example is to issue the letter with the sign of the minister
of the MHTE to the government and the government-affiliated agencies, which requests to set the
temperature of the ACs above 25℃.
7.1.5 DSM Recommendations
Based on the above examination findings, the DSM techniques appropriate to Male’ Island and
Hulhumale‘ Island will be proposed from the medium to long-term viewpoint. When promoting the DSM, as
is shown in Fig. 7.1.4-1, rather than simply implementing power consumption limitation and shift measures, it
is essential to also conduct the enlightenment activities to ensure there is widespread understanding of the

7-18
need for such measures. A fundamental problem on Male’ Island and Hulhumale’ Island at present is that
citizens do not accurately understand that the electric power infrastructure is unable to keep up with economic
development and this is creating a highly strained demand and supply situation.
Therefore, it is recommended that an enlightenment activity be conducted with a view to widely informing
citizens of the current demand and supply situation and simple the DSM techniques that can be practiced in
homes, commercial and public facilities. The concrete strategy is “Introduction of Official recommended
electric appliance” as Table 7.1.2-2 shows. This is the inception of the enlightenment activities.
Under the situation which desires the rapid DSM due to the tight demand and supply, “Introduction of
Energy managers” is proposed as the DSM measure which does not require the budget and the man power
too much. The energy audit by this energy manager on the early stage will be implemented as the trial in
Male’ and Hulhumale’ Island. If the evaluation result of the trial is effective, the introduction of 1 energy
manager into each utility company in each province and the implementation of regular energy audit by the
energy manager introduced in each utility company in the main building will be obligated in the Energy
Conservation Act.
On the next step, at that time when the enlightenment activities and the regular energy audit activities
will be coming to stay, “Introduction of Basic rate according to Demand” and “Introduction of Time of
Using of Electricity”are proposed in order to promote the above 2 activities. The introduction of the basic
rate according to the demand can contribute the utility company to simplify the controlling of the electricity
demand and the introduction of the cheaper electricity tariff in the night time can be the incentive for the
customers to promote the shifting of the using time of electric appliances. In addition, the introduction of
the electric facilities (e.g.; Thermal storage AC system) which can utilize the above 2 electricity tariffs
efficiently will be implemented in the HP of the Ministry in charge of energy saving, when these electricity
tariffs will be introduced. However, there is the difficulty in increasing the electricity tariff again, because
the next electricity tariff increase has already been decided on Nov 1st in the STELCO territory. Therefore,
it can be desirable that the target point of introducing these 2 new electricity tariffs is the next electricity
tariff increase after the next, because the introduction of the cheaper electricity tariff in the night time can
mitigate the impact of increasing electricity tariff. And the introduction of these 2 new electricity tariffs in
other provinces will be implemented by evaluating the result in the STELCO territory.
When the level of the awareness among the citizens reaches a certain level by the enlightenment
activities and the above DSM measures, since the groundwork for adopting compulsory measures and so
on will have been laid, if necessary from the result of the trial, the construction of the energy
conservation act will be implemented and the energy conservation act will obligate to implement the
energy audit by the energy managers. In addition, the revision of the building code will be
implemented together and the building code will obligate the introduction of the official authorized
electric appliance when the public buildings will be new built or reconstructed. These will enhance the
DSM measures to come to stay in the Maldives further.

7-19
Source:created by the Study team
Fig. 7.1.5- 1 Proposal schedule in the view point of the medium & long-term
7.2 Examination and Recommendation of CDM Project Implementation
7.2.1 CDM Activities in the Maldives
As a country faced with the risk of becoming submerged (especially outer atolls) due to rising sea
level caused by global warming, Maldives is actively involved in measures to counter climate change.
It ratified the United Nation Framework Convention on Climate Change (UNFCCC) in 1993 and the
Kyoto Protocol in 1998, and has established the Ministry of Home Affairs as its Designated National
Authority (DNA). Under funding from the Global Environmental Facility (GEF), the government
completed the First National Communication of Maldives to the UNFCCC in 2001 and has compiled a
national strategy and action plan concerning the CDM. According to this document, the latest
inventory of greenhouse gas (GHG) emissions is derived from the results of the baseline survey
implemented in 1994 calculated using the reference approach of IPCC. According to these results, in
the energy sector, which is the large source of GHG emissions, 129 g of CO2 is emitted, and of this
approximately 80% is derived from gas and diesel fuels.
DS
M
Enlightenment Activities
Introduction of Energy Managers
Addition of Types of Electric tariff
Construction of Energy Saving Act
Revision of Building CodeInserting in Compliance
Prep.
Prep
Prep
Prep
1st phase Development
2nd phase Verification・Follow-up
2010 2015 2020
Prep

7-20
10.18 11.18
0.04
103.47
3.03 0.01
1.05
Gasoline
Aviation fuel
Other kerosene
Gas/Diesel
LPG
Bitumen
Lubricant
(Note) Unit: Tons Source : Prepared by the Study Team
Figure 7.2.1-1 Breakdown of CO2 Emissions in the Energy Sector
According to the First National Communication of Maldives to the UNFCCC, apart from the energy
field, emissions of methane (CH4) from solid waste buried underground are calculated as 1.1 g, while
concerning the transport, industry, agriculture and solid waste management sectors, etc., not enough
data have been obtained to calculate an inventory; moreover, no inventory has so far been compiled
regarding N2O emissions. Furthermore, although there is no experience of CDM projects in the past,
the following CDM potential projects have been proposed (funding has not yet been fixed). Virtually,
after publication of the First National Communication of Maldives to the UNFCCC, no other official
documents have been issued concerning CDM.
Table 7.2.1-1 CDM Potential Projects
No. Project
1 Appraising Coastal Erosion in the Maldives: Laying the Foundation for Adaptation to the Sea Level Rise and Climate Change
2 A Coastal Erosion Management Strategy for the Maldives 3 Feasibility Study for a National Population Consolidation strategy and Program 4 Upgrading of Gan Airport for International Operations 5 Program for Fisheries Conservation Measures and Community-Based Reef Resource Management 6 Development of Food Security in the Maldives 7 The Use of Infiltration Galleries to Supply Ground Water in the Islands 8 Climatic Influences on the Spread and Transmission of Vector Borne Diseases 9 Alternate / Renewable Energy Sources for the Outer Islands of the Maldives
10 The Use of Solar Distillation as a Source of Freshwater for Outer Islands and Male’ 11 Development of Sustainable Inter-Island Sea Based Mass Transportation System 12 Development of Sewerage Treatment Facilities 13 The Integrated Waste Management System Designed to Mitigate GHG Emissions
Source : “First National Communication of Maldives to the UNFCCC”
Table 7.2.1-2 shows policies, systems and surrounding conditions related to the promotion of CDM.
When it comes to promoting CDM in the future, it will be necessary to conduct capacity building,
enlightenment and dissemination activities not only for MHTE (the Ministry in charge of CDM
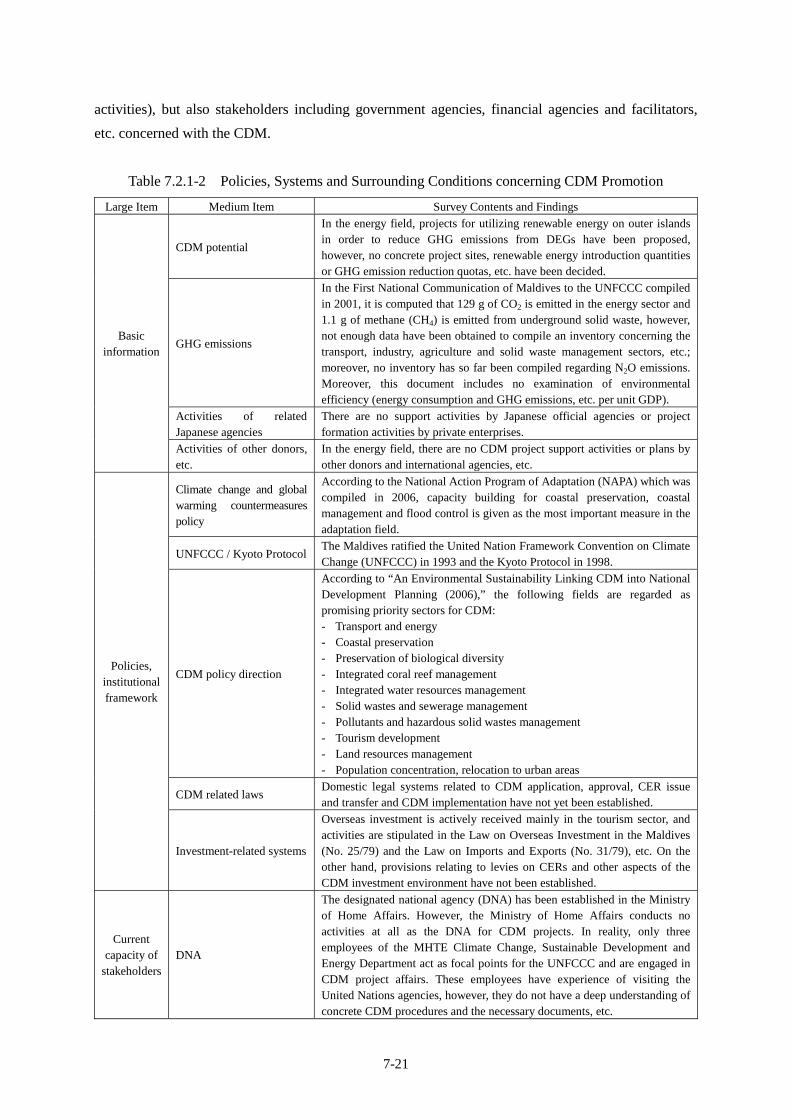
7-21
activities), but also stakeholders including government agencies, financial agencies and facilitators,
etc. concerned with the CDM.
Table 7.2.1-2 Policies, Systems and Surrounding Conditions concerning CDM Promotion
Large Item Medium Item Survey Contents and Findings
CDM potential
In the energy field, projects for utilizing renewable energy on outer islands in order to reduce GHG emissions from DEGs have been proposed, however, no concrete project sites, renewable energy introduction quantities or GHG emission reduction quotas, etc. have been decided.
GHG emissions
In the First National Communication of Maldives to the UNFCCC compiled in 2001, it is computed that 129 g of CO2 is emitted in the energy sector and 1.1 g of methane (CH4) is emitted from underground solid waste, however, not enough data have been obtained to compile an inventory concerning the transport, industry, agriculture and solid waste management sectors, etc.; moreover, no inventory has so far been compiled regarding N2O emissions. Moreover, this document includes no examination of environmental efficiency (energy consumption and GHG emissions, etc. per unit GDP).
Activities of related Japanese agencies
There are no support activities by Japanese official agencies or project formation activities by private enterprises.
Basic information
Activities of other donors, etc.
In the energy field, there are no CDM project support activities or plans by other donors and international agencies, etc.
Climate change and global warming countermeasures policy
According to the National Action Program of Adaptation (NAPA) which was compiled in 2006, capacity building for coastal preservation, coastal management and flood control is given as the most important measure in the adaptation field.
UNFCCC / Kyoto Protocol The Maldives ratified the United Nation Framework Convention on Climate Change (UNFCCC) in 1993 and the Kyoto Protocol in 1998.
CDM policy direction
According to “An Environmental Sustainability Linking CDM into National Development Planning (2006),” the following fields are regarded as promising priority sectors for CDM: - Transport and energy - Coastal preservation - Preservation of biological diversity - Integrated coral reef management - Integrated water resources management - Solid wastes and sewerage management - Pollutants and hazardous solid wastes management - Tourism development - Land resources management - Population concentration, relocation to urban areas
CDM related laws Domestic legal systems related to CDM application, approval, CER issue and transfer and CDM implementation have not yet been established.
Policies, institutional framework
Investment-related systems
Overseas investment is actively received mainly in the tourism sector, and activities are stipulated in the Law on Overseas Investment in the Maldives (No. 25/79) and the Law on Imports and Exports (No. 31/79), etc. On the other hand, provisions relating to levies on CERs and other aspects of the CDM investment environment have not been established.
Current capacity of
stakeholders DNA
The designated national agency (DNA) has been established in the Ministry of Home Affairs. However, the Ministry of Home Affairs conducts no activities at all as the DNA for CDM projects. In reality, only three employees of the MHTE Climate Change, Sustainable Development and Energy Department act as focal points for the UNFCCC and are engaged in CDM project affairs. These employees have experience of visiting the United Nations agencies, however, they do not have a deep understanding of concrete CDM procedures and the necessary documents, etc.

7-22
Large Item Medium Item Survey Contents and Findings
Since no CDM projects have been reviewed in the past, no stipulations exist concerning the documents and processes required for review.
No documents or procedures have so far been decided with a view to issuing an approval letter.
The Ministry of Home Affairs is not functioning as the DNA. Only the MHTE Climate Change, Sustainable Development and Energy Department manages CDM activities but it does not collaborate with other government agencies.
Government agencies
There is no liaison window established concerning CDM, and information and so forth is not provided to project participants.
DOE The Maldives has no DOE, nor any plans to develop a DOE.
Financial agencies Since no CDM projects have been implemented in the past, no financial agencies in the Maldives possess know-how concerning the CDM.
There are no industrial associations, research agencies or researchers with know-how of the CDM in the Maldives, and the only CDM stakeholder is the government (MHTE).
The Maldives does not transmit any information concerning CDM potential and stakeholders to investor nations.
Facilitators
No education or enlightenment activities are carried out with respect to officials in the Maldives.
Source : Prepared by the Study Team
7.2.2 Organizations and Institutional Preparations for Implementing CDM Projects
(1) Organizations
As was mentioned previously, Maldives has no existing procedures or documents, etc.
concerning CDM application, approval, CER issue and transfer and CDM implementation.
Therefore, when it comes to implementing the CDM in the future, it will be necessary to conduct
capacity building for institutions and policies. The following paragraphs describe issues and
initiatives surrounding CDM implementation and make recommendations for capacity building in
this area. Approval for following proposed institutions has also been received from the MHTE
Climate Change, Sustainable Development and Energy Department, and it is scheduled for
detailed regulations to be decided concerning CDM implementation in the future.
As the organization responsible for implementing CDM projects, the Ministry of Home Affairs
has been assigned as the Designated National Authority (DNA) of UNFCCC. However, the
Ministry of Home Affairs conducts no activities at all as the DNA for CDM projects. In reality,
only three employees of the MHTE Climate Change, Sustainable Development and Energy
Department, including the Director General Mr. Amjad Abdulla, act as focal points for the
UNFCCC and are engaged in CDM project affairs. Accordingly, the MHTE claims that there are
plans to transfer the DNA from the Ministry of Home Affairs to the MHTE in the near future,
although no concrete schedule has so far been decided.
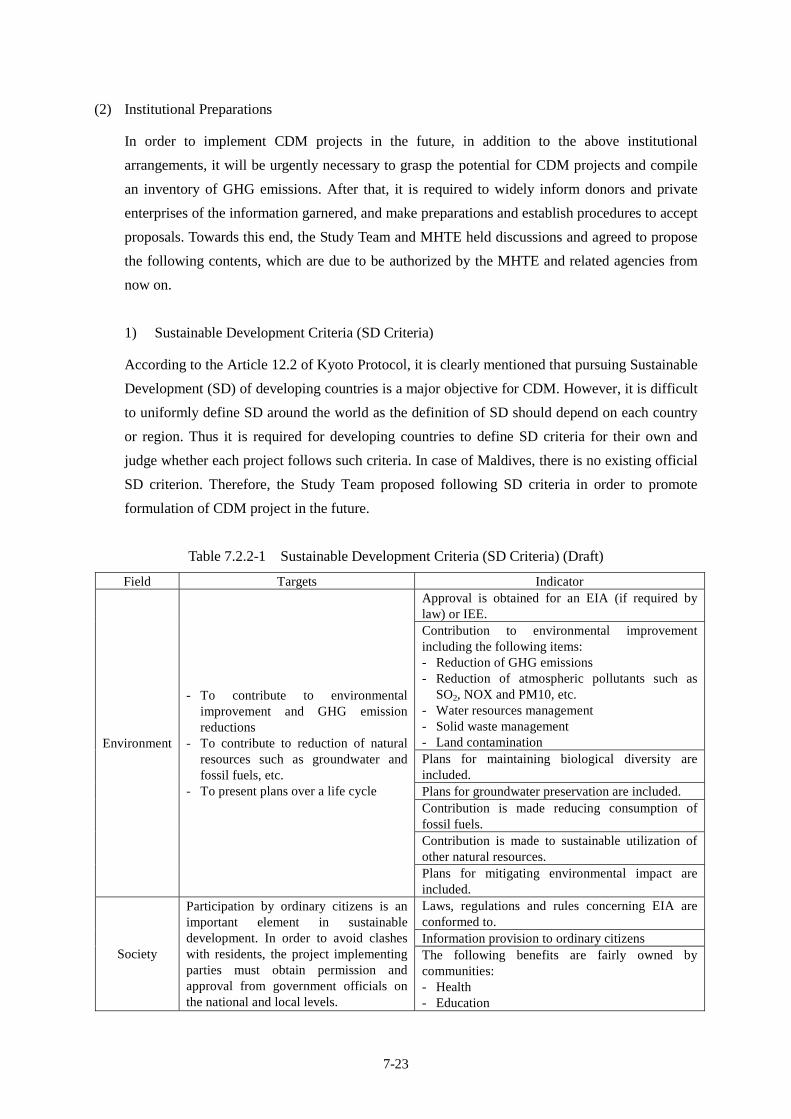
7-23
(2) Institutional Preparations
In order to implement CDM projects in the future, in addition to the above institutional
arrangements, it will be urgently necessary to grasp the potential for CDM projects and compile
an inventory of GHG emissions. After that, it is required to widely inform donors and private
enterprises of the information garnered, and make preparations and establish procedures to accept
proposals. Towards this end, the Study Team and MHTE held discussions and agreed to propose
the following contents, which are due to be authorized by the MHTE and related agencies from
now on.
1) Sustainable Development Criteria (SD Criteria)
According to the Article 12.2 of Kyoto Protocol, it is clearly mentioned that pursuing Sustainable
Development (SD) of developing countries is a major objective for CDM. However, it is difficult
to uniformly define SD around the world as the definition of SD should depend on each country
or region. Thus it is required for developing countries to define SD criteria for their own and
judge whether each project follows such criteria. In case of Maldives, there is no existing official
SD criterion. Therefore, the Study Team proposed following SD criteria in order to promote
formulation of CDM project in the future.
Table 7.2.2-1 Sustainable Development Criteria (SD Criteria) (Draft)
Field Targets Indicator Approval is obtained for an EIA (if required by law) or IEE. Contribution to environmental improvement including the following items: - Reduction of GHG emissions - Reduction of atmospheric pollutants such as
SO2, NOX and PM10, etc. - Water resources management - Solid waste management - Land contamination Plans for maintaining biological diversity are included. Plans for groundwater preservation are included. Contribution is made reducing consumption of fossil fuels. Contribution is made to sustainable utilization of other natural resources.
Environment
- To contribute to environmental improvement and GHG emission reductions
- To contribute to reduction of natural resources such as groundwater and fossil fuels, etc.
- To present plans over a life cycle
Plans for mitigating environmental impact are included. Laws, regulations and rules concerning EIA are conformed to. Information provision to ordinary citizens
Society
Participation by ordinary citizens is an important element in sustainable development. In order to avoid clashes with residents, the project implementing parties must obtain permission and approval from government officials on the national and local levels.
The following benefits are fairly owned by communities: - Health - Education

7-24
- Skill improvement of workers - Other benefits
Economy To have a beneficial effect on the national economy through improving the local economic conditions in the area where the project site is located.
Long-term employment
Source : Prepared by the Study Team
2) Documents required for CDM Application
Proponents for a CDM project is required to submit following application form to MHTE.
Application Form for ② Project design document (PDD) can be obtained via UNFCCC website,
and ③ EIA or IEE application form is released by Environmental Protection Agency (EPA).
Therefore, the Study Team proposed the draft of application form for ① in consultation with
MHTE as on Table 7.2.2-2.
① CDM project application form
② Project design document (PDD)
③ EIA or IEE application form
Table 7.2.2-2 CDM Project Application Document Format (Draft)
1. Basic Information on the Project Project Name Location of the Project Name of Atoll and Island General Description of the Project
2. Basic Information on the Project Participants Contact Person for the CDM Project Activity
Name of contact person: Address: E-mail: Telephone: Fax:
Business license of the Project Participants
Photocopy shall be attached (in case of private company)
Annual Report Foreign Partner(s) (CERs acquirer)
Partner(s) name: Registered country of the foreign partner: Contact person: Address: E-mail: Telephone: Fax:
2. Basic Information on the Proposed CDM Project Activity General Information (Please check the appropriate item.)
(1) Type of the Project; ( ) new, ( ) expansion, ( ) reconstruction
(2) Stage of development: ( ) Feasibility Study, ( ) Detail Design, ( ) Procurement, ( ) Under construction, ( ) Operation
(3) EIA or IEE procedures; ( ) not applied, ( ) in process, ( ) approved, ( ) rejected
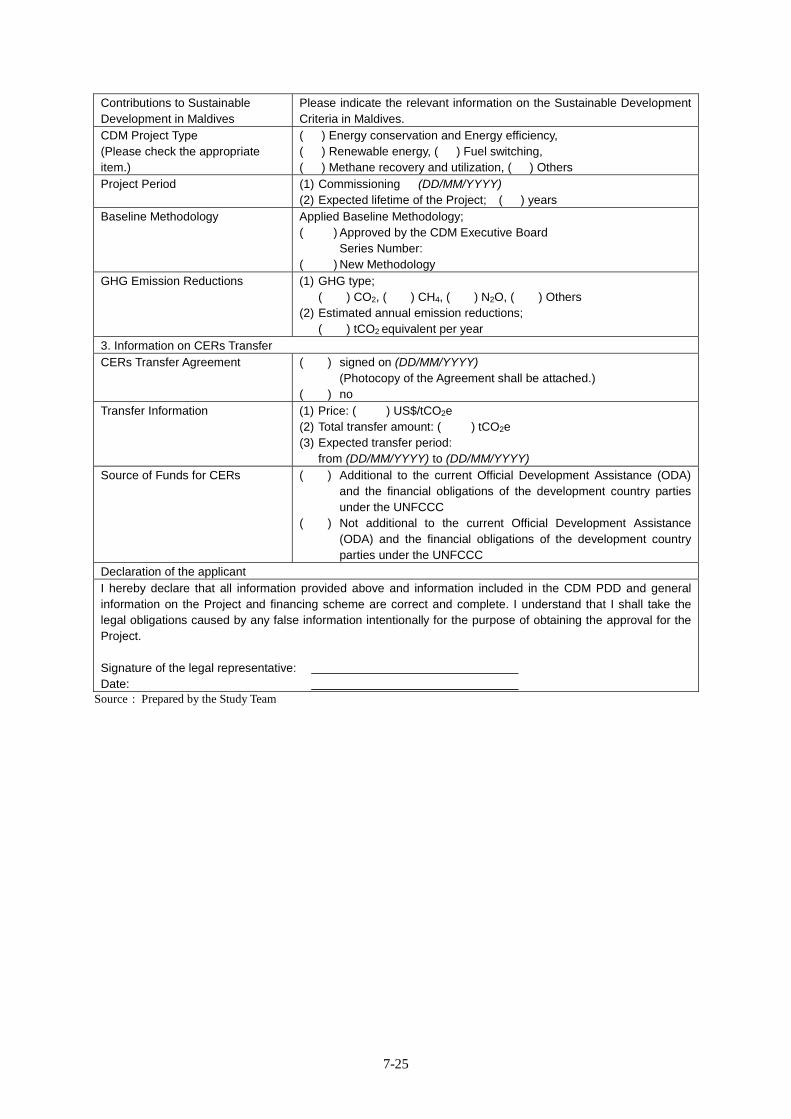
7-25
Contributions to Sustainable Development in Maldives
Please indicate the relevant information on the Sustainable Development Criteria in Maldives.
CDM Project Type (Please check the appropriate item.)
( ) Energy conservation and Energy efficiency, ( ) Renewable energy, ( ) Fuel switching, ( ) Methane recovery and utilization, ( ) Others
Project Period (1) Commissioning (DD/MM/YYYY) (2) Expected lifetime of the Project; ( ) years
Baseline Methodology Applied Baseline Methodology; ( ) Approved by the CDM Executive Board
Series Number: ( ) New Methodology
GHG Emission Reductions (1) GHG type; ( ) CO2, ( ) CH4, ( ) N2O, ( ) Others
(2) Estimated annual emission reductions; ( ) tCO2 equivalent per year
3. Information on CERs Transfer CERs Transfer Agreement ( ) signed on (DD/MM/YYYY)
(Photocopy of the Agreement shall be attached.) ( ) no
Transfer Information (1) Price: ( ) US$/tCO2e (2) Total transfer amount: ( ) tCO2e (3) Expected transfer period:
from (DD/MM/YYYY) to (DD/MM/YYYY) Source of Funds for CERs ( ) Additional to the current Official Development Assistance (ODA)
and the financial obligations of the development country parties under the UNFCCC
( ) Not additional to the current Official Development Assistance (ODA) and the financial obligations of the development country parties under the UNFCCC
Declaration of the applicant I hereby declare that all information provided above and information included in the CDM PDD and general information on the Project and financing scheme are correct and complete. I understand that I shall take the legal obligations caused by any false information intentionally for the purpose of obtaining the approval for the Project. Signature of the legal representative: Date:
Source : Prepared by the Study Team

7-26
3) Review Process to Issue of the Approval Letter by the DNA
Source : Prepared by the Study Team
Figure 7.2.2-1 CDM Project Application and Approval Process (Draft)
7.2.3 Program CDM Application
Program CDM is a new system that was approved at the COP/MOP1 conference staged in 2005.
Under Program CDM, it is possible for enterprises or public entities to implement independent or
coordinated policies, measures and targets as a unified Program of Activities (PoA), and to implement
multiple CDM Program Activities (CPAs) within such PoA as a single CDM project.
Under this scheme, since the effects of PV equipment subsidy systems and preferential tax systems,
etc. are treated as CDM projects, and projects involving facilities targeted by government programs
can be implemented as a single program, it was thought that the burden of individual project
implementing parties would be alleviated. However, following subsequent examination by the CDM

7-27
Board, it was decided that Non-Annex I countries will need to prepare the following three PDDs1 in
order to apply this system, and that it will be necessary to prepare a separate PDD2 when registering
additional CDM Program Activities after initial registration.
① An entire PDD (CDM-POA-DD) regarding program activities
② PDD (CDM-CPA-DD) that includes general information concerning all the envisaged CDM
Program Activities.
③ An entire PDD (CDM-CPA-DD) corresponding to actual CDM Program Activities
Moreover, in order to register as a Program CDM, it is necessary to form a coordinating/managing
entity to act as the implementing agency of the program activities that has been approved by the DNA
of the signatory country concerned. The coordinating/managing entity must prepare a plan for the
operation and monitoring of program activities, and all CDM program activities must be monitored
according to this, while steps must be taken to avoid the double counting of CDM Program Activities.
As was mentioned above, application,
registration and monitoring under Program
CDM requires more strict screening than
conventional CDM and an organized approach
is necessary even in Non-Annex I countries.
In case of Maldives, first of all, it will be
desirable to implement a conventional CDM
project and to build up the necessary
organizational and institutional know-how,
and then to examine the possibilities of
registering under the Program CDM system in
the next step.
1 “Procedures for Registration of a Program of Activities as a Single CDM Project Activity and Issuance of
Certified Emission Reductions for a Program of Activities” UNFCCC Website 2 Registration fees are not required for CDM Program Activities that are added later.
Start of subsidy system for introducing energy conservation facilities
Target facilities and factories receiving subsidies
Introduction of energy conservation facilities to individual facilities and factories = CO2 emission reductions
Bundling of individual projects
Implementation as a CDM project
Developing country government
CO2 CO2 CO2 CO2
Granting of subsidies
Source : CDM/JI Standard Text Version 2.0,
Ministry of Economy, Trade and Industry
Figure 7.2.3-1 Image of Program CDM

7-28
7.3 Introduction of PV Power Generation to Resort Islands
As of March 2009, 92 resort islands are operated and a further 68 are planned for development in
Maldives. Since the resort islands rely almost exclusively on diesel power generation, the Ministry of
Tourism, Arts and Culture aims to vigorously pursue renewable energies including PV power
generation in order to reduce consumption of imported diesel fuel and mitigate the environmental
impacts of noise and exhaust gases. Solar water heaters are already widely disseminated, however,
there have been no examples of PV introduction, and there is great potential for installing such
systems if continuous awareness raising activities can be conducted for resort owners. According to
the Ministry of Tourism, Arts and Culture, the issues for resort owners when they consider introducing
PV systems are as follows: ① Initial investment costs are high, and ② Responding to system
failures is difficult, and so on. Accordingly, the second seminar for awareness raising and
dissemination of PV and DSM was held during the third field survey for representatives of the
Ministry of Tourism, Arts and Culture, the Maldives Association of Tourism Industry (MATI) and
resort owners, etc.

8-1
CHAPTER 8 RECOMMENDATIONS FOR DISSEMINATION OF THE GRID-CONNECTED PV SYSTEM
8.1 Legal Systems concerning Dissemination of New Energies in the Maldives
As was described in 3.1.2, under the Maldivian legal system, policies and institutions are specified
in different levels starting with the Constitution and moving down through Laws or Acts and
Regulations. Currently, there are no legal systems related to new energies, although the MHTE and
MEA (regulatory agency) are preparing an Act geared to the introduction of renewable energies
including PV power generation. This Act is thought to correspond to the Japanese New Energy Law
(Special Measures Law concerning Promotion of New Energy Usage, etc.). For reference purposes,
Table 8.1-1 shows the laws in Japan that relate to new energy, while Table 8.1-2 shows the new energy
legislation items thought to be required when applying to the case of the Maldives.
Table 8.1-1 Japanese Laws concerning New Energies
New Energies
- Law concerning Promotion of Development and Introduction of Petroleum-Substitute Energies
- Special Measures Law concerning Promotion of New Energy Use, etc. (New Energy Law)
- Special Measures Law concerning Utilization of New Energies by Electricity Utility Operators (RPS Law)
Table 8.1-2 Necessary Items of the Japanese New Energy Law when Applying to the Maldives
Article Outline Article 1 Objective
Concerning the objective of the New Energy Law (Objective: To take necessary steps in order to promote efforts by citizens concerning new energy use and facilitate use of new energies, with a view to securing the stable and appropriate supply of energy according to the socioeconomic environment).
Article 2 Definitions
Definition of new energies and scope of application of the law (Applicable scope: Energies that are not sufficiently disseminated due to economic constraints but need to be promoted in order to introduce petroleum-substitute energies)
Article 3 Basic Policy
Concerning the method of deciding basic policy (Determination method: The basic policy must be proposed by the Minister of Economy, Trade and Industry and receive Cabinet approval with consideration given to the long-term prospects for energy demand and supply, characteristics of new energy utilization, etc., technical standards and environmental impacts, etc.)
Article 4 Efforts of energy users, etc.
Concerning efforts of energy users, etc. (Effort: Energy users must strive to use new energies, etc. while paying attention to the basic policy).
Article 5 New energy use guidelines
Concerning the method of deciding new energy use guidelines (Determination method: The new energy use guidelines shall be determined by the Minister of Economy, Trade and Industry with consideration given to the long-term prospects for energy demand and supply, characteristics of new energy utilization, etc., technical standards and environmental impacts, etc.)
Article 6 Guidance and advice
Concerning guidance and advice (Guidance and advice: The Competent Minister can implement guidance and advice concerning the items to be established in the new energy use guidelines).

8-2
Article Outline Article 8 Authorization of use plans
Concerning authorization of use plans (Authorization: Parties seeking to use new energies, etc. in business activities must prepare a use plan concerning the energy in question and receive authorization for it).
Article 9 Revisions, etc. of use plans
Concerning revision of use plans determined in Article 8 (Revision: When authorized parties revise use plans concerning the authorization in question, they must receive authorization from the Competent Minister).
Article 14 Collection of reports
Concerning reporting on the state of implementation with respect to authorized operators (Report: The Competent Minister shall be able to seek reports from authorized operators concerning the state of implementation of authorized use plans).
Article 15 Competent Minister(s)
Concerning the definition of Competent Minister(s) (Definition: The Competent Minister(s) shall be the Minister of Economy, Trade and Industry and the Minister(s) with jurisdiction over operations conducted by users).
Article 16 Penalties
Concerning penalties concerning the above agreements (Penalty: Persons who do not give the report stipulated in Article 14 and those who give false reports shall receive penalties).
Source : Prepared by the Study Team from Japan’s Special Measures Law concerning the Promotion of New Energy Use, etc.
8.2 Dissemination Promotion Policies and Systems (Incentives)
The following paragraphs examine appropriate dissemination policies and systems for promoting
grid-connected PV systems in the Maldives based on systems geared to the introduction and
dissemination of renewable energies, in particular PV power generation, and the operating condition of
such systems in overseas countries.
8.2.1 Outline of Dissemination Promotion Measures
In “Deploying Renewable 2008” of the International Energy Agency (IAE) and “The Support of
electricity from renewable energy sources” by the EC, survey and analysis are carried out on policies
for disseminating renewable energy in each country, in particular the Renewable Portfolio Standard
(RPS) and the fixed price purchasing system (FIT system). Here, based on existing literature in
overseas countries and studies made by the Japanese Ministry of Economy, Trade and Industry1 and
the Ministry of Environment2, the features and issues of general options that may be considered as
policies for the promotion of renewable energy including PV power are organized.
According to the IEA, in terms of economic theory, under the ideal conditions, policy for fixing the
amount of new energy introduced (RPS system) and price fixing policy (FIT system) display the same
level of efficiency. In both systems, accurate system design and fine system adjustments are important
elements for success, and it is regarded as important to combine the following dissemination
promotion measures according to the level of technology (development stage, verification stage,
practical application stage, etc.) and conditions for market introduction (initial introduction stage,
dissemination stage, maturation stage, etc.).
1 “Concerning measures for promoting introduction of renewable energy in key countries,” February 13, 2009 2 “Concerning measures for disseminating renewable energy geared to construction of a low-carbon society
(recommendations),” February 2009

8-3
Technology in R&D stage (Ex:Next Generation
Biomass Fuel)
Technology has big difference in
cost (Ex:PV)
Technology has small difference in
cost (Ex:Land Wind)
Developed Technology (Ex:Hydro)
Continuous R&D Creation of Attractive Market
Support for Investment cost (Subsidy, Low Interest Loan etc.)
Stability Support to promote Low Risk
Price Policy:FIT2)、FIP Promotion Policy:Subsidy
Market Risk Minimum Profit Guarantee
(Gradually reduction) Price Policy:FIP1)
Promotion Policy:Credit Transaction for RE including Technical Features
Fair Competition between Technology
Credit Transaction for RE and CO2 Emission
Promotion of MarketIndependent Installation
Time
Mar
ket E
xpan
sion
Development Specific Market Mass Market
Note:1) FIP (Feed-in Premium) :Purchasing Price is to add the fixed premium (Bonus) to the market price 2) FIT (Feed-in Tariff) :Purchasing Price is the fixed price Source:”Deploying Renewables 2008” IEA
Figure 8.2.1-1 Combining Policies for Disseminating Renewable Energies
The following paragraphs describe representative dissemination promotion measures based on
reference to Japan’s experience and advanced examples in Europe and America.
(1) RPS System
RPS stands for Renewable Portfolio Standard, a system whereby the government makes it
compulsory for electricity operators to supply a certain ratio of electric power from renewable
energies. Concerning the introductory price, it is possible to realize introduction and expansion
with high cost effectiveness through utilizing the market to promote cost competition between
different renewable energies. Meanwhile, since various renewable energies which comprise
different technical standards and cost levels are exposed to the same competitive environment,
little progress tends to be made in introducing PV power and other renewable energies that have
relatively high introductory costs. Moreover, since it is not possible to predict purchase prices in
the future, another issue is that the investment recovery period cannot be fixed.
(2) Fixed Price Purchasing System (FIT System)
In this system, electric power generated from renewable energies is purchased at a fixed price
by power companies over a certain period. If an appropriate purchase price is set in consideration
of the technical standard and cost level of each renewable energy, since it is possible to predict

8-4
the investment recovery period, investment in renewable energy is accelerated. Moreover,
through enhancing transparency concerning the cost burden of the markup on electricity tariffs, it
becomes possible to conduct stable system operation over the long term.
The important design factor in the FIT system is the purchase price setting. If the price is set
too low, the effect of promoting introduction is low, while if it is too high, the high price is passed
onto consumers in electricity tariffs, thereby leading to perennial tariff inflation. In addition, it is
necessary to periodically review the purchase price according to the pace of dissemination and
cost reductions arising from technical development.
(3) Surplus Power Purchasing System
In this system, surplus electricity that is not consumed within consumer premises is
autonomously purchased by electric utility operators based on individual contracts. This appears
similar to the FIT system, however, whereas all generated electricity is purchased at a fixed price
making it easier for investors to compile business plans in the FIT system, the surplus power
purchasing system has a major drawback in that it is difficult to project revenue and expenditure
balance because only surplus electricity that isn’t consumed is made available for purchase.
Moreover, since the purchase price of surplus power by electric utility operators is frequently set
at the same level as the sale price, leading to extremely long investment recovery periods (around
25~30 years), and the system doesn’t guarantee purchase over the long-term since it depends on
the autonomous efforts of operators, it doesn’t provide an incentive for introducing new energies
in large amounts.
The example of the unit price in Excess power purchasing system for Residential solar power system
(Unit:JY/kWh)
A Co. B Co.
Time-of-day lighting
32.48 30.74 23.87
25.00
Mater rate lighting
24.13 22.86 17.87
25.00 First step
Second step
Third step
0 120 300
kWh
Power consumption320kWh Excess power 100kWh
Electric Tariff for Excess power
The example of A Co. (Power consumption 320kWh、Excess power 100kWh)
<Household use>
Source : “Concerning measures for promoting introduction of renewable energies in key countries,” Resources and
Energy Agency
Figure 8.2.1-2 Outline of Japan’s Surplus Power Purchasing System

8-5
(4) Introduction Subsidy System
This system entails the government subsidizing part of the costs of introducing renewable
energies. It is effective for directly compensating price differentials in the stage where initial
introduction costs are high, however, there is a limit to the total amount of subsidies that can be
provided each year. Moreover, under single-year budgets, a drawback to this system is that it isn’t
clear how long it can be continued and it is difficult to compile long-term investment plans.
Furthermore, problems are pointed to regarding the administrative cost of operating subsidies and
the fact that administrative procedures are concentrated into certain times during the year.
8.2.2 Examples of Policy Introduction in Advanced Countries
(1) Japan
Japanese policies and systems for promoting the introduction of PV power generation
comprise the surplus power purchasing system and RPS system, which have conventionally been
implemented by electric power companies, and a subsidy system for introducing PV systems to
homes. Furthermore, in February 2009, the Ministry of Economy, Trade and Industry announced
introduction of a Japanese FIT system, whereby electric power utility operators will have to
purchase surplus electricity at approximately two times the current surplus electricity purchasing
price (around 50 yen/kWh) for around 10 years, in order to promote the dissemination of PV
power, which requires higher introduction costs than other renewable energies. This system will
only target systems intended for private consumption in general households and public facilities;
it will not target large-scale PV power plants installed with the intention of selling electricity.
Concerning the detailed system design, it is scheduled for examination on a draft bill for
sophistication of the energy supply structure to be conducted and the system to be introduced
from fiscal 2009 at earliest.
Concerning the Japanese RPS system, based on the Special Measures Law concerning Use of
New Energies by Electric Utility Operators” (the RPS law), the government establishes
eight-year use targets every four years and, following introduction of the system in April 2003, it
allocates compulsory quotas according to the amount of electricity supplied by utility operators.
Moreover, concerning PV power, which requires comparatively higher introduction costs than
other renewable energies, a proviso has been adopted to count electricity from PV systems as
double between fiscal 2011 and 2014. The electric utility operators (36 companies) targeted for
obligations will be able to fulfill their obligations by one of the following methods:
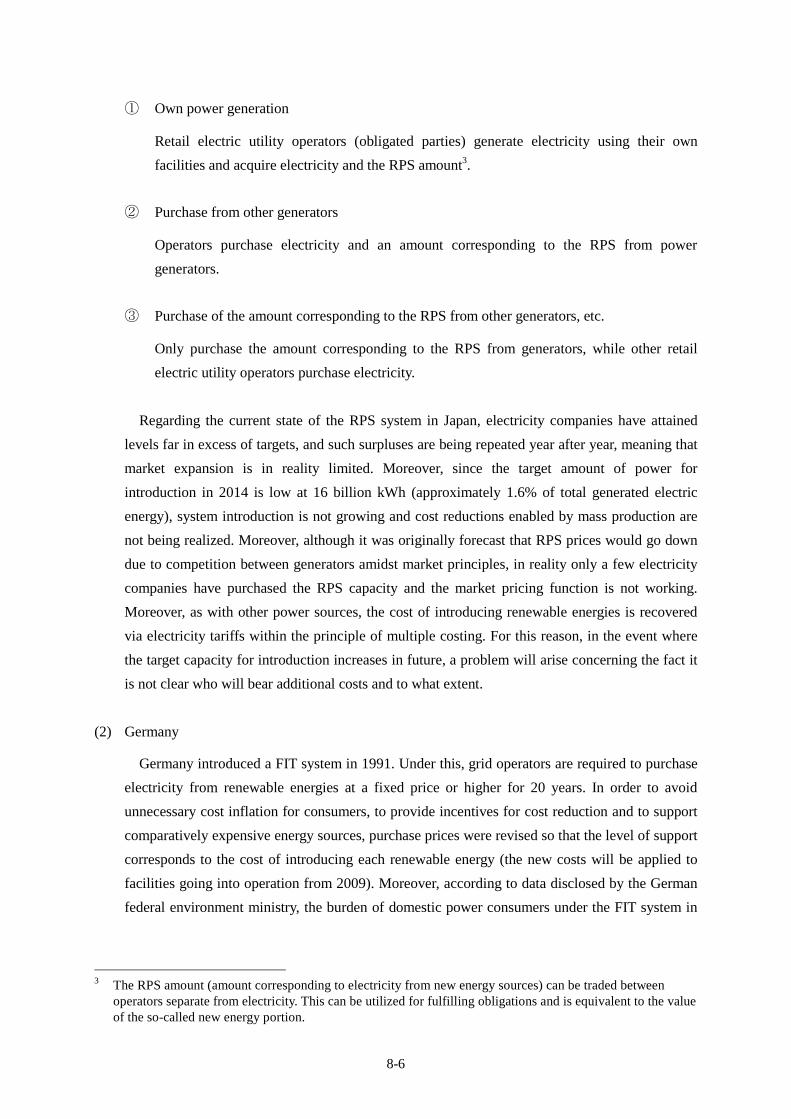
8-6
① Own power generation
Retail electric utility operators (obligated parties) generate electricity using their own
facilities and acquire electricity and the RPS amount3.
② Purchase from other generators
Operators purchase electricity and an amount corresponding to the RPS from power
generators.
③ Purchase of the amount corresponding to the RPS from other generators, etc.
Only purchase the amount corresponding to the RPS from generators, while other retail
electric utility operators purchase electricity.
Regarding the current state of the RPS system in Japan, electricity companies have attained
levels far in excess of targets, and such surpluses are being repeated year after year, meaning that
market expansion is in reality limited. Moreover, since the target amount of power for
introduction in 2014 is low at 16 billion kWh (approximately 1.6% of total generated electric
energy), system introduction is not growing and cost reductions enabled by mass production are
not being realized. Moreover, although it was originally forecast that RPS prices would go down
due to competition between generators amidst market principles, in reality only a few electricity
companies have purchased the RPS capacity and the market pricing function is not working.
Moreover, as with other power sources, the cost of introducing renewable energies is recovered
via electricity tariffs within the principle of multiple costing. For this reason, in the event where
the target capacity for introduction increases in future, a problem will arise concerning the fact it
is not clear who will bear additional costs and to what extent.
(2) Germany
Germany introduced a FIT system in 1991. Under this, grid operators are required to purchase
electricity from renewable energies at a fixed price or higher for 20 years. In order to avoid
unnecessary cost inflation for consumers, to provide incentives for cost reduction and to support
comparatively expensive energy sources, purchase prices were revised so that the level of support
corresponds to the cost of introducing each renewable energy (the new costs will be applied to
facilities going into operation from 2009). Moreover, according to data disclosed by the German
federal environment ministry, the burden of domestic power consumers under the FIT system in
3 The RPS amount (amount corresponding to electricity from new energy sources) can be traded between
operators separate from electricity. This can be utilized for fulfilling obligations and is equivalent to the value of the so-called new energy portion.

8-7
2007 is approximately 5% of overall electricity tariffs, representing more than a tenfold increase
over the burden in 1998.
(3) United Kingdom
In the United Kingdom, the Renewables Obligation (RO) system was introduced in England
and Wales and the Renewables Obligation Scotland (ROS) system was introduced in Scotland
from April 2002. Both systems are essentially a variation on the RPS system. The target is to
introduce power derived from renewable energies equivalent to 15.4% of sold electricity by
2015, however, a buy-out system has been introduced whereby obligated operators can purchase
shortfalls at 3p/kWh (approximately 4 yen/kWh) and paid amounts are refunded according to
achieved quotas, and introduced capacity in recent years is not attaining the target capacity.
Moreover, from 2010, it has been decided to introduce a FIT system targeting renewable energy
power generating facilities of no more than 5,000 kW from 2010.
(4) Spain
In Spain, a FIT system whereby power distribution operators (five power companies) will
purchase electricity from renewable energies at a fixed price for 25 years was introduced in 1994.
However, because solar heat utilization and PV power generation did not advance as expected,
the purchase price underwent a large hike under Edict No. 661/2007 in June 2007, while it was
made compulsory for certain buildings undergoing construction and renovation and commercial
facilities of a certain area to install solar heat hot water systems and PV power generation
systems from September 29, 2006. Following the introduction of these measures, the amount of
capacity introduced under PV power generation suddenly increased and the cumulative installed
capacity reached the stipulated threshold of 200 MW. In September 2008, it was decided to
reduce the purchase price of electricity generated by equipment going into operation after 2009
from the conventional level of approximately 53 yen/kWh to approximately 41 yen/kWh.
(5) United States
In the United States, introduction of the RPS system was previously examined on the federal
level, however, introduction was postponed in the Energy Policy Act of 2005 and the Energy
Independence and Security Act of 2007. The Obama administration has announced New Energy
for America and aims to raise the ratio of renewable energies to 10% by 2012 and 25% by 2025
based on introduction of a federal RPS system. Currently, 28 states and special districts have
introduced RPS systems making it compulsory to use renewable energies on the state government
level (as of March 2009).

8-8
State Goal
PA: 18%** by 2020
NJ: 22.5% by 2021
CT: 23% by 2020
WI: requirement varies by utility; 10% by 2015 goal
IA: 105 MW
MN: 25% by 2025(Xcel: 30% by 2020)
TX: 5,880 MW by 2015
AZ: 15% by 2025
CA: 20% by 2010
*NV: 20% by 2015
ME: 30% by 200010% by 2017 - new RE
State RPSSolar hot water eligible
Minimum solar or customer-sited RE requirement* Increased credit for solar or customer-sited RE** Includes separate tier of non-renewable “alternative” energy resources
HI: 20% by 2020
RI: 16% by 2020
CO: 20% by 2020 (IOUs)*10% by 2020 (co-ops & large munis)
DC: 20% by 2020
NY: 24% by 2013
MT: 15% by 2015
IL: 25% by 2025
VT: (1) RE meets any increase in retail sales by 2012;
(2) 20% RE & CHP by 2017
MD: 20% by 2022
NH: 23.8% in 2025
OR: 25% by 2025 (large utilities)5% - 10% by 2025 (smaller utilities)
*VA: 12% by 2022
*DE: 20% by 2019
NM: 20% by 2020 (IOUs)10% by 2020 (co-ops)
NC: 12.5% by 2021 (IOUs)10% by 2018 (co-ops & munis)
ND: 10% by 2015
SD: 10% by 2015
*UT: 20% by 2025 OH: 25%** by 2025
*MI: 10% + 1,100 MW by 2015
MA: 15% by 2020+ 1% annual increase(Class I Renewables)
MO: 15% by 2021
*WA: 15% by 2020
28 states have an RPS;
5 states have an RE goal
Source : Database of State Incentives for Renewable Energy (DSIRE)
Figure 8.2.2-1 RPS Systems Introduced in the United States
8.2.3 Dissemination Promotion Policies (Draft) in the Maldives
On March 15, 2009, President Nasheed announced a plan for the Maldives to become the world’s first
carbon-neutral state based on conversion to renewable energies within 10 years. Accordingly, legal systems
should be enacted in line with this concept. In the stage prior to the start of field surveys, the Study Team
considered that dissemination measures (RPS system, subsidies, preferential tax system, surplus power
purchasing system, feed-in-tariff system) would be required according to each mode of introducing the
grid-connected PV system (Measure A). However, findings from the technical feasibility study revealed
that capacity for grid-connected PV system introduction would be restricted to 12.6 MW on Male’ Island
and 0.89 MW on Hulhumale’ Island. The technical feasibility study also concluded that, from the viewpoint
of maintaining power quality following the introduction of grid-connected PV systems, it would be ideal
for STELCO to initially take the initiative and to phase in systems in cooperation with the Government of
the Maldives. Therefore, a plan to successively introduce 3.97 MW (Male’ Island and Hulhumale’ Island)
under STELCO initiative over the coming 10 years including the pilot project period (Measure B) was
formulated and, following consultations with the Maldivian side, willingness to cooperate was confirmed
from the CEO of STELCO. On the other hand, the Government of the Maldives is successively advancing
the privatization of STELCO with a view to attracting private sector capital including foreign investment
and thereby improving the financial standing of the electric power sector in general. According to a
high-ranking official in the Ministry of Finance, in line with the privatization of STELCO, government
subsidies for deficit-covering that have been provided since 2005 will be cut or phased out, and in that
event STELCO will have little choice but to enforce major electricity tariff hikes. Moreover, since the
government cannot afford to provide subsidies, this means that no subsidies for initial cost will be available

8-9
from the government to support PV introduction after STELCO becomes privatized. Accordingly, judging
that the 3MW of PV introduce capacity is realistic due to the smallest impact to the Maldives finance and
assuming a measure based on STELCO initiative, methods for disseminating PV introduction without
subsidies were considered (Measure C). The Government of the Maldives is considering building systems
for promoting all areas of renewable energy for decades to come. When it comes to introducing and
disseminating grid-connected PV systems, although it can be appreciated that entrusting activities to
STELCO is a realistic approach, opportunities should also be given to other entities. Therefore, starting
from the base of Measure C, examination was conducted assuming additional introduction to the private
sector (Measure D). In Measure C, the following support measures for mitigating initial investment, which
is the biggest obstacle to introducing PV, were proposed to and jointly examined among the Ministry of
Finance, MHTE, MEA, STELCO and other agencies concerned:
(a) Application of preferential tax measures to PV facilities
(b) Utilization of Green Tax
(c) Utilization of Development Expense
(d) Introduction of Carbon Tax
(e) Revision of Electricity Tariff
As a result of discussing these methods with a high-ranking official in the Ministry of Finance, the
agreement was generally obtained. Therefore, the Measure D is our final proposal created by considering
the measures for mitigating PV introduction initial cost with the wishes of the Government of the Maldives.
However, following the privatization of STELCO, since there is a possibility that reshuffling of top
management may result in a major change in policy direction, it will be necessary to continue the
discussions and pay close attention to the developments regarding privatization of STELCO.
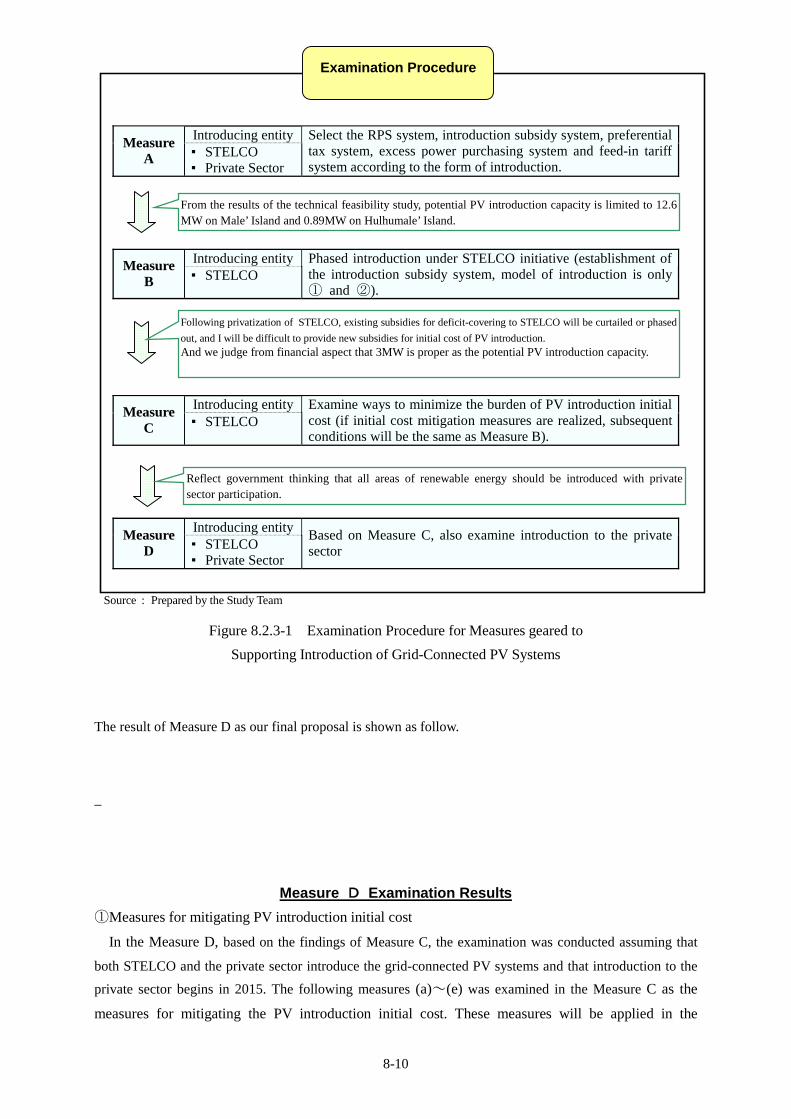
8-10
Introducing entity Measure
A STELCO Private Sector
Select the RPS system, introduction subsidy system, preferential tax system, excess power purchasing system and feed-in tariff system according to the form of introduction.
Introducing entity Measure B STELCO
Phased introduction under STELCO initiative (establishment of the introduction subsidy system, model of introduction is only ① and ②).
Introducing entity Measure C STELCO
Examine ways to minimize the burden of PV introduction initial cost (if initial cost mitigation measures are realized, subsequent conditions will be the same as Measure B).
Introducing entity Measure
D STELCO Private Sector
Based on Measure C, also examine introduction to the private sector
Source : Prepared by the Study Team
Figure 8.2.3-1 Examination Procedure for Measures geared to
Supporting Introduction of Grid-Connected PV Systems
The result of Measure D as our final proposal is shown as follow.
Measure D Examination Results
①Measures for mitigating PV introduction initial cost
In the Measure D, based on the findings of Measure C, the examination was conducted assuming that
both STELCO and the private sector introduce the grid-connected PV systems and that introduction to the
private sector begins in 2015. The following measures (a)~(e) was examined in the Measure C as the
measures for mitigating the PV introduction initial cost. These measures will be applied in the
From the results of the technical feasibility study, potential PV introduction capacity is limited to 12.6 MW on Male’ Island and 0.89MW on Hulhumale’ Island.
Following privatization of STELCO, existing subsidies for deficit-covering to STELCO will be curtailed or phased
out, and I will be difficult to provide new subsidies for initial cost of PV introduction. And we judge from financial aspect that 3MW is proper as the potential PV introduction capacity.
Reflect government thinking that all areas of renewable energy should be introduced with private sector participation.
Examination Procedure

8-11
Measure D for only STELCO after 2015 from the financial conditions in the Maldives (Only (a) will
be applied for the private sector as well.) And the grid-connected PV system introduction capacity in
the private sector is assumed to 100kW per year from 2015 to 2020.
(a) Adaption of Preferential Tax Measure Exemption for PV facilities
「The Import Tax Exemption」is proposed, here. The import tax in the Maldives imposes 25% to the
equipment price. As a result of the discussing the possibility of the import tax exemption for the PV
facilities with a high-ranking official in the Ministry of Finance, the agreement was generally obtained
with the feasible. And when the preferential tax will be adapted, the exemption price concerning 2.4MW
which STELCO will introduce will be approximately US$9.2million, although the total exemption price
concerning 3.0MW is approximately US$11million.
(b) Utilization of Green Tax
「Green Tax」 is the plan which collects US$3 per tourist and foresees to increase the tax income of
US$6.3 million(MRf80.6 million)per year in that announcement based on the assumption of 700,000
tourists per year and 3 days as the average staying day. The utilization of the green tax for
grid-connected PV system can be thought to relate to the purpose of the green tax, because the power
generation by grid-connected PV system can contribute the CO2 emission reduction. And this green tax
is thought as the first priority, because this tax is being imposed from now on and the target of the
utilization has not been clarified yet.
(c) Utilization of Development Expense
「The Development Expense」 is the development expense in the capital expense as the resource for
the infrastructure development and the equipment investment and is expected as the resource of the
financial support for mitigating the PV introduction initial cost by STELCO. This Development Expense
(a) Adaptation of Preferential Tax Measure Exemption for PV facilities
(b) Utilization of Green Tax
(c) Utilization of Development Expense
(d) Introduction of Carbon Tax
(e) Revision of Electricity Tariff
Measures for mitigating PV introduction initial cost

8-12
can be thought as one of the measures for mitigating PV introduction initial cost, because the
introduction of grid-connected PV system as the measure for reduction of the diesel fuel relates to the
carbon-neutral policy announced by the Maldives government. However, this development expense is
thought as the second priority, because this is the existing resource and there might be the necessity of
changing the existing plan.
(d) Introduction of Carbon Tax
「Carbon tax」generally refers to the system of taxing fossil fuels with a view to the limiting demand,
while at the same time using tax revenues for the environmental countermeasures. When this tax is
introduced in the Maldives, it is proposed that a tax of a few percentage points be levied on the fossil
fuels such as gasoline and diesel so that the collection can be widely implemented. The introduction of
the carbon tax which has also the effectiveness as the environmental measures is reasonable, because in
the Maldives, especially on Male’ Island, there is a high concentration of motorbikes and cars despite the
restricted land area, the traffic environment and the public sanitation are in appalling condition. When
the carbon tax is introduced, its impact will reach the commodities and the electricity tariff and so on.
However, judging from the current standard of living in the Maldives, the minor tariff rises are thought to
be acceptable; moreover, the tariff rises will have the effect of enhancing the awareness of the
environmental load among the ordinary citizens. However, if this carbon tax is arranged, the imposed
rate should be considered as small as possible, because the carbon tax might have the possibility of
triggering the increasing electricity tariff again, although there is the new electricity tariff structure was
applied on Nov 1st.
(e) Revision of Electricity Tariff
「Revision of Electricity Tariff」which increases the electricity tariff to cover the shortage which can not
be covered by the measures (a)~(d) is proposed as the final measure, here. The reason why this measure
is though as the final measure is that it is not realistic to increase the electricity tariff again in the near
future against the decision of increasing the electricity tariff on Nov 1st in the STELCO territory.

8-13
Table 8.2.3-1 Necessary amount of price in Green Tax, Development Tax and Carbon Tax
after Import Tax Exemption in Measure D Contribution Rate from the Green Tax Installation by STELCO and private
sector (STELCO’s portion: 2.4MW) 61% 50% 30% 0%
Necessary amount(US$) 3,886,424
Allowable amount(US$) 3,886,424 3,150,000 1,890,000 0
Shortfall(US$) 0 736,424 1,996,424 3,886,424
Ratio of shortfall to the national
development expenditure - 0.5% 1.2% 2.4%
Collection of shortfall from carbon
tax (MRf/kWh) - 0.003 0.007 0.014
Source : Prepared by the Study Team
Based on the result of Table 8.2.3-1 and the previous examination, it can be judged that the adoption
of 50% or 30% of the green tax would be realistic. That reason is composed of the following 3 items.
① The green tax has the enough remaining part and it can be utilized for the other plans after
utilizing for the PV system
② The ratio of the shortfall to the national development expenditure is 0.5% or 1.3%, their ratios
are very small and can be thought realistic.
③ The collection of the shortfall from the carbon tax can be mitigated in the small amount.
②Purchasing system for introducing into the private sector
When it comes to introducing to the private sector, two methods, i.e. the total power purchasing system
and the excess power purchasing system, are available, however, the latter of these shall be assumed here.
This is because, amidst the tight electricity demand and supply situation and difficulties in securing the land
for new power generation facility sites, implementation of the excess power purchasing system can be
expected to have a secondary effect of limiting the demand for power.
Regarding the purchasing price, it has been concluded that it is appropriate that the purchasing price is
set as the same as the unit price of the generating cost or less than the unit cost of the generating cost.
Because it is not realistic that if the purchasing price is set t several times of the average of electricity tariff,
the payback period will be so long due to the small area in the building roof in the Male’ and Hulhumale’
Island, the small capacity of the introduced PV system and the small excess power from the introduced PV
system. Concerning STELCO, STELCO will not be able to gain any merits if the purchasing price is set
higher than the average of electricity tariff. On the other hand, from the result of our hearing investigation
to the private sector, it was found out that there are some implementers, etc. who desired to introduce the
PV system to gain the merit only by mitigating the energy consumption inside house thanks to the next
increasing electricity tariff (Nov. 1st). Accordingly, if the purchasing price is set, it will be able to be the
small incentive for the implementers such as the persons who the previous sentence says and STELCO also
will be able to gain the merit to purchase the excess power at the cheaper price than the unit cost of the
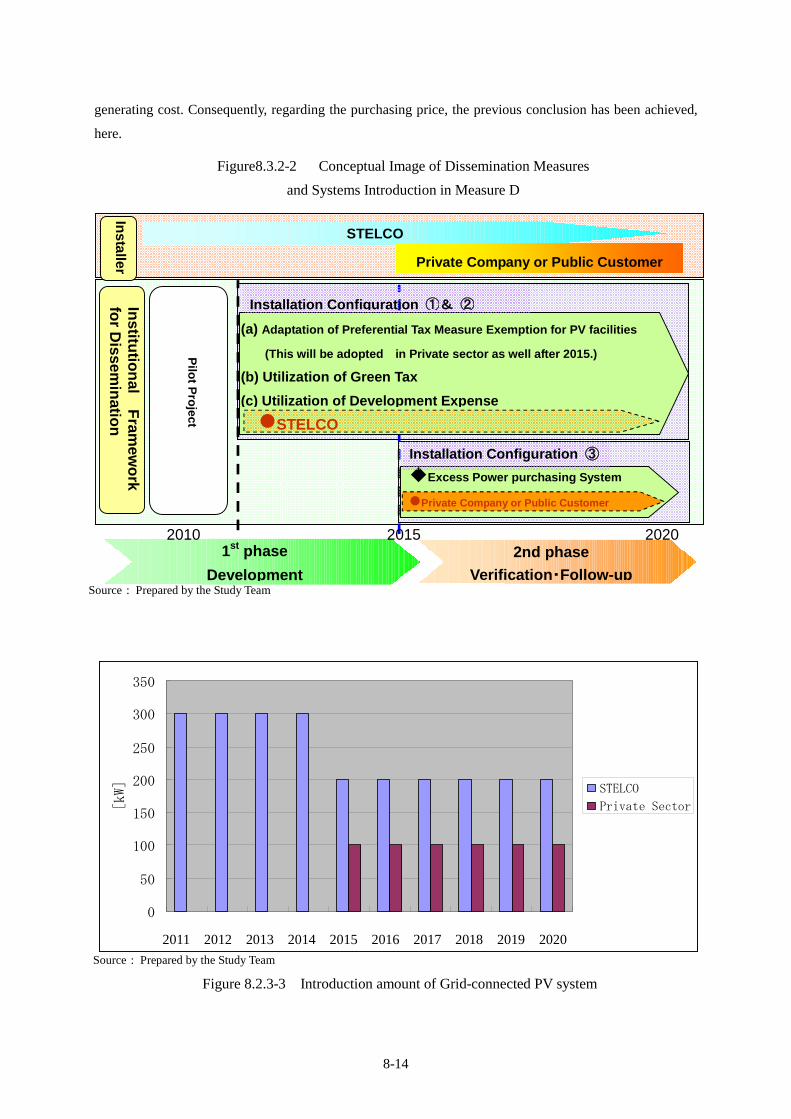
8-14
generating cost. Consequently, regarding the purchasing price, the previous conclusion has been achieved,
here.
0
50
100
150
200
250
300
350
1 2 3 4 5 6 7 8 9 10
[kW] STELCO
Private Sector
Installer
Institu
tion
al F
ramew
ork
for D
issemin
ation
STELCO
(a) Adaptation of Preferential Tax Measure Exemption for PV facilities
(This will be adopted in Private sector as well after 2015.)
(b) Utilization of Green Tax
(c) Utilization of Development Expense
Pilo
t Pro
ject
STELCO
Private Company or Public Customer
Excess Power purchasing System
Private Company or Public Customer
Installation Configuration ③
Installation Configuration ①& ②
1st phase
Development
2nd phase
Verification・Follow-up
2010 2015 2020
Figure8.3.2-2 Conceptual Image of Dissemination Measures
and Systems Introduction in Measure D
Figure 8.2.3-3 Introduction amount of Grid-connected PV system
2011 2012 2013 2014 2015 2016 2017 2018 2019 2020
Source : Prepared by the Study Team
Source : Prepared by the Study Team
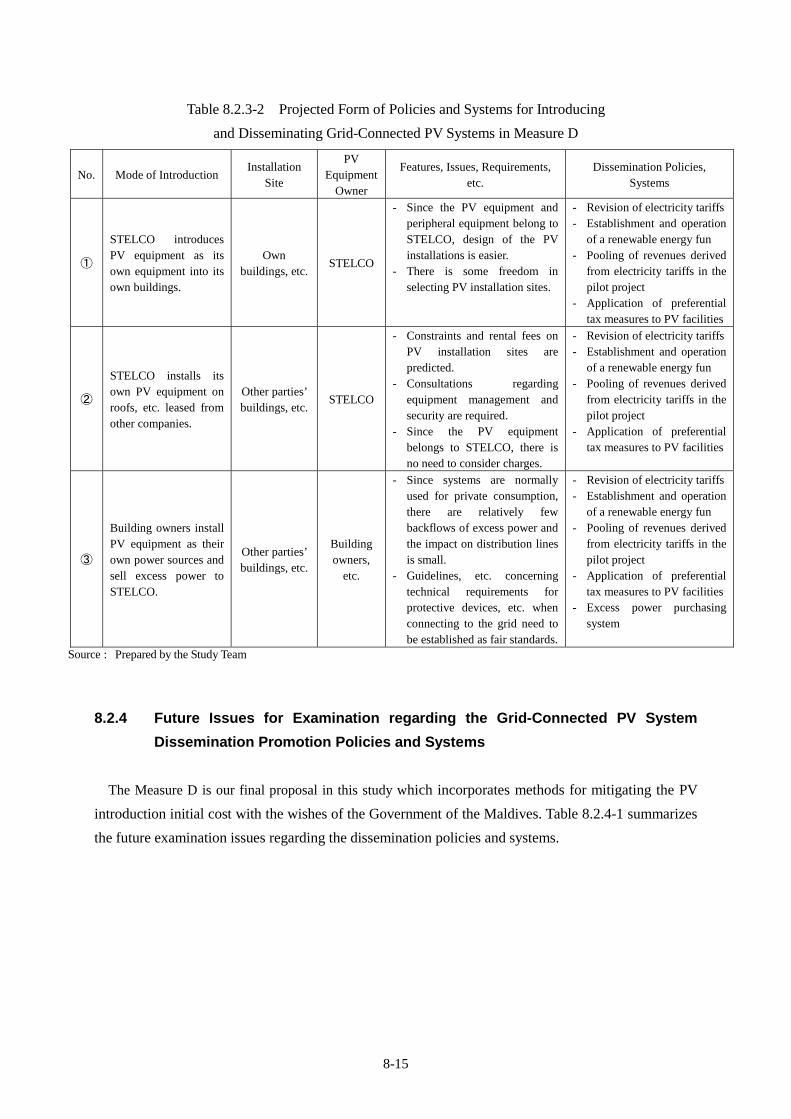
8-15
Table 8.2.3-2 Projected Form of Policies and Systems for Introducing
and Disseminating Grid-Connected PV Systems in Measure D
No. Mode of Introduction Installation
Site
PV Equipment
Owner
Features, Issues, Requirements, etc.
Dissemination Policies, Systems
①
STELCO introduces PV equipment as its own equipment into its own buildings.
Own buildings, etc.
STELCO
- Since the PV equipment and peripheral equipment belong to STELCO, design of the PV installations is easier.
- There is some freedom in selecting PV installation sites.
- Revision of electricity tariffs- Establishment and operation
of a renewable energy fun - Pooling of revenues derived
from electricity tariffs in the pilot project
- Application of preferential tax measures to PV facilities
②
STELCO installs its own PV equipment on roofs, etc. leased from other companies.
Other parties’ buildings, etc.
STELCO
- Constraints and rental fees on PV installation sites are predicted.
- Consultations regarding equipment management and security are required.
- Since the PV equipment belongs to STELCO, there is no need to consider charges.
- Revision of electricity tariffs- Establishment and operation
of a renewable energy fun - Pooling of revenues derived
from electricity tariffs in the pilot project
- Application of preferential tax measures to PV facilities
③
Building owners install PV equipment as their own power sources and sell excess power to STELCO.
Other parties’ buildings, etc.
Building owners,
etc.
- Since systems are normally used for private consumption, there are relatively few backflows of excess power and the impact on distribution lines is small.
- Guidelines, etc. concerning technical requirements for protective devices, etc. when connecting to the grid need to be established as fair standards.
- Revision of electricity tariffs- Establishment and operation
of a renewable energy fun - Pooling of revenues derived
from electricity tariffs in the pilot project
- Application of preferential tax measures to PV facilities
- Excess power purchasing system
Source : Prepared by the Study Team
8.2.4 Future Issues for Examination regarding the Grid-Connected PV System
Dissemination Promotion Policies and Systems
The Measure D is our final proposal in this study which incorporates methods for mitigating the PV
introduction initial cost with the wishes of the Government of the Maldives. Table 8.2.4-1 summarizes
the future examination issues regarding the dissemination policies and systems.
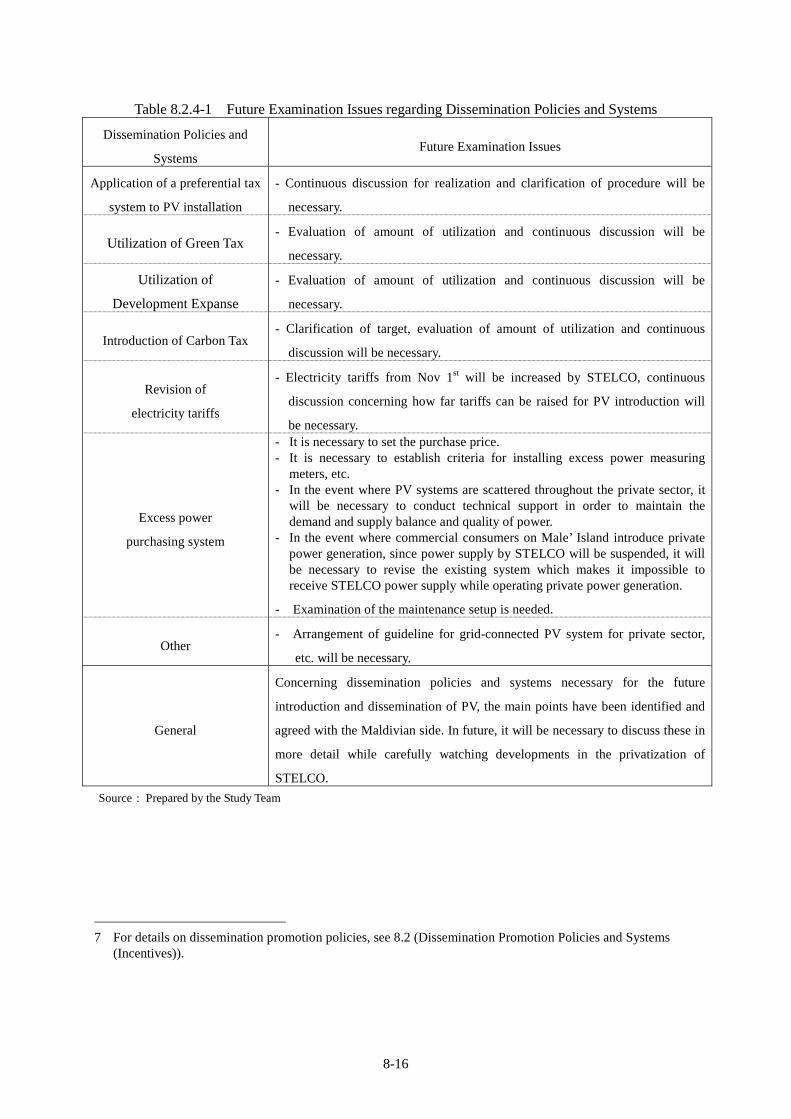
8-16
Table 8.2.4-1 Future Examination Issues regarding Dissemination Policies and Systems
Dissemination Policies and
Systems Future Examination Issues
Application of a preferential tax
system to PV installation
- Continuous discussion for realization and clarification of procedure will be
necessary.
Utilization of Green Tax - Evaluation of amount of utilization and continuous discussion will be
necessary.
Utilization of
Development Expanse
- Evaluation of amount of utilization and continuous discussion will be
necessary.
Introduction of Carbon Tax - Clarification of target, evaluation of amount of utilization and continuous
discussion will be necessary.
Revision of
electricity tariffs
- Electricity tariffs from Nov 1st will be increased by STELCO, continuous
discussion concerning how far tariffs can be raised for PV introduction will
be necessary.
Excess power
purchasing system
- It is necessary to set the purchase price. - It is necessary to establish criteria for installing excess power measuring
meters, etc. - In the event where PV systems are scattered throughout the private sector, it
will be necessary to conduct technical support in order to maintain the demand and supply balance and quality of power.
- In the event where commercial consumers on Male’ Island introduce private power generation, since power supply by STELCO will be suspended, it will be necessary to revise the existing system which makes it impossible to receive STELCO power supply while operating private power generation.
- Examination of the maintenance setup is needed.
Other - Arrangement of guideline for grid-connected PV system for private sector,
etc. will be necessary.
General
Concerning dissemination policies and systems necessary for the future
introduction and dissemination of PV, the main points have been identified and
agreed with the Maldivian side. In future, it will be necessary to discuss these in
more detail while carefully watching developments in the privatization of
STELCO.
7 For details on dissemination promotion policies, see 8.2 (Dissemination Promotion Policies and Systems
(Incentives)).
Source : Prepared by the Study Team
8-17
8.3 Technical Criteria and Guidelines, etc. for Introduction of Grid-Connected PV
Systems
In the Maldives, connecting private generating equipment to the power grid is currently prohibited,
and corporations and individuals who own private generators can only conduct private power supply
without receiving power from STELCO. Interconnection is not permitted because private generators
are not fitted with adequate synchronous control functions and protective devices and there is concern
over negative impacts on the STELCO grid. Moreover, the technical criteria and requirements
concerning interconnection are not clearly specified.
When it comes to connecting PV power generation systems to the grid, it will first be necessary to
revise these regulations and examine the requirements that are needed for interconnection. Table 8.3-1
shows the current conditions and technical requirements from the viewpoints of stable supply, power
quality, network protection, security and operation (based on the Japanese Grid-Connection
Requirements and Guidelines related to Securing Power Quality, October 1, 2004, of the Natural
Resources and Energy Agency) that will need to be examined in the Maldives from now on.

8-18
Tabl
e 8.
3-1
Tec
hnic
al R
equi
rem
ents
of
Gri
d-C
onne
ctio
n G
uide
line
s an
d R
esul
ts o
f E
xam
inat
ion
of A
ppli
cati
on to
the
Mal
dive
s
Exa
min
atio
n Is
sues
Pow
er c
apac
ity
Les
s th
an 5
0 kW
L
ess
than
2,0
00kW
(I
nclu
ding
spe
cial
hig
h vo
ltage
dis
trib
utio
n lin
es (
no m
ore
than
35
kV)
less
than
10,
000
kW)
Les
s th
an 1
0,00
0 kW
2,
000k
W o
r m
ore
As
a re
sult
of t
he p
oten
tial
stu
dy,
ther
e is
no
poss
ibil
ity
of c
onne
cti n
g 2,
000
kW o
r m
ore
at 1
site
.
Low
vol
tage
dis
trib
utio
n lin
es
Hig
h vo
ltage
dis
trib
utio
n lin
es
Spot
net
wor
k di
stri
butio
n lin
es
Spec
ial h
igh
volta
ge d
istr
ibut
ion
lines
Vol
tage
cla
ss
100/
200V
6,
600V
22
kV o
r 33k
V
7kV
or
mor
e
Low
vo
ltag
e (2
30/4
00V
) or
hi
gh
volt
age
(11,
000
V)
inte
rcon
nect
ion.
E
xam
ine
sepa
rate
ly
for
each
gr
id-c
onne
cted
sy
stem
w
itho
ut
esta
blis
hing
cap
acit
y di
visi
ons.
O
ver
volta
ge re
lay
(OV
R)
Und
er v
olta
ge r
elay
(U
VR
) O
ver
freq
uenc
y re
lay
(OFR
) U
nder
fre
quen
cy re
lay
(UFR
)
Sam
e as
left
Sa
me
as le
ft
Sam
e as
left
Pr
otec
tive
equi
pmen
t
- O
verv
olta
ge g
roun
d re
lay
(OV
GR
)
Onl
y in
ca
ses
of
thre
e-ph
ase
inte
rcon
nect
ion
conc
erni
ng
over
volta
ge
(OV
R),
un
derv
olta
ge
(UV
R),
ove
r fr
eque
ncy
(OFR
) an
d un
der
freq
uenc
y (U
FR)
and
over
volta
ge g
roun
d (O
VG
R)
Proh
ibite
d W
ith
reve
rse
pow
er
Poss
ible
(f
requ
ency
re
lay
or
tran
sfer
trip
sys
tem
is re
quir
ed)
Is
land
ing
oper
atio
n (D
etec
tion
met
hod)
B
oth
activ
e an
d pa
ssiv
e m
etho
d Sa
me
as le
ft
Rev
erse
pow
er r
elay
(R
PR)
With
out
reve
rse
pow
erPr
ohib
ited
(Fre
quen
cy
rela
y or
re
vers
e po
wer
rela
y)
For
secu
rity
and
ope
ratio
n re
ason
s,
proh
ibit
isla
ndin
g op
erat
ion
and
adop
t bo
th
activ
e an
d pa
ssiv
e de
tect
ion
func
tions
as
stan
dard
.
With
re
vers
e po
wer
・ A
s a
rule
, pow
er f
acto
r at
the
rece
ivin
g po
int s
hall
be 8
5% o
r m
ore
seen
fro
m th
e gr
id s
ide
and
shal
l no
t be
the
lead
ing
pow
er fa
ctor
. ・
If n
eces
sary
for
pre
vent
ing
volta
ge in
crea
se, t
he p
ower
fac
tor c
an b
e he
ld to
80%
.
・ W
hen
usin
g a
smal
l ou
tput
inv
erte
r or
in
case
s w
here
the
rec
eivi
ng p
oint
pow
er f
acto
r is
dee
med
ap
prop
riat
e as
in g
ener
al h
ouse
hold
s, th
e ge
nera
ting
faci
lity
pow
er f
acto
r sh
all b
e at
leas
t 85%
whe
n co
ntro
lling
with
reac
tive
pow
er a
nd a
t lea
st 9
5% w
hen
not c
ontr
ollin
g.
V
alue
to s
usta
in a
n ap
prop
riat
e vo
ltage
on
the
grid
Po
wer
fa
ctor
With
out
reve
rse
pow
er
Gen
erat
ing
faci
litie
s po
wer
fac
tor
is 9
5%
or m
ore.
As
a ru
le, p
ower
fac
tor a
t the
rece
ivin
g po
int s
hall
be 8
5% o
r m
ore
seen
fro
m th
e gr
id s
ide
and
shal
l not
be
the
lead
ing
pow
er fa
ctor
.
Ado
pt
a po
wer
fa
ctor
w
here
th
e vo
ltage
fl
uctu
atio
n at
th
e in
terc
onne
ctio
n po
int
is w
ithin
the
sc
ope
of
volta
ge
cont
rol
crit
eria
(n
omin
al v
olta
ge±1
0%).
Aut
omat
ic lo
ad
cont
rol
Whe
n th
ere
is d
ange
r of
int
erco
nnec
ted
pow
er l
ines
or
tran
sfor
mer
s go
ing
into
ove
rloa
d w
hen
gene
ratin
g fa
cilit
ies
drop
out
, ta
ke a
utom
atic
lim
iting
m
easu
res.
As
a ru
le,
do n
ot i
nsta
ll au
tom
atic
lo
ad c
ontr
ol,
and
secu
re e
quip
men
t ca
paci
ty
that
en
sure
s th
ere
is
no
over
load
eve
n w
hen
the
gene
rati
ng
equi
pmen
t dro
ps o
ut.
Cou
nter
mea
sure
s fo
r C
onst
ant v
olta
ge
fluc
tuat
ion
Whe
n th
ere
is d
ange
r of
dev
iatio
n fr
om
appr
opri
ate
valu
es
for
low
vo
ltage
co
nsum
ers
due
to
reve
rse
pow
er,
take
st
eps
to a
utom
atic
ally
adj
ust
volta
ge b
y us
ing
the
reac
tive
pow
er c
ontr
ol f
unct
ion
or o
utpu
t con
trol
fun
ctio
n.
(How
ever
, thi
s fu
nctio
n m
ay b
e om
itted
in
smal
l out
put i
nver
ters
).
If
the
abov
e st
eps
cann
ot
be
take
n,
rein
forc
e di
stri
butio
n lin
es a
nd s
o on
.
Whe
n th
ere
is d
ange
r of d
evia
tion
from
app
ropr
iate
val
ues
for
low
vo
ltage
co
nsum
ers
conn
ecte
d to
ge
nera
l di
stri
butio
n lin
es, t
ake
auto
mat
ic lo
ad c
ontr
ol m
easu
res.
If
thes
e ar
e in
suff
icie
nt t
o re
solv
e th
e pr
oble
m,
rein
forc
e di
stri
butio
n lin
es o
r con
nect
with
ded
icat
ed li
nes.
W
hen
ther
e is
dan
ger o
f dev
iatio
n fr
om a
ppro
pria
te v
alue
s fo
r lo
w v
olta
ge c
onsu
mer
s du
e to
rev
erse
pow
er,
take
st
eps
to a
utom
atic
ally
adj
ust
volta
ge t
hrou
gh u
sing
the
re
activ
e po
wer
con
trol
fun
ctio
n or
out
put c
ontr
ol f
unct
ion.
Whe
n th
ere
is
dang
er
that
vo
ltage
fl
uctu
atio
n ca
used
by
dr
op-o
ut
of
gene
ratin
g fa
cilit
ies
will
dev
iate
fro
m
the
cons
tant
vo
ltage
by
m
ore
than
1-
2%,
take
mea
sure
s to
aut
omat
ical
ly
limit
load
.
Whe
n th
ere
is
dang
er
that
vo
ltage
fl
uctu
atio
n ca
used
by
drop
-out
of
gene
ratin
g fa
cilit
ies
will
de
viat
e fr
om t
he c
onst
ant
volta
ge b
y m
ore
than
1-
2%,
take
m
easu
res
to
auto
mat
ical
lyad
just
vo
ltage
.
Secu
re
equi
pmen
t ca
paci
ty
to
ensu
re
that
th
e sc
ope
of
volta
ge
cont
rol
crite
ria
(nom
inal
vo
ltage
±10%
) is
not
dev
iate
d fr
om
even
w
hen
the
gene
rati
ng
equi
pmen
t dro
ps o
ut.
If t
here
is
risk
tha
t ba
ck f
low
s w
ill
caus
e de
viat
ion
outs
ide
of th
e vo
ltage
co
ntro
l cr
iteri
a sc
ope,
eq
uipm
ent
with
th
e re
activ
e po
wer
co
ntro
l fu
nctio
n or
out
put c
ontr
ol f
unct
ion.
In
stan
tane
ous
volta
ge f
luct
uati
on
coun
term
easu
res
Ado
pt a
sel
f-ex
citin
g in
vert
er p
osse
ssin
g au
tom
atic
syn
chro
nizi
ng f
unct
ion.
Sa
me
as le
ft
Prev
entio
n of
un
expe
cted
pa
ralle
l-of
f
Ado
pt
a sy
stem
w
here
by
para
llel
off
does
n't
aris
e an
d op
erat
ion
can
be
cont
inue
d or
aut
omat
ic r
etur
n ca
n oc
cur
whe
n in
stan
tane
ous
volta
ge d
rop
time
and
setti
ng t
ime
are
with
in t
he u
nder
vol
tage
re
lay
setti
ng ti
me.
Ens
ure
that
par
alle
l of
f do
esn'
t ar
ise
in c
ases
of
failu
res
outs
ide
of th
e co
nnec
ted
grid
.
If p
aral
lel o
ff d
oes
occu
r, ad
opt a
sys
tem
whe
reby
unw
ante
d br
eaki
ng (
brea
king
oth
er th
an th
at if
inde
pend
ent o
pera
tion)
ca
n be
avo
ided
in
the
gene
ratin
g fa
cilit
ies
due
to e
xces
sive
po
wer
flu
ctua
tion
with
in a
tim
e sh
orte
r th
an t
he a
utom
atic
sw
itchi
ng ti
me
of p
aral
lel o
ff c
ause
d by
rev
erse
pow
er r
elay
or
und
er v
olta
ge re
lay,
etc
.
Ens
ure
that
par
alle
l of
f do
esn'
t ar
ise
in
case
s of
fa
ilure
s ou
tsid
e of
th
e co
nnec
ted
grid
.
With
re
spec
t to
fa
ilure
s in
th
e in
terc
onne
cted
gr
id
and
up
to
the
prot
ecto
r ci
rcui
t br
eake
r, op
en
the
prot
ecto
r ci
rcui
t bre
aker
in th
e fa
iled
line
and
mai
ntai
n th
e co
nnec
tion
with
sou
nd
lines
with
out c
ondu
ctin
g pa
ralle
l off
.
Ens
ure
that
par
alle
l of
f do
esn'
t a r
ise
in c
ases
of
failu
res
outs
ide
of th
e co
nnec
ted
grid
.
If p
aral
lel
off
does
occ
ur,
adop
t a
syst
em w
here
by
unw
ante
d br
eaki
ng
(bre
akin
g ot
her
than
th
at
if
inde
pend
ent
oper
atio
n)
can
be
avoi
ded
in
the
gene
ratin
g fa
cilit
ies
due
to
exce
ssiv
e po
wer
flu
ctua
tion
with
in a
tim
e sh
orte
r th
an t
he a
utom
atic
sw
itchi
ng t
ime
of p
aral
lel
off
caus
ed b
y re
vers
e po
wer
rela
y or
und
er v
olta
ge re
lay,
etc
.
Prot
ectiv
e re
lay
setti
ngs
(inc
ludi
ng
time
setti
ngs)
sha
ll be
var
iabl
e.
Ado
pt
the
setti
ngs
esta
blis
hed
by
STE
LC
O t
o pr
even
t pa
ralle
l of
f du
e to
faul
ts o
n ot
her
feed
ers.
Inst
all
secu
rity
com
mun
icat
ions
tel
epho
ne f
acili
ties
(ded
icat
ed s
ecur
ity t
elep
hone
equ
ipm
ent,
tele
com
mun
icat
ions
ope
rato
r sp
ecia
l lin
e, g
ener
al t
elep
hone
or
mob
ile p
hone
, et
c.)
betw
een
the
busi
ness
off
ices
or
disp
atch
ing
cent
ers
of e
lect
ric
oper
ator
s on
the
grid
sid
e an
d in
stal
lers
of g
ener
atin
g fa
cilit
ies,
etc
.
Com
mun
icat
ion
syst
em
Con
nect
with
a s
peci
al h
igh
volta
ge p
ower
lin
e of
60
kV
or
mor
e an
d, i
n ca
ses
whe
re th
ere
is r
ever
se
pow
er
flow
, in
stal
l su
perv
isio
n or
te
lem
eter
eq
uipm
ent
betw
een
disp
atch
ing
cent
ers
of
oper
ator
s on
th
e gr
id
side
an
d in
stal
lers
of
ge
nera
ting
faci
litie
s, e
tc.
As
a re
sult
of
the
stud
y,
com
mun
icat
ions
equ
ipm
ent
such
as
secu
rity
ph
one
equi
pmen
t, et
c.
is
deem
ed to
be
unne
cess
ary.
C
once
rni n
g on
line
mea
sure
men
ts,
etc.
, ex
amin
e se
para
tely
acc
ordi
ng
to th
e gr
id o
pera
ting
nee
ds.
Sou
rce
: P
repa
red
by th
e St
udy
Team
bas
ed o
n da
ta o
f th
e N
atur
al R
esou
rces
and
Ene
rgy
Age
ncy
in J
apan

8-19
8.4 Medium to Long-Term Plans for Introducing Grid-Connected PV Systems
When it comes to introducing grid-connected PV systems and promoting dissemination over the
medium to long-term, the first thing to do is to establish a single roadmap (see Figure 8.4-1) for related
agencies and organizations including other donors and to clarify the respective roles of each. The
Study regards 2020 as the target year and divides the coming 10 years into Phase 1 (2010~2015) and
Phase 2 (2016~2020), and the medium to long-term plans to disseminate grid-connected PV systems
in each phase are as indicated below. Furthermore, an examination of human resources development
based on capacity assessment of organizations and personnel concerned with the introduction of
grid-connected PV systems is given in 8.6.
Phase 1Development of Basic Rules
Phase 2Establishment and Dissemination
STELCO
Private enterprises and general citizens
2010 2015 2020
Subsidy system
Excess power purchasing system (private enterprises and general citizens)
Establishment of grid connection guidelines Review and revision of grid connection guidelines
Enforcement of renewable energy utilization lawRevision of existing power supply regulations
Establishment of criteria concerning PV equipment and installation works
Operation of the certification system concerning PV equipment and installation works
Operation and maintenance OJT using actual grid-connected PV systems
Establishment of training equipment and manuals (MHTE, STELCO engineers)
Establishment of a system for external training on grid-connected PV systems (tie-ups with private enterprises, universities, research institutes, etc.)
Enlightenment and dissemination of grid-connected PV systems
Tax Relief or Exemption for PV equipment
Support for introduction to resort islands and outer atolls
Establishment and operation of a renewable energy fund
Revision of electricity tariffs
Revision of electricity tariffs
Leg
al s
yste
ms
an
d m
easu
res
to
dis
sem
ina
te P
V s
yste
mR
esp
on
sib
le
En
titi
es
Phase 1Development of Basic Rules
Phase 2Establishment and Dissemination
STELCO
Private enterprises and general citizens
2010 2015 2020
Subsidy systemSubsidy system
Excess power purchasing system (private enterprises and general citizens)Excess power purchasing system (private enterprises and general citizens)
Establishment of grid connection guidelines Review and revision of grid connection guidelinesEstablishment of grid connection guidelines Review and revision of grid connection guidelinesReview and revision of grid connection guidelines
Enforcement of renewable energy utilization lawRevision of existing power supply regulations Enforcement of renewable energy utilization lawRevision of existing power supply regulations Enforcement of renewable energy utilization lawEnforcement of renewable energy utilization lawRevision of existing power supply regulations
Establishment of criteria concerning PV equipment and installation works
Operation of the certification system concerning PV equipment and installation works
Establishment of criteria concerning PV equipment and installation worksEstablishment of criteria concerning PV equipment and installation works
Operation of the certification system concerning PV equipment and installation worksOperation of the certification system concerning PV equipment and installation works
Operation and maintenance OJT using actual grid-connected PV systemsOperation and maintenance OJT using actual grid-connected PV systems
Establishment of training equipment and manuals (MHTE, STELCO engineers)
Establishment of a system for external training on grid-connected PV systems (tie-ups with private enterprises, universities, research institutes, etc.)
Establishment of training equipment and manuals (MHTE, STELCO engineers)Establishment of training equipment and manuals (MHTE, STELCO engineers)
Establishment of a system for external training on grid-connected PV systems (tie-ups with private enterprises, universities, research institutes, etc.)Establishment of a system for external training on grid-connected PV systems (tie-ups with private enterprises, universities, research institutes, etc.)
Enlightenment and dissemination of grid-connected PV systemsEnlightenment and dissemination of grid-connected PV systems
Tax Relief or Exemption for PV equipmentTax Relief or Exemption for PV equipment
Support for introduction to resort islands and outer atollsSupport for introduction to resort islands and outer atolls
Establishment and operation of a renewable energy fundEstablishment and operation of a renewable energy fund
Revision of electricity tariffs
Revision of electricity tariffs
Revision of electricity tariffs
Revision of electricity tariffs
Revision of electricity tariffs
Revision of electricity tariffs
Leg
al s
yste
ms
an
d m
easu
res
to
dis
sem
ina
te P
V s
yste
mR
esp
on
sib
le
En
titi
es
Source : Prepared by the Study Team
Figure 8.4-1 Roadmap (Draft) geared to Dissemination of Grid-Connected PV Systems
(1) Phase 1: Development of Basic Rules (2010~2015)
In this Phase 1, immediately after completion of the Study, utilizing the outputs of the pilot
project which is planned and designed in the Study, it is desirable to actually introduce and start
operating grid-connected PV systems as early as possible, with a view to utilizing the outputs of
dissemination measures, human resources development and technology transfer. Moreover,
through accumulating and assessing implementation design, tender and consultant supervision

8-20
know-how and operating data acquired during the pilot project, it will be important to prepare for
the introduction of grid-connected PV systems by private sector enterprises and ordinary
households in the Phase 2 period. At this stage, since it is still too early to introduce
grid-connected PV systems by private enterprises and households, the plan is for STELCO to
take the initiative in introducing systems to government buildings and public facilities such as
schools and hospitals, etc. in Male’ Island and at the same time to widely inform the citizens of
the Maldives about the effects of PV systems. Also, when STELCO promotes the introduction of
grid-connected PV systems, it will be necessary to train and educate possible retailers and
contractors for PV equipment who will take the initiative in installing systems to private sector in
the future.
1) Establishment of Legal Systems and Guidelines
In order to promote the introduction of grid-connected PV systems to private sector
enterprises and general households in the Phase 2 period, it will be necessary for the
government to establish the following regulations and guidelines concerning power supply
reliability and quality, public safety and safety for electrical works during this Phase 1
period.
① Revision of existing electric power supply regulations
The legislation regulating the electric utility in Maldives is the Law governing public
services (Law No. 4 of 1996). According to Article 2, this law defines public services
as electric power, telephones, public water supply, and sewerage. According to Article
3 of this law, parties that implement public services (government agencies, state-owned
enterprises, private operators) must register with government regulatory agencies and
comply with the regulations imposed by such agencies.
Based on Article 3 of the Law governing public services, the specific contents of
regulations pertaining to the electric utility are stipulated in the “Regulations on public
supply of electricity in Male’ and outer Atolls (1993)” established by the Maldives
Energy Authority (MEA), which is the regulatory agency for the electric utility.
According to Article 1 of this regulation, entities that aim to operate electric utilities
must register to MEA and receive the necessary approval. These regulations prescribe
the basic technical items that need to be followed by electric utility operators
concerning power generating and distribution facilities. For power generating facilities,
since existing regulations were compiled only for diesel power stations, it will be
necessary to stipulate the minimum required criteria from the viewpoint of quality
control for PV equipment assuming the case where entities other than STELCO
introduce grid-connected PV systems.

8-21
② Grid-connection guidelines
After Phase 2 period, since grid-connected PV systems will be introduced through
private sector enterprises and ordinary households, it will be necessary to establish
technical requirements concerning grid connection and provide guidelines that
facilitate fair technical discussions between entities to install PV system and the
electric utility (STELCO). The Japanese Grid Connection Technical Requirements and
Guidelines, which were announced in 1986, have undergone numerous revisions
reflecting technical development trends and changes to the electric utility law, and the
original guidelines were divided into the “Interpretation of Technical Standards for
Electric Facilities” and the “Technical Requirements and Guidelines for Grid
Interconnection for Securing Quality of Power Supply” in 2004. Similarly, it is forecast
that guidelines in Maldives will need to undergo revisions from Phase 2 onwards to
reflect changes in the environment.
③ Technical criteria concerning PV instruments and installation works
Standards of the IEC (International Electrotechnical Commission) are widely applied
as international standards for PV generating instruments, however, in Japan, designs
based on JIS criteria are more common. IEC Technical Committee 82 (PV generating
systems) is currently surveying applied standards in each country and is seeking to
promote common standards with the IEC standards. In Maldives, since the potential
capacity for system introduction is relatively limited, it is unrealistic to expect the
establishment of new domestic standards. Rather, it is more important to ensure
thorough quality control of PV-related products through applying international
standards (IEC, etc.) and establishing the product inspection setup when works are
complete. The existing STELCO workshop on Male’ Island is the ideal place for
implementing PV product inspections, however, it will first be necessary to receive
MEA authorization for the applied standards and to establish a manual for product
inspections. In addition, when purchasing grid-connected PV systems, rather than
purchasing PV modules and power conditioners as isolated items, it is better to select
manufacturers who can procure, install, test and adjust total systems, and thereby
ensure that poor quality products from emerging countries do no enter the domestic
market.
2) Dissemination Promotion Policies and Systems
During Phase 1 period, the target will be for STELCO to achieve the PV installation
capacity for 2015 in accordance with the plan proposed in the technical feasibility study
while utilizing experience from the pilot project. Accordingly, the MHTE (or MEA) shall

8-22
establish a pool system utilizing generated electric energy returns from the grid-connected
PV systems installed under the pilot project, and use this to subsidize the initial investment
required to introduce grid-connected PV systems as scheduled. Other methods for mitigating
initial investment include exemption or reduction of import duties for PV products,
introduction of Green tax or Carbon tax, establishing a Renewable Energy Fund, revising
electricity tariffs, and so forth7. When it comes to the Phase 2 activity of introducing
grid-connected PV systems to private sector enterprises and ordinary households, it is
planned to encourage introduction through the excess power purchasing system, so it will be
necessary to start examinations into methods for setting the excess power purchase price,
measuring surplus power and reading meters under this system.
(2) Phase 2: Establishment and Dissemination (2016~2020)
1) Establishment of Legal Regulations and Guidelines
The legal regulations and guidelines for introducing grid-connected PV systems which were
established in Phase 1 will undergo amendment and revision during Phase 2 period based on
actual operating performance. This will be important for building a regulatory setup which
corresponds to actual conditions. Towards this end, regular meetings (around once every six
months) will be held between the MHTE, MEA, STELCO and entities who install
grid-connected PV system to discuss issues in current legal regulations and guidelines,
impediments to future large-scale system introduction and necessary improvements. The
MEA will probably take the initiative in these examinations, however, since MEA doesn’t
currently possess the organizational or personnel capacity to do this, it will be necessary to
consider the utilization of technical cooperation by Japan and other donors as well as the
recruitment of foreign consultants.
In Japan, “Act on the Promotion of New Energy Usage (New Energy Law)” and “Act on
Special Measures concerning New Energy Usage by Electric Utilities (RPS Law)” contain
the basic government policy concerning the comprehensive promotion of new energies. In
the rest of Asia, Renewable Energy Act of 2008, R.A.9315 was established in the
Philippines on December 16, 2008, and based on this the Philippine government is
promoting renewable energies through the establishment of the State Renewable Energy
Department and provision of tax exemptions. In Maldives, no such legal systems exist, and
there are no legal stipulations concerning numerical targets for introduction of renewable
energies including grid-connected PV systems, provisions in the event where targets are not
met, and the division of roles between related organizations and so on. Moreover, in order to
attract major investment in the future, it will be necessary to examine preferential tax
systems concerning income tax and indirect taxes, etc., and legislative measures will be
essential in such case. However, since the potential capacity for grid-connected PV system

8-23
introduction on Male’ Island and Hulhumale’ Island by 2020 is limited, it may be more
realistic to reexamine the necessity for more strict measures based on a renewable energy
law while considering the actual dissemination after Phase 1 period.
2) Establishment of Dissemination Promotion Policies and Systems
As was mentioned in 8.2, the Study Team has proposed excess power purchasing system for
promoting the introduction of grid-connected PV systems to private sector and general
households in tandem with planned introduction to STELCO in Phase 2. When it comes to
applying such a system, it may be necessary to adjust the unit purchase price while regularly
monitoring the scale of PV systems being introduced by general households. Under the
Study, PV introduction targets are set for each year with a view to achieving the target
capacity by 2020, and it will be necessary to review the target years and capacities for
introduction while taking the government’s latest renewable energy policies and actual
introduced capacities into account. Also, since Maldives does not have a master plan of
energy supply including renewable energies, it will be desirable to compile a nationwide
medium to long-term master plan which includes outer atolls taking into account
dissemination of grid-connected PV systems in the Male’ metropolitan area during Phase 1.
In addition, another future issue will be the widespread education and awareness raising of
PV system and DSM techniques to people including MATI and resort owners, etc.
8.5 Action Plan for Introduction of Grid-Connected PV Systems
This section describes the action plan for implementing the medium to long-term plan indicated in 8.4
by the entities involved in grid-connected PV system introduction, i.e. the MHTE, MEA and
STELCO. In Maldives, PV systems have been introduced under donor support in the past, and the
MHTE, as the policy planning department, follows up system maintenance conditions and conducts
troubleshooting, etc. However, expected roles and responsibilities among the said three organizations
are unclear. Therefore, as is shown in Table 8.5-1, the Study Team has prepared the action plans
required of each entity for grid-connected PV system and has obtained the consent of each entity in
separate consultations.
As is shown in the table, the MHTE, which is the supervisory agency in charge of energy
administration, manages the formulation and implementation of policies for promoting the
dissemination of grid-connected PV systems, while the MEA compiles and manages the necessary
regulations, guidelines and technical criteria, etc. based on the said policies. It is desirable that the
electricity utility, STELCO, compiles demand and supply plans that take the future introduction of
grid-connected PV systems into account, plans and designs systems, and takes charge of maintenance.

8-24
In this way, when introducing grid-connected PV systems, it is necessary to clarify the roles of each
organization and to establish the work flow starting from the upstream ministry (MHTE) and moving
down through the independent monitoring agency (MEA) to utility (STELCO).
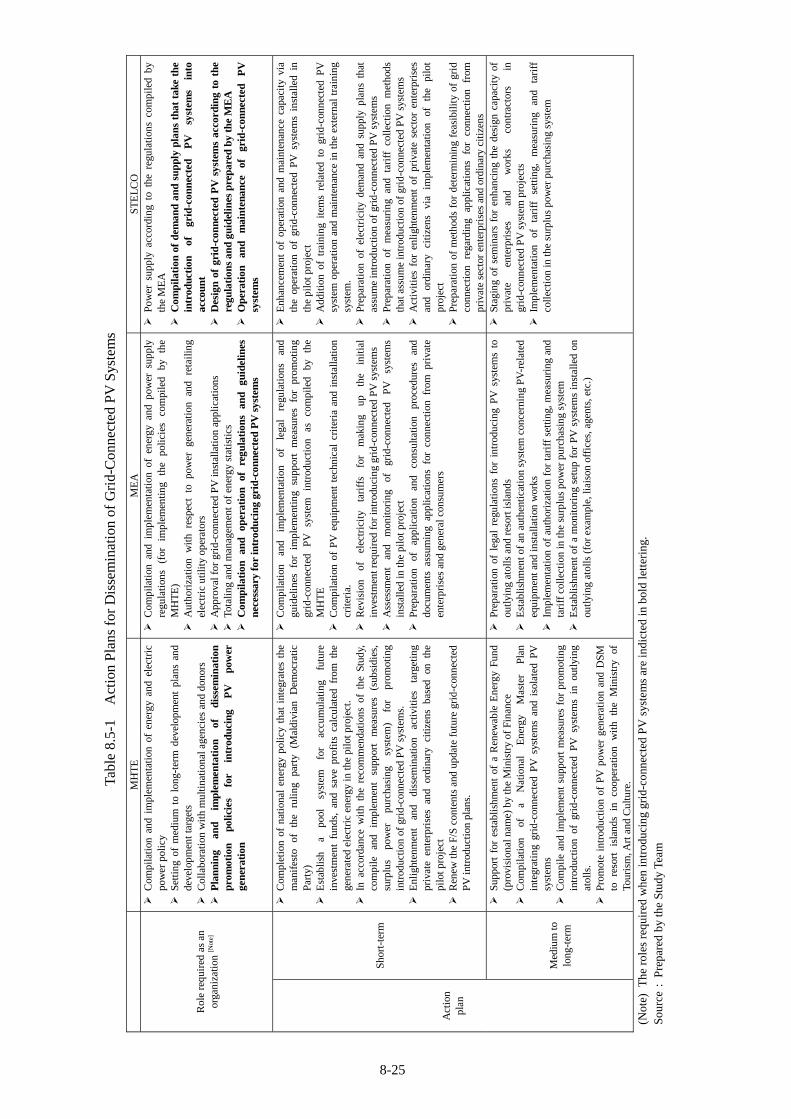
8-25
Tabl
e 8.
5-1
Act
ion
Pla
ns f
or D
isse
min
atio
n of
Gri
d-C
onne
cted
PV
Sys
tem
s
M
HT
E
ME
A
STE
LC
O
Rol
e re
quir
ed a
s an
or
gani
zatio
n [N
ote]
Com
pila
tion
and
im
plem
enta
tion
of
ener
gy a
nd e
lect
ric
pow
er p
olic
y S
etti
ng o
f m
ediu
m t
o lo
ng-t
erm
dev
elop
men
t pl
ans
and
deve
lopm
ent t
arge
ts
Col
labo
rati
on w
ith
mul
tinat
iona
l age
ncie
s an
d do
nors
P
lann
ing
and
impl
emen
tati
on
of
diss
emin
atio
n pr
omot
ion
polic
ies
for
intr
oduc
ing
PV
po
wer
ge
nera
tion
Com
pila
tion
and
im
plem
enta
tion
of
ener
gy a
nd p
ower
sup
ply
regu
lati
ons
(for
im
plem
entin
g th
e po
licie
s co
mpi
led
by
the
MH
TE
)
Aut
hori
zati
on w
ith
resp
ect
to p
ower
gen
erat
ion
and
reta
iling
el
ectr
ic u
tilit
y op
erat
ors
A
ppro
val f
or g
rid-
conn
ecte
d PV
inst
alla
tion
app
licat
ions
T
otal
ing
and
man
agem
ent o
f en
ergy
sta
tist
ics
Com
pila
tion
an
d op
erat
ion
of
regu
lati
ons
and
guid
elin
es
nece
ssar
y fo
r in
trod
ucin
g gr
id-c
onne
cted
PV
sys
tem
s
Pow
er s
uppl
y ac
cord
ing
to t
he r
egul
atio
ns c
ompi
led
by
the
ME
A
Com
pila
tion
of
dem
and
and
supp
ly p
lans
tha
t ta
ke t
he
intr
oduc
tion
of
gr
id-c
onne
cted
P
V
syst
ems
into
ac
coun
t D
esig
n of
gri
d-co
nnec
ted
PV
sys
tem
s ac
cord
ing
to t
he
regu
lati
ons
and
guid
elin
es p
repa
red
by t
he M
EA
O
pera
tion
an
d m
aint
enan
ce
of
grid
-con
nect
ed
PV
sy
stem
s
Shor
t-te
rm
Com
plet
ion
of n
atio
nal
ener
gy p
olic
y th
at i
nteg
rate
s th
e m
anif
esto
of
th
e ru
ling
pa
rty
(Mal
divi
an
Dem
ocra
tic
Part
y)
Est
ablis
h a
pool
sy
stem
fo
r ac
cum
ulat
ing
futu
re
inve
stm
ent
fund
s, a
nd s
ave
prof
its
calc
ulat
ed f
rom
the
ge
nera
ted
elec
tric
ene
rgy
in th
e pi
lot p
roje
ct.
I
n ac
cord
ance
wit
h th
e re
com
men
dati
ons
of t
he S
tudy
, co
mpi
le
and
impl
emen
t su
ppor
t m
easu
res
(sub
sidi
es,
surp
lus
pow
er
purc
hasi
ng
syst
em)
for
prom
otin
g in
trod
ucti
on o
f gr
id-c
onne
cted
PV
sys
tem
s.
E
nlig
hten
men
t an
d di
ssem
inat
ion
activ
ities
ta
rget
ing
priv
ate
ente
rpri
ses
and
ordi
nary
citi
zens
bas
ed o
n th
e pi
lot p
roje
ct
R
enew
the
F/S
cont
ents
and
upd
ate
futu
re g
rid-
conn
ecte
d PV
intr
oduc
tion
pla
ns.
Com
pila
tion
an
d im
plem
enta
tion
of
le
gal
regu
lati
ons
and
guid
elin
es f
or i
mpl
emen
ting
supp
ort
mea
sure
s fo
r pr
omot
ing
grid
-con
nect
ed
PV
syst
em
intr
oduc
tion
as
co
mpi
led
by
the
MH
TE
C
ompi
lati
on o
f PV
equ
ipm
ent
tech
nica
l cr
iter
ia a
nd i
nsta
llatio
n cr
iter
ia.
R
evis
ion
of
elec
tric
ity
tari
ffs
for
mak
ing
up
the
initi
al
inve
stm
ent r
equi
red
for
intr
oduc
ing
grid
-con
nect
ed P
V s
yste
ms
Ass
essm
ent
and
mon
itori
ng
of
grid
-con
nect
ed
PV
sy
stem
s in
stal
led
in th
e pi
lot p
roje
ct
Pre
para
tion
of
ap
plic
atio
n an
d co
nsul
tatio
n pr
oced
ures
an
d do
cum
ents
ass
umin
g ap
plic
atio
ns f
or c
onne
ctio
n fr
om p
riva
te
ente
rpri
ses
and
gene
ral c
onsu
mer
s
Enh
ance
men
t of
ope
rati
on a
nd m
aint
enan
ce c
apac
ity
via
the
oper
atio
n of
gri
d-co
nnec
ted
PV s
yste
ms
inst
alle
d in
th
e pi
lot p
roje
ct
Add
ition
of
trai
ning
ite
ms
rela
ted
to g
rid-
conn
ecte
d PV
sy
stem
ope
rati
on a
nd m
aint
enan
ce i
n th
e ex
tern
al t
rain
ing
syst
em.
Pre
para
tion
of
elec
tric
ity d
eman
d an
d su
pply
pla
ns t
hat
assu
me
intr
oduc
tion
of
grid
-con
nect
ed P
V s
yste
ms
Pre
para
tion
of
mea
suri
ng a
nd t
arif
f co
llect
ion
met
hods
th
at a
ssum
e in
trod
ucti
on o
f gr
id-c
onne
cted
PV
sys
tem
s
Act
ivit
ies
for
enlig
hten
men
t of
pri
vate
sec
tor
ente
rpri
ses
and
ordi
nary
ci
tize
ns
via
impl
emen
tati
on
of
the
pilo
t pr
ojec
t
Pre
para
tion
of
met
hods
for
det
erm
inin
g fe
asib
ility
of
grid
co
nnec
tion
re
gard
ing
appl
icat
ions
fo
r co
nnec
tion
fr
om
priv
ate
sect
or e
nter
pris
es a
nd o
rdin
ary
citi
zens
Act
ion
plan
Med
ium
to
long
-ter
m
Sup
port
for
est
ablis
hmen
t of
a R
enew
able
Ene
rgy
Fund
(p
rovi
sion
al n
ame)
by
the
Min
istr
y of
Fin
ance
C
ompi
lati
on
of
a N
atio
nal
Ene
rgy
Mas
ter
Plan
in
tegr
atin
g gr
id-c
onne
cted
PV
sys
tem
s an
d is
olat
ed P
V
syst
ems
Com
pile
and
im
plem
ent
supp
ort
mea
sure
s fo
r pr
omot
ing
intr
oduc
tion
of g
rid-
conn
ecte
d PV
sys
tem
s in
out
lyin
g at
olls
.
Pro
mot
e in
trod
ucti
on o
f PV
pow
er g
ener
atio
n an
d D
SM
to
reso
rt
isla
nds
in
coop
erat
ion
wit
h th
e M
inis
try
of
Tour
ism
, Art
and
Cul
ture
.
Pre
para
tion
of
lega
l re
gula
tion
s fo
r in
trod
ucin
g PV
sys
tem
s to
ou
tlyin
g at
olls
and
res
ort i
slan
ds
Est
ablis
hmen
t of
an a
uthe
ntic
atio
n sy
stem
con
cern
ing
PV-r
elat
ed
equi
pmen
t and
inst
alla
tion
wor
ks
Im
plem
enta
tion
of
auth
oriz
atio
n fo
r ta
riff
set
ting,
mea
suri
ng a
nd
tari
ff c
olle
ctio
n in
the
surp
lus
pow
er p
urch
asin
g sy
stem
E
stab
lishm
ent
of a
mon
itori
ng s
etup
for
PV
sys
tem
s in
stal
led
on
outly
ing
atol
ls (
for
exam
ple,
liai
son
offi
ces,
age
nts,
etc
.)
Sta
ging
of
sem
inar
s fo
r en
hanc
ing
the
desi
gn c
apac
ity
of
priv
ate
ente
rpri
ses
and
wor
ks
cont
ract
ors
in
grid
-con
nect
ed P
V s
yste
m p
roje
cts
I
mpl
emen
tati
on
of
tari
ff
setti
ng,
mea
suri
ng
and
tari
ff
colle
ctio
n in
the
surp
lus
pow
er p
urch
asin
g sy
stem
(Not
e) T
he r
oles
req
uire
d w
hen
intr
oduc
ing
grid
-con
nect
ed P
V s
yste
ms
are
indi
cted
in b
old
lett
erin
g.
Sou
rce
: P
repa
red
by th
e St
udy
Team

8-26
8.6 Human Resources Development Plan
8.6.1 Capacity Assessment of Counterpart Agencies, etc.
(1) Capacity on the Individual Level
The Energy Section, which is responsible for energy administration within the MHTE, has ten
employees, of them only two engineers the Assistant Director, Ahmed Ali, is an engineer (MA in
engineering), while the other seven are graduates of high school regular courses. Of these seven,
two studied for a year at a technical institute and obtained electrical and electronic engineering
certificates, however, they do not possess a technical skill based in practical work. Accordingly,
the MHTE wants to send these personnel overseas in order to learn energy policy and regulation,
energy economics, energy security and renewable energies, etc. However, because the Energy
Section does not have a plan or budget for human resources development, it will be necessary for
prospective government employees to apply for and succeed in overseas study programs.
MEA has four employees including one engineer. He has worked as a lecturer of electrical and
electronic engineering at a college of higher education.
STELCO has a workforce of 449 employees, however, there are only 20 electric engineers who
are qualified as Professional Engineers, while only two engineers have experience of PV
planning and operation. One of these engineers worked on the RETDAP project under UNDP,
while the other has worked in the telephone company Dhiraagu. Both these engineers have
acquired technology while using resources outside of STELCO.
In all organizations, the counterparts for the Study Team are willing to cooperate with the Study
Team on Fridays and Saturdays even after regular working hours, and they displayed a lot of
interest in the Study, high willingness to participate and adequate awareness of the need to
introduce grid-connected PV systems. However, top managers tend to be swamped in everyday
work and have little prospective or incentive for medium to long-term. As they have depended on
donor support in the past, they generally display little ownership on projects.
(2) Capacity on the Organization Level
Capacity on the organization level refers to material, human and intellectual resources,
ownership, organizational management setup and organizational culture8 necessary for resolving
issues and achieving goals that have been imparted to an organization or taken on by the
organization itself. Concerning human resources, in order to introduce grid-connected PV
8 “Case Analysis concerning Capacity Development (CD), Energy Efficiency and Conservation”

8-27
systems to Maldives, it is important for MHTE, MEA and STELCO to secure adequate
employees, and for these employees to have incentive to fulfil their duties and accumulate skills
inside the organization. However, MHTE and STELCO employees frequently undergo transfers
(overseas training is especially frequent) and skills that are acquired in manufacturer training
programs, etc. tend to stay with individuals. The intellectual resources management is also
inadequate and document and electronic data storage methods are left on individuals, meaning
that organizations cannot deal with the situation when staff members are absent or transferred.
Although the MHTE has a Human Resource Section, it only gathers the training (overseas study)
needs of each section and presents them to the Ministry of Human Resource, Youth and Sports,
however, it needs to prepare a setup for developing human resources in a planned manner.
Similarly, as for MEA, collecting applications for OJT and overseas study programs is the main
activity of human resources training, and no organized setup has been established.
Human resources training in STELCO consists of the following activities: ① Off-JT by internal
and external experts (consumer services, computer skills, cable connections, DEG maintenance,
general affairs, linguistics, financial affairs, etc.), ② OJT by senior staff, and ③ training by
consultants and manufacturers when handing over projects. In the past, STELCO utilized the
overseas training system to allow between two and five employees to obtain degrees in Australia,
the United Kingdom, Malaysia and Singapore, etc. every year, however, this system was
discontinued in 2003 due to deterioration of financial condition. The STELCO Human Resource
Department is composed of six employees and works on gathering annual training needs and
compiling training plans in each department, however, the training budget was cut in 2009 due to
the worsening financial situation. Table 8.6.1-1 shows the Off-JT contents that were implemented
in 2008.
8-28
Table 8.6.1-1 Off-JT by STELCO (Fiscal 2008)
Training Mode Training Contents Period Trainees
Computers (basics) 9 days 23 people
High and low voltage cable connections, terminal processing methods 2 days 35 people
Firefighting training (Male’ Island, outlying atolls) 7 days All employees
Consumer relations (basics) 3 days 27 people
Consumer relations (applied) 4 days 30 people
In-house training
Language (English) 8 months 21 people
Invitation to the Islam capital market 1 days 3 people
Management of corporate reform 2 days 1 person
International accounting standard 2 days 2 people
Islam credit seminar 1 days 2 people
4 roles of leaders 2 days 20 people
External training and
seminars (domestic)
Computers (applied) 2 months 14 people
Energy management (Pakistan) 8 days 1 person
Cummins Co. engine repair and maintenance (India) 1 month 10 people
Wartsila Co. engine repair and maintenance (India) 19 days 9 people
External training
(overseas) Electric power market development program (Sri Lanka) 7 days 1 person
Source : STELCO
Concerning teaching materials for human resources development and training, manuals are
distributed for training in consumer services, computer skills and cable connections, while no
teaching materials are used for Off-JT training. As for post-training evaluations, there are some
external lecturer programs where post evaluations are implemented, however, the Human
Resource Department has no consistent training evaluation system.
(3) Capacity on the Social and Institutional Levels
Concerning capacity on the social and institutional levels, the Study Team ascertained the
capacity of government agencies (stakeholders) which have jurisdiction over public facilities
(schools, stadiums, hospitals, etc.) expected to be among the first to introduce grid-connected PV
systems, and also legal systems and the mechanism to introduce grid-connected PV system.
1) Government Agencies
The public facilities that were confirmed as potential sites in the Study are owned by the
following agencies:
Government offices, etc.: Ministry of Finance and Treasury
Hospitals: Ministry of Health and Family
Schools: Ministry of Education
Social Center, National Stadium: Ministry of Human Resources, Youth and Sports
Courtesy calls were made to the above agencies and, upon explaining the contents of the
study and requesting cooperation, they expressed a strong interest in grid-connected PV
systems and cooperated with the site surveys. These government agencies do not adopt an
8-29
organized approach to climate change and global environmental problems like their
Japanese counterparts, however, it would be difficult to expect such capacity in Maldives
too. In order to advance the introduction of grid-connected PV systems, it will first be
necessary to conduct organized awareness raising activities that involve these government
agencies.
2) Legal Systems and Mechanisms
The Maldives has no Laws or Acts for promoting the introduction of renewable energies
including PV power generation (equivalent to the New Energy Law and RPS Law in Japan),
however, the MHTE recognizes the need to immediately establish a legal system.
8.6.2 Direction of Human Resources Development
In this section, examination is carried out on the direction of human resources development based on
the aforementioned capacity assessment findings. On the individual level, during the course of the
Study, capacity building has been conducted based on planning and design capacity to introduce
grid-connected PV system. Through implementation of the pilot project, it is anticipated that necessary
skills for supervision, operation and maintenance for grid-connected PV systems are acquired
primarily among STELCO engineers. Concerning capacity on the organization level, in the case of
STELCO, it is possible to achieve a certain level of capacity building through adding training
programs on grid-connected PV system planning, design, operation and maintenance by external
experts (overseas manufacturers and power companies). In case of MHTE and MEA, it is first
necessary to establish mission statements and division of duties including conventional energy supply,
and then to examine the direction of human resources development for introducing renewable energies
and grid-connected PV systems (see 8.4). As for the social and institutional level, after completion of
the Study, it will be necessary to advance preparations for introducing regulations and guidelines
concerning the Renewable Energy Law (provisional name) and grid connections.
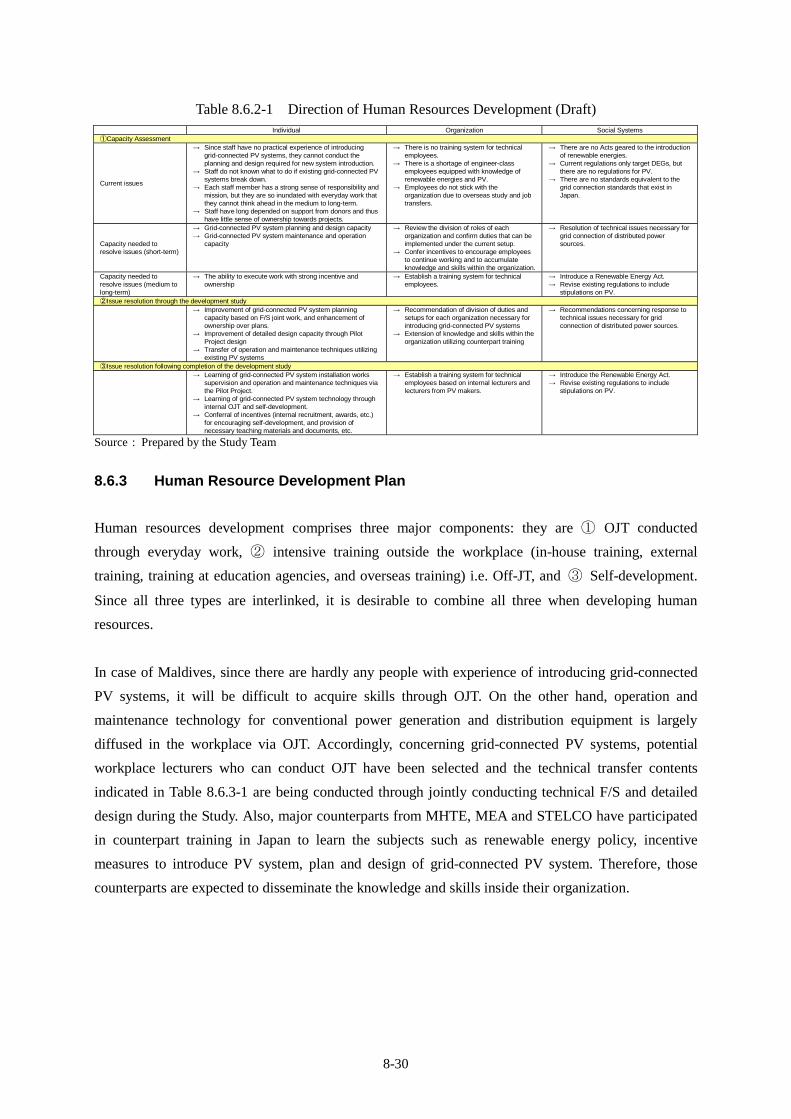
8-30
Table 8.6.2-1 Direction of Human Resources Development (Draft) Individual Organization Social Systems
①Capacity Assessment
Current issues
Since staff have no practical experience of introducing grid-connected PV systems, they cannot conduct the planning and design required for new system introduction.
Staff do not known what to do if existing grid-connected PV systems break down.
Each staff member has a strong sense of responsibility and mission, but they are so inundated with everyday work that they cannot think ahead in the medium to long-term.
Staff have long depended on support from donors and thus have little sense of ownership towards projects.
There is no training system for technical employees.
There is a shortage of engineer-class employees equipped with knowledge of renewable energies and PV.
Employees do not stick with the organization due to overseas study and job transfers.
There are no Acts geared to the introduction of renewable energies.
Current regulations only target DEGs, but there are no regulations for PV.
There are no standards equivalent to the grid connection standards that exist in Japan.
Capacity needed to resolve issues (short-term)
Grid-connected PV system planning and design capacity Grid-connected PV system maintenance and operation
capacity
Review the division of roles of each organization and confirm duties that can be implemented under the current setup.
Confer incentives to encourage employees to continue working and to accumulate knowledge and skills within the organization.
Resolution of technical issues necessary for grid connection of distributed power sources.
Capacity needed to resolve issues (medium to long-term)
The ability to execute work with strong incentive and ownership
Establish a training system for technical employees.
Introduce a Renewable Energy Act. Revise existing regulations to include
stipulations on PV. ②Issue resolution through the development study Improvement of grid-connected PV system planning
capacity based on F/S joint work, and enhancement of ownership over plans.
Improvement of detailed design capacity through Pilot Project design
Transfer of operation and maintenance techniques utilizing existing PV systems
Recommendation of division of duties and setups for each organization necessary for introducing grid-connected PV systems
Extension of knowledge and skills within the organization utilizing counterpart training
Recommendations concerning response to technical issues necessary for grid connection of distributed power sources.
③Issue resolution following completion of the development study Learning of grid-connected PV system installation works
supervision and operation and maintenance techniques via the Pilot Project.
Learning of grid-connected PV system technology through internal OJT and self-development.
Conferral of incentives (internal recruitment, awards, etc.) for encouraging self-development, and provision of necessary teaching materials and documents, etc.
Establish a training system for technical employees based on internal lecturers and lecturers from PV makers.
Introduce the Renewable Energy Act. Revise existing regulations to include
stipulations on PV.
Source : Prepared by the Study Team
8.6.3 Human Resource Development Plan
Human resources development comprises three major components: they are ① OJT conducted
through everyday work, ② intensive training outside the workplace (in-house training, external
training, training at education agencies, and overseas training) i.e. Off-JT, and ③ Self-development.
Since all three types are interlinked, it is desirable to combine all three when developing human
resources.
In case of Maldives, since there are hardly any people with experience of introducing grid-connected
PV systems, it will be difficult to acquire skills through OJT. On the other hand, operation and
maintenance technology for conventional power generation and distribution equipment is largely
diffused in the workplace via OJT. Accordingly, concerning grid-connected PV systems, potential
workplace lecturers who can conduct OJT have been selected and the technical transfer contents
indicated in Table 8.6.3-1 are being conducted through jointly conducting technical F/S and detailed
design during the Study. Also, major counterparts from MHTE, MEA and STELCO have participated
in counterpart training in Japan to learn the subjects such as renewable energy policy, incentive
measures to introduce PV system, plan and design of grid-connected PV system. Therefore, those
counterparts are expected to disseminate the knowledge and skills inside their organization.

8-31
Table 8.6.3- 1 Contents of Technical Transfer Implemented in the Study
(including Counterpart Training)
Classification Contents Targets
Structure of the electric power utility in Japan MHTE, MEA
Policies and systems for introduction of renewable energies in Japan and other advanced countries
MHTE, MEA
Thinking behind introduction of measures and systems for introducing PV power generation
MHTE, MEA
Energy and electric power
utility in general
Issues and countermeasures for CDM project plans MHTE, MEA
Types and characteristics of PV systems MHTE, MEA, STELCO
Legal systems related to PV power generation MHTE, MEA
Consideration of social and environmental impacts of PV power generation introduction
MHTE, MEA
Economic assessment of PV power generation MHTE, MEA
Measurement of PV system characteristics STELCO
Solar radiation data measurement and utilization methods MHTE, MEA, STELCO
Techniques for measuring solar radiation obstructions STELCO
Technique for planning layout of PV panels STELCO
PV power generation in general
PV technology research and development MHTE, MEA, STELCO
Component instruments and their roles in grid-connected PV power generation systems
MHTE, MEA, STELCO
Issues and technical items in grid connection MHTE, MEA, STELCO
Method for measuring power source quality at grid connection points STELCO
Technique for selecting sites for introducing grid-connected PV systems
MHTE, MEA, STELCO
Detailed design technique for introducing grid-connected PV systems STELCO
Grid-connected PV power generation
Grid-connected PV system operation and maintenance techniques STELCO Source : Prepared by the Study Team
After completion of the Study, it will be necessary to carry out technical transfer of the items indicated
in Table 8.6.3-2 taking the above contents into account. However, MHTE, MEA and STELCO will
find difficulty to appoint the candidate instructor (trainer) for the technical transfer. Thus first of all
“Trainers’ Training” to develop the core of human resource development will be necessary.
Concerning the method of Trainers’ Training, Off-JT is effective, and it will be realistic to transfer
technology through periodically inviting external lecturers from overseas ministries, power companies
and PV system manufacturers and using actual equipment. Together with Off-JT, it will also be
necessary to adopt incentives (internal promotions, awards, etc.) to encourage self-development
among employees and provide necessary teaching materials, manuals and so on. Already the Study
Team has prepared and explained the contents of “Design Manual for Grid-connected Photovoltaic
System” in Attachment-6. Now Maldives side is expected to develop their own materials and manuals
in reference to the above-mentioned materials, taking into consideration of engineering and technical
capacity of their own organization.

8-32
Table 8.6.3-2 Contents of Technical Transfer Required in Future
Classification Contents Target
Types and features of PV systems MHTE, MEA, STELCO
Roles and operating principles of PV system component instruments MHTE, MEA, STELCO
Characteristics of PV panels (solar radiation, temperature and I-V characteristics)
MHTE, MEA, STELCO
Solar radiation data measurement and utilization methods MHTE, MEA, STELCO
Basic knowledge of PV systems
Economy of PV systems MHTE, MEA, STELCO
System installation site survey techniques MHTE, MEA, STELCO
PV module selection and array examination methods MHTE, MEA, STELCO
Installed capacity calculation and specifications examination methods MHTE, MEA, STELCO
Stand design techniques MHTE, MEA, STELCO
Generated electric energy potential estimation techniques MHTE, MEA, STELCO
Design of grid-connected
PV systems
Design software (HOMER, RET screen, etc.) utilization methods MHTE, MEA, STELCO
System functions and operating methods STELCO
System routine inspections and periodic inspections STELCO
System maintenance STELCO
Grid-connected PV system
operation and maintenance Troubleshooting STELCO
Legal regulations for introducing PV power generation MHTE, MEA
Legal systems for disseminating PV power generation MHTE, MEA
Requirements for grid-connection guidelines MHTE, MEA, STELCO
PV power generation economy examination techniques MHTE, MEA, STELCO
PV power generation-related
legal systems
Standard specifications of PV power generation equipment MHTE, MEA, STELCO
DSM promotion measures MHTE, MEA, STELCO
Energy saving promotion measures MHTE, MEA, STELCO DSM/Energy
saving SSM thinking MHTE, MEA, STELCO
Source : Prepared by the Study Team
8.6.4 Collaboration with Faculty of Engineering Technology (FET)
It is highly possible to collaborate with Faculty of Engineering Technology (FET) in Maldives for
human resource development on planning, designing and operation of grid-connected PV system. FET
holds approx. 400 students (of which nearly 80 students are from Electrical and Electronics
Engineering), and approx. 50 teachers including part-time staff. Also FET maintains necessary
equipment and materials for experiment in addition to holding lectures.

8-33
Figure 8.6.4- 1 Equipment for Practical Training at Faculty of Engineering Technology (FET)
Now FET is preparing to hold the new subject “Renewable Energy Systems and Maintenance” to
teach how to plan, design and maintain renewable energy systems including PV system. It is one of
the project components for Renewable Energy Technology Development and Application Project
(RETDAP) under the assistance by UNDP. UNDP plans to hold the course in order to raise the public
awareness utilizing the facilities and human resources in FET, since the application for Fund for RE
System Application (FRESA) under RETDAP is not growing as expected.
Table 8.6.4-1 shows the outline topic for the course. It is composed of both lecture and practice, and
students can obtain the certificate in one semester (15 weeks).
Table 8.6.4- 1 Outline Topic for the “Renewable Energy Systems and Maintenance” (Draft)
Topic Hours 1. Electrical Energy Sources
1.1 Scientific forms of Electrical Energy 1.1.1 What is Energy 1.1.2 Forms of Energy 1.1.3 Law of Conservation of Energy 1.1.4 Energy Efficiency 1.1.5 Sources of Energy
1.2 Non-Renewable Energy Sources 1.2.1 Oil 1.2.2 Natural Gas 1.2.3 Coal 1.2.4 Uranium
1.3 Renewable Energy Sources 1.3.1 Solar 1.3.2 Wind 1.3.3 Geothermal 1.3.4 Biomass 1.3.5 Hydropower
3
3
3
2. Design and Installation of Solar Power System 2.1 Basic Principles
2.1.1 Volts, Amps and Watts 2.1.2 Photovoltaic Effect 2.1.3 PV Modules 2.1.4 Energy Storage 2.1.5 Control and Conversation
3

8-34
2.1.6 Operation of Solar Stand Alone System 2.2 Suitability
2.2.1 Energy Requirement 2.2.2 Other Power Sources 2.2.3 Solar Resources
2.3 System Components 2.3.1 PV Modules 2.3.2 Batteries 2.3.3 Controllers 2.3.4 Inverters
2.4 Design Procedure 2.4.1 Design Process 2.4.2 Initial Estimates 2.4.3 Site Survey 2.4.4 System Sizing 2.4.5 Component Selection 2.4.6 Wiring
2.5 Installation and Commissioning 2.5.1 Safety 2.5.2 PV Array 2.5.3 Battery 2.5.4 Control Equipment 2.5.5 System Commissioning
2.6 Maintenance Field Visit (Trip to Faafu Magoodhoo and Noonu Randhoo)
3
3
3
3 3. Wind Power System
3.1 Introduction of Wind Energy 3.1.1 History of Wind Energy 3.1.2 Current status and Future prospects
3.2 Wind Power Generators 3.2.1 Tower 3.2.2 Rotor 3.2.3 Gear Box 3.2.4 Power Regulation 3.2.5 Safety Brakes 3.2.6 Induction Generator 3.2.7 Synchronous Generator 3.2.8 Fixed and Variable Speed Operation 3.2.9 Grid-interconnection
3
3
4. Inverters and Accessories 4.1 Charge Controllers and Batteries 4.2 Power Inverters 4.3 Hybrid and Interactive grid-interconnection Systems 4.4 Net-Metering
3
3
5. Protection and Safety 5.1 Lightning and Surge Protection
3
Source : Faculty of Engineering Technology (FET)
FET plans to accept various human resources for instructors even outside from FET for the
above-mentioned course. Furthermore, it is advised that some of the topic shall be instructed by
engineers from MHTE, MEA and STELCO to make the subject more practical. Also it is expected that
students from FET could learn the basic knowledge of renewable energy before they start working at
MHTE or STELCO. In the medium-term, more practical training course designed for engineers from
MHTE, MEA and STELCO (approx. 2 weeks duration) will be required as the continuous focal point
of Off-the-Job Training for the counterparts. Also, further collaboration with technical institutes in
third countries (such as India or Sri Lanka) to develop the curricula for renewable energy will be
considered as an option.


![Technical Feasibility [Version 1.0]FINAL](https://static.fdocuments.in/doc/165x107/61fb83b92e268c58cd5f1319/technical-feasibility-version-10final.jpg)