CHAPTER 4 ROLE OF CAPPING AGENTS IN...
27
66 CHAPTER 4 ROLE OF CAPPING AGENTS IN PROMOTING THE MORPHOLOGICAL, STRUCTURAL AND OPTICAL PROPERTIES OF CdS NANOSTRUCTURES 4.1 INTRODUCTION Extensive efforts have been devoted by theoreticians and experimentalists to control the parameters involved in morphological variations to develop defined structure with specified physical and chemical properties [176]. Cadmium sulfide is widely investigated, owing to its potential applications, such as, hydrogen production [177], solar cells [178] and photo catalysis [179], light - emitting diodes for flat - panel displays and other optical devices based on its nonlinear properties [180, 181]. It has been recently demonstrated that single CdS nanorod has excellent light - emitting quantum efficiency as a nanorod laser [182]. CdS nanostructures with different morphologies, such as, nanorods [183, 184], dendrites [185], spheres [186], sea - urchin - like shape [187] and nano whiskers [188] are reported. The surfactants play an essential role in controlling morphology of nanostructure because of their soft - template effect, their ability to modify the chemical kinetics and simple maneuverability. A few frequently used surfactants in the fabrication of CdS nanostructure are ethylenediamine [189], thio glycolic acid [190], Tween - 80 [191], polyvinylpyrrolidone [192]. Many other surfactants / capping agents, like sodium laurylsulfonate (SDS), peregals and sodium di(ethyl - 2 - hexyl)sulfosuccinate, have also been used as soft templates to synthesize CdS nanotubes [193], nanoshuttles [191] and triangular nanocrystals [194], respectively. Gao and co - workers
Transcript of CHAPTER 4 ROLE OF CAPPING AGENTS IN...

66
CHAPTER 4
ROLE OF CAPPING AGENTS IN PROMOTING THE
MORPHOLOGICAL, STRUCTURAL AND OPTICAL
PROPERTIES OF CdS NANOSTRUCTURES
4.1 INTRODUCTION
Extensive efforts have been devoted by theoreticians and experimentalists
to control the parameters involved in morphological variations to develop defined
structure with specified physical and chemical properties [176]. Cadmium sulfide is
widely investigated, owing to its potential applications, such as, hydrogen production
[177], solar cells [178] and photo catalysis [179], light - emitting diodes for
flat - panel displays and other optical devices based on its nonlinear properties
[180, 181]. It has been recently demonstrated that single CdS nanorod has excellent
light - emitting quantum efficiency as a nanorod laser [182]. CdS nanostructures with
different morphologies, such as, nanorods [183, 184], dendrites [185], spheres [186],
sea - urchin - like shape [187] and nano whiskers [188] are reported. The surfactants
play an essential role in controlling morphology of nanostructure because of their soft
- template effect, their ability to modify the chemical kinetics and simple
maneuverability. A few frequently used surfactants in the fabrication of CdS
nanostructure are ethylenediamine [189], thio glycolic acid [190], Tween - 80 [191],
polyvinylpyrrolidone [192]. Many other surfactants / capping agents, like sodium
laurylsulfonate (SDS), peregals and sodium di(ethyl - 2 - hexyl)sulfosuccinate, have
also been used as soft templates to synthesize CdS nanotubes [193], nanoshuttles
[191] and triangular nanocrystals [194], respectively. Gao and co - workers

67
synthesized 3D CdS nanocrystals using hexamethylene tetramine [195] as capping
agent.
The growth of a nanostructure is due to two processes namely Ostwald
ripening and oriented attachment (OA). OA mechanism comprises of the direct self
organization of two particles into a single crystal by sharing a common
crystallographic orientation [196]. This process is dominant at nanometre level. It is
reported that the capping agents, as they directly modify the nanoparticle surface can
largely influence the OA processes. The molecular weight of the capping ligand also
makes a remarkable contribution in the assembly behaviors of the nanoparticles
[197 - 199]. In bottom - up methodologies, self assemblies of nanoparticles in ordered
structures is governed by the balance of forces due to van der waals interaction,
capillary interaction, surface tension and hydrophobic interaction and H - bonding
effect [200 - 203]. Exploiting these mechanisms using appropriate capping agents is
an interesting and challenging aspect in the synthesis of nanostructure.
Synthetic approaches to fabricate CdS nanostructures include thermal
evaporation, chemical vapour deposition, solvothermal / hydrothermal processes
[204 - 207]. Among them hydrothermal / solvothermal process is preferred as it
efficiently yields CdS nanostructures with different morphologies. In this method, the
synthesis is carried out at elevated temperatures and pressures. At this elevated
temperatures, the solubility of inorganic substance is made possible. Hence, in these
processes the properties of the reactants like solubility and reactivity is altered to
produce new high - quality nanostructures, which is not possible at low temperatures.
If instead of water any other solvent (polar and non polar) is used, the process is
called solvothermal process. Solvothermal synthesis utilizes a solvent at high
temperatures above the critical point to increase the solubility of the solid and to
speed up the reaction between solids. The solvent through its physico – chemical
properties modify the reaction mechanisms. Generally, hydrothermal methods involve
longer reaction times [208]. The disadvantage of this process is that size and shape are
difficult to control as they undergo rapid nucleation and growth. Lowering the
reaction temperature and time can have a significant effect on the growth processes.
68
Here, an attempt has been made to synthesis CdS nanostructures at low hydrothermal
temperatures for short reaction times.
In this chapter, various CdS nanostructures were synthesized using
capping agents by hydrothermal / solvothermal methods at 120 C for a reaction time
of one hour. The capping agents employed are: CTAB, piperazine, PVP and triton X.
The role of these capping agents in mediating OA mechanism was investigated. In
addition, optical and structural properties were also investigated.
4.2 SYNTHESIS AND CHARACTERIZATION OF CdS STRUCTURES
USING CETYL TRIMETHYLAMMONIUM BROMIDE (CTAB)
AS CAPPING AGENT.
4.2.1 Structure of cetyl trimethylammonium bromide (CTAB)
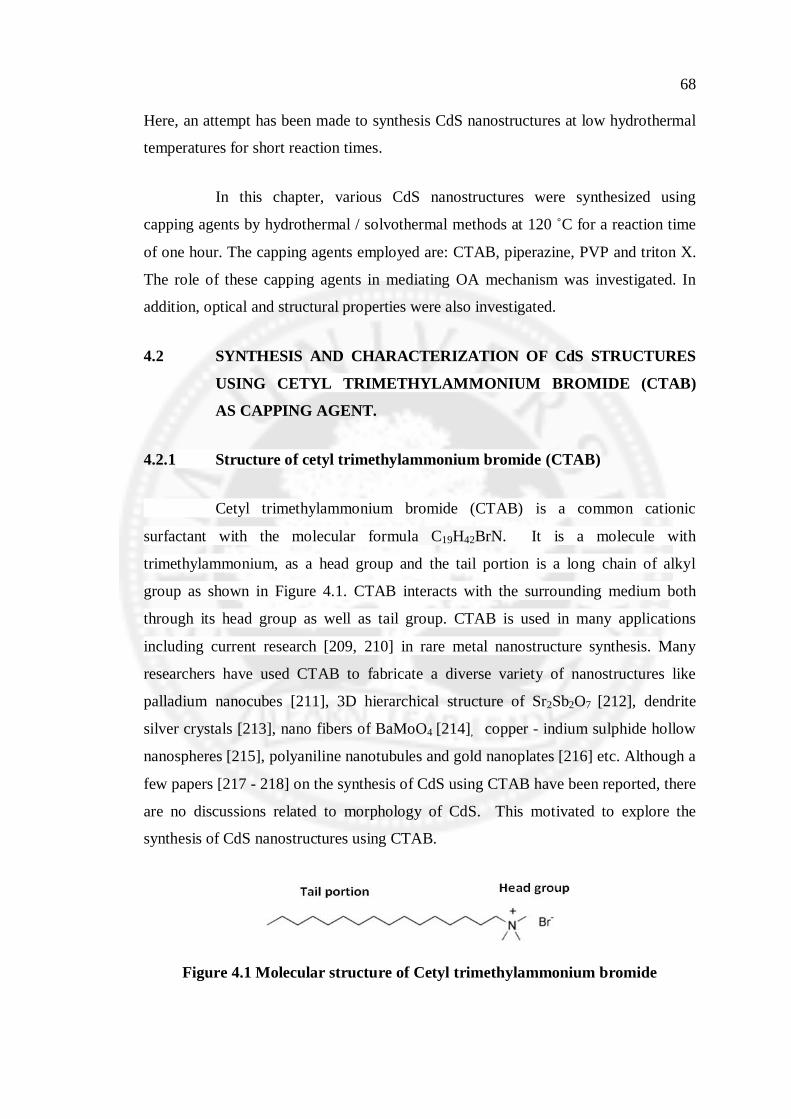
Cetyl trimethylammonium bromide (CTAB) is a common cationic
surfactant with the molecular formula C19H42BrN. It is a molecule with
trimethylammonium, as a head group and the tail portion is a long chain of alkyl
group as shown in Figure 4.1. CTAB interacts with the surrounding medium both
through its head group as well as tail group. CTAB is used in many applications
including current research [209, 210] in rare metal nanostructure synthesis. Many
researchers have used CTAB to fabricate a diverse variety of nanostructures like
palladium nanocubes [211], 3D hierarchical structure of Sr2Sb2O7 [212], dendrite
silver crystals [213], nano fibers of BaMoO4 [214], copper - indium sulphide hollow
nanospheres [215], polyaniline nanotubules and gold nanoplates [216] etc. Although a
few papers [217 - 218] on the synthesis of CdS using CTAB have been reported, there
are no discussions related to morphology of CdS. This motivated to explore the
synthesis of CdS nanostructures using CTAB.
Figure 4.1 Molecular structure of Cetyl trimethylammonium bromide

69
4.2.2 Synthesis
The chemicals used were of analytical grade and were used without any
further purification. Pure CdS sample was prepared as follows: 0.5 M of cadmium
nitrate [Cd (NO3)2] was added to the beaker containing 25 ml of ethanol under
vigorous stirring to obtain cadmium solution. To the above prepared cadmium
solution, 0.5 M of thioacetamide (CH3CSH2) was added to obtain pure CdS sample.
Thus, obtained final mixture was placed in the autoclave and maintained at 120 C for
an hour. Simultaneously, in another beaker, the same ratio of cadmium nitrate and
thioacetamide was added to 25 ml of ethanol, in the presence of 0.025 M of CTAB, to
prepare CTAB capped CdS sample. The above solution was mixed thoroughly and
was placed in the autoclave and maintained at 120 C (15 pounds per square inch) for
an hour. After the stipulated time, the autoclave was allowed to cool to room
temperature. In both the cases, the formation of yellow color indicated the formation
of CdS. The samples were taken out from the autoclave and were washed several
times with deionised water. These samples were dried and stored in for further
characterization.
4.2.3 Results and Disscussions
4.2.3.1 Morphology and Structural studies of the CdS nanostructures
Figure 4.2 (a) and (b) shows typical SEM images of the pure CdS sample
by solvothermal reaction of thioacteamide and cadmium nitrate, incubated at 120 C
for one hour. It clearly shows that CdS microcrystals consist of numerous spherical
hierarchical architectures. This complex hierarchical architecture have a diameter
ranging from less than 500 nm to 5 m and are of uniform morphology. Closer
observation [Figure 4.2 (b)] of the hierarchical architecture indicate that each is
composed many curved nanosheets of thickness of few tens of nanometre. These
nanosheets are arranged vertically in a crisscrossed manner with a gap between 100
and 200 nm, to form a compact sphere. Further information of these CdS architectures
is derived from the TEM and HRTEM images in Figure 4.3 (a) and (b). These images
show that the nanosheets are composed of large number of nanoparticles. The
HRTEM image shows that the size of individual nanoparticle is about 15 nm, which
70
coalesces with the adjacent nanoparticle to share a common crystallographic
orientation. Hence, the formation of spherical hierarchical architecture is an outcome
of oriented attachment of individual CdS nanoparticle at solvothermal conditions
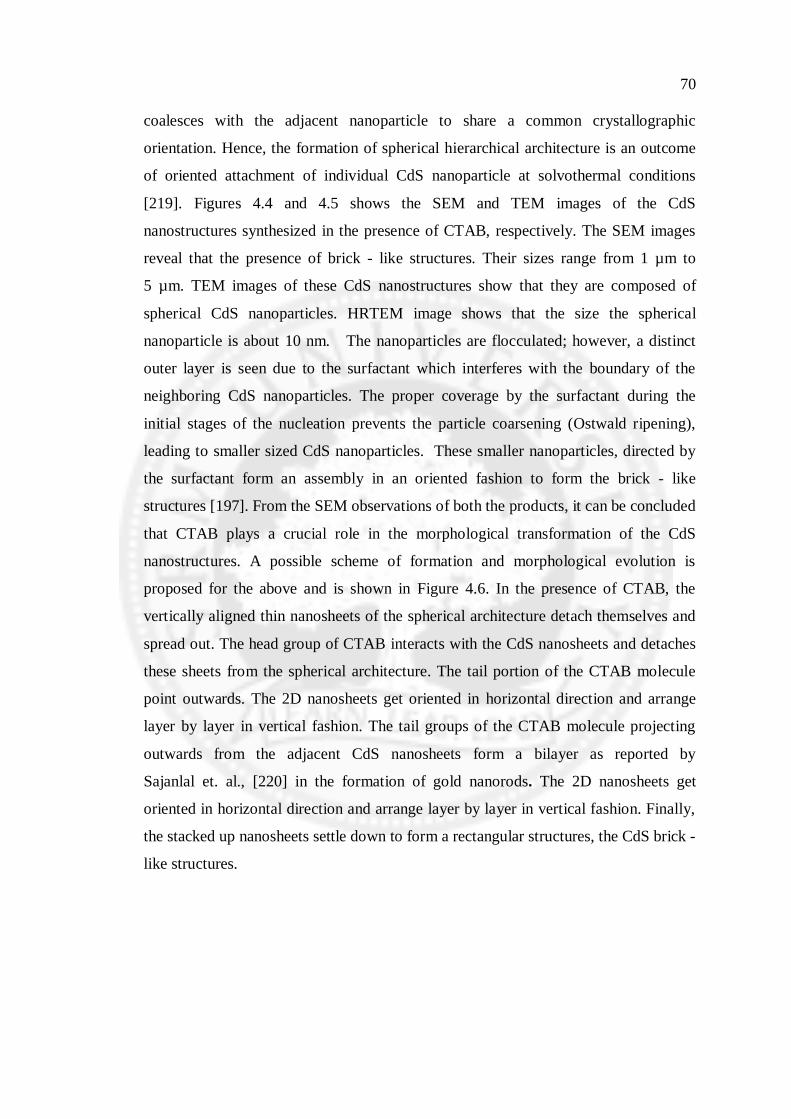
[219]. Figures 4.4 and 4.5 shows the SEM and TEM images of the CdS
nanostructures synthesized in the presence of CTAB, respectively. The SEM images
reveal that the presence of brick - like structures. Their sizes range from 1 µm to
5 µm. TEM images of these CdS nanostructures show that they are composed of
spherical CdS nanoparticles. HRTEM image shows that the size the spherical
nanoparticle is about 10 nm. The nanoparticles are flocculated; however, a distinct
outer layer is seen due to the surfactant which interferes with the boundary of the
neighboring CdS nanoparticles. The proper coverage by the surfactant during the
initial stages of the nucleation prevents the particle coarsening (Ostwald ripening),
leading to smaller sized CdS nanoparticles. These smaller nanoparticles, directed by
the surfactant form an assembly in an oriented fashion to form the brick - like
structures [197]. From the SEM observations of both the products, it can be concluded
that CTAB plays a crucial role in the morphological transformation of the CdS
nanostructures. A possible scheme of formation and morphological evolution is
proposed for the above and is shown in Figure 4.6. In the presence of CTAB, the
vertically aligned thin nanosheets of the spherical architecture detach themselves and
spread out. The head group of CTAB interacts with the CdS nanosheets and detaches
these sheets from the spherical architecture. The tail portion of the CTAB molecule
point outwards. The 2D nanosheets get oriented in horizontal direction and arrange
layer by layer in vertical fashion. The tail groups of the CTAB molecule projecting
outwards from the adjacent CdS nanosheets form a bilayer as reported by
Sajanlal et. al., [220] in the formation of gold nanorods. The 2D nanosheets get
oriented in horizontal direction and arrange layer by layer in vertical fashion. Finally,
the stacked up nanosheets settle down to form a rectangular structures, the CdS brick -
like structures.

71
Figure 4.2 SEM images of pure CdS sample.
Figure 4.3 (a) TEM and (b) HRTEM images of pure CdS sample
Figure 4.4 SEM images of CTAB capped CdS sample

72
.
Figure 4.5 (a) TEM and (b) HRTEM images of CTAB capped CdS sample
Figure 4.6 Scheme of the formation of brick - like CdS nanostructures.
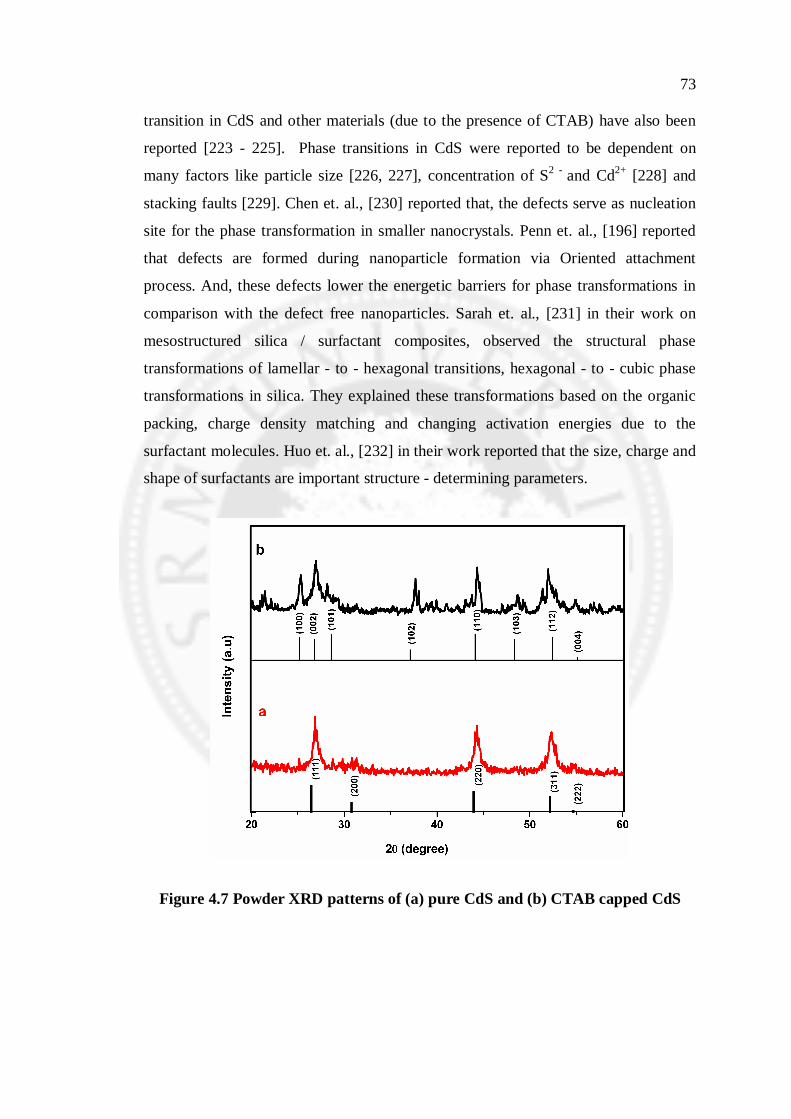
The XRD patterns of the pure CdS and CTAB capped CdS are displayed
in Figure 4.7 (a) and (b), respectively. All the major diffraction peaks (1 1 1),
(2 0 0), (2 2 0) and (3 1 1) of the pure CdS (spherical hierarchical architecture) are
indexed to cubic phase of CdS and are in consistent with the JCPDS Code 10 - 0454.
No impurity peaks were detected indicating the formation of pure CdS sample. The
XRD diffraction pattern of the CTAB capped CdS (brick - like CdS nanostructures)
does not match with that of the pure CdS. The major diffraction peaks of the CTAB
capped CdS originated from a different set of planes i.e, (1 0 0), (0 0 2), (1 0 1),
(1 0 2), (1 1 0), (1 0 3) and (1 1 2). These diffraction peaks matched well with the
standard JCPDS Code 01 - 0783, corresponding to hexagonal phase of CdS. The
occurrence of a peak at 2 = 21 is attributed to the presence of CTAB in the sample
by Yang et. al.,[221]. The comparison of the two XRD patterns indicates that a
structural phase transformation has taken place from the cubic phase to hexagonal of
CdS in the presence of CTAB. This phase transformation is attributed to the
intercalation of CTAB into the crystal structure of CdS [222]. Reports on phase
73
transition in CdS and other materials (due to the presence of CTAB) have also been
reported [223 - 225]. Phase transitions in CdS were reported to be dependent on
many factors like particle size [226, 227], concentration of S2 - and Cd2+ [228] and
stacking faults [229]. Chen et. al., [230] reported that, the defects serve as nucleation
site for the phase transformation in smaller nanocrystals. Penn et. al., [196] reported
that defects are formed during nanoparticle formation via Oriented attachment
process. And, these defects lower the energetic barriers for phase transformations in
comparison with the defect free nanoparticles. Sarah et. al., [231] in their work on
mesostructured silica / surfactant composites, observed the structural phase
transformations of lamellar - to - hexagonal transitions, hexagonal - to - cubic phase
transformations in silica. They explained these transformations based on the organic
packing, charge density matching and changing activation energies due to the
surfactant molecules. Huo et. al., [232] in their work reported that the size, charge and
shape of surfactants are important structure - determining parameters.
Figure 4.7 Powder XRD patterns of (a) pure CdS and (b) CTAB capped CdS

74
4.2.3.2 UV - Vis Absorption Studies
The absorption spectra of CdS products synthesized in the absence and
presence of CTAB are shown in Figure 4.8. The wavelength of the absorption edge is
indicated by an arrow. The absorption edge of the CdS nanoparticles synthesized in
the absence and presence of CTAB is 400 nm and 386 nm respectively. This blue shift
is attributed to the relatively smaller size of the capped CdS nanoparticles as observed
in HRTEM. CTAB capping on the surface of the nanoparticle restricts the growth of
the nanoparticles which results in quantum confinement.
Figure 4.8 UV - Vis absorption Spectra of (a) pure CdS and (b) CTAB capped
CdS samples
4.2.3.3 Photoluminescence Studies
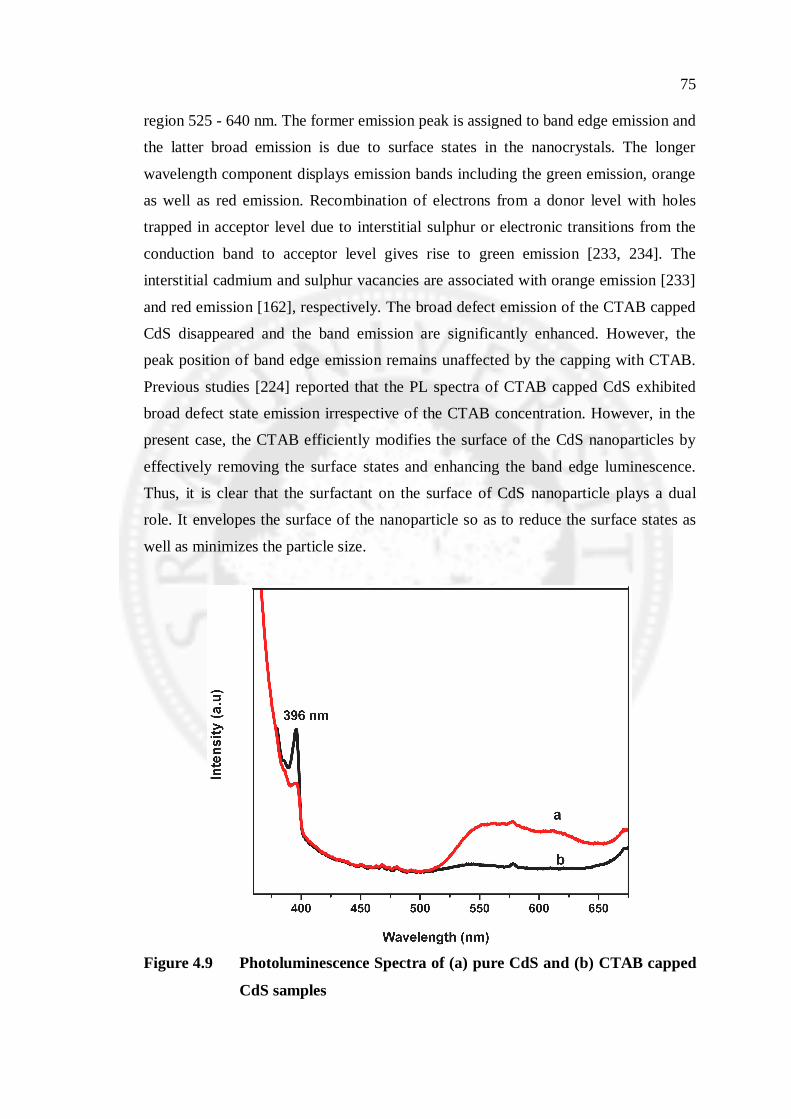
Figure 4.9 shows the photoluminescence spectra of the pure CdS and
CTAB capped CdS samples. The spectra revealed the effect of CTAB capping on the
band edge emission and the defect state emission of the CdS nanocrystallites. The
uncapped CdS shows a narrow emission at 396 nm and a broad band emission in the
75
region 525 - 640 nm. The former emission peak is assigned to band edge emission and
the latter broad emission is due to surface states in the nanocrystals. The longer
wavelength component displays emission bands including the green emission, orange
as well as red emission. Recombination of electrons from a donor level with holes
trapped in acceptor level due to interstitial sulphur or electronic transitions from the
conduction band to acceptor level gives rise to green emission [233, 234]. The
interstitial cadmium and sulphur vacancies are associated with orange emission [233]
and red emission [162], respectively. The broad defect emission of the CTAB capped
CdS disappeared and the band emission are significantly enhanced. However, the
peak position of band edge emission remains unaffected by the capping with CTAB.
Previous studies [224] reported that the PL spectra of CTAB capped CdS exhibited
broad defect state emission irrespective of the CTAB concentration. However, in the
present case, the CTAB efficiently modifies the surface of the CdS nanoparticles by
effectively removing the surface states and enhancing the band edge luminescence.
Thus, it is clear that the surfactant on the surface of CdS nanoparticle plays a dual
role. It envelopes the surface of the nanoparticle so as to reduce the surface states as
well as minimizes the particle size.
Figure 4.9 Photoluminescence Spectra of (a) pure CdS and (b) CTAB capped
CdS samples
76
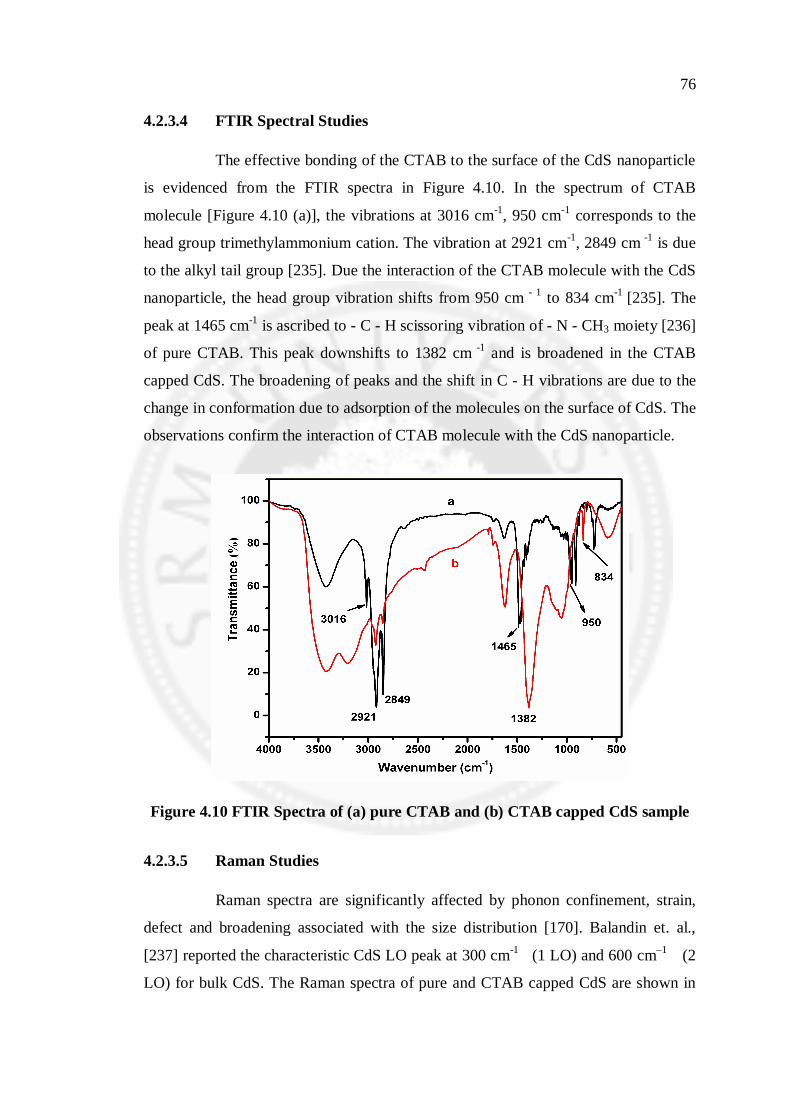
4.2.3.4 FTIR Spectral Studies
The effective bonding of the CTAB to the surface of the CdS nanoparticle
is evidenced from the FTIR spectra in Figure 4.10. In the spectrum of CTAB
molecule [Figure 4.10 (a)], the vibrations at 3016 cm-1, 950 cm-1 corresponds to the
head group trimethylammonium cation. The vibration at 2921 cm-1, 2849 cm -1 is due
to the alkyl tail group [235]. Due the interaction of the CTAB molecule with the CdS
nanoparticle, the head group vibration shifts from 950 cm - 1 to 834 cm-1 [235]. The
peak at 1465 cm-1 is ascribed to - C - H scissoring vibration of - N - CH3 moiety [236]
of pure CTAB. This peak downshifts to 1382 cm -1 and is broadened in the CTAB
capped CdS. The broadening of peaks and the shift in C - H vibrations are due to the
change in conformation due to adsorption of the molecules on the surface of CdS. The
observations confirm the interaction of CTAB molecule with the CdS nanoparticle.
Figure 4.10 FTIR Spectra of (a) pure CTAB and (b) CTAB capped CdS sample
4.2.3.5 Raman Studies
Raman spectra are significantly affected by phonon confinement, strain,
defect and broadening associated with the size distribution [170]. Balandin et. al.,
[237] reported the characteristic CdS LO peak at 300 cm-1 (1 LO) and 600 cm–1 (2
LO) for bulk CdS. The Raman spectra of pure and CTAB capped CdS are shown in

77
Figure 4.11. Two characteristic CdS longitudinal optical (LO) phonon peaks are
clearly visible. The uncapped CdS exhibits 1 LO and 2 LO peaks at 297.9 cm-1 and
598 cm-1 respectively. The CTAB capped CdS shows the 1 LO and 2 LO peak at
298.5 cm-1 and 598 cm-1, respectively. Capping of CTAB on CdS results in the shift
in 1 LO. The shift in the LO peak position of the CdS nanoparticles with respect to the
bulk CdS is due to phonon confinement and strain effect.
Figure 4.11 Raman Spectra of (a) pure CdS and (b) CTAB capped CdS samples
4.3 SYNTHESIS AND CHARACTERIZATION OF CdS STRUCTURES
USING PIPERAZINE, PVP, TRITON X
In this section, three capping agents were used to synthesize CdS
nanostructure, namely piperazine, PVP and triton X.
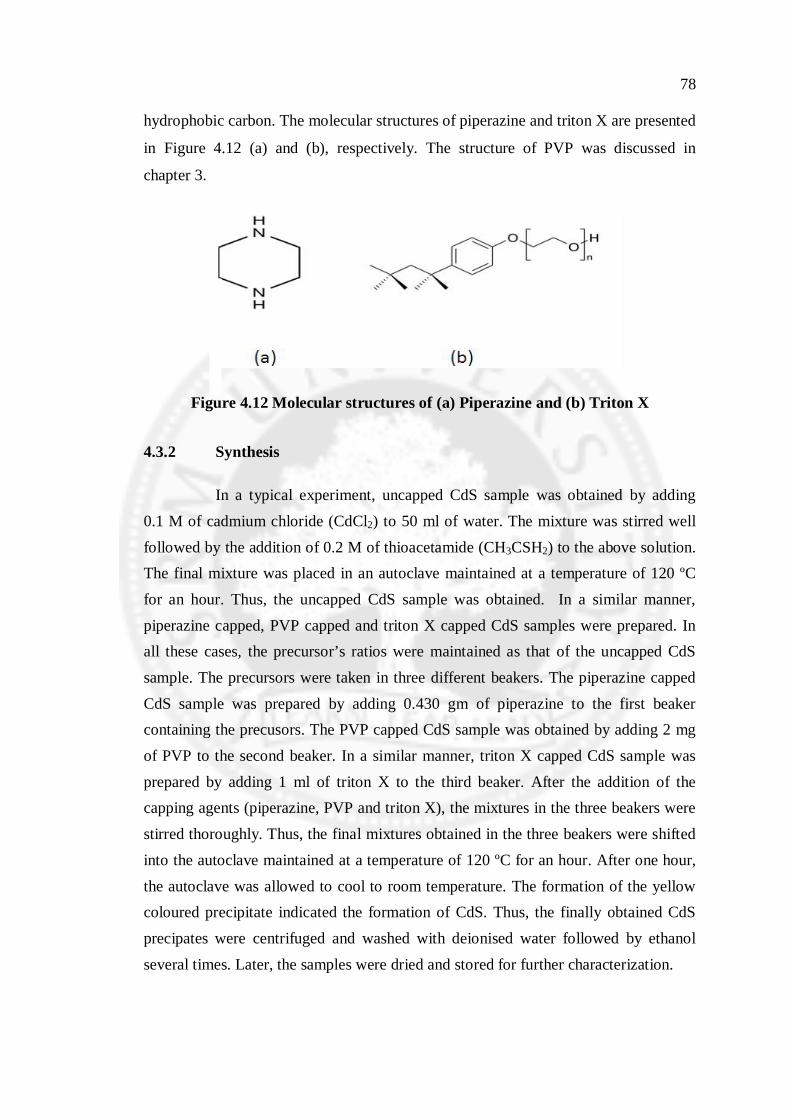
4.3.1 Structure of Piperazine and Triton X
Piperazine is an organic compound that consists of a six - membered ring
containing two nitrogen atoms at opposite positions in the ring with the molecular
formula C4H10N2. Triton X - 100 [C14H22O (C2H4O) n] is a nonionic surfactant which
has a hydrophilic polyethylene oxide and an aromatic hydrocarbon lipophilic or
78
hydrophobic carbon. The molecular structures of piperazine and triton X are presented
in Figure 4.12 (a) and (b), respectively. The structure of PVP was discussed in
chapter 3.
Figure 4.12 Molecular structures of (a) Piperazine and (b) Triton X
4.3.2 Synthesis
In a typical experiment, uncapped CdS sample was obtained by adding 0.1 M of cadmium chloride (CdCl2) to 50 ml of water. The mixture was stirred well followed by the addition of 0.2 M of thioacetamide (CH3CSH2) to the above solution. The final mixture was placed in an autoclave maintained at a temperature of 120 ºC for an hour. Thus, the uncapped CdS sample was obtained. In a similar manner, piperazine capped, PVP capped and triton X capped CdS samples were prepared. In all these cases, the precursor’s ratios were maintained as that of the uncapped CdS sample. The precursors were taken in three different beakers. The piperazine capped CdS sample was prepared by adding 0.430 gm of piperazine to the first beaker containing the precusors. The PVP capped CdS sample was obtained by adding 2 mg of PVP to the second beaker. In a similar manner, triton X capped CdS sample was prepared by adding 1 ml of triton X to the third beaker. After the addition of the capping agents (piperazine, PVP and triton X), the mixtures in the three beakers were stirred thoroughly. Thus, the final mixtures obtained in the three beakers were shifted into the autoclave maintained at a temperature of 120 ºC for an hour. After one hour, the autoclave was allowed to cool to room temperature. The formation of the yellow coloured precipitate indicated the formation of CdS. Thus, the finally obtained CdS precipates were centrifuged and washed with deionised water followed by ethanol several times. Later, the samples were dried and stored for further characterization.

79
4.3.3 Results and Discussion
4.3.3.1 Morphological Studies
The SEM and TEM analysis were performed to justify the role of the
capping agents in stimulating morphological changes in cadmium sulphide
nanostructures. It is observed that the synthesized CdS nanostructures exhibited
different morphologies in the presence of each of the capping agent.
Uncapped CdS sample
The SEM and TEM images of the uncapped CdS sample are shown in
Figure 4.13 (a) and (b), respectively. The SEM image of the uncapped CdS sample i.e
pure CdS sample displayed a rock - like structure with a rough surface and lot of
striations (uneven surfaces). No distinct morphology was observed for the uncapped
CdS sample. From the TEM image, it is observed the uncapped sample consists of
large sized CdS nanoparticles of size greater than 20 nm.
Figure 4.13 (a) SEM and (b) TEM images uncapped CdS sample
80
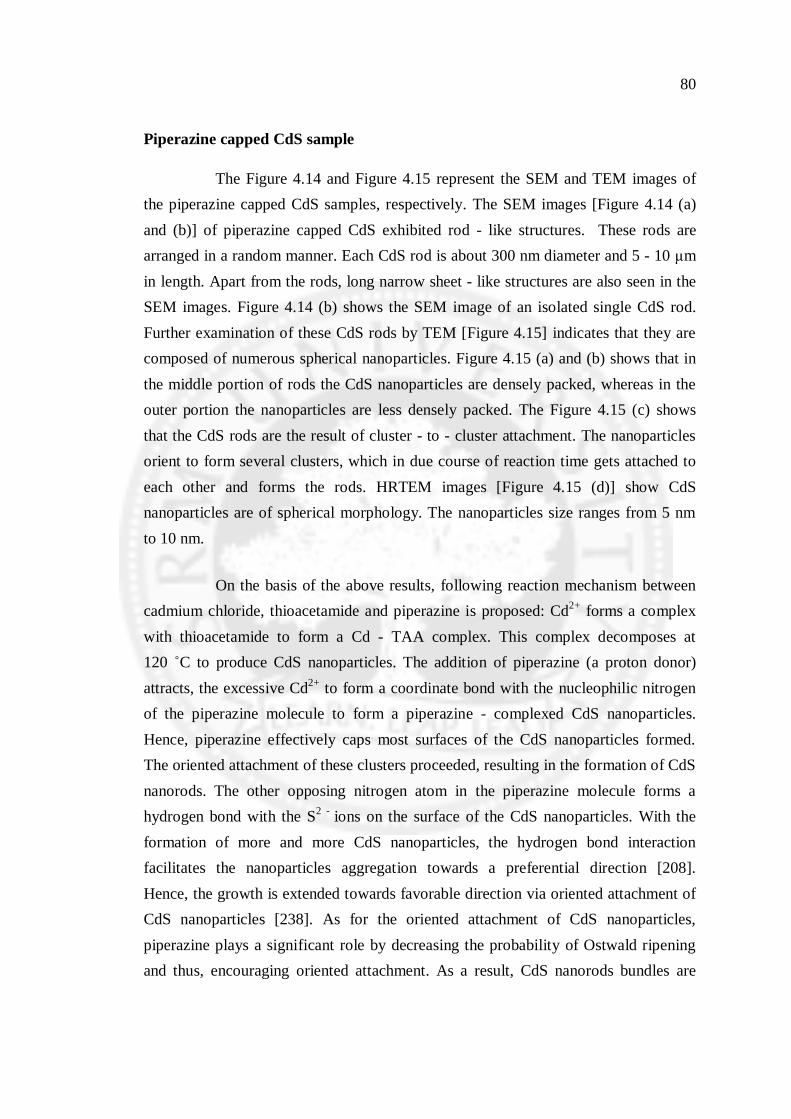
Piperazine capped CdS sample
The Figure 4.14 and Figure 4.15 represent the SEM and TEM images of the piperazine capped CdS samples, respectively. The SEM images [Figure 4.14 (a) and (b)] of piperazine capped CdS exhibited rod - like structures. These rods are arranged in a random manner. Each CdS rod is about 300 nm diameter and 5 - 10 m in length. Apart from the rods, long narrow sheet - like structures are also seen in the SEM images. Figure 4.14 (b) shows the SEM image of an isolated single CdS rod. Further examination of these CdS rods by TEM [Figure 4.15] indicates that they are composed of numerous spherical nanoparticles. Figure 4.15 (a) and (b) shows that in the middle portion of rods the CdS nanoparticles are densely packed, whereas in the outer portion the nanoparticles are less densely packed. The Figure 4.15 (c) shows that the CdS rods are the result of cluster - to - cluster attachment. The nanoparticles orient to form several clusters, which in due course of reaction time gets attached to each other and forms the rods. HRTEM images [Figure 4.15 (d)] show CdS nanoparticles are of spherical morphology. The nanoparticles size ranges from 5 nm to 10 nm.
On the basis of the above results, following reaction mechanism between cadmium chloride, thioacetamide and piperazine is proposed: Cd2+ forms a complex with thioacetamide to form a Cd - TAA complex. This complex decomposes at 120 C to produce CdS nanoparticles. The addition of piperazine (a proton donor) attracts, the excessive Cd2+ to form a coordinate bond with the nucleophilic nitrogen of the piperazine molecule to form a piperazine - complexed CdS nanoparticles. Hence, piperazine effectively caps most surfaces of the CdS nanoparticles formed. The oriented attachment of these clusters proceeded, resulting in the formation of CdS nanorods. The other opposing nitrogen atom in the piperazine molecule forms a hydrogen bond with the S2 - ions on the surface of the CdS nanoparticles. With the formation of more and more CdS nanoparticles, the hydrogen bond interaction facilitates the nanoparticles aggregation towards a preferential direction [208]. Hence, the growth is extended towards favorable direction via oriented attachment of CdS nanoparticles [238]. As for the oriented attachment of CdS nanoparticles, piperazine plays a significant role by decreasing the probability of Ostwald ripening and thus, encouraging oriented attachment. As a result, CdS nanorods bundles are

81
obtained. The schematic description of the formation of the growth process of CdS nanorods are shown in Figure 4.16.
Figure 4.14 (a),(b) SEM images piperazine capped CdS sample.
Figure 4.15 (a) and (b) TEM image (c) Attachment of nanoparticle clusters
(d) HRTEM image of piperazine capped CdS sample

82
Figure 4.16 Schematic representation of the formation of Piperazine capped
CdS rods
PVP capped CdS sample
The SEM images of the PVP capped CdS sample [Figure 4.17] is
composed of short CdS rods of length around 2 µm, breadth 200 nm and thickness
100 nm. The surfaces of the CdS rods are smooth. The rods possess well defined
edges and are dispersed. TEM and HRTEM images of the PVP capped CdS sample
are presented in Figure 4.18 (a) - (c) for different magnifications. The TEM images of
the rods are composed of numerous CdS nanoparticles. HRTEM images in Figure
4.18 (b) display spherical as well as non - spherical nanoparticles. The spherical
nanoparticles are called the primary particles, while the non - spherical ones are the
secondary nanoparticles. The secondary nanoparticles grow at the expense of the
primary nanoparticles (Ostwald ripening). Figure 4.18 (b) shows that several CdS
nanoparticles attach to each other under hydrothermal conditions, to share a common
crystallographic orientation in the process of rod formation via oriented attachment
[239]. The region of attachment of the CdS nanoparticles is indicated by arrows. A
closer view of the HRTEM images [Figure 4.18 (c)] shows the formation of a layer
due to PVP around the CdS nanoparticle. This layer which forms the boundary
facilitates the attachment to the adjacent ones in the rod formation. A possible scheme
of formation of the PVP capped CdS nanorods have been proposed in Figure 4.19.

83
Figure 4.17. SEM image of PVP capped CdS sample
Figure 4.18 (a) TEM image, (b) and (c) HRTEM images of PVP capped CdS
sample
Figure 4.19 Schematic representation of the formation of PVP capped CdS
rods
84
Triton X capped CdS sample
Figure 4.20 shows the SEM image of Triton X capped sample. It consists
of large CdS clusters of about one micrometre in diameter. This is formed from the
attachment of smaller clusters. The surface of the cluster appears rough. TEM and
HRTEM images of the triton X capped CdS sample are shown in Figure 4.21 (a) and
(b), respectively. The TEM image indicates that CdS clusters are composed of several
closely assembled CdS nanoparticles. From HRTEM images of the CdS clusters it is
found that spherical CdS nanoparticles are of uniform size and shape. The
nanoparticles are intact and spherical shape of the nanoparticles is maintained
throughout the sample. The viscous nature of triton X leads to coagulation of the
nanoparticles in the sample and hence inhibits anisotropic growth. A possible scheme
of formation of the nanostructures has been proposed in Figure 4.22.
From the above discussion, it is observed that two types of nanostructure,
namely rods and clusters are formed due to the capping of CdS with piperazine, PVP
and triton X, respectively. In rod formation, several CdS nanoparticles form
aggregates on capping with PVP / piperazine. As the growth proceeds, Ostwald
ripening process occurs and as a result, the smaller ones are dissolved. The larger
nanoparticles formed get oriented and attached along a particular direction to form
rods. The capping molecules piperazine and PVP on the surface direct the
organization process of the nanoparticles [240, 241]. Piperazine capped CdS rods
show dense layer of particles arrangement which is attributed to the bifunctional
nature of piperazine molecules, which allows a dative bond formation as well as
hydrogen bond formation. The PVP polymer layer formed on the CdS nanoparticle
surface allows diffusion. Both piperazine and PVP encouraged the directional growth
thus leading to the formation of nanorods. However, in the case of triton X capping
Ostwald ripening effects are not observed.

85
Figure 4.20 SEM images for Triton X capped CdS sample
Figure 4.21 (a) TEM image and (b) HRTEM images of Triton X capped CdS
sample
This might be due to the better protection provided by the Triton X and is
also due the interweaving of chain between the adjacent (capping) molecules. Hence,
CdS nanoparticles are assembled without any preferential growth. Similar
observations were reported by He et .al., [242]. This differential growth mechanism of
the CdS structures can be ascribed to the nature of the capping agents. This influences
the final morphology and the nature of the surface of these nanostructures.

86
Figure 4.22 Schematic representation of the formation of CdS clusters.
4.3.3.2 Structural Studies
The XRD patterns of the uncapped, PVP, Triton X and piperazine capped
CdS samples are presented in Figure 4.23 (a) to (d), respectively. The XRD patterns
of the uncapped CdS, PVP capped CdS and the Triton X capped CdS samples are all
alike. The major peaks originate from the planes (1 1 1), (2 0 0), (2 2 0) and (3 1 1)
are located at 26.5 , 30.6 , 43.9 and 52.0 respectively. These reflections are indexed
to the cubic phase of CdS with lattice constants of a = 5.820 Å and are in agreement
with the standard JCPDS data 75 - 1546. For the piperazine capped CdS samples, the
major reflection peaks are from a different set of planes (1 0 0), (0 0 2), (101),
(1 0 2), (1 1 0), (1 0 3) and (1 1 2). These major XRD peaks are indexed to the
hexagonal phase with lattice constants, a = 4.141 Å and c = 6.718 Å, which are in
good agreement with the literature data (JCPDS Card no. 41 - 1049). The diffraction
peaks of the piperazine capped CdS [Figure 4.19 (d)] are noticeably sharper for the
l = 0 reflections. This suggests that crystallographic ordering of the nanoparticles
within the nanorods is most pronounced parallel to the c - axis. Moreover, PVP and
triton X capping does not induce any structural phase transition with respect to the
uncapped CdS. But, piperazine significantly influenced the structure of CdS,
transforming it to hexagonal phase.

87
Figure 4.23 Powder XRD patterns of (a) PVP capped, (b) Triton X capped,
(c) uncapped and (d) Piperazine capped CdS samples
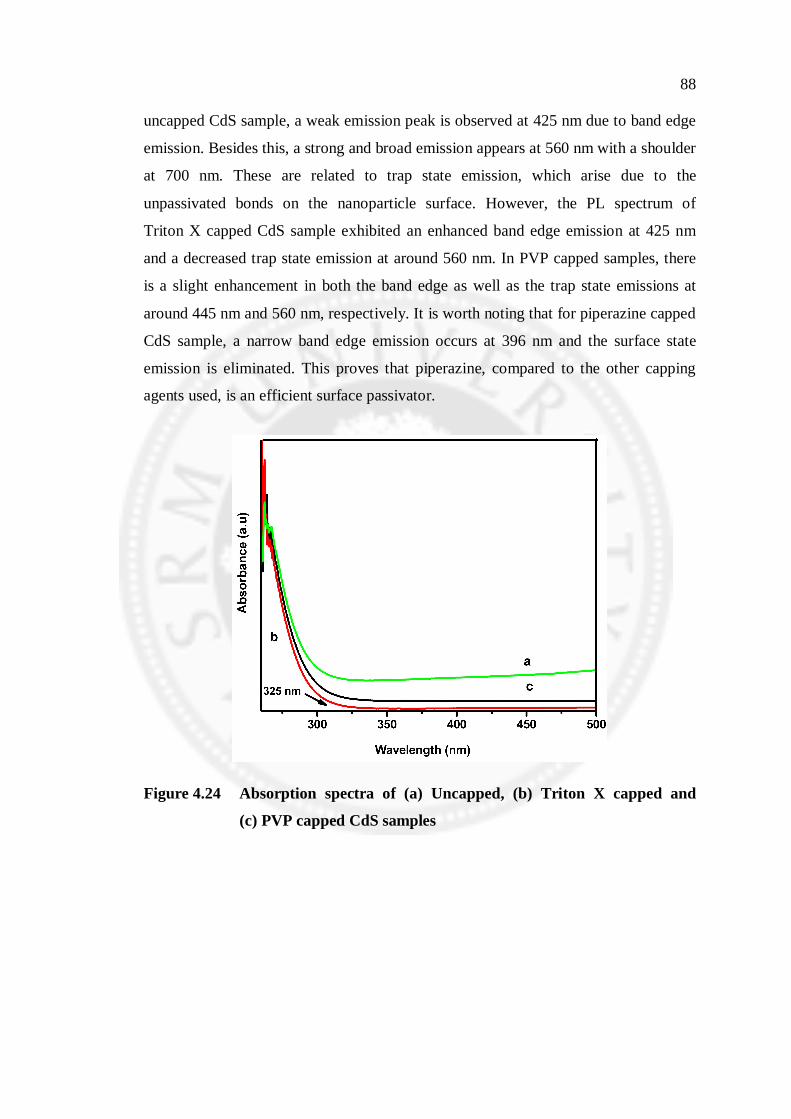
4.3.3.3 Absorption and Emission Studies
Absorption and emission spectral profiles of the uncapped and the capped
CdS samples are shown in Figure 4.24 - 4.26. Figure 4.24 shows the absorption
profiles of the uncapped, PVP capped and Triton X capped CdS samples, with their
absorption edges around 325 nm. The absorption edge corresponding to piperazine
capped CdS in Figure 4.26 is at 390 nm. All the observed absorption edges are blue
shifted with respect to the bulk CdS [243]. Figure 4.25 and 4.26 (b)
shows the PL spectra of the samples at room temperature for the uncapped, PVP
capped, triton X capped (excitation wavelength 325 nm) and piperazine capped
(excitation wavelength 350 nm) CdS samples, respectively. The emission peaks vary
significantly for all the four samples. This indicates that the capping agents, PVP,
Triton X and Piperazine play an important role in passivation of the dangling bonds
on the nanoparticle surface and greatly influence the optical properties. For the
88
uncapped CdS sample, a weak emission peak is observed at 425 nm due to band edge
emission. Besides this, a strong and broad emission appears at 560 nm with a shoulder
at 700 nm. These are related to trap state emission, which arise due to the
unpassivated bonds on the nanoparticle surface. However, the PL spectrum of
Triton X capped CdS sample exhibited an enhanced band edge emission at 425 nm
and a decreased trap state emission at around 560 nm. In PVP capped samples, there
is a slight enhancement in both the band edge as well as the trap state emissions at
around 445 nm and 560 nm, respectively. It is worth noting that for piperazine capped
CdS sample, a narrow band edge emission occurs at 396 nm and the surface state
emission is eliminated. This proves that piperazine, compared to the other capping
agents used, is an efficient surface passivator.
Figure 4.24 Absorption spectra of (a) Uncapped, (b) Triton X capped and
(c) PVP capped CdS samples

89
Figure 4.25 Emission Spectra of (a) Uncapped, (b) Triton X capped and
(c) PVP capped CdS samples
Figure 4.26 (a) Absorption and (b) Emission spectra of Piperazine capped CdS
sample
90
4.3.3.4 FTIR Studies
The FTIR spectra of PVP, triton X and piperazine capped CdS are shown in Figure 4.27 (a) - (c). Tu et. al., [244] observed the C = O band peak for pure PVP at 1663 cm - 1. The most convincing fact of the spectra of PVP capped CdS sample [Figure 4.27 (a)] is that the absorption peaks at 1288 cm -1 and 1623 cm-1 corresponds to C - N and C = O of PVP monomer [245 - 247] respectively. The peak shift of C = O absorption band reveals the strong interaction between Cd and PVP. The bands at 2928 cm -1 and 2950 cm-1 correspond to CH2 stretch modes of pyrrolidone ring, the polymer backbone and the tertiary C - H stretch of PVP [147], respectively.This
confirms the PVP capping to the CdS surface.
Triton X is a nonionic surfactant. It is lengthy polyoxyethylene oxide chain with a phenyl ring. The absorption bands, at 1637 cm -1 and 1435 cm -1 in the triton X capped CdS, correspond to C = C stretching of the aromatic compounds. In FTIR spectra of triton X capped CdS sample [Figure 4.27 (b)], a broad band is observed at 1960 cm-1. A similar peak at 1960 cm-1 corresponding to triton X was reported by Ruan et. al., [248]. Hence, the above observations confirm the presence of triton X on
the CdS nanoparticle surface.
The FTIR spectrum of piperazine capped CdS is shown in Figure 4.27 (c). The symmetric N - H vibrations of piperazine at 3207 cm -1 [249] shifts to 3006 cm-1 and asymmetric N - H vibrations of piperazine at 3406 cm - 1 [249] shifts to 3226 cm-1. There is a shift in the symmetric and asymmetric C - N - H deformation peaks from 1475 cm-1 and 1556 cm-1 [249] to 1434 cm-1 and 1548 cm-1 respectively. A shift in C - N stretching is also observed from 1323 cm-1 [249] to 1318 cm-1. The above significant downshifts of the characteristic vibrational peaks suggest the existence of piperazine molecule on to the surface of CdS nanoparticles in the CdS rods. The Cd2+ forms a coordinate bond with the lone pair of electron on the nitrogen; as a result the N - H bond strength weakens and causes a down shift in the vibrational frequencies. Further, the stretching vibration at 1062 cm-1 corresponds to the ring C - C stretching vibrations of the piperazine molecule.

91
Figure 4.27 FTIR Spectra of (a) PVP capped, (b) Triton X capped and
(c) Piperazine capped CdS samples
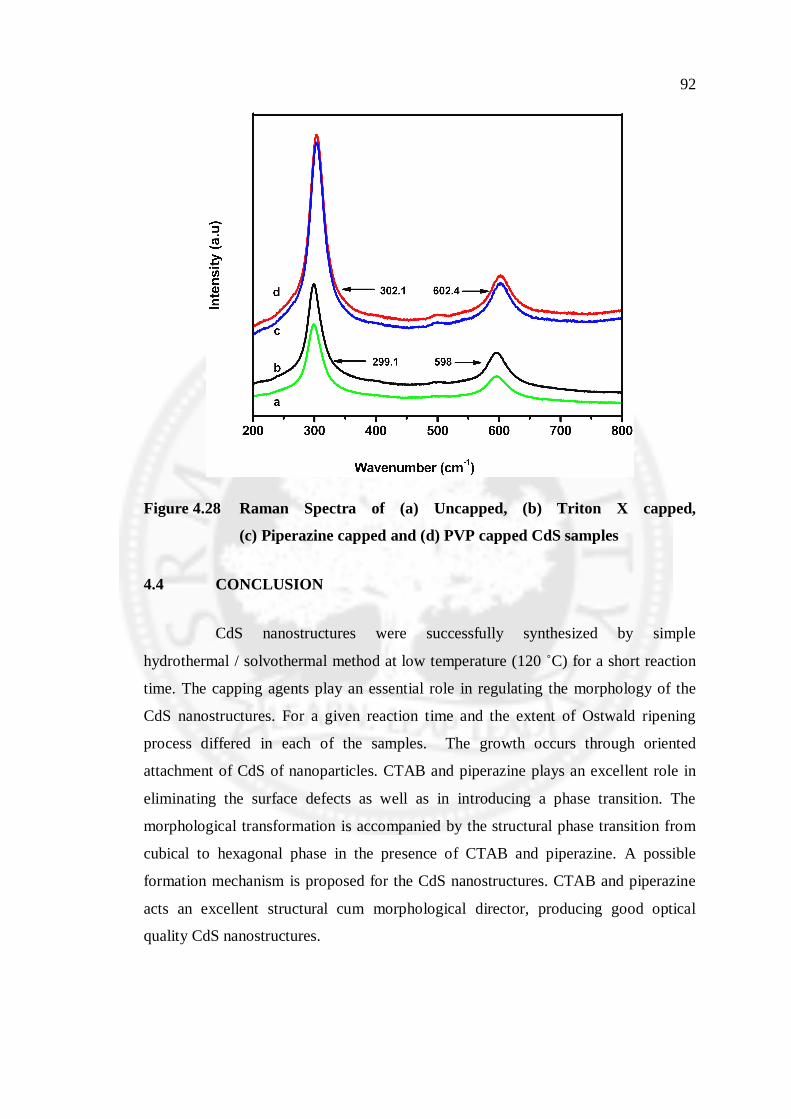
4.3.3.5 Raman Studies
The Figure 4.28 (a) - (d) shows the Raman spectra of the uncapped and
capped cdS samples. The Raman spectral analysis of the uncapped and capped CdS
samples display peaks corresponding to optical phonon modes. The uncapped and
Triton X capped CdS samples exhibit 1 LO and 2 LO peaks at 299.1 cm-1 and
598 cm-1 respectively. The PVP capped CdS sample and piperazine capped CdS
samples exhibit peaks at 302.1 cm-1 and 602.4 cm-1 corresponding to 1 LO and 2 LO
optical phonon modes, respectively. 1 LO peak of CdS nanocrystals are reported to
appear around 300 cm -1 [250, 177] and 305 cm-1 [251]. The frequency shifts of 1 LO
Raman peak in the CdS samples is ascribed to grain size and defects states. The
broadening of the spectra of both the capped samples with respect to the uncapped
CdS sample can be attributed to optical phonon confinement [252].
92
Figure 4.28 Raman Spectra of (a) Uncapped, (b) Triton X capped,
(c) Piperazine capped and (d) PVP capped CdS samples
4.4 CONCLUSION
CdS nanostructures were successfully synthesized by simple
hydrothermal / solvothermal method at low temperature (120 C) for a short reaction
time. The capping agents play an essential role in regulating the morphology of the
CdS nanostructures. For a given reaction time and the extent of Ostwald ripening
process differed in each of the samples. The growth occurs through oriented
attachment of CdS of nanoparticles. CTAB and piperazine plays an excellent role in
eliminating the surface defects as well as in introducing a phase transition. The
morphological transformation is accompanied by the structural phase transition from
cubical to hexagonal phase in the presence of CTAB and piperazine. A possible
formation mechanism is proposed for the CdS nanostructures. CTAB and piperazine
acts an excellent structural cum morphological director, producing good optical
quality CdS nanostructures.