CHAPTER 4 RESEARCH METHODOLOGY AND...
28
95 CHAPTER 4 RESEARCH METHODOLOGY AND DESIGN Para. No. Particulars Page No. 4.1 Hypothesis Formulation 96 4.1.1 Dependent Variables for all Five Hypotheses 97 4.2 Conceptual Model of the Study 99 4.3 Research Design 101 4.3.1 Approach 101 4.4 Survey Method 101 4.5 Questionnaire Design 102 4.6 Pilot Study 103 4.6.1 Analysis of Pilot Study Data 105 4.7 Final Questionnaire 110 4.8 Sampling Design 111 4.8.1 Survey Population 111 4.8.2 Sample Determination 112 4.8.3 Sample Unit Selection 114 4.8.4 Questionnaire Survey 115 4.9 Statistical Tools and Techniques 116 4.9.1 Validity and Reliability of the Tools Used 116 4.9.2 Statistical Techniques Used 119 4.10 Mechanism to Assure Quality of the Study 121
Transcript of CHAPTER 4 RESEARCH METHODOLOGY AND...

95
CHAPTER 4
RESEARCH METHODOLOGY AND DESIGN
Para. No. Particulars Page No.
4.1 Hypothesis Formulation 96
4.1.1 Dependent Variables for all Five Hypotheses 97
4.2 Conceptual Model of the Study 99
4.3 Research Design 101
4.3.1 Approach 101
4.4 Survey Method 101
4.5 Questionnaire Design 102
4.6 Pilot Study 103
4.6.1 Analysis of Pilot Study Data 105
4.7 Final Questionnaire 110
4.8 Sampling Design 111
4.8.1 Survey Population 111
4.8.2 Sample Determination 112
4.8.3 Sample Unit Selection 114
4.8.4 Questionnaire Survey 115
4.9 Statistical Tools and Techniques 116
4.9.1 Validity and Reliability of the Tools Used 116
4.9.2 Statistical Techniques Used 119
4.10 Mechanism to Assure Quality of the Study 121

96
CHAPTER 4
RESEARCH METHODOLOGY AND DESIGN
“A research design is the arrangement of conditions for collection and analysis of data
in a manner that aims to combine relevance to the research purpose with economy in
procedure.” (Claire1962 p.50)215
The essence of academic research is to reflect on empirical material in the
context of scholarly literature (Taylor et al. 2011)216
. Having reviewed literature on
the subject of this study in the previous chapter, the next step was to formally generate
the research hypotheses, and lay down the research design keeping in mind the
objectives of the study defined earlier. Accordingly, this chapter describes the
methodology adopted for the study, covering the research type and approach, adoption
of the scale of measurement, population and sampling design, data collection method
adopted, and finally the statistical tools and techniques implemented.
4.1 Hypotheses Formulation
There are five Hypothesis statements considered for this study. Hypotheses
statements are predictive statements capable of being objectively verified and tested
(Kothari 2009 p.184)217
. It relates an independent variable to a dependent variable and
is a natural fallout of the objectives of the study. Research objectives for this study
were acquired from the basic research problem in Chapter 1 as follows:-
i. To identify all possible employee competencies that could enhance financial
performance of MSMEs;
ii. To categorise these competencies under the three employee competency
factors of core, functional and leadership categories;
iii. To find out to what extent these employee competency factors and their
constituent competencies enhance financial performance of MSMEs;
215
Claire, S. (1962). Research Methods in Social Sciences, 50. 216
Taylor, B. Sinha, G. and Ghoshal, T. (2011). Research Methodology: A Guide for Researchers in
Management and Social Sciences. PHI Learning Private Ltd, New Delhi, 16. 217
Kothari, C.S. (2009). Research Methodology: Methods and Techniques ( 2nd
Revised ed.). New Age
International Publishers, Delhi, 184.

97
iv. To suggest measures for enhancing financial performance of MSMEs through
better utilization of employee competency factors.
Literature review in the previous chapter has shown that employee
competency factors in any business organization can be categorized as „value based
core competencies‟ applicable for all employees, „functional or job specific skills‟ at
work force or individual level, and „leadership traits‟ at owners‟ and managerial level.
These could be composed of varying admixtures of knowledge, skills, attitudes and
behaviours that exist within a person and which predict superior performance.
Literature review and the assistance of subject experts have also assisted in
identification of a total of 15 relevant employee competencies grouped under the three
main headings of „core‟, „functional‟ and „leadership‟ competencies. Review of
existing literature from varied sources have also established the gaps in existing
research work in the field of employee competencies in the MSME sector in India. An
analysis of the effect of the above-mentioned types of competency factors on the
financial performance of MSMEs in MIDC Bhosari, PCMC area would provide
scientifically based inferences about the research problem.
4.1.1 Dependent Variables for all Five Hypotheses Dependent variable for all five
hypothesis statements has been considered to be „business performance‟. Performance
indicators for financial performance of a firm are traditionally considered to be Sales
turnover, Profit After Tax (PAT), Market share and Return on Investment (ROI) (Ling
2000)218
. Since review of literature on the measurement of performance in firms has
indicated that „Profitability‟ is a good indicator of performance of any business, the
same was adopted as the common dependent variable for this study.
4.1.1.1 Hypothesis 1 (H1)
Independent Variable Employee competency factors as a whole has been considered
as the independent variable for the first hypothesis statement. Intention of Hypothesis
1 is to establish the superior relationship between „higher levels of competencies‟ and
„profitability‟ of MSMEs.
H1: MSMEs with higher competency levels have greater profitability.
218
Ling, X. L. (2000). An analysis of sources of competitiveness and performance of Chinese
manufacturers. International Journal of Operations and Production Management, 20 (3), 299 -315.

98
4.1.1.2 Hypothesis 2 (H2)
Independent Variable In the literature review, the group of ‘value based
organisational core competencies‟ was identified as the most effective driver of
business performance for most organisations. Accordingly, „value based
organisational core competencies‟ of MSMEs have been considered as the
independent variable for the second hypothesis. Intention of the second hypothesis is
to establish the superior relationship between „value based organisational core
competencies‟ and „profitability‟ of MSMEs, as compared to the other types of
employee competency factors.
H2: Value based organisational core competencies have greater impact than
functional or leadership competencies on the profitability of MSMEs.
4.1.1.3 Hypothesis 3 (H3)
Independent Variable In the literature review, „quality consciousness‟ of the
organisation emerged as one of the most significant drivers of business performance
of high growth companies. Accordingly, „quality consciousness‟ has been considered
as the independent variable for the third hypothesis. Intention of Hypothesis 3 is to
establish the superior relationship between „quality consciousness‟ and „profitability‟
as compared to the other organisational core competencies.
H3: Quality consciousness is the most important value based organisational core
competency for yielding higher profitability of MSMEs.
4.1.1.4 Hypothesis 4 (H4)
Independent Variable In the literature review as well as during interaction with
some industry experts „planning and organising ability‟ emerged as the most effective
driver of business performance amongst leadership competencies. Accordingly,
„planning and organising ability‟ has been considered as the independent variable for
the fourth hypothesis. Intention of Hypothesis 4 is to establish the superior
relationship between „planning and organising ability‟ and „profitability‟ as compared
to the other leadership competencies.
H4: Planning and organising ability is the most important leadership competency for
yielding higher profitability of MSMEs.

99
4.1.1.5 Hypothesis 5 (H5)
Independent Variable In the literature review e.g. the Report of PMs TF on MSMEs
2010 as well as during interaction with all industry experts, lack of opportunities for
training of employees in skills and competencies has emerged as the most crucial
problem for Indian MSMEs. Accordingly, „training of employees in skills and
competencies‟ has been considered as the independent variable for the fifth
hypothesis. Intention of Hypothesis 5 is to establish the superior relationship between
„training of employees in skills and competencies‟ and „profitability‟.
H5: Training and development of employees in skills and competencies yield higher
profitability of MSMEs.
4.2 Conceptual Model of the Study
Literature review and hypotheses formulation has enabled the researcher to
formulate a conceptual model of study which is shown in Figure 4.1 below. Although
each of the individual competencies e.g. „Quality Consciousness‟ would directly
contribute to its competency group e.g. „Core competencies‟, which would then
contribute to the „Overall competency level‟, which would affect the dependent
variable „Profitability‟, the arrows have been shown to directly lead on to the
dependent variable, so as to conceptualise the relationship between each independent
variable and the common dependent variable for all five hypotheses.

100
Quality
Consciousness
(H3)
Customer Focus
Cost Consciousness
Safety Norms
Team Spirit
Creativity
Strategic Thinking
Interpersonal Skills
Planning & Org
Skills (H4)
Decision Making
Problem Solving
Technical Skills
Learning &Devp
Adaptability to Tech
& Change
Specialised Skills
Core
Compe-
tencies
(H2)
Leader-
ship
Compe-
tencies
Func-
tional
Compe-
tencies
Trai-
ning
(H5)
Overall
Compe-
tency
Level
(H1)
Profitability
(Dependent
Variable)
H4
H2
H5
H1
Figure 4.1: Conceptual Model of Study
H3
101
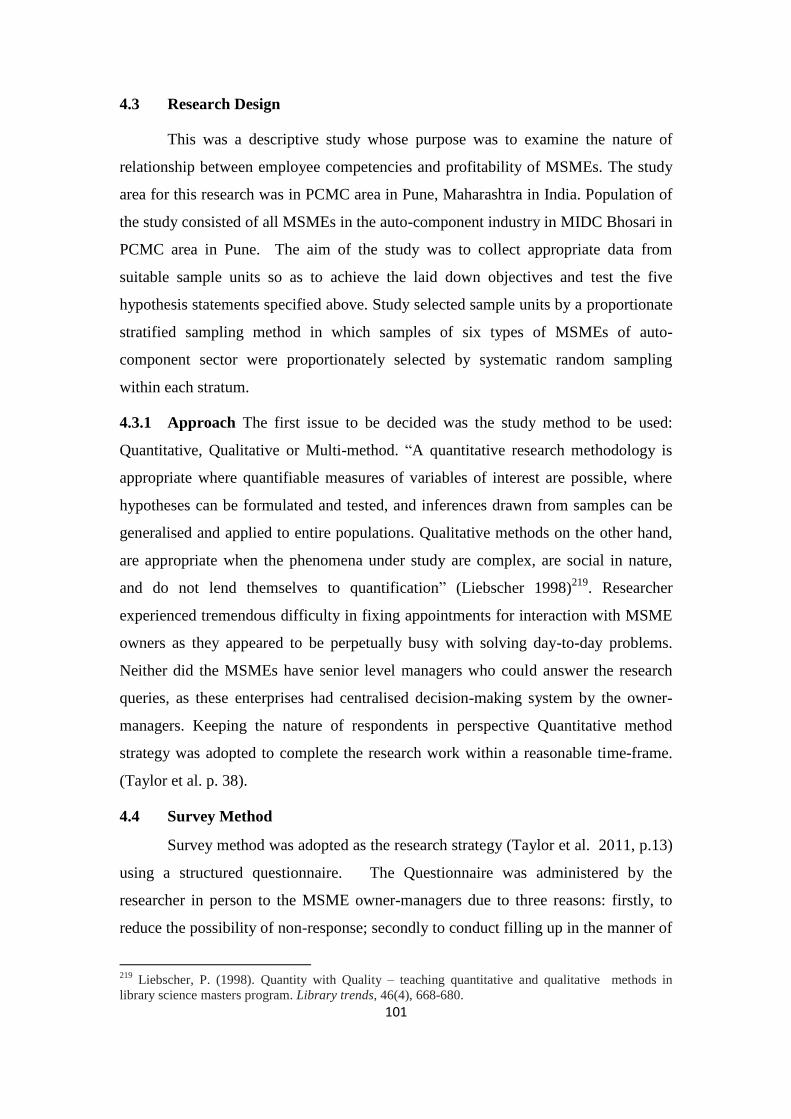
4.3 Research Design
This was a descriptive study whose purpose was to examine the nature of
relationship between employee competencies and profitability of MSMEs. The study
area for this research was in PCMC area in Pune, Maharashtra in India. Population of
the study consisted of all MSMEs in the auto-component industry in MIDC Bhosari in
PCMC area in Pune. The aim of the study was to collect appropriate data from
suitable sample units so as to achieve the laid down objectives and test the five
hypothesis statements specified above. Study selected sample units by a proportionate
stratified sampling method in which samples of six types of MSMEs of auto-
component sector were proportionately selected by systematic random sampling
within each stratum.
4.3.1 Approach The first issue to be decided was the study method to be used:
Quantitative, Qualitative or Multi-method. “A quantitative research methodology is
appropriate where quantifiable measures of variables of interest are possible, where
hypotheses can be formulated and tested, and inferences drawn from samples can be
generalised and applied to entire populations. Qualitative methods on the other hand,
are appropriate when the phenomena under study are complex, are social in nature,
and do not lend themselves to quantification” (Liebscher 1998)219
. Researcher
experienced tremendous difficulty in fixing appointments for interaction with MSME
owners as they appeared to be perpetually busy with solving day-to-day problems.
Neither did the MSMEs have senior level managers who could answer the research
queries, as these enterprises had centralised decision-making system by the owner-
managers. Keeping the nature of respondents in perspective Quantitative method
strategy was adopted to complete the research work within a reasonable time-frame.
(Taylor et al. p. 38).
4.4 Survey Method
Survey method was adopted as the research strategy (Taylor et al. 2011, p.13)
using a structured questionnaire. The Questionnaire was administered by the
researcher in person to the MSME owner-managers due to three reasons: firstly, to
reduce the possibility of non-response; secondly to conduct filling up in the manner of
219
Liebscher, P. (1998). Quantity with Quality – teaching quantitative and qualitative methods in
library science masters program. Library trends, 46(4), 668-680.

102
an interview with structured questions whose responses could be recorded accurately;
and finally, to collect first-hand information about the ground situation during the
interaction to the extent feasible. One open-ended question was also included at the
end of the Questionnaire to obtain inputs on any other relevant issues from the
respondents.
4.5 Questionnaire Design
Focus on the aim and objectives of this study, supplemented by literature
review and discussions with experts helped in preparation of the Questionnaire. Since
secondary data on financial information of the MSMEs was not available from the
governmental agencies like the DIC or MIDC, nor any other non-governmental
agencies like MCCIA or CII, it was decided to obtain this as primary data directly
from the MSMEs. Accordingly, the hypothesised relationship between the
independent variables of employee competency factors and the dependent variable of
profitability had to be established by direct questioning in the survey from the owners
/ managers of MSMEs.
It was important to gain and retain the interest of the respondents. Towards
this purpose, a clearly worded covering letter was used. The questions were phrased
in a simple and unambiguous language, and sequenced in a sensible manner starting
from general data and finishing with specifics. Space was kept for open-ended
comments as well. Assuming that the terminology of employee competency factors
could cause some difficulty in comprehension by some respondents, their concepts
were elaborated upon and the questions worded so as to make them less nebulous and
easy to understand (Kothari, 1987 p.102).
The initial Questionnaire had the following composition :-
Covering letter expressing purpose of research and promising confidentiality of
information;
Introduction giving out simple guidelines for filling out the questions.
Part I (12 questions) – General data sheet to collect factual information about the
respondent and the company (age, type and size and financial details) as well as
elementary profile of employees. These were in the form of filling in the blanks, and
multiple choice questions.

103
Part II (10 questions) - To measure respondents‟ assessment of the actual
availability of the employee competencies in their enterprises, and the impact of ideal
employee Competencies on Profitability of their enterprises using Likert Scale.
Part III (4 questions)– 2 questions to measure respondents‟ assessment of availability
of factors other than employee competency factors and their impact on profitability of
their enterprises based on Likert scale, the third question dealt with the impact of
other HR factors besides competencies like training on profitability, and the last
question was open-ended to obtain any other suggestions.
Likert scale used to measure the respondent‟s extent of agreement with each statement
in Parts II and III was based on the five point scale as shown below in Table 4.1:-
Table 4.1 Likert Scale Format used in Questionnaire
Statement in positive format e.g. The employees of your enterprise have adequate
competencies (tick in any one box below):-
Least agree Less agree Fairly agree More agree Most agree
1 2 3 4 5
(Source: Survey Questionnaire of this Study – Appendix ‘A’)
4.6 Pilot Study
The population size of MSMEs in PCMC MIDC Bhosari area selected for
study was 2266. It was decided to select 20 respondents from this population
(approximately 10% of this population size) for pilot study. The initial version of the
Questionnaire had 26 questions, as explained above. To test the initial Questionnaire,
20 questionnaires were initially sent out to MSME entrepreneurs (Appendix B) with
whom contact had been established through office bearers of MCCIA, Bank of
Maharashtra and social networking. No separate details were given to them about
filling up the Questionnaire except the covering letter and introduction. Six
respondents called back and asked for specific clarifications. Thereafter, revised
questionnaires were given to this pilot group, and their responses were tabulated and
tested for validity, reliability and hypotheses verification.
The first change in questionnaire was regarding the actual number of ad-hoc
employees employed by the MSMEs asked separately in Question 11. They had
tremendous reservation on this issue because of various labour laws and their negative
implications for the companies with the government labour department and various

104
inspectorates. Most of the pilot group stated that they would not like to give out the
actual number of ad-hoc employees, stating that they had none or just a handful,
whereas the researcher‟s general information about the MSMEs indicated otherwise.
Question 11 was therefore dropped from the Questionnaire, and this query was
included as a sub-part of Question 9.
The second change was regarding financial information asked in Question 12.
All respondents initially refused to provide specific data on financial performance of
their enterprises like actual turnover, profit after tax etc. due to a colossal fear
psychosis with government agencies, but agreed to specify profitability of their
enterprises in general terms as less than 5%, 5 to 10% etc. This was also necessary as
the statistical advisor Mr Manik Awale, advised the researcher to cross-tabulate the
availability of employee competencies with the actual profitability of enterprises to
meaningfully test the research hypotheses. Accordingly, the dropped question
regarding ad-hoc employees was replaced by one to indicate profitability of the
enterprise over the last three years in wide bands of five percentage points e.g. 0 to
5%, 5 to 10%, and so on. However, when this was tested in the second set of pilot
study questions, it was seen that most of the respondents were giving vastly
exaggerated profitability bands which would lead to wrong conclusions for the study.
Hence, this too was changed in favour of binary response to this query in terms of
„profitable‟ or „not profitable‟ after analysing the second set of responses from the
pilot study respondents.
The third important issue that emerged during the data analysis of pilot study
data was the non-suitability of existing Questions 13 to 22 which were asking the
respondents to assess in two parts: the actual availability of competencies, as well as
assess the impact of ideal employee competencies on their business profitability
without relating these to their actual availability. The respondents were confused with
this type of questioning. Hence, it was decided to modify the Questionnaire and ask
respondents to indicate only their assessed impact of the specified competency on
profitability of their enterprise as they felt about it, thus reducing Part II to six
questions 13 to 18 only. These would then be correlated with the profitability
indicated in Question 12 for hypothesis testing.
Data analysis of pilot sample showed that some of the sub-parts of Question
25 could be removed as they were not providing meaningful input for research

105
purposes, and could send confusing messages. Accordingly, Question 25 was
dropped. Responses by the pilot study group were discussed with a group of experts
which included MSME advisors of MCCIA, CII and MIDC PCMC office bearers.
Based on these discussions, slight modifications were once again made. The third set
of Pilot study results based on Final Questionnaire (shown at Appendix ‘A’) were
measured for reliability, validity and hypotheses verification, before proceeding ahead
with the main sample survey. Pilot data were also analysed by Spearman‟s Correlation
testing to check whether the MSMEs of different sizes and types in MIDC Bhosari
showed significant variation in their various categories. The results indicated that the
MSMEs in MIDC Bhosari displayed negligible variability amongst the MSMEs due
to varying size or type of enterprise. Details of the pilot study tests are given below.
4.6.1 Analysis of Pilot Study Data Most of the tests dealt with Questions 12 to 20
which involve the dependent and independent variables. However, data in Questions
7, 8 and 11 were also used to find whether MSMEs belonging to different categories
based on their size (Question 7), type of industry (Question 8) and attrition level
(Question 11) differ in their relationships.
4.6.1.1 Pilot Sample Details The pilot sample constituted of 20 owner managers of
MSMEs selected proportionately from all six types of industry (Question 8) shown in
Figure 4.2 below.

106
They were distributed according to the size of industry (Question 7) as shown in
Figure 4.3 below.
The Micro scale industries were the most difficult to identify as both the PCMC
MIDC R&D as well as Pimpri Chinchwad Small Industries directory did not specify
the size of the enterprises, nor were they registered with the MCCIA. Their names
were finally obtained by reference from two owners of small scale enterprises.
Figure 4.3: Size-wise Distribution of Enterprises (Question 7) – Pilot study
Figure 4.2: Type-wise Distribution of Enterprises (Question 8) – Pilot study
1. Auto and Auto-ancillaries – 5
2. Electricals and Electronics -1
3. Machine and machine tools – 2
4. Metallic products and fabrication - 8
5. Process industry - 2
6. Others - 2
1. Micro scale enterprises – 2
2. Small scale enterprises – 15
3. Medium scale enterprises - 3

107
4.6.1.2 Basic Statistical Measures for Pilot Study Statistical measures of pilot
sample data consisting of Measures of average: Arithmetic Mean, Median and Mode;
Measures of Variability: Standard deviation and Variance; Measures of shape:
Skewness and Kurtosis; Standard errors of all measures of mean were examined.
Perusal of the basic statistical measures of the pilot sample data indicated that the data
was not normal. Hence non-parametric tests were done.
4.6.1.3 Cronbach Alpha Reliability Test of Pilot Study Cronbach Alpha reliability
test for all the variables showed a Cronbach alpha value of 0.866 which was highly
reliable. This was very close to that based on standardised items 0.876 which was
based on Z value.
4.6.1.4 Kolmogorov-Smirnov One-Sample NP Test of Normality for Pilot Study
This tests whether the distribution of the members of a single group differ
significantly from a Normal or Uniform or Poisson or Exponential distribution.
Significance values close to zero would indicate that the sample distribution actually
displays a non-normal distribution (George and Mallory p.216). The significance
values for most of the variables were very small which suggested that the data should
be tested by non-parametric tests.
4.6.1.5 Spearman’s Rho Correlation Coefficients for Pilot Study Correlations are
often called bivariate correlation to designate a simple correlation between two
variables, as opposed to relationships among more than two variables, as practised in
multiple regression analysis. Instead of Pearson „r‟ correlations for normal
distributions, Spearman‟s Rho based on the rank order of values is more appropriate
when variables are not normally distributed (George and Mallory p.124). Higher
correlation values with significance less than 0.05 indicate that as the value of one
variable increases, the value of the other value also increases, establishing a positive
relationship between the two variables.
The correlation coefficients of major importance were those between the
dependent variable Profitability of Question 12 and the various independent variables
like the overall Competency level in Question 13, the three Competency factors in
Question 14, the four individual Functional competencies in Question 15, the six Core
competencies in Question 16, the five Leadership competencies in Question 17, and
Training impact in Question 18. Besides the above, any correlation exhibited with the
overall Management aspects in Question 19, and with the impact of hiring Qualified

108
managers in Question 20 were also of interest. Any correlation to be considered
„significant‟ had to be less than 0.05 for the accepted confidence level of 95%.
Analysis of the Spearman‟s Rho Correlation coefficients between the dependent
variable Profitability and the various independent variables showed that none of the
critical variables had a significance value less than 0.05, but in comparative terms
with the other independent variables in their respective groups, the values were the
lowest and closest to 0.05 for Overall competency level (.072) for Question 13, Core
competencies (.061) for Question 14, Quality Consciousness (.079) for Question 16,
partially supporting Hypotheses 1, 2 and 3. However, Hypotheses 4 and 5 were not
supported as the significance values were higher for Planning and organising (.072)
than Problem-solving (.066) in Question 17, and in the case of Question 18
significance value of Training was 0.116. Hence it would be prudent to use the One-
Sample Chi-Square test, the Mann-Whitney Rank-Sum NP test, and Logistic
Regression analysis for hypothesis testing, all of which could be used on non-normal
distributions.
4.6.1.6 Mann-Whitney Rank-Sum U test for testing of H1 and H5 for Pilot
Study This test is essentially a non-parametric equivalent of the t-test for two
independent samples, when the distribution displays non-normality. The
measurements of both groups taken together are ranked in order of increasing size,
taking care to preserve the identity of measure (Taylor et al. 2011, pp. 150-151). The
average rank of the two groups are compared. The U test determined whether that
difference was significant.
For H1, Questions 12 and 13 data were analysed. Z value was -1.793 with a
significance of 0.073, which showed that their difference was not significant.
For H5, Questions 12 and 18 data were analysed. Z value was -1.581 with a
significance of 0.114, which showed that their difference was not significant.
4.6.1.7 One-Sample Chi-Square NP Test for H1 to H5 for Pilot Study This is a
test of independence between the dependent and independent variables. A lack of
independence indicated by large discrepancies between the observed and expected
values indicated by large chi-square (x2) values and small significance levels,
demonstrate lack of independence between the independent and dependent variables.
This procedure conducts a one-sample chi square test rather than the more traditional
chi-square test of cross-tabulated data. Small significance values would demonstrate

109
that the sample values deviate from the expected values thus discrediting the null
hypotheses (George and Mallory p.217).
Question 12: Profitability had a significance value of 0.000;
Question 13: Impact of Overall Competency level on Profitability had a significance
value of 0.022, supporting H1;
Question 14: Impact of the Competency factors showed a significance value 0.026
for Core Competency factors, supporting H2;
Question 16: Impact of Core competencies on Profitability showed a significance
value of 0.047 for Quality consciousness, supporting H3;
Question 17: Impact of Leadership competencies on Profitability showed significance
value of 0.022 for Planning and Organising competency, supporting H4;
Question 18: Impact of Training on Profitability showed a significance value of
0.041, supporting H5.
Significance values for all these variables indicated that their sample values deviated
substantially from the expected values (thus discrediting the null hypotheses in each
of these cases).
4.6.1.8 Friedman One-Way ANOVA NP Testing of H2, H3 and H4 for Pilot
Study “The Friedman one-way ANOVA is similar to traditional Analysis of Variance
with two notable exceptions: firstly comparisons in the Friedman procedure are based
on mean rank of variables rather than on means and standard deviations of raw scores,
and secondly, rather than calculating an F ratio, Friedman compares ranked values
with expected values in a chi-square analysis” (George and Mallory p.218). Although
the power of the Friedman operation is less than that of normal Analysis of Variance,
but since the sample data deviated far from normality, the Friedman One-way
ANOVA had to be used.
The significance value associated with the chi-square analysis (p = 0.000)
indicated that there was a significant difference between the variables. Visual
inspection indicated that Core competencies had the highest rank amongst Question
14 variables, supporting Hypothesis 2; Quality consciousness had the highest rank
amongst Question 16 variables, supporting Hypothesis 3; However, Interpersonal
Skills had a higher rank than Planning and Organising in Question 17, which did not
support Hypothesis 4.

110
4.6.1.9 Logistic Regression for Hypothesis Testing of H2, H3 and H4 for Pilot
Study Logistic regression is an extension of multiple regression in which the
dependent variable is not a continuous variable, and could have only two values, as in
the case of this study, where Profitability is either „Yes‟ or „No‟. In logistic regression
the value of dependent variable that is being predicted represents a probability, and it
varies between 0 and 1.
(a) Testing of H2 for Pilot Study The logistic regression test indicated that „core
competency‟ was the only variable retained in the equation with the other two having
been removed. The weighting value of core competencies (6.068) was much higher
than that for the other two in Step 0 with a significance of 0.014. This supported H2,
that core competencies have significant impact on profitability.
(b) Testing of H3 for Pilot Study „Quality consciousness‟ was the only core
competency selected for the equation with a significance of 0.026 in Step 0. Hence H3
was supported.
(c) Testing of H4 for Pilot Study „Planning and organising‟ was the only
variable selected for the equation. Hence H4 was supported.
4.7 Final Questionnaire
The final questionnaire (shown in Appendix ‘A’) had 21 questions organised
in three sections as explained below:-
Part I: 12 questions in General Data Sheet as fill in the blanks or multiple choice.
Question 12 was the most important for hypothesis verification of all five hypotheses,
providing information about the only dependent variable - business profitability.
Part II: Six questions on respondents‟ assessment of impact of the specified 15
employee competencies in their respective enterprises (Likert scale). Questions 13 to
17 cross-tabulated with profitability in Question 12 would be used for hypotheses
verification of H1, H2, H3 and H4. Question 18 indicated the availability of training
and development facilities for functional skills in their respective enterprises (Likert
scale). Question 18 correlated with Question 12 would be used for hypothesis testing
of H5.
Part III: Two questions on respondents‟ assessment of impact of factors other than
employee competencies on profitability of their enterprises (Likert scale). Question
19 was included to assess the significance of HR factor in general in comparison with
financial, technological, marketing and operational factors on profitability. Question

111
20 was meant to obtain input on the assessed impact of one other important HR factor
„hiring of professionally qualified managers‟ on profitability. Question 21 was
included as an open-ended query to obtain the respondents‟ views on any other issue
relevant to the topic of interest. The third part was included so as to throw further light
on this research topic that could be relevant for this or future studies on MSMEs.
4.8 Sampling Design
In any type of research, it is extremely important to consider the size of the
sample and its procedure of selection. An optimum sample is one which fulfils
requirements of efficiency, representativeness, reliability and flexibility. The sample
should be small enough to avoid unnecessary expenses and large enough to avoid
intolerable sampling error.
“If inferences are to be made about a population from the sample, the sample must be
„typical‟ or representative of that population”.
Turney and Robb (1971, p.107)220
4.8.1 Population The MSMEs in MIDC Bhosari area in PCMC belong to the
automotive industry and were involved in supplying automobile parts and ancillaries
to the OEMs of the automobile industry, as explained in Chapter 3 earlier. Although,
they were all producing products and services for the automobile industry, they could
be classified in to six homogeneous types of manufacturing industry which required to
be considered as separate strata. Initially, it was attempted to obtain the details of
these MSMEs from DIC Pune, where registration records of all MSMEs of Pune were
supposed to be available. The researcher personally met the General Manager DIC
Pune a number of times and obtained a list after four months of correspondence, but
most of the details including even the establishment names, their addresses and
contact numbers were found incorrect, or the businesses had closed down. Thereafter,
MCCIA office in Pune was contacted and after some interaction, a list was obtained
of only 145 SMEs which were the only ones which had registered with this
Association. Contact with the Pimpri Chinchwad Small Industries Association
Secretary Mr Nitin Bankar resulted in obtaining an industrial directory of Pimpri
220
Turney, B. & Robb, G. (1971). Research in Education: An Introduction. The Dryden Press Inc.,
Illinois, 107.

112
Chinchwad (2009-10)221
which gave a list of 1967 MSMEs in Bhosari area. However,
this was not an official directory, and the contact numbers and addresses of
establishments turned out to be incorrect, and incomplete. Thereafter, in mid-2012,
the researcher contacted the PCMC MIDC office and could obtain an official
Reference and Directory (R&D), (2010-11)222
of all the MSMEs in Pune including
those in MIDC PCMC in Bhosari. This directory indicated a population of 2266
enterprises located in Bhosari area, all belonging to the automotive industry.
Although, both the directories did not have details of the size of enterprises and their
financial details of turnover, profit etc., they had the types of enterprises and contact
details. The population of MSMEs as listed in the R&D consisted of following
composition:-
i. Metallic products and fabrication - 886 MSMEs
ii. Auto and Auto ancillaries - 564 MSMEs
iii. Machine and machine tools - 259 MSMEs
iv. Process industry (plastics and chemicals/polymers) - 190 MSMEs
v. Electrical and Electronics - 106 MSMEs
vi. Others (services, packaging, transportation etc.) - 261 MSMEs.
4.8.2 Sample Determination Since the population consisted of six homogeneous
strata, it was decided to adopt proportionate stratified sampling technique for sample
design (Taylor et al. 2011, p.46). The sample was proportionately distributed over all
the strata with systematic random sampling within each stratum. The sample size was
calculated as 108 by using a Penn State Program Evaluation Tipsheet #60 available on
the internet223
. The parameters for calculation of sample size were as follows:-
Population size: 2266 in 6 types of industry
221
Industrial Directory of Pimpri Chinchwad (2009-10). Pimpri Chinchwad Small Industries
Association, Chinchwad, Pune. 222
MIDC Reference & Directory (R&D): Pune Region Index,(2010-11). Assent R&D Pvt Ltd, Pune,
48-193. 223
Watson, J. (2001). How to Determine a Sample size: Tipsheet#60, University Park, PA: Penn State
Cooperative Extension. Retrieved on 12Apr2012 from
< http://www.extension.psu.edu/evaluation/pdf/TS60.pdf>.

113
Precision level: 5% margin of error
Confidence level: 95% which is standard for most social science applications
Variability: 20% assumed after consultation with the MSME experts and as
confirmed from analysis of pilot study data (the entire population being more or less
homogeneous as they all belonged to the automotive industry).
Base sample size for these parameters from the Penn State Tipsheet#60 for a
population size of 2266 was obtained as 97 as average of 96 and 98. Extract of the
Table is shown in Table 4.2 below.
Table 4.2: Table for Finding a Base Sample Size
Population Variability
50% 40% 30% 20% 10%
2000 333 311 158 96 57
3000 353 328 163 98 57
(Source: PENNSTATE Program Evaluation Tipsheet #60 Appendix 1 available at
http://www.extension.psu.edu/evaluation/pdf/TS60.pdf,)
Assuming a response rate of 90% due to co-location of all the units within a small
area and convenience of collecting the data through personally visiting the
respondents, it was decided to attempt data collection from 108 respondents.
Appointment of Respondents: Due to complicated nature of the data to be collected,
and MSMEs being mostly managed by the owners as managers, it was decided to
have the questionnaires filled by the owners or senior managers if available.
Cross section of the 108 enterprises selected as sample based on proportionate
stratified sampling was as follows:-
i. Metallic products and fabrication (886 MSMEs):– (886 / 2266) * 108 = 42
sample enterprises
ii. Auto and Auto ancillaries (564 MSMEs):– (564 / 2266) * 108 = 27 sample
enterprises
iii. Machine and machine tools (259 MSMEs):– (259 / 2266) * 108 = 13 sample
enterprises

114
iv. Process industry (190 MSMEs):– (190 / 2266) * 108 = 8 sample enterprises
v. Electrical and Electronics (106 MSMEs):– (106 / 2266) * 108 = 5 sample
enterprises
vi. Other industries (261 MSMEs):– (261 / 2266) * 108 = 13 sample enterprises.
4.8.3 Sample Unit Selection: All 2266 MSMEs listed in the PCMC MIDC R&D
were numbered as per the alphabetical order of their names within each strata i.e.
Metallic product firms were listed as 001, 002 onwards to 886; Auto ancillaries were
similarly numbered from 001, 002 onwards to 564; and so on for each stratum.
Proportionate stratified samples were thereafter selected by random sampling within
each stratum using the Stat Trek Random Number Generator224
on 10 May 2012 as
follows:-
Metallic Products (42 sample units out of 886 MSMEs):-
082, 152, 594, 391, 652, 348, 243, 556, 505, 006, 380, 162, 799, 012,833,145,200,
452, 818, 842, 117, 285, 196, 698, 079, 398, 742, 183, 086, 793, 446, 294, 600, 609,
581, 666, 410, 291, 414, 044, 266, 253.
Auto and auto ancillaries (27 sample units out of 564 MSMEs):-
209, 129, 521, 324, 350, 008, 318, 368, 519, 066, 294, 440, 301, 153, 448, 126, 113,
418, 217, 406, 253, 298, 014, 300, 422, 077, 266.
Machine and machine tools (13 sample units out of 259 MSMEs):-
036, 022, 135, 054, 108, 137, 118, 176, 201, 006, 113, 080, 239.
Process industry (8 sample units out of 190 MSMEs):-
117, 042, 075, 077, 159, 089, 164, 008.
Electrical and Electronics (5 sample units out of 106 MSMEs):-
084, 082, 009, 016, 022.
Other industries (13 sample units out of 261 MSMEs):-
258, 167, 179, 020, 164, 187, 257, 239, 153, 221, 087, 224, 059.
224
Stat Trek Random Number Generator, Retrieved on 10 May 2012 from
<http://www.stattrek.com/sampling/statistics/random-number-generator.aspx>.

115
4.8.4 Questionnaire Survey After the sample was selected randomly as explained
above, their addresses were collected from the PCMC MIDC R&D 2010-11, and
cross-checked with the Pimpri Chinchwad Small Industries Association directory
2009-10 as well as on the internet (wherever data was available). Questionnaires were
sent out initially by normal mail to the official addresses as they appeared in these
directories to all 108 sample units. A covering letter was attached to the
questionnaires as well as a self-addressed stamped envelope (for their replies). Some
questionnaires were returned saying that the addressee had moved out or address not
found. Not a single respondent replied.
Next it was decided to try a more personal approach. Contact numbers of the
respondents were collected and the researcher personally called the respondents,
introduced himself and the research subject, and asked whether they were willing to
participate in the survey. In a number of cases, these were landline numbers and were
answered by the office staff who would not commit anything, and in some cases the
numbers had changed. A few owners hesitatingly accepted without committing to any
firm dates, but the majority excused themselves quoting they were busy and had no
time for surveys of any kind.
Finally the researcher established contact with the Pimpri Chinchwad area
Regional Manager of Bank of Maharashtra (BOM) Mr AD Deshpande through a
mutual acquaintance and gave him the list of sample units. He checked with his eight
branch managers of PCMC area and after confirmation that 69 of these 108 MSMEs
were their clients, requested them to refer the researcher to these MSME owners for
research survey. All this consumed more than nine months‟ time, but the survey
process could be started meaningfully for the first time in February 2013. Through the
Bank of Maharashtra (BOM) reference, and with some references from the MCCIA
office bearers the researcher could collect data from 100 out of the 108 sample units.
The 69 owner managers referred by the BOM could refer the researcher to another 21
sample units through their personal contacts, and another 10 units could be contacted
through the offices of the MCCIA Pune, thus allowing the researcher to obtain data
from 100 sample units which is three more than the originally selected number of 97
from the Penn State Tipsheet#60. The researcher personally visited the MSMEs, and
filled up the questionnaires after speaking with the owners. In a number of cases,

116
especially in micro and smaller enterprises, the owners had a number of doubts about
the terminology used in the questionnaire for various types of employee
competencies, but once explained they did not take much time in answering the
questions.
4.9 Statistical Tools and Techniques
Detailed description about the statistical tools and techniques used for this
study are given below.
4.9.1 Validity and Reliability of the Tools Used By „validity‟ is meant the success
of a method in probing and / or assessing what it sets out to probe / assess (Taylor et
al. 2011 p.2). Validity depends upon the fidelity with which it measures what it
purports to measure (Best, 1983, pp.198-199)225
. A test is valid when the
performances which it measures correspond to the same performances as otherwise
independently measured or objectively defined. The survey questionnaire was
prepared with the particular purpose of identifying the employee competency factors
driving profitability of MSMEs. So the statements included in the questionnaire were
related to various areas influencing employee competencies. The validity of the
questionnaire was therefore determined by depending on the judgement of MSME
owner-managers and the panel of experts.
Validity of the Questionnaire was assessed through two approaches, viz.
content validity and construct validity. Content validity is the extent to which a
measuring instrument provides „adequate coverage‟ of the topic under study (Kothari
2009 p.74). There is no numerical way to express content validity. There are two
common varieties of content validity: face validity and sampling validity.
Face validity concerns the extent to which it measures that which it appears to
measure according to the researcher‟s subjective assessment. All the items of the
instrument are supposed to have a common relevant thread (Taylor et al. 2011, p.2).
After making up the survey questionnaire and the structured interview questions, the
researcher reviewed each statement to assess its content as to the extent to which it is
related to „effect of employee competencies on profitability of MSMEs‟. To ascertain
this assessment, the researcher consulted a number of subject experts. The panel of
225
Best, J.W. (1983). Research in Education( 4th
ed.). Prentice Hall of India, New Delhi, 198-199.

117
experts questioned the relevance of Question 19 about the impact of various
management aspects like Financial, Marketing, HR etc. The researcher explained that
since „employee competencies‟ form part of HRM, it would be relevant to understand
what the respondents felt about the relative importance of HRM as compared to the
other management domains financial, operations, marketing etc. regarding its impact
on „profitability‟. This would help in meeting one of the objectives, which was to
recommend measures for enhancing profitability of MSMEs through better utilisation
of HR driven employee competency factors. The panel accepted this logic and agreed
to retain it as a part of the questionnaire though it directly does not assist in testing
any of the hypotheses.
Sampling validity assesses whether a given population of situations is
adequately sampled by the measuring instrument, that is, does the content of the
instrument adequately represent the content population of the property being
measured. The underlying assumption of sampling validity is that every variable has a
content population consisting of an infinite number of items (statements, questions, or
indicators) and that a highly valid instrument constitutes a representative sample of
these items. The employee competencies (15 competencies) that could enhance
profitability of MSMEs were determined by consulting MSME owners, MSME
experts of MCCIA and CII, and interviewing DIC authorities. In addition, all the
literature available and listed in Chapters 1 and 2 on MSMEs were also referred
during preparation of the questionnaire. The competencies were selected over the
complete range of employee competency factors under all three heads of value-based
organisational core competencies, leadership and managerial competencies, and
functional competencies. The sample units were also selected by stratified
proportionate sampling from all six strata of MSMEs. These measures ensured that
the research methodology covered all relevant factors regarding employee
competencies and profitability of MSMEs (Best and Kahn, 1999, p.219)226
. So the
data collection tools had content validity.
Construct validity involves relating a measuring instrument to an overall
theoretical framework in order to determine whether the instrument is tied to the
226
Best, J.W. and Kahn, J. V. (1999). Research in Education (7th
ed.). Prentice Hall of India, New
Delhi, 219.

118
concepts and theoretical assumptions that are employed. Cronbach and Meehl
(1955)227
, early proponents of construct validity, have observed that “whenever a
tester asks what a score means psychologically or what causes a person to get a
certain test score, he is asking, what concepts may properly be used to interpret the
test performance.” The theoretical notions one has about the property being measured
lead the investigator to postulate various kinds and degrees of relationships between
the property and other specified variables. In order to demonstrate construct validity
of a measuring instrument, an investigator has to show that these relationships do in
fact hold. Cronbach and Meehl (1955) described the logical process of construct
validation in the following way: “first, a proposition that an instrument measures a
certain property – say, property A – is set forth; second, the proposition is inserted
into the present theory of property A; third, working through the theory, one predicts
other properties that should be related to the instrument and properties that should
exhibit no relation to the instrument; finally one collects data that empirically confirm
or reject the predicted relations. If the anticipated relationships are found, the
instrument is considered valid.”
The items in the test were prepared by the investigator with the help of the
guide and experts in MSMEs. The statements were constructed in such a way that all
respondents could understand them easily. The generated nature of the items enabled
the respondents to answer them appropriately. The construct of each item was based
on the purpose of the study. The basic concept was that the performance of MSMEs
in India was seriously affected due to lack of properly skilled manpower with
appropriate competencies. The purpose of this was accordingly framed to identify the
employee competency factors that would contribute towards greater profitability of
MSMEs. The pilot study conducted earlier showed that the measuring instrument was
able to confirm the predicted relations. Therefore, it could be assumed that construct
validity of the test was achieved.
Reliability is a criterion that refers to the consistency of data stemming from
the use of a particular research method (Taylor et al. 2011 p. 3). Reliability addresses
the issue of whether the instrument will produce the same results each time it is
227
Cronbach, L.J. and Meehl, P. (1955). Construct Validity in Psychological Tests. Psychological
Bulletin, 52(1955), 281-302.

119
administered to the same person in the same setting (George and Mallery 2011
p.222)228
. A measure is reliable to the extent that repeated application of it under the
same conditions give the same result. The results of the pilot study were subjected to
the Cronbach Alpha reliability test. Cronbach‟s Alpha is designed as a measure of
internal consistency; that is, do all items within the instrument measure the same
thing? Based on the formula: Alpha Value = rk / (1+ (k-1) r), where „k‟ is the number
of variables considered, and „r‟ is the mean of the inter-item correlations. The Alpha
value is inflated by a larger number of variables and hence there is no set
interpretation as to what is an acceptable alpha value. The Alpha value varies between
0 and 1. A rule of thumb given out in (George and Mallery 2011, p. 231) states that a
value more than 0.9 indicates excellent reliability, more than 0.8 is good, and more
than 0.7 is acceptable. The pilot study data had an Alpha Value of 0.866 which
indicated that the survey questionnaire had good reliability. The data collected from
the main sample of 100 respondents was also subjected to Cronbach Alpha reliability
test, whose details will be discussed in the next chapter on data analysis.
4.9.2 Statistical Techniques Used
4.9.2.1 Goals of Data Analysis There were four principal goals of data analysis
(Taylor et al. 2011 pp.135 – 136):
Goal 1: How could we get a „feel‟ for our results, measures or responses? It was
desirable as a first step to gain an understanding of the character, the shape, of each
variable of the data set.
Goal 2: What were average values of the research variables and how much variability
was there?
Goal 3: To what extent were different variables related to each other? This was
basically looking for relevant correlations.
Goal 4: To what extent were discernible patterns statistically significant? Goal 4 was
primarily focused on hypothesis testing with some support from Goal 3.
4.9.2.2 Goals 1 and 2 Goals 1 and 2 were addressed together for which the following
statistical techniques were employed to analyse the data:-
228
George, M. and Mallery, P. (2011). SPSS for Windows Step by Step: A Simple Guide and Reference
17.0 Update (10th
ed.). Dorling Kindersley (India) Publishing. Pearson Education, 222.

120
Arithmetic Mean, Median, Standard Deviation and Skewness using standard formula
to study the nature of scores. These were complemented by bar charts. Examination
of pilot study data indicated that it was not normally distributed to the required extent.
Because of this non-normality, and due to likert scale being ordinal in nature, non-
parametric tests were used. Kolmogorov-Smirnov one-sample test for non-parametric
data was used to determine the normality of distribution (McMahon 2001)229
. A
significance less than 0.05 indicated that the distribution was indeed non-normal and
accordingly, balance of the non-parametric tests could be used.
4.9.2.3 Goal 3 Identification of connections between variables (Goal 3) was the next
step. Since scatter diagrams of the pilot study data did not show any evidence of a
non-linear correlation, nor were there extreme outliers, correlation coefficients were
calculated. Spearman‟s correlation coefficients (a non-parametric equivalent to the
Pearson‟s correlation coefficients) were obtained to examine correlations.
4.9.2.4 Goal 4 Hypothesis Testing Finally, the most important Goal 4 of
ascertaining aspects of statistical significance was undertaken. Following tests were
conducted:-
Cronbach Alpha Reliability test was implemented as explained earlier to establish
consistency of data collected;
Non-parametric tests: More than one non-parametric tests were adopted as these are
inherently weaker than their parametric equivalents, and more than one positive result
would help in confirming the hypothesis better.
H1 and H5 (involving one independent variable): Mann-Whitney rank-sum U test was
used as a non-parametric equivalent of t-test for all variables. However, its primary
application was for testing Hypotheses 1 and 5 involving Questions 12-13 and
Questions 12-18 respectively, in which there was only one independent variable, for
which there was no other appropriate non-parametric test.
H1 to H5 (involving one or more than one independent variable): One-Sample Chi-
Square test in place of the traditional Chi-Square test of cross-tabulated parametric
data, to test the lack of independence between the independent and dependent
229
McMahon, G.P.R. (2001). Business growth and performance and the financial reporting practices
of manufacturing small and medium enterprises. Journal of Small Business Development. School of
Commerce, Research Paper Series, 98-7, ISSN 1441-3906.

121
variables of all the hypotheses. This would be in support to the other hypotheses tests,
but primarily for the Mann-Whitney rank-sum U test.
H2, H3 and H4 (involving more than one independent variable): Friedman One-way
ANOVA in place of the traditional ANOVA which tests whether three or more groups
differ significantly from each other. Since this test alone would not be strong enough,
it was decided to supplement it with a Regression analysis which could be applied to
non-normal data. Logistic Regression analysis was selected in place of the traditional
Multiple Regression analysis as the dependent variable „profitability‟ was
dichotomous i.e. „profitable‟ or „not profitable‟.
The effect of independent variable „overall competency level‟, with external variables
like „type‟ and „size‟ of business, „attrition level‟ and „hiring of qualified managers‟
on the dependent variable „profitability‟ was subjected to logistic regression test to
examine the effect of extraneous variables on H1.
Hypotheses Tests’ Confirmation - Causal Path Analysis: Bento & Bento (2004)230
have recommended use of Causal Path Analysis techniques for testing causality of all
research data. Being non-parametric, it was decided to test this research data by
assigning partial correlation coefficients to all the variables, and drawing a Causal
Path Diagram with the Ordinal Partial Coefficients to confirm the hypotheses tests.
Factor Analysis: Finally, Factor Analysis was completed to identify a smaller
number of factors that could be used to represent relationships among sets of inter-
related variables. This would also indicate the factors that should be pursued for
improving the performance of MSMEs in India.
4.10 Mechanism to Assure Quality of the Study
Quality of this study could be ensured by maintaining control of bias and by
following the scientific method. Research methodology was implemented
systematically and rigorously by diligently following the laid down stages of research.
Firstly research guide and subject experts were consulted regularly to obtain advice
whenever in doubt. Literature review was comprehensive with almost 240 sources
230
Bento, A. & Bento, R. (2004). The Use of Causal Analysis Techniques in Information Systems
Research: A Methodological Note. Journal of Information Technology Management. (XV,3-4).
ISSN#1042-1319.

122
being referred for obtaining relevant input for this subject, and to identify the research
gap and to arrive at the research problem. Thereafter Hypotheses were formulated
based on the research gap and the study objectives. Survey method approach was
adopted as it was felt to be ideally suited for this type of social sciences research.
Utmost care was taken to ensure that the survey questionnaire was related to the
research question and hypotheses could be tested adequately. Pilot study was
conducted to test the survey questionnaire, and after pilot data analysis and having
consulted the experts, it was modified. It was ensured that the final questionnaire
consisted of relevant questions which could be easily answered by the respondents
and data could be analysed to test the various hypotheses. Sample was selected
randomly to maintain data reliability.
Data was collected personally by the researcher and they were immediately
tabulated in MS Excel format for checking their accuracy and completeness.
Collected data was stored in a safe place in the office so that they could be accessed
whenever necessary. Data analysis was implemented by the researcher himself by
understanding SPSS 17.0 package so that results of various tests could be confirmed
by more than one statistical test for every hypothesis to ensure dependability. All data
was initially checked by the Cronbach Alpha Reliability test before proceeding ahead
with the other tests for hypotheses. Since the survey used likert scale which was
ordinal data, and since the Kolmogorov-Smirnov one-sample test indicated non-
normality, non-parametric tests were used for hypotheses testing to maintain
dependability of test results.