Efficient Fabrication of Stable Graphene‐Molecule‐Graphene ...

Probing the Properties of the Molecular Adlayers on Metal
Substrates:
Scanning Tunneling Microscopy Study of Amine Adsorption on
Au(111) and Graphene Nanoislands on Co(0001)
Hui Zhou
Submitted in partial fulfillment of the
requirements for the degree of
Doctor of Philosophy
in the Graduate School of Arts and Science
COLUMBIA UNIVERSITY
2011

2011
Hui Zhou
All Rights Reserved

Abstract
Probing the Properties of the Molecular Adlayers on Metal Substrates:
Scanning Tunneling Microscopy Study of Amine Adsorption on Au(111) and
Graphene Nanoislands on Co(0001)
Hui Zhou
In this thesis, we present our findings on two major topics, both of which are studies of
molecules on metal surfaces by scanning tunneling microscopy (STM).
The first topic is on adsorption of a model amine compound, 1,4-benzenediamine (BDA),
on the reconstructed Au(111) surface, chosen for its potential application as a molecular
electronic device. The molecules were deposited in the gas phase onto the substrate in the
vacuum chamber. Five different patterns of BDA molecules on the surface at different
coverages, and the preferred adsorption sites of BDA molecules on reconstructed Au(111)
surface, were observed. In addition, BDA molecules were susceptible to tip-induced
movement, suggesting that BDA molecules on metal surfaces can be a potential candidate
in STM molecular manipulations.
We also studied graphene nanoislands on Co(0001) in the hope of understanding
interaction of expitaxially grown graphene and metal substrates. This topic can shed a
light on the potential application of graphene as an electronic device, especially in
spintronics. The graphene nanoislands were formed by annealing contorted

hexabenzocoronene (HBC) on the Co(0001) surface. In our experiments, we have
determined atop registry of graphene atoms with respect to the underlying Co surface. We
also investigated the low-energy electronic structures of graphene nanoislands by
scanning tunneling spectroscopy. The result was compared with a first-principle
calculation using density functional theory (DFT) which suggested strong coupling
between graphene -bands and cobalt d-electrons. We also observed that the islands
exhibit zigzag edges, which exhibits unique electronic structures compared with the
center areas of the islands.

i
Contents
1 Introduction to STM and Applications of STM………………………………1
1.1 Principles of the STM…………………..…………………………………2
1.1.1 The Concept of Tunneling………………..………………………… 2
1.1.2 The Theory of STM………………..…………………………………6
1.2 The Introduction of STS………………..…………………………………8
1.2.1 The Concept of STS………………..…………………………………8
1.2.2 The Theory of STS………………..…………………………………10
1.3 Atomic and Molecular Manipulation with the STM………………..……11
1.3.1 Sliding Process………………..…………………………………..…12
1.3.2 Field-Assisted Diffusion………………..………………...…………14
1.4 Inelastic-Tunneling-Induced Manipulation………………..….……….…18
1.5 Experiment Setup………………..………………………….……………19
1.5.1 STM Operations………………..………………………..…………..19
1.5.2 Molecule Dosing………………..……………………………….…..24
1.5.3 Tip Preparation………….……..…………………………………….26
1.6 Bibliography………………..…………………………………………..29
2 Au(111) Substrate and Preparation…………………………………………33
2.1 Introduction of Gold and Au(111) Surface………………………………34

ii
2.2 Au(111) Preparation……………………………………………………...41
2.3 Bibliography……………………………………………………………..44
3 Study of 1,4-benzenediamine Adsorption on Au(111)……………………..47
3.1 Abstract……………………….. ……………………………...…………47
3.2 Introduction………………………….. …………………….……………48
3.2.1 Introduction to SAMs………………………….. …………………..48
3.2.2 Introduction to the Break-junction Conductance Measurement…..49
3.2.3 Introduction to 1,4-benzenedimaine (BDA)………………………..52
3.3 Experiment Methods………………………….. ………………………..55
3.4 Results and Discussion………………………….. ……………………...56
3.4.1 Morphology of BDA on Au(111) …………………………………...56
3.4.2 Tip-induced movement of BDA on Au(111)………………………..69
3.5 Summary………………………….. ……………………………………76
3.6 Bibliography……………………….. ………………………...…………76
4 Graphene Nanoislands on Co(0001)…………………………………………81
4.1 Introductions……………….. …………………………….. ……………82
4.1.1 Introduction to Graphene and Graphene Nanoribbons……….…….82
4.1.2 Introduction to Cobalt (Co) ……………….. ……………………….87
4.2 Experimental and Calculation Methods……………….. ………………..91

iii
4.3 Results and Discussion……………….. …………………………….. …93
4.3.1 Structures of Graphene Nanoislands……………….. ………………93
4.3.2 Electronic Properties……………….. ………………………………99
4.3.3 Edge States……………….. ……………………………… ………105
4.4 Summary………………….. …………………………….. ……………106
4.5 Bibliography…..………….. …………………………….. ……………106

iv
List of Tables
Table 1: Selected physical properties of BDA……………………53

v
List of Figures
1.1 The difference between classical theory and quantum theory. ………………..…2
1.2: A one-dimensional metal-vacuum-metal tunneling junction. ……………..……4
1.3 Schematic picture of tunneling junction in Tersoff and Hamann analysis……….7
1.4 Energy diagram for the sample and the tip. . …………………. ……………..….9
1.5 Schematic picture of the sliding process for a xenon atom. . …………………..13
1.6 Schematic of the potential energy of an adsorbate on the surface as a function of the
lateral position. …………………………………………………………………16
1.7 Schematic of the behavior of the polarized adsorbate in the nonuniform electric field
induced by the STM tip. ………………………. …………………. …………17
1.8 Schematic depicting the essential steps in the theoretically modeling of single O2
molecule dissociation on Pt(111). . …………………. …………………………….18
1.9: Schematics of STM operation. . …………………. …………………………...21
1.10: A front view and a side view of Omicron LTSTM. . …………...……………23
1.11: Picture of 1,4-benznediamine (BDA) dosing line. . ………………………….26
1.12: Electrochemical etching of tungsten tips. . …………………. ………………28
2.1: Schematic of the crystal structure of bulk gold and the surface of
Au(111). ……………………………………………………………….…………..34
2.2: Schematic of the top three layers of the fcc and hcp structures. ………………36

vi
2.3: Hard sphere model of one stacking fault region in Au(111). ………………….37
2.4: STM topography of Au(111) surface. ……………...………………...………..38
2.5: Atomic resolution STM topography of Au(111) herringbone elbow sites and ridge
sites. …………………………………………………………………..………39
2.6: Triangle reconstruction STM topography of Au(111). ………….…………….40
2.7: Large-scale STM topography of Au surface transition through sputtering and
annealing ……………………………………………………………………………43
3.1: Schematic of the modified STM in Venkataraman’s measurements. …...…….50
3.2: Conductance measurement of clean Au, BDA, 1,4-benzenedithiol (BDT), and
1,4-benzenediisonitrile (BDI) in Venkataraman’s measurements. ……...………….52
3.3: Diagrams of BDA and two isomers. ……………………………….………….53
3.4: STM topographic images of BDA on Au(111) at different coverages. ……….58
3.5: Experimental results and models of individual BDA molecules on the Au(111)
surface. ………………………………………………………………….…………..59
3.6: STM images of the preferred adsorption sites of BDA molecules……..…..…..61
3.7: STM images of the preferred adsorption sites of BDA chain structures at low
coverage. ………………………………………………………………….…….…..63
3.8: Diagram of BDA molecule in the line structure. ……………………...……….64
3.9: STM images of the preferred adsorption sites of BDA network structure..........66
3.10: XPS spectra of N 1s and C 1s of BDA on Au(111) form a low to high

vii
coverage. …………………………………………………………………………....68
3.11: Sequential STM images of the same area under different bias voltage and
current..…………………………………………………………………….………..70
3.12: Sequential STM images of the same area of the line lattice..……..………….71
3.13: Sequential STM images of the same area before and after a voltage pulse......72
4.1: Schematic of the band structure of graphene near Fermi
level…………………………………………………………………………………854.2:
Schematic of the zigzag edges and armchair edges of
graphene…………………………………………………………………………….86
4.3: Schematic of the unit vectors in hcp crystals……………………………….….88
4.4: Schematic of hcp(0001) structures………………………….………………….89
4.5: STM topographic image of Co(0001) ........................................………………92
4.6: STM topographic images of as-deposited and after thermal annealing of
HBC/Co(0001)…………………………………………….………………………..94
4.7: STM topographic image of one graphene island and the corresponding height
profile on Co(0001)…………………………………………………………………96
4.8: STM topographic image of one graphene island and the schematics of possible
epitaxial growth models on Co(0001)………………………………………………98
4.9: Experimental differential conductance spectra, dI/dV, of Co(0001) and graphene
island/Co ………………………………………………………………………….100

viii
4.10: Calculated energy bands are density of states of graphene on Co(0001) in the AC
geometry………………………………………………………………………102
4.11: Comparison of calculated PDOS and experimental STS data of
graphene/Co(0001)……………………………………………………………...…103
4.12: STM topographic images, conductance map, and STS of graphene islands on
Co(0001)…………………………………………………………………………...104

ix
Acknowledgement
Seven years. Looking back, I found the journey as the most demanding task in my life. I
was lucky to have so many people’s hands on my way to the mountain top. Without
them, I don’t think I would have finally made it.
I owe my greatest gratitude to my advisor, Tony Heinz. He has been a guiding landmark
along the whole way, from the moment he admitted me to Columbia University to the
moment he saw me leave after defense. He not only set an example of hard-working, but
also showed the greatest patience with his students. Moreover, I would not been able to
find my life path without his encouragement and help during my final year as a student.
I also want to thank my husband, Dr. Jie Lin, for his biggest heart and support for
whatever decision I make. He is my emotional pillow and he is always there for me.
There are two people who taught me the most in experiment techniques. Dr. Daejin Eom
opened the door of STM to me and provided a continuous help with my experiment. Dr.
Zonghai Hu, whom I still owe a paper, showed selfless devotion into my project.
I am also grateful to a lot of other professors and colleagues in research. Prof. Flynn,
who has been my unofficial advisor in the Chemistry Department, provided a great sight

x
and continuous support for my project. Prof. Morgante taught me a lot of vaccum
techniques and helped me settle down on my trip to Italy. Prof. Venkataramen and her
student, Masha Kamenetska, along with Prof. Morgante’ student, Dr. Martina
Dell'angela filled me in with knowledge of benzenediamine. Dr. Kwang Taeg Rim set a
good example of consistency in research and his optimism often encouraged me. Prof.
Abhay Pasupathy often provided me some insightful discussions. Liuyan Zhao has been
a best friend and a great inspiration inside and outside of the lab.
I wish to thank the following teachers and colleagues for their wisdom and expertise:
Prof. Andrew Millis, Dr. Li Liu, Dr. Hao Wang, Dr. Hayn Park, Dr. Hugen Yan, Dr.
Yang Wu, Dr. Daohua Song, Dr. Joanna Atkin, Dr. Kin Fai Mak, Dr. Joshua Lui, Dr.
Sami Rosenblatt, Dr.G ina Florio, Dr. Mingyuan Huang and Dr. Scott Goncher.
Looking back, I realized that there are so many people I owe gratitude to. Thanks to all
of them, my seven years become so precious. I will take the attitude and skills they
taught me and continue my life journey.

1
Chapter 1
Introduction to STM and Applications of STM
The Scanning Tunneling Microscope (STM) was invented by Binnig and Rohrer in 1981
who shared the 1986 Nobel Prize in Physics[6]. It is a powerful instrument to image
surfaces at the atomic level, achieving a lateral resolution of 0.1nm and vertical
resolution of 0.01nm[12]. At this scale, individual atoms on the material surfaces can be
resolved. In this chapter, I will review the principles of the STM and its applications,
focusing on Scanning Tunneling Spectroscopy (STS) and atom/molecule manipulation
with STM.

Chapter 1. Introduction to STM and Applications of STM 2
1.1. Principle of the STM
1.1.1. The Concept of Tunneling
The operation of the STM is based on the phenomenon of quantum mechanical
tunneling. Imagine a potential barrier and a microscopic particle, e.g. an electron, with
energy smaller than the potential barrier, as illustrated in Figure 1.1. In classical
mechanics, the electron is confined by the barrier region; while in quantum mechanics,
Figure 1.1 The difference between classical theory and
quantum theory.
When U>E , in classical mechanics, the electron cannot overcome a barrier;
in quantum mechanics, the electron has a non-zero probability to tunnel through
the barrier [2] .

Chapter 1. Introduction to STM and Applications of STM 3
the electron can tunnel through the barrier. To illustrate the tunneling, we consider a
simplified one-dimensional model shown in Figure 1.2. In this case, the electron is
described by a wavefunction ( )x , which satisfies the one-dimensional Schrödinger
Equation.
2 2
2
( )( ) ( ) ( )
2
xU x x E x
m x
. (1.1)
Its solution in the classical forbidden region is:
( ) (0) xx e , (1.2)
where
2 ( )m U E
(1.3)
is the decay constant. Thus, the probability density through the barrier is proportional to
2 2| ( ) | | (0) | LL e , where L is the barrier width. Here we define a transmission
coefficient T, as the ratio of the transmitted current density and the incident current
density[10]. In a simplified junction with equal potentials on the tip and sample In
Figure 1.2b, T is given as:
2( )
(0)
xI xT e
I
.
(1.4)

Chapter 1. Introduction to STM and Applications of STM 4
A typical value for 1/ is about 0.1nm. Thus, according to Eq 1.4, the current decays
about 10 times, or one order of magnitude, when the tip-sample distance changes by
about 0.1nm. This gives STM spatial sensitivity on the atomic scale.
Figure 1.2: A one-dimensional metal-vacuum-metal tunneling
junction.
(a) Electrons can tunnel through vacuum (modeled with a potential barrier)
between the sample and the tip with a decayed wavefunction[2]. (b) A simplified
one-dimension model with equal potentials on both ends and a square potential
barrier.

Chapter 1. Introduction to STM and Applications of STM 5
In 1957, a more quantitative study was provided by Landauer[13] who used the
semiclassical WKB approximation to calculate the tunneling probability. It has two
important assumptions: First, the electrodes can be described by a one-dimensional free-
electron gas in an ideal square potential well. Second, the current is ballistic, which
means the current is the product of the density of the electron and the classical velocity
in the electrodes. When no bias voltage is applied, the electrons from either the sample
or the tip have equal tunneling probability to the other side through the vacuum which
leads to zero net tunneling current. When a negative sample bias is applied, a difference
of the Fermi levels of two electrodes is generated and a net current flows. As a result,
we observe a single-channel current of:
22
t
eI VT
h
, (1.5)
where T is the tunneling coefficient, which can be calculated in the WKB approximation.
The tunneling conductance G is defined as:
2
0
2tI eG T G T
V h
, (1.6)
where the conductance quantum 0G is given by:
2
0
277.48
eG S
h
. (1.7)
If we assume the vacuum can be approximated by a square potential barrier, then
2 xT e , and

Chapter 1. Introduction to STM and Applications of STM 6
2
0
xG G e . (1.8)
In practice, the transmission coefficient T is complicated by the tip geometry and the
surface electronic structure[8, 9]. But the general tendency of 2 xT e remains the
same.
1.1.2. The Theory of STM
One widely used theory for the tunneling phenomenon in solids, as well as in STM is
Bardeen Tunneling Theory. Bardeen first introduced the following tunneling
approximation[14]:
2
,
2( )[1 ( )] | | ( )v v
eI f E f E eV M E E
,
(1.9)
where f(E) is the Fermi distribution function, V is the applied voltage, and M is the
tunneling matrix element between the states of the probe and those of the surface (
denotes a state of one electrode and denotes a state of the other). Note that the
reference point of zero energy is the Fermi level. M is given by
2
* *S ( )2
M dm
, (1.10)
where E and E are the energies corresponding to and , respectively, and the
integral is over the entire surface within the vacuum barrier region.

Chapter 1. Introduction to STM and Applications of STM 7
By introducing the density of states of both electrodes, Eq 1.9 can be rewritten as:
24
| | ( ) ( )[ ( ) ( )]s t
eI M E E eV f E eV f E dE
,
(1.11)
where s denotes the sample, and t denotes the tip. M is the tunneling matrix element
defined in Equation 1.10. This equation indicates that the tunneling currently is directly
related to the local density of states (LDOS) of the surface at the Fermi level.
Later on, further refinements were made for the theory of STM. For example, Tersoff
and Hamann[8, 9] modeled the tip with an s-wave approximation ( ) for a spherical
Figure 1.3 Schematic picture of tunneling junction in Tersoff
and Hamann analysis[8, 9].
The tip is modeled as a spherical object with radius R and the center ro. The
tip and sample distance is d.

Chapter 1. Introduction to STM and Applications of STM 8
object and the surface with a general expansion of Bloch functions ( ) (See Fig. 1.3).
They obtained the following simplified formula:
3 1 2 2 2 4 2 2
032 ( ) | ( ) | ( )R
t F v FI e V D E R e r E E
,
(1.12)
where tD is the density of states per unit volume of the tip. Through these advances,
STM theory can be applied towards the understanding of some experimental data.
1.2. The Introduction of STS
1.2.1. The Concept of STS
Lang[15] proposed the following picture at zero temperature (Fig 1.4). At zero bias, the
Fermi levels of the sample and tip are equal. When a positive sample bias is applied, a
net tunneling current arises from tunneling electrons from the occupied states of the tip
to the unoccupied states of the surface, whereas when a negative sample bias applied,
there is a net current tunnel from occupied states of the sample into unoccupied states of
the tip. As a result, the polarity of the sample bias determines whether the occupied
states or the unoccupied states of the sample are probed. This is the idea of Scanning
Tunneling Spectroscopy (STS).

Chapter 1. Introduction to STM and Applications of STM 9
Figure 1.4 Energy diagram for the sample and the tip.
(a) Independent sample and tip. (b) Sample and tip at equilibrium, separated by
small vacuum gap. (c) Positive sample bias: electrons tunnel from tip to sample. (d)
Negative sample bias: electrons tunnel from sample into tip. [10, 11]

Chapter 1. Introduction to STM and Applications of STM 10
In practice, we can obtain STS by observing the variation of the tunneling current I as a
function of the bias V, while the tip is held at a fixed height over the sample. It provides
an I-V curve which can be numerically differentiated to a dI/dV curve. Or we can also
directly obtained dI/dV by using a modulation technique with a lock-in amplifier.
1.2.2. The Theory of STS
Here we follow the analysis of Chen [2]. For simplicity, we only consider the condition
when the bias is small. Therefore, the tunneling matrix element can be approximated by
a constant. We further assume that the density of states of the tip is independent of
energy. Therefore, in Eq. 1.11, we can take both the matrix element and the density of
states of the tip out of the integral to obtain:
24| | ( )[ ( ) ( )]t s
eI M E f E eV f E dE
. (1.13)
If the temperature is not very high, the distribution function satisfies a step function,
thus:
1, 0 ,
( ) ( )0, .
E eVf E eV f E
otherwise
(1.14)
Combining Eq. 1.13 and Eq. 14, we can get:
0
( )
eV
sI E dE , (1.15)

Chapter 1. Introduction to STM and Applications of STM 11
or,
( )s
dIE
dV
. (1.16)
Thus, within those approximations, the differential conductance is directly proportional
to the LDOS of the surface.
1.3. Atomic and Molecular Manipulation with the STM
Since the early 1990s, the application of STM has made possible manipulation of
individual atoms and molecules on the surface. An early demonstration of these
capabilities was provided by Eigler and Schwerzer[1] who constructed an IBM logo
with individual Xe atoms on Ni(110). Using STM manipulation techniques, one can
construct quantum structures on an atom-by-atom basis, synthesize single molecules on
a one-molecule-at-a-time-basis, and access single atom/molecule properties, as reviewed
in Hla and Bai [12, 16].
A variety of different atomic/molecular manipulation processes with STM have now
been realized. We can divide the processes into two classes in terms of the location of
the manipulated atoms/molecules: parallel processes and vertical processes[4]. In
parallel processes, the motion of the adsorbed atoms/molecules is parallel to the surface,
i.e., they remain on the surface. While in vertical processes, atoms/molecules can be

Chapter 1. Introduction to STM and Applications of STM 12
transferred from the tip to surface, or vice versa. Here I will only focus on the parallel
processes.
The parallel processes can be further divided into three categories by the mechanisms of
the motion: sliding processes, field-assisted diffusion, and inelastic-electron tunneling
(IET) induced manipulation. The corresponding manipulation mechanisms are chemical
forces, electric fields, and tunneling electrons, respectively.
1.3.1. Sliding Process
The STM tip always exerts a force on an adsorbate bound to the surface. By adjusting
the position of the tip, we can tune the magnitude and direction of the force. Thus, there
is a potential to manipulate the adsorbate by pulling it across the surface. This is called a
sliding process[4, 17].
A typical sliding process involves three steps: (1) vertically approaching the tip toward
the adsorbate until the tip-adsorbate is close enough, (2) sliding the tip across the surface
with the same tip-adsorbate distance, dragging the adsorbate along, and (3) retracting the
tip away from the surface, leaving the adsorbate on the surface. (See Figure 1.5) Since
the first observed sliding process reported on Xenon/ Ni(110)[1], it has been extended to
many other systems, e.g. Fe/Cu(111)[18], Co/Cu(111)[19], and Pb on Cu(111)[20].

Chapter 1. Introduction to STM and Applications of STM 13
In most of those sliding process, the motion of the adsorbates is not sensitive to the sign
or magnitude of the electric field, the voltage, or the current. It is only dependent on the
tip-sample separation. In the case of a silver atom sliding on Ag(111)[21], the distance is
1.9Å between the edges of van der Waals radii of tip apex and the manipulated
adsorbate. At this distance, the atomic orbitals of the tip apex and the adsorbate are
overlapping and a weak chemical bond is formed, which is believed to be the
mechanism of the atom/molecule motion in the sliding process.
Manipulation of single atoms/molecules on surfaces allows the construction of artificial
quantum structures and the study of the novel phenomena associated with these
structures. In addition, the possibility of constructing microscopic circuits has been
Figure 1.5 Schematic picture of the sliding process for a
xenon atom[1].
(a) The adsorbate is located on the surface and the tip is placed directly over it.
The tip is lowered to the position (b), where the adsorbate-tip attractive force is
sufficient to keep the adsorbate located beneath the tip when the tip is
subsequently moved across the surface (c) to the desired location (d). Finally the
tip is withdrawn to position (e).

Chapter 1. Introduction to STM and Applications of STM 14
demonstrated. For example, Heinrich constructed a type of logic gate with
CO/Cu(111)[19].
1.3.2. Field-Assisted Diffusion
There is a strong electric field between the tip and the surface in the normal STM
scanning. This may induce field-assisted diffusion. Let us start by examining how close
the tip is located near the sample in our case. In the previous section (Eq 1.8), we
obtained a simple relation between conductance and the tip-sample distance:
2
0
zG G e with2
0
277.48
eG S
h , where is a constant of order 1 in the limit of
1Z [2]. z is the tip-sample distance where 0z is defined when the tip is in a
single-atom contact with the sample. 2 ( )m U E
is the decay constant. Take the
vacuum level as the reference point of energy, E , where is the work function.
For simplicity, we take the average of the work functions of the tip and the sample,
which is typical around 5eV. U is the applied bias and much smaller than the work
functions. So
1 15.1 ( ) 11.4eV nm nm . (1.17)
Under scanning conditions of 1U V and 0.1I nA , 0.1G nS . Then
o
5.4Az . (1.18)

Chapter 1. Introduction to STM and Applications of STM 15
The tip-sample distance z obtained by this simple analysis matches STM measurements
[22-24].
If we use a rough estimation of /E U z , the electric field is roughly on the order of 0.2
/ AV . Under the real STM imaging conditions, due to the asymmetrical geometry, the
electric field is inhomogeneous and concentrated in the vicinity of the tip. With a similar
tip-sample distance and a bias of 1 to 10V, the electrical field strength is in the range
from 0.2 to 2 / AV , as obtained by simulation[22]. Such large electrical fields approach
those required for the ionization or desorption of an atom, which is around 3 to 5 / AV .
The fields may also be large enough for field-assisted migration of adsorbates.
When an atom/molecule is adsorbed on the surface, it may have a static dipole or a
dipole induced by the electric filed. As a first approximation,
p E , (1.19)
where is the permanent dipole moment, is the polarizability of the adsorbate. As a
result, the electric potential energy is given as
21( ) ( ) ( )
2U r E r E r . (1.20)

Chapter 1. Introduction to STM and Applications of STM 16
This potential energy is added to the periodic potential of the surface (Fig 1.6).
Note that there are two terms in the equation. If the second term dominates, then the
adsorbate will always to be attracted to the tip. When the first term dominates, the
orientation of the dipole moment remains unchanged, causing the direction of the
adsorbate motion to reverse with the bias polarity, as shown in Figure 1.7.
Figure 1.6 Schematic of the potential energy of an adsorbate
on the surface as a function of the lateral position[4].
The tip is shown as the red solid object on the top. The interaction of the
adsorbate and the surface atoms gives rise to a periodic potential energy (shown
in blue). The interaction of the tip-induced electric field and the adsorbate gives
rise to a broad potential well. Adding these two potentials together leads to a
broad potential well located beneath the tip with periodic oscillations. The
adsorbate is drawn as the green ball.

Chapter 1. Introduction to STM and Applications of STM 17
A number of field-assisted diffusion experiments with STM have been reported.
Depending on the relative magnitudes of the first (static dipole) and second (induced
dipole) term in Eq 1.20, different types of behavior have been observed [4, 7, 16, 23-30].
When the induced dipole dominates, the adsorbate will be attracted to the tip
irrespective of the polarity[29]. When the static dipole term dominates, such as
thallium/Si(100) and In/Si(100)[7, 25], the adsorbates diffuse in opposite directions at
different bias. For Cs atoms on GaAs and InSb(110) surfaces, the two terms are of
comparable magnitude and the diffusion towards the tip only takes place at positive
bias[26].
Figure 1.7 Schematic of the behavior of the polarized
adsorbate in the nonuniform electric field induced by the STM
tip[7].
The adsorbate has a downward dipole after charge transfer with the surface.
(a) At a positive sample bias, the electric field direction is pointing from the
surface to the tip with a parallel component pointing inward to the tip apex,
causing the adsorbate to migrate inward.

Chapter 1. Introduction to STM and Applications of STM 18
1.3.3. Inelastic-Tunneling-Induced Manipulation
Controlled excitations of atoms/molecules by using inelastic-electron tunneling induced
manipulation processes have also been observed [3, 16, 31-40]. In this type of process,
the tunneling electron energy is transferred to the adsorbate through a resonance state[37]
no matter whether the current is tunneling from the tip to the surface or vice versa. The
maximum available energy is determined by the bias, so atomic/molecular excitation
usually exhibits a sudden onset at a threshold bias. The excitation rate can be varied by
changing the current due to the change of the number of electrons tunneling.
For molecular excitations, different excitation modes can be induced, such as rotational,
vibrational, and electronic excitation. In addition, bonding breaking and bond formation
Figure 1.8 Schematic depicting the essential steps in the
theoretically modeling of single O2 molecule dissociation on
Pt(111).[3]
(a) Vibrational relaxation occurs due to energy transfer from the tunneling
electron. (b) The number of electrons needed to break the bond for different
microscopic processes.

Chapter 1. Introduction to STM and Applications of STM 19
can also be realized. As shown in Fig 1.8, a tunneling electron inelastically scatters from
an adsorbed molecule and transfers energy to the vibrational modes of the molecule.
Then an energy barrier of bonding-breaking/formation needs to overcome via one or
multiple vibrational excitations in the ground excitation states.
In some cases, the excitation modes will also decay into parallel motion. Take
vibrational excitation as an example [39, 40]. When a tunneling electron is injected into
the unoccupied states of an adsorbate, the molecule forms a temporary ionic state. When
the electron then tunnels into the substrate, the molecule goes back to the neutral state.
During the process, the nuclear positions of the molecule could be changed due to the
Coulomb potential change, which leads to the excitation of vibrations. After this, the
vibrational excited state can decay with two ways. One is to decay directly to an
electron-hole pair, the other is to decay into a low-frequency translational mode, which
is associated with the lateral motion of the molecules.
The injected the electrons can be tuned to selectively excite different modes of the
adsorbate. For example, by selecting different pulse conditions for ammonia on Cu(100),
Pascual et al.[34] could activate either the molecule stretching vibration or the inversion
mode.
1.4. Experiment Setup
1.4.1. STM operations

Chapter 1. Introduction to STM and Applications of STM 20
The schematic of the basic STM operation is shown in Figure 1.9. The sample is
grounded, a tunneling bias Vgap is applied to the tip, and a tunneling current is detected
through a current amplifier. The control of the tip movement along x, y, and z-direction
is realized by the piezos on which the tip is mounted. When a voltage is applied to a
piezo, a mechanical deformation occurs, leading to the tip movement. This is called the
inverse piezoelectric effect[2]. The piezoelectric strain coefficient can reach the order of
10-10
m/V, which enables precise control of the tip-sample distance in STM
measurements.
The feedback circuit works differently in different modes: constant-height mode and
constant-current mode. In both of the modes, the tip moves in the x and y direction by
the control of the x, y-piezo. In the constant-height mode, the tip is kept at a fixed height,
and the current is converted to voltage by the amplifier and recorded. In the constant-
current scanning mode, the current is converted to voltage and then compared with the
reference voltage. If the tunneling current is larger than the setpoint, then the voltage
applied to the z-piezo will withdraw the tip from the surface, and vice versa. In this way,
the tip can accurately follow the constant tunneling current contour at a high speed
without the danger of crashing the tip. Therefore, it is more popular than the constant-
height mode.

Chapter 1. Introduction to STM and Applications of STM 21
Another key issue in STM operations is vibration isolation. For metal surfaces, the
atomic corrugation can be of the order of 0.01nm. Therefore, the tip-sample distance
change caused by vibrations must be under picometer scale. In our STM, the vibration
isolation is realized through three stages. The first stage is through a pneumatic system,
isolating the whole chamber from the floor, which can isolate vibrations above its
natural frequency of 1-2 Hz[2]. Secondly, the scanning stage of the STM is suspended
Figure 1.9: Schematics of STM operation.
Sample is grounded and the tip is biased. The tunneling current is detected
with the amplification of an amplifier. The movement of the tip is controlled by
the underneath piezos.

Chapter 1. Introduction to STM and Applications of STM 22
from the rest of chamber with springs, further isolating the scanning stage from the rest
of the chamber above their natural frequency (typically 1-6 Hz[10]). Finally, the STM
stage is also equipped with an eddy-current damper. When the metal pieces move
relative to the magnetic field, damping forces are generated by eddy currents induced in
the metal pieces, stabilizing the vibration of the system. Combining all three damping
systems, the vibration is well controlled under picometer scale.
The STM used in our studies is an Omicron Low-temperature STM. It is capable of
making measurements at a temperature as low as 5K. The entire chamber is divided into
three smaller chambers by gate valves. Each chamber is pumped by ion pump or turbo
pump/mechanical pump and can reach a pressure of 10-11
Torr.
In Figure 1.10a, the left tall chamber is the STM chamber with two cryostats and a
sample-stage couter-heater. If the scanning temperature is around 77K, then both of the
cryostats are filled with liquid nitrogen; if the scanning temperature is around 5K, then
the inner cryostat is filled with liquid helium and the outer one with liquid nitrogen. For
any other specific temperature, pumping or counter-heating is necessary.
The right smaller chamber in Figure 1.10a is the preparation chamber, which is
equipped with LEED (low energy electron diffraction), Auger spectrometer, heaters,
sputtering gun, mass spectrometer and a few leak valves that can allow gas dosage into
the chamber. LEED detects the structure of the top few layers of the sample surface.

Chapter 1. Introduction to STM and Applications of STM 23
Auger spectrometer measures the chemical components and their portions of the surface.
Mass spectrometer analyzes the mass/charge ratio of the gas in the chamber. In our
experiments, we perform the surface preparation and characterizations in this chamber.
For example, the precut Au(111) is sputtered and annealed, and then it is characterized
Figure 1.10: A front view and a side view of Omicron LTSTM.
(a) A front view picture and (b) a side view picture of Omicron LTSTM. The
chambers are labeled in the picture.

Chapter 1. Introduction to STM and Applications of STM 24
by LEED and Auger spectrometer in this chamber. We then transfer the sample to the
STM chamber after a clean surface and an ordered structure is obtained. We can also
introduce gases into this chamber via leak valves and deposit them onto the samples in
this chamber.
On the side of the preparation chamber, there is a loadlock (shown in Figure 1.10b). As
the name implies, the samples are loaded through it from ambient to the preparation
chamber. Sometimes, we also dose large molecules with higher evaporation temperature
in this chamber.
1.4.2. Molecule Dosing
There is an important unit used in dosing molecule: Langmuir, which is described by
multiplying the pressure of the dosing gas and the dosing time. One Langmuir
corresponds to an exposure of one second to a gas with a pressure of 10-6
Torr[41, 42].
For example, if the dosing pressure is 10-8
Torr and the dosing time is 100 seconds, we
get one Langmuir dosage. From kinetic theory[43], the rate of the gas molecule
impinging on the surface is given by:
22
2 13.51 10 ( )
2
dN P P Torrcm s
dt MkT MT
, (1.21)
where M is the gas molecule mass in a.m.u., T is the temperature in Kevin, and P is the
pressure in Torr. As an example, if we dose CO molecules of M=28, at a pressure of

Chapter 1. Introduction to STM and Applications of STM 25
610 Torr and a temperature of 300K,
14 2 13.8 10dN
cm sdt
. If every impinging gas
molecule sticks to the surface, then within one second, the total number of the gas
molecules on the surface is 14 23.8 10N cm , which is comparable to the surface atom
density, 2
23 3 15 23~ (10 ) ~10cm cm . Therefore, one Langmuir corresponds to roughly one
monolayer of coverage. In practice, the sticking coefficient might be lower than the
ideal situation which makes a precise estimation difficult.
In our experiments, there are two ways to dose molecules. For the 1,4-benzenediamine
(BDA) case, we dosed the molecules through a leak valve to the preparation chamber
where the sample is sitting. As shown in Figure 1.11, BDA is bottled in a glass cylinder
outside of the preparation chamber. One side of it is pumped by turbo pump/mechanical
pump; the other side is connected to the preparation chamber via a leak valve. In order
to increase the vapor pressure, the sample is heated to 100oC while dosing. For the
contorted hexabenzocoronene (HBC) case, the sample is brought to the loadlock where
the molecule is thermally heated to 605K.

Chapter 1. Introduction to STM and Applications of STM 26
1.4.3. Tip preparation
As mentioned above, the atomically sharp tip is very important to the imaging quality.
In our study, we used the electro-mechanical etching method, which is by now a
standard method in tip preparation[2] .
In this method, the tungsten wire is connected to the anode, and a metal cylinder is
immersed in the solution as a cathode (see Figure 1.12a). The wire is lowered into the
Figure 1.11: Picture of 1,4-benznediamine (BDA) dosing line.
The BDA molecules are bottled in a glass cylinder in a red circle and
connected to pumps on one side and the preparation chamber via a leak valve (in
a red circle) on the other side.

Chapter 1. Introduction to STM and Applications of STM 27
solution until a meniscus is formed (Figure 1.12b). The meniscus is a key factor to
determine the shape and length of the tip end. The etching speed at the top of the
meniscus is lower than that of the bottom due to a concentration gradient of OH- ions[5].
As a result, a neck is formed on the wire at the interface of air and the solution and it
becomes thinner and thinner. Eventually the wire will break due to the gravity of the
lower part of the wire. In this way, two tips from the top portion and the bottom portion
are made simultaneous. The overall electrochemical reaction[2] is:
Cathode: 2 26 6 3 ( ) 6H O e H OH
Anode: 2
4 28 4 6W OH WO H O e
Total: 2
2 4 22 2 3 ( )W OH H O WO H
In our experiment, we replace the metal cylinder by a platinum wire (see Figure 1.12c)
and use a thin membrane of the solution to etch the tip. We found it work best with a DC
current of 3-5V, a polycrystalline tungsten wire of 2.5mm diameter, and a 3 mol/L
NaOH solution. As mentioned above, we could make two tips at one time. The bottom
tip is usually sharper and longer than the top one, and therefore can reach atomic
resolution more easily. This can be explained by the difference of the current cut-off
time[5]. As the bottom tip drops due to gravity, it stops being etched immediately
whereas the top tip is still being etched until the current is manually shut off.

Chapter 1. Introduction to STM and Applications of STM 28
Figure 1.12: Electrochemical etching of tungsten tips.
(a) A schematic of an instrument setup of tip making[5]. (b) A schematic of
the etching process, showing a meniscus formed on the wire while etching. (c)
The picture of our setup with a metal ring as a cathode.

Chapter 1. Introduction to STM and Applications of STM 29
After etching, the tip is transferred to the vacuum chamber. However, electrochemical
etching cannot guarantee atomic sharpness. In fact, the typical tip diameter is between 4-
15nm after etching [44, 45]. There are many ways to further sharpen or reshape a blunt
tip. In our study, we mainly used three methods: tip crashing, field emission, and
annealing.
The tip crashing method refers literally to crashing the tip to the surface, mostly soft
metals, in the hope of pulling surface atoms to the tip end and forming an atomically-
sharp tip when the tip is retracted. Field emission is accomplished by applying high
voltage (~10V) and high current (5-10nA) when the tip is in the tunneling regime with
the surface. This phenomenon can be explained with the restructuring of the tungsten
atoms in the tip under a high electric field[2]. Tip annealing is used to remove the
tungsten oxide and other impurities from the tip. In practice, we combine all three
methods in the hope of getting a perfect tip.
1.5. Bibliography
1. Eigler, D.M. and E.K. Schweizer, Positioning single atoms with a
scanning tunneling microscope. Nature, 1990. 344(6266): p. 524-526.
2. Chen, C.J., Introduction to Scanning Tunneling Microscopy. 2 ed. Vol. 1.
2008: Oxford University Press.
3. Ho, W., Inducing and Viewing Bond Selected Chemistry with Tunneling
Electrons. Accounts of Chemical Research, 1998. 31(9): p. 567-573.
4. Stroscio, J.A. and D.M. Eigler, Atomic and Molecular Manipulation with
the Scanning Tunneling Microscope. Science, 1991. 254(5036): p. 1319-1326.

Chapter 1. Introduction to STM and Applications of STM 30
5. Ibe, J.P., et al., On the electrochemical etching of tips for scanning
tunneling microscopy. Journal of Vacuum Science & Technology A: Vacuum,
Surfaces, and Films, 1990. 8(4): p. 3570-3575.
6. Binnig, G. and H. Rohrer, Scanning tunneling microscopy. IBM J. Res.
Dev., 1986. 30(4): p. 355-369.
7. Saranin, A.A., et al., Growth of thallium overlayers on a Si(100) surface.
Physical Review B, 2005. 71(3): p. 035312.
8. Tersoff, J. and D.R. Hamann, Theory and Application for the Scanning
Tunneling Microscope. Physical Review Letters, 1983. 50(25): p. 1998.
9. Tersoff, J. and D.R. Hamann, Theory of the scanning tunneling
microscope. Physical Review B, 1985. 31(2): p. 805.
10. Wiesendanger, R., Scanning Probe Microscopy and Spectroscopy:
Methods and Applications. 1994: Cambridge.
11. Hamers, R.J., Atomic-resolution surface spectroscopy with the scanning
tunneling microscopy. Annual Review of Physical Chemistry, 1989. 40: p. 531-
559.
12. Bai, C., Scanning Tunneling Microscopy and its application. Springer
Series in Surface Sciences, ed. R.G. Gerhard Ertl, Douglas L. Mills, Ing. Helmut
K. V. Lotsch. Vol. 32. 1995, Shanghai: Springer.
13. Laudauer, R., many-channel conductance formula. IBM J. Res. Dev.,
1957. 21.
14. Bardeen, J., Tunnelling from a Many-Particle Point of View. Physical
Review Letters, 1961. 6(2): p. 57.
15. Lang, N.D., Apparent Size of an Atom in the Scanning Tunneling
Microscope as a Function of Bias. Physical Review Letters, 1987. 58(1): p. 45.
16. Hla, S.W., Scanning tunneling microscopy single atom/molecule
manipulation and its application to nanoscience and technology. Journal of
Vacuum Science & Technology B, 2005. 23(4): p. 1351-1360.
17. Eigler, D.M., C.P. Lutz, and W.E. Rudge, An atomic switch realized with
the scanning tunnelling microscope. Nature, 1991. 352(6336): p. 600-603.
18. Crommie, M.F., C.P. Lutz, and D.M. Eigler, Confinement of Electrons to
Quantum Corrals on a Metal Surface. Science, 1993. 262(5131): p. 218-220.
19. Heinrich, A.J., et al., Molecule cascades. Science, 2002. 298(5597): p.
1381-1387.
20. Bartels, L., G. Meyer, and K.H. Rieder, Basic Steps of Lateral
Manipulation of Single Atoms and Diatomic Clusters with a Scanning Tunneling
Microscope Tip. Physical Review Letters, 1997. 79(4): p. 697.

Chapter 1. Introduction to STM and Applications of STM 31
21. Hla, S.W., K.F. Braun, and K.H. Rieder, Single-atom manipulation
mechanisms during a quantum corral construction. Physical Review B, 2003.
67(20): p. 4.
22. Yazdani, A., D.M. Eigler, and N.D. Lang, Off-Resonance Conduction
Through Atomic Wires. Science, 1996. 272(5270): p. 1921-1924.
23. Akiyama, R., T. Matsumoto, and T. Kawai, A Scanning Tunneling
Microscopy Study of Electrostatic and Proximity Effects in Tip-Assisted
Migration and Desorption of a DNA Base Molecule on SrTiO3. The Journal of
Physical Chemistry B, 1999. 103(29): p. 6103-6110.
24. Akiyama, R., T. Matsumoto, and T. Kawai, Mechanism of tip-assisted
migration and desorption of DNA base molecules on an SrTiO3 surface. Applied
Physics A: Materials Science & Processing, 1998. 66(0): p. S719-S722.
25.Saranin, A.A., et al., STM tip-induced diffusion of In atoms on the Si(111)
√3×√3- In surface. Physical Review B, 1997. 56(12): p. 7449.
26. Whitman, L.J., et al., Manipulation of Adsorbed Atoms and Creation of
New Structures on Room-Temperature Surfaces with a Scanning Tunneling
Microscope. Science, 1991. 251(4998): p. 1206-1210.
27. Kim, J., et al., Local atomic diffusion on Au(III) surface induced by Au
tip. Japanese Journal of Applied Physics Part 1-Regular Papers Short Notes &
Review Papers, 2003. 42(6A): p. 3616-3618.
28. Nakayama, T., D.H. Huang, and M. Aono, Extraction, deposition, and
displacement of atoms by STM. Microelectronic Engineering, 1996. 32(1-4): p.
191-201.
29. Tsong, T.T., Effects of an electric field in atomic manipulations. Physical
Review B, 1991. 44(24): p. 13703.
30. Tsong, T.T. and C.-S. Chang, High Field Effects and Methods Useful for
Transferring Atoms in Scanning Tunneling Microscope. Japanese Journal of
Applied Physics, 1995. 34(Part 1, No. 6B): p. 3309.
31. Stipe, B.C., M.A. Rezaei, and W. Ho, Inducing and Viewing the
Rotational Motion of a Single Molecule. Science, 1998. 279(5358): p. 1907-1909.
32. Stipe, B.C., M.A. Rezaei, and W. Ho, Coupling of Vibrational Excitation
to the Rotational Motion of a Single Adsorbed Molecule. Physical Review
Letters, 1998. 81(6): p. 1263.
33. Stipe, B.C., M.A. Rezaei, and W. Ho, Single-Molecule Vibrational
Spectroscopy and Microscopy. Science, 1998. 280(5370): p. 1732-1735.
34. Pascual, J.I., et al., Selectivity in vibrationally mediated single-molecule
chemistry. Nature, 2003. 423(6939): p. 525-528.

Chapter 1. Introduction to STM and Applications of STM 32
35. Bartels, L., et al., Atomic-scale chemistry: Desorption of ammonia from
Cu(111) induced by tunneling electrons. Chemical Physics Letters, 1999. 313(3-
4): p. 544-552.
36. Bilic, A., et al., Adsorption of ammonia on the gold(111) surface. Journal
of Chemical Physics, 2002. 116(20): p. 8981-8987.
37. Gadzuk, J.W., Resonance-assisted, hot-electron-induced desorption.
Surface Science, 1995. 342(1-3): p. 345-358.
38. Gaudioso, J., H.J. Lee, and W. Ho, Vibrational Analysis of Single
Molecule Chemistry:鈥?Ethylene Dehydrogenation on Ni(110). Journal of the
American Chemical Society, 1999. 121(37): p. 8479-8485.
39. Komeda, T., et al., Lateral Hopping of Molecules Induced by Excitation
of Internal Vibration Mode. Science, 2002. 295(5562): p. 2055-2058.
40. Persson, B.N.J. and H. Ueba, Theory of inelastic tunneling induced
motion of adsorbates on metal surfaces. Surface Science, 2002. 502-503: p. 18-
25.
41. International Union of Pure and Applied Chemistry. 1993.
42. Quantities, Units and Symbols in Physical Chemistry. 2nd ed: Oxford:
Blackwell Science.
43. Salzman, W.R., Lecture notes, University of Arizona.
44. Muller, A.D., et al., Characterization of electrochemically etched
tungsten tips for scanning tunneling microscopy. Review of Scientific
Instruments, 1999. 70(10): p. 3970-3972.
45. Kazinczi, R., et al., Novel methods for preparing EC STM tips. Applied
Physics a-Materials Science & Processing, 1998. 66: p. S535-S538.

33
Chapter 2
Au(111) Substrate and Preparation
Gold is one of the most popular substrates for molecular analysis in STM studies
because it is chemically inert, conductive, and easily prepared. Gold is a soft material,
therefore we can also use it in the tip-crash method to restore the STM tip.
Among all the facets, Au(111) is the most stable and can be most easily prepared.
Therefore, it is widely used in STM studies. It can usually be obtained by sputtering and
annealing from pre-cut Au(111) single crystals or flame annealing from thin gold films
on mica (discussed in more detail in Section 2.2).

Chapter 2. Au(111) Substrate and Preparation 34
2.1. Introduction to Gold and Au(111) Surface
The crystal structure of bulk gold is a face-centered cubic (fcc) lattice with a lattice
constant of 4.08Å[1]. The (111) plane is defined by the atoms at [100], [010], and [001],
resulting in a hexagonal lattice plane (See Figure 2.1).
The Au(111) surface, however, can exhibit either fcc structure or hexagonal closed-
packed (hcp) structure depending on how the gold top layer atoms are stacked. In Figure
2.2, the different structures of fcc and hcp structures are illustrated. In the fcc structure,
the Au atoms occupy three different locations at three layers (ABC stacking). Whereas
2.1: Schematic of the crystal structure of bulk gold and the
surface of (111).
The blue and red dots indicate the gold atom positions inside of the bulk crystal.
The Au(111) is defined by 3 big red gold atoms and has 3 additional red atoms
from the cube. Au(111) has a hexagonal lattice structure.

Chapter 2. Au(111) Substrate and Preparation 35
in the hcp structure, the top layer Au atoms overlap with the bottom layer atoms (ABA
stacking). From a first-principle calculation by Takeuchi et al.[2], the energy of the fcc
structure is the lowest. The hcp structure and bridge sites have slightly bigger energy
with only 1mRy and 3mRy bigger than fcc structure, respectively. The top site has the
highest energy which is 14mRy larger than fcc site. Since the energy of the fcc and hcp
structure is very close, it is possible to have both structures coexisting on the surface.
Both of the fcc and hcp structures can coexist on Au(111) surface. When the two
different structures meet, there is a buckling from the rest areas of the surface, resulting
in the famous “herringbone” reconstruction ridges [3-9]. This reconstruction has about
4.4% contraction along [110] , placing 23 Au atoms onto 22 atom locations. Therefore,
the unit cell of this reconstruction is (22 1) 3 . The ridges are higher than the rest of
the surface by ~ 0.2Å (Figure 2.3).

Chapter 2. Au(111) Substrate and Preparation 36
Figure 2.2: Schematic of the top three layers of the fcc and hcp
structures.
The upper panel is the fcc structure, where the Au atoms occupy three different
locations at three different layers (ABC stacking). The lower panel is the hcp
structure, where the top layer Au atoms overlap with the bottom layer atoms
(ABA stacking). The red, yellow, and blue dots indicate the Au atoms located on
the top, second, and bottom layers, respectively. (Courtesy of Kwang Taeg Rim)

Chapter 2. Au(111) Substrate and Preparation 37
This herringbone structure is visible in STM measurements of the clean Au(111) surface
(Figure 2.4). The fcc region (38Å) are a little wider than the hcp region (25Å) [10]. This
feature makes it easy to distinguish the two different regions. The reconstruction is very
sensitive to the impurities on the surface; therefore, it is, in practice, an indication of the
cleanness of the surface[11, 12]. Sometimes, the Au(111) surface has other
reconstructions due to a small amount of local defects, such as step edges or impurities.
For example, we observed U-shaped reconstruction patterns near the steps in Figure
2.5(a), which is also reported by Barth et al.[3]. We also observed a triangular
reconstruction pattern which is shown in Figure 2.6.
Figure 2.3: Hard sphere model of one stacking fault region in
Au(111).
The atoms (yellow) have ABA stacking (hcp structure) on the left, and ABC
stacking (fcc structure) on the right, respectively. When they meet in the middle
(red), they are forced to occupy bridge sites of the second layer and therefore
buckle from the surface.

Chapter 2. Au(111) Substrate and Preparation 38
Figure 2.4: STM topography of Au(111) surface.
A typical flat and clean Au(111) surface is shown with the red box indicating
the area of the hard sphere models in Figure 2.3. The scanning condition is 1V,
0.5nA. Blue arrows indicate the positions of fcc structures.

Chapter 2. Au(111) Substrate and Preparation 39
Figure 2.5: Atomic resolution STM topography of Au(111)
herringbone elbow sites and ridge sites.
(a) A large, clean Au(111) terrace with ~100nm width is shown. Near the two
steps in this region, the herringbone reconstruction turns irregular. Green and
pink circles illustrate the location of one herringbone elbow and one ridge
site. (b) Atomic resolution image of a herringbone elbow site zoomed in from
green circle in (a) shows a distortion of atom arrays at the elbow. (c) Atomic
resolution image of a herringbone ridge zoomed in from pink circle in (a)
shows a regular array of Au atoms. The scanning condition is 0.2V, 1nA.
20nm
2nm 1.3nm
(a)
(b) (c)

Chapter 2. Au(111) Substrate and Preparation 40
Shown in Figure 2.5(b-c) is the atomic resolution STM image of the herringbone
structure, Figure 2.5(b) clearly indicates a distortion of atom positions and brightness at
an elbow site, due to either the local electronic or atomic structure. Figure 2.5(c) shows
a regular array of atoms on a ridge.
At different parts of the herringbone reconstruction, the reactivity is possibly different.
The herringbone elbow sites are reported to be one of the most reactive sites on this
Figure 2.6: Triangle reconstruction STM topography of
Au(111).
The underlying surface is shown with triangle reconstruction. The bright dots
are evaporated molecules. The scanning size is 26.6x24.9nm2. The waves near
the bright dots are standing waves reflected from the defects.

Chapter 2. Au(111) Substrate and Preparation 41
surface. STM studies on preferential nucleation of Ni, Fe and Co[8, 13, 14] on these
sites have suggested that these sites might be energetically favored to capture atoms that
are diffusing on the surface.
The difference in the reactivity of fcc, hcp and ridge sites of the Au(111)
herringbone has also been reported. For example, STM studies on thiolates on
Au(111)[15, 16] show preferential adsorption of the molecule on the fcc sites. A DFT
calculation[17] found out that Au-Au distances around the fcc sites elongate by a large
distance upon thiolate adsorption and the relaxation propagates to the second layer,
while there are weaker effects in the hcp configuration. As a result, the binding energy
of thiolates on fcc sites is about 0.24eV larger than hcp sites.
2.2. Au(111) Preparation
As previously mentioned, there are usually two methods to obtain Au(111) surface. One
way is to obtain it from a thin gold film evaporated on other substrates, such as mica.
Since (111) is the most stable facet for Au, Au(111) is usually obtained from
evaporation. Average roughness of the as-evaporated thin film is on the nanometer scale.
Then one uses flame-annealing technique to remove the contaminants and flatten the
surface. In this procedure, the typical gas used is hydrogen or butane. In the case of
hydrogen, the Au-mica substrate is quickly passed through a 1100oC flame, 1-2cm
above the blue portion of the flame[18]. This method is fast, but requires some
experience. Furthermore, it is done ex-situ and we still need at least a few minutes to

Chapter 2. Au(111) Substrate and Preparation 42
transfer the sample into the vacuum chamber which may involve some additional
contaminants.
In our study, we adopted an alternative way, obtaining it in-situ from a pre-cut single
crystal. In this way, we use repeated cycles of sputtering to remove the surface
contaminants and subsequent annealing to flatten the surface and bring the contaminants
from the bulk to the surface. In the sputtering procedure, the UHV chamber is backfilled
with 1x10⁻⁵
Torr argon gas and a 0.5keV ion beam is focused onto the sample with
about 3 A sample current. In the annealing procedure, we use indirect heating method
by providing the heater with a 1.6A current, which is equivalent to about 600oC. Each
cycle includes a 15 min sputtering and a 15 min annealing. The cycle number varies
from 3-20 cycles depending on the previous condition of the sample. It has been
suggested that a prolonged cooling-down procedure might be the best for the
smoothness of the sample. In our case, cooling down quickly does not affect the quality
of the surface.

Chapter 2. Au(111) Substrate and Preparation 43
Figure 2.7: Large-scale STM topography of Au surface
transition through sputtering and annealing
These images show the STM topography of the Au(111) surface (a) before,
(b-c) during, and (d)after sputtering and annealing. The sizes of the images are
(a) 100nmx100nm, (b) 500x500nm, (c) 189nmx189nm, and (d) 200x200nm.

Chapter 2. Au(111) Substrate and Preparation 44
Figure 2.7 shows the STM images before/during/after sputtering and annealing. Figure
2.7(a) shows the surface before the procedure, in which the surface is very rough with
corrugation~10nm. After a few cycles, the top layer contaminants started to be removed
and the gold surface starts to relax into ordered structures. In Figure 2.7(b), the surface
starts to form narrow steps and triangular adlayers due to the influence of six-fold
symmetry of Au lattice. However, the energy has not completely relaxed, so the
herringbone reconstruction is not yet formed. In addition, there is still a small amount of
impurities on the surface. In Figure 2.7(c), with more impurities removed, the surface
started to have more ordered structure with large terrace ~30nm and herringbone
reconstruction is very easily observed on the large terraces. In addition, there is a much
less amount of impurities on the surface. With further sputtering/annealing, after most of
the contaminants are removed, large terraces with ~200nm and the periodic herringbone
reconstruction have formed as shown in Figure 2.7(d).
2.3. Bibliography
1. Kittel, C., Introduction to Solid State Physics. 7 ed. 1996: John Wiley
and Sons.
2. Takeuchi, N., C.T. Chan, and K.M. Ho, Au(111): A theoretical study of
the surface reconstruction and the surface electronic structure. Physical Review
B, 1991. 43(17): p. 13899.
3. Barth, J.V., et al., Scanning tunneling microscopy observations on the
reconstructed Au(111) surface: Atomic structure, long-range superstructure,
rotational domains, and surface defects. Physical Review B, 1990. 42(15): p.
9307.
Chapter 2. Au(111) Substrate and Preparation 45
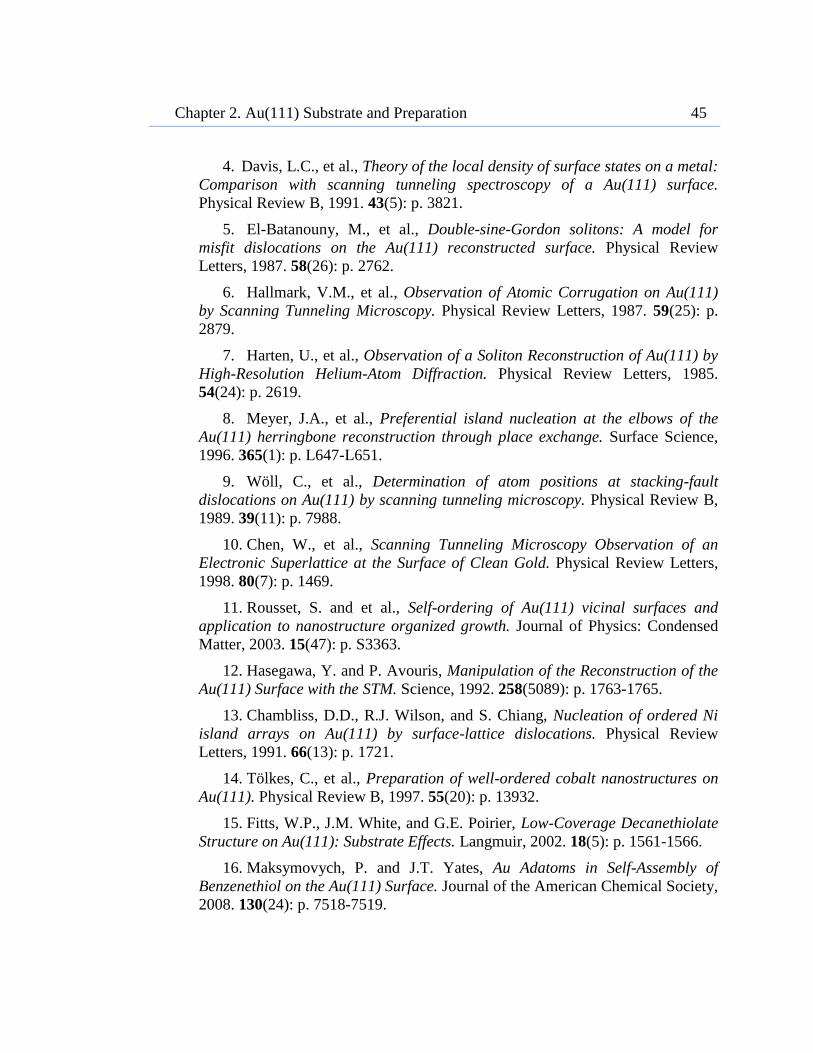
4. Davis, L.C., et al., Theory of the local density of surface states on a metal:
Comparison with scanning tunneling spectroscopy of a Au(111) surface.
Physical Review B, 1991. 43(5): p. 3821.
5. El-Batanouny, M., et al., Double-sine-Gordon solitons: A model for
misfit dislocations on the Au(111) reconstructed surface. Physical Review
Letters, 1987. 58(26): p. 2762.
6. Hallmark, V.M., et al., Observation of Atomic Corrugation on Au(111)
by Scanning Tunneling Microscopy. Physical Review Letters, 1987. 59(25): p.
2879.
7. Harten, U., et al., Observation of a Soliton Reconstruction of Au(111) by
High-Resolution Helium-Atom Diffraction. Physical Review Letters, 1985.
54(24): p. 2619.
8. Meyer, J.A., et al., Preferential island nucleation at the elbows of the
Au(111) herringbone reconstruction through place exchange. Surface Science,
1996. 365(1): p. L647-L651.
9. Wöll, C., et al., Determination of atom positions at stacking-fault
dislocations on Au(111) by scanning tunneling microscopy. Physical Review B,
1989. 39(11): p. 7988.
10. Chen, W., et al., Scanning Tunneling Microscopy Observation of an
Electronic Superlattice at the Surface of Clean Gold. Physical Review Letters,
1998. 80(7): p. 1469.
11. Rousset, S. and et al., Self-ordering of Au(111) vicinal surfaces and
application to nanostructure organized growth. Journal of Physics: Condensed
Matter, 2003. 15(47): p. S3363.
12. Hasegawa, Y. and P. Avouris, Manipulation of the Reconstruction of the
Au(111) Surface with the STM. Science, 1992. 258(5089): p. 1763-1765.
13. Chambliss, D.D., R.J. Wilson, and S. Chiang, Nucleation of ordered Ni
island arrays on Au(111) by surface-lattice dislocations. Physical Review
Letters, 1991. 66(13): p. 1721.
14. Tölkes, C., et al., Preparation of well-ordered cobalt nanostructures on
Au(111). Physical Review B, 1997. 55(20): p. 13932.
15. Fitts, W.P., J.M. White, and G.E. Poirier, Low-Coverage Decanethiolate
Structure on Au(111): Substrate Effects. Langmuir, 2002. 18(5): p. 1561-1566.
16. Maksymovych, P. and J.T. Yates, Au Adatoms in Self-Assembly of
Benzenethiol on the Au(111) Surface. Journal of the American Chemical Society,
2008. 130(24): p. 7518-7519.

Chapter 2. Au(111) Substrate and Preparation 46
17. Grönbeck, H., A. Curioni, and W. Andreoni, Thiols and Disulfides on the
Au(111) Surface: The Headgroup - gold Interaction. Journal of the American
Chemical Society, 2000. 122(16): p. 3839-3842.
18. Mark, H.D., et al., Preparation of gold thin films by epitaxial growth on
mica and the effect of flame annealing. Journal of Vacuum Science &
Technology A: Vacuum, Surfaces, and Films, 1998. 16(6): p. 3295-3300.

47
Chapter 3
Study of 1,4-benzenediamine Adsorption on
Au(111)
3.1. Abstract
In this chapter, we apply STM to investigate the binding of a model amine compound,
1,4-benzenediamine (BDA), to the reconstructed Au(111) surface. We find that BDA
exhibits different structures at different coverages, including isolated BDA at a low
coverage, branched chain structures and network structure at an intermediate coverage,
Chapter 3. Study of 1,4-benzenediamine on Au(111) 48
and two SAMs at a high coverage. BDA preferentially adsorbs to step edges, elbows and
fcc sites of the Au(111) herringbone reconstructions. In addition, BDA is susceptible to
tip-induced movement, which can potentially lead to applications in molecule
manipulations. These investigations shed light on the high stability of amines in single
molecule conductance measurements using gold contacts.
3.2. Introduction
3.2.1. Introduction to SAMs
The field of self-assembled monolayers (SAMs) on surfaces has developed rapidly since
Nuzzo and Allara reported the adsorption of alkanethiols onto gold in 1983[1] and still
remains a hot topic due to its important applications in nanotechnology. As the thinnest
organic films, SAMs offer the possibility of design and functionality control on the
surface patterning at the nanometer scale, which can be tailored by using different
organic molecules and surfaces. SAMs can be fabricated into nanoscale patterns in
numerous ways, such as by scanning probes, microcontact printing, and particles beam
(photons, electrons and ions, neutral atoms) [2-6].
The most widely studied SAM system is thiols/thiolates[2, 7-12] on gold due to its
stability. In contrast, studies on amines SAMs on gold are sparse, mostly due to the
weak interaction between amines and gold. In early studies, it was shown that alkenes
terminated with amines either do not form stable monolayers on Au(111) by solution-

Chapter 3. Study of 1,4-benzenediamine on Au(111) 49
based adsorption method[7] or only form a weak monolayer that can be easily displaced
by a trace of polar impurities[13, 14]. More recently, Xu et al. demonstrated that
H2N(CH2)NH2 forms a stable, ordered SAM on the Au surface from its vapor phase[15].
Lee et al. used liquid/solid phase STM to study the coadsorbed film of aniline and
solvent molecules on an Au(111) electrode in perchloric acid and benzenesulfonic
acid[16-18]. Dell’Angela et al. reported a well ordered SAM formed by vapor
deposition of a few amines, including BDA molecules, as probed by UPS, XPS and
NEXAFS [19].
3.2.2. Introduction to the Break-junction Conductance Measurement
Since the introduction of a single molecule as an active electronic component[20],
efforts have been devoted to measurements of single-molecule transport properties[21-
23]. Although the concept seems simple, this goal has proven difficult to achieve. One
of the biggest obstacles is that the conductance measurement of a single molecule
typically exhibits large variations. In 2006, Venkataraman et al. used a so-called
“modified STM” to demonstrate the possibility of achieving reliable and reproducible
conductance values for molecules with amine groups [24-26].
Single molecules were used to form in metal-molecule-metal junctions in their
measurement (Figure 3.1) between an Au tip and Au surface. The Au surface was first
flamed and annealed with butane and then covered with molecules (either in a solution
form or a dry form). Then the Au tip was crashed into and pulled back from the Au

Chapter 3. Study of 1,4-benzenediamine on Au(111) 50
surface in a controlled way. Since the surface is covered with molecules, there is a high
chance for a molecule to be picked up by the tip and trapped between the tip and the
surface, thus forming a metal-molecule-metal junction. By measuring the I-V curve of
the junction, they were able to determine the existence of such a junction.
When a clean Au surface without any molecules is used, the conductance exhibits a
step-wise decrease with steps being at integral multiples of G0= 2e2/h, the quantum
conductance of a single-channel ballistic junction. Below G0, the conductance either
Figure 3.1: Schematic of the modified STM in Venkataraman’s
measurements. [24] By Crashing the Au tip into the Au surface covered by amines and pulling back
the tip for a few angstroms, a relatively stable metal-molecule-metal junction is
formed.

Chapter 3. Study of 1,4-benzenediamine on Au(111) 51
decreases exponentially due to tunneling between two electrodes or drops directly below
the experiment detection limit, possibly due to the relaxation of Au atom chains (Figure
3.2a, yellow traces). However, when a molecule is trapped between the Au electrodes,
the conductance measurement exhibits additional steps. In their experiment, the
conductance of several classes of molecules was measured, including diamines, dithiols,
and diisonitriles. From the conductance measurements shown in Figure 3.2a, we can see
that the traces of BDA (blue traces) have more stable values compared with the other
two molecules. The authors also constructed conductance histograms of the bare surface
and three different molecules using more than 3000 traces without any data selection or
processing. The result in Figure 3.2b clear indicates that BDA has a much better-defined
peak than the other two molecules.
The authors attributed the stable conductance to a more uniform configuration of the
amines bound to the Au surfaces, as formed between electron lone pairs of nitrogen and
gold adatoms. DFT calculations also confirm the conclusion by providing a model with
an amine group sitting on top of a gold adatom [19, 27-29].

Chapter 3. Study of 1,4-benzenediamine on Au(111) 52
3.2.3. Introduction to 1,4-benzenediamine (BDA)
BDA, a model diamine compound, is composed of a benzene ring and two amine groups
in the para position. Its Synonyms include 1,4-benzenediamine, 1,4-diaminobenzene,
1,4-Phenylenediamine, or p-phenylenediamine. It is used as a component of engineering
polymers and composites, aramid fibers, rubber chemicals, textile dyes and
pigments[30]. BDA possesses many outstanding properties, including high temperature
stability, high strength, and chemical and electrical resistance.
Figure 3.2: Conductance measurement of clean Au, BDA, 1,4-
benzenedithiol (BDT), and 1,4-benzenediisonitrile (BDI) in
Venkataraman’s measurements. [26] (a) Samples conductance traces with clean Au (yellow), BDA (blue), BDT
(red), and BDI (green) in a semi-log plot. (b) Conductance histograms of the
same molecules with the same color scale in a log-log scale. The inset shows the
same histograms in a linear scale.

Chapter 3. Study of 1,4-benzenediamine on Au(111) 53
At room temperature, BDA is a colorless solid when pure; however, it can become
yellowish or pinkish when it is oxidized, which is the basis for its application in dyes
and hair colorants[31]. The physical properties of BDA are listed in Table 1.
Molecular
weight
Boiling
point (760
mmHg)
Melting
point (760
mmHg)
Vapor
pressure
(25oC)
Vapor
pressure
(25oC)
Vapor
Density
(Air=1)
108.1 271 oC 139-142
oC <0.0001
mmHg
0.08 mmHg 3.7
BDA has two isomers: cis and trans forms, depending on the relative orientation of the
NH2 groups with respect to the plane of the aromatic ring. In the cis form, both the NH2
groups are on the same side of benzene ring (Figure 3.3b); in the trans form, the amine
groups are on different sides of the benzene ring (Figure 3.3c). Different studies at
different environments show different ratios of cis vs. trans forms: ab initio
calculations[32, 33] and dipole moment measurement[34] show a mixture of both forms
in the gas phase; X-ray crystallography measurement[35] shows a trans configuration in
the crystal structure.
Table 1: Selected physical properties of BDA

Chapter 3. Study of 1,4-benzenediamine on Au(111) 54
When amine compounds are deposited to Au surface, DFT calculations [19, 29] reveal
three interesting conclusions: 1) the binding energy of all possible geometries of
amine/Au is considerably lower than that for thiols. 2) The largest binding energy is
obtained at the situation when amines sit directly above an Au adatom (atop position),
which is in the range from 0.3eV to 0.53eV. 3) When BDA is adsorbed on the Au(111)
flat surface at relatively high coverage, the calculated binding energy is 0.36eV and the
calculated angle between the benzene ring and the surface is about 27o, which means the
molecule is not lying flat but rather tilting up from the surface at high coverage. This
phenomena has been supported by NEXAFS measurement[19].
Due to lack of extensive studies of SAMS formed with amines, a detailed picture of the
amine/gold bonding is still missing. In this chapter, we provide topographic images of 5
Figure 3.3: Diagrams of BDA and two isomers. (a) 2D diagram of BDA. (b-c) 3D diagrams of (b) cis form and (c) trans form
of BDA. Grey: carbon atoms; blue: nitrogen atoms; white: hydrogen atoms; pink:
electron lone pair.

Chapter 3. Study of 1,4-benzenediamine on Au(111) 55
phases of BDA molecules on Au(111), including 3 phases of BDA SAMs, at different
coverages obtained with ultrahigh vacuum (UHV) scanning tunneling microscope
(STM). In addition, we report on the preferential adsorption of BDA on reconstructed
Au(111) surface and tip-induced movement of BDA.
3.3. Experiment Methods
Our experiments were performed using a low-temperature STM (Omicron LT-STM)
under UHV condition at a base pressure of 3x10-11
Torr. Clean Au(111) substrates were
obtained by repeated cycles of Ar-ion sputtering and thermal annealing at 900K. 1,4-
bezenediamine (BDA) with purity >99% was commercially purchased from Sigma-
Aldrich and adsorbed to the surface by vapor deposition through a leak valve in the
chamber (See Chapter 1). An appropriate vapor pressure of the BDA molecules was
achieved by heating the solid source to 100oC and then reduced to a desired vapor
pressure at the vacuum chamber by controlling the opening of the leak valve.
We deposited the molecules on the surface held at both room temperature and a reduced
temperature. For the reduced temperature deposition, the sample was transferred directly
from a liquid-helium cooled stage and exposed while held on a room-temperature holder.
In order to keep temperature comparable for each deposition, the deposition time was
maintained at 5 minutes for all exposures. As a result, we were able to vary the surface
coverage of BDA by means of controlling the sample temperature (either room
temperature or a reduced temperature) as well as the BDA vapor pressure inside the

Chapter 3. Study of 1,4-benzenediamine on Au(111) 56
vacuum chamber upon deposition. All the STM measurements were performed at liquid
helium temperature (5K).
3.4. Results and Discussion
3.4.1. Morphology of BDA on Au(111)
Phase diagram
By varying the coverage of BDA on Au(111), we observed 5 different surface phases of
the adsorbed molecules on Au(111) (see Figure 3.4), including 3 phases of SAMs. The
different phases are: (1) isolated BDA molecules (at very low coverage), (2) a chain
structure (at low and intermediate coverage), (3) a network structure (at intermediate
coverage), (4) a fully-covered line lattice (at high coverage), and (5) a fully covered
square lattice (at high coverage). We designated the first two as flat BDA molecules and
the latter three as SAMs.
Very low coverage (~0.007 Langmuir)
In the very low coverage regime (Figure 3.4a), BDA molecules are well isolated from
one another. From our STM images, the coverage is estimated to be 0.007 Langmuir
based on the Au atom density on the surface.

Chapter 3. Study of 1,4-benzenediamine on Au(111) 57
Shown in Figure 3.5(a) is an STM image of individual BDA molecules after deposition.
The measured height is about 1 Å above the Au clean surface. Each BDA molecule
assumes a spindle shape. It also exhibits two elongated tails on opposite sides, which
correspond to the amine groups. A line profile is shown across the long side of the
molecule in Figure 3.5(b). The length corresponding to the white line in the topographic
image is approximately 9Å; the transverse dimension (red line) is ~ 7Å. The shape and
height of BDA do not change with the polarity of the sample bias.
As a comparison, the nitrogen to nitrogen distance is about 5.6 Å in one molecule in the
gas phase [35, 36]. It appears that the dimension of the BDA molecules measured by
STM is about 3 Å larger than the nominal N-N distance. There are two possible reasons:
1) the charge transfer between the molecules and the surface leads to a localized
electronic density around the molecule; 2) the image is broadened by the tip. In principle,
we should be able to determine the tip sharpness by a sharp object on the surface, e.g.
the edges. However, the edges are also covered by the molecules, which make it
difficult to estimate the tip dimension.

Chapter 3. Study of 1,4-benzenediamine on Au(111) 58
Figure 3.4: STM topographic images of BDA on Au(111) at
different coverages. Coverage increases from (a) to (d). (a) Very low coverage: isolated BDA
molecules. (b) Low coverage: chain structures. (c) Intermediate coverage:
coexistence of line structure and network structure. (d) High coverage. (e) and (f)
are high resolution images of two phases of high coverage: fully-covered line
lattice and square lattice. The insets of (b) and (c) are high resolution images of
the line structure and the network structure. The inset of (e) shows the structure
between bright lines.

Chapter 3. Study of 1,4-benzenediamine on Au(111) 59
Figure 3.5 (c-d) illustrate structural diagrams for the two conformational BDA isomers:
the cis and trans forms, as defined by the relative orientation of the NH2 groups with
respect to the plane of the aromatic ring, with their respective possible geometries on the
Au(111) surface. In the cis form, both the NH2 groups are on the same side of benzene
ring with the electron lone pairs of amines interacting with the gold atoms, and thus
Figure 3.5: Experimental results and models of individual BDA
molecules on the Au(111) surface. (a) An STM image of an individual BDA molecule on Au(111) surface at 5K
(b) Line profile along the white line on BDA. The scanning condition is 0.04V,
5pA. (c-d) Models for BDA: (c) cis form and a flat geometry and (d) trans form
and a tilted geometry.

Chapter 3. Study of 1,4-benzenediamine on Au(111) 60
form donor-acceptor bonds. At the same time, the carbon may also bond to the gold
atoms with van der Waals force. In the trans form, the amine groups are on different
sides of the benzene ring and the only possible interaction is through the Nitrogen
electron lone pairs. Our STM images show a rather symmetric geometry of an individual
BDA molecule with a protruded center and two tails on each side, indicating a cis
configuration with both of the amine groups facing down and lying flat on the surface.
Previous theoretical and experimental studies about BDA molecules have shown
different results of BDA forms. Ab initio calculations[32, 33] and dipole moment
measurement[34] show a mixture of both cis and trans forms in the gas phase. However,
X-ray crystallography measurement[35] show only a trans form in the crystal structure.
We have also studied the preferred adsorption sites for BDA molecules on the Au(111)
surface. They are found to be the step edges, herringbone elbows, and the fcc
herringbone terraces.
In Figure 3.6(a), we see directly that BDA adsorbs at the step edges even at very low
coverage. By comparing the molecules at different locations, BDA at the edges appear
smaller, probably due to stronger bonding with Au atoms at the edges. In Figure 3.6(b),
since the underlying herring reconstruction of Au(111) is clearly visible, it is easy to
distinguish the fcc and hcp regions. (See Chapter 2 for more detailed introduction.) At
very low coverage like Figure 3.6(b), BDA molecules only occupy the fcc sites and the
elbow sites on the terraces. More experiments are needed in order to determine which
site out of the three has the largest binding energy.

Chapter 3. Study of 1,4-benzenediamine on Au(111) 61
If we compare the numbers of BDA molecules on the hcp sites and the fcc sites
(estimated to be approximately 1:30), we can estimate the adsorption energy difference
of BDA molecules at these sites by:
/1
2
E kTPe
P
(3.1)
Where P1 and P2 are the BDA molecule number density on hcp sites and fcc sites,
respectively, T is the temperature when the molecules are frozen, which we assume is
100K. E is the adsorption energy difference. As a result, E ~0.02eV.
Figure 3.6: STM images of the preferred adsorption sites of
BDA molecules. STM shows preferred adsorption sites at (a) step edges, (b) herringbone elbows
and fcc sites at very low coverage. The images were taken at sample bias of
0.04V-0.1V.

Chapter 3. Study of 1,4-benzenediamine on Au(111) 62
Low coverage case (~0.02 Langmuir)
In the low coverage regime (~0.02 Langmuir), BDA molecules start to connect in lines.
As the inset of Figure 3.4b shows, the tails of BDA are off the axis of the BDA lines by
approximately 30o, and the spacing between the nearest low points is about 8 Å,.
Sometimes, BDA molecules also attaches to the line from a branch site. We designated
this type of structure as the branched chain structure.
Furthermore, we can also observe that the adsorbed BDA molecules generally follow a
pattern that resembles a herringbone structure. At such coverage, the reconstruction is
hard to resolve while imaging the BDA layer. We could, however, scan the same area
separately at different bias to obtain both the BDA structures (low bias) and the
underlying Au(111) herringbone structure (high bias). As a result, we can identify the
different stacking regions in Figure 3.7a. The dark regions are herringbone ridges and
the blue arrows indicate the fcc sites. We can deduce that at low coverage, the BDA
molecules can adsorb on both fcc and hcp sites of the Au(111) herringbone
reconstruction but not on the ridge sites.
In order to understand the chain structure, we can refer to BDA molecules in the crystal
form where the molecules are coordinated by hydrogen bonds[37, 38] from a nitrogen
atom of one BDA molecule to a hydrogen atom of an amine group of another BDA
molecule[35]. We propose that adsorbed BDA molecules also interact with each other
by means of hydrogen bonding. The 30o off-axis orientation of BDA molecules in the
line structure and the slightly smaller spacing between BDA molecules in the chain

Chapter 3. Study of 1,4-benzenediamine on Au(111) 63
structure than the length of an individual BDA molecule support this hypothesis. More
specifically, we propose the following model: An amine group of one BDA has two
hydrogen atoms, one of which interacts with nitrogen of an amine group of another
BDA, whose hydrogen atom can interact with a third BDA. That’s how a line forms. In
addition, the fourth BDA can also interact with the rest of the hydrogen atom of the
amine group from a branch site. Figure 3.8 shows a crude 2D diagram of the model.
Figure 3.7: STM images of the preferred adsorption sites of
BDA chain structures at low coverage. The same area STM images taken at different bias show different features: (a)
intact chain structures at a sample bias of 0.1V; and (b) Au(111) herringbone
structure with a few decorations at a sample bias of -1.5V. In (a), the dark regions
are herringbone ridges. The fcc sites of the underlying Au(111) herringbone
structure are marked with the blue arrows. The same impurity was marked with
red circles as a reference in both images.

Chapter 3. Study of 1,4-benzenediamine on Au(111) 64
The explanation of the preferential adsorption to the step edges and the elbow sites is
straight forward as amines like to bind to coordinatively unsaturated sites [19, 26] such
as step edges and herringbone elbow sites[39]. As for the preference with fcc sites over
hcp sites, a similar preference has been observed for thiolates on Au(111) [9, 40], in
which case, DFT calculation [41] found out that Au-Au vertical distances around the fcc
sites elongate by a significant distance upon thiolate adsorption and relaxation
propagates to the second layer, while there is a weaker effects in hcp configuration. As a
Figure 3.8: Diagram of BDA molecule in the line structure. The molecules on the line connect to each other with hydrogen bonds between
hydrogen atoms and nitrogen atoms. The BDA orientation is approximately 30o
with respect to the axis of the line of molecules (in red line). It can also connect
to the line from a branch site, also via a hydrogen bond.

Chapter 3. Study of 1,4-benzenediamine on Au(111) 65
result, the binding energy of thiolates on fcc sites is about 0.24eV greater than hcp sites.
We believe that similar interpretation also applies to this situation, though further
studies, especially theoretical calculation, are needed.
Intermediate coverage case (~0.06 Langmuir)
As the coverage increases, 3 different forms of BDA SAMs were observed. At
intermediate coverage (~0.06 Langmuir), there is a coexistence of a new SAM phase
(the network structure) as well as the chain structure found at lower coverage. The
network structure appears with a white triangle in Figure 3.4c. A close-up image of one
unit cell is shown in the inset of Figure 3.4c. Each unit cell is composed of 6 BDA
molecules. One spot or a 0.5 Å greater apparent height structure is observed. It is
unclear whether this is a topographic effect or an electronic effect, both of which could
contribute to the change in apparent height.
We also studied the preferred adsorption sites of the network structure. With the same
method as in the previous section, we were able to identify the different stacking regions
in Figure 3.9a where the dark regions are herringbone ridges and the blue arrows show
the fcc sites. Thus we deduce that the network structures preferentially adsorb to the fcc
elbow sites.

Chapter 3. Study of 1,4-benzenediamine on Au(111) 66
High coverage (>0.1 Langmuir)
When the surface is fully covered, there is a coexistence of two phases: a line lattice
(Figure 3.4d) and a square lattice (Figure 3.4e). The line lattice covers the majority of
the surface. In this case, the bright lines are composed of a zigzag pattern of bright spots
and have a periodic distance of 3nm in the direction perpendicular to the lines. The
spacing is about 8 Å between the two bright spots along the line and 6 Å across the line.
The underlying herringbone arrangement of the reconstructed Au(111) surface is also
visible on the covered surface. The angle between herringbone bridge ([112] ) and the
Figure 3.9: STM images of the preferred adsorption sites of
BDA network structures. The same area STM images taken at different bias show different features: (a)
intact network structures and chain structures at a sample bias of 0.1V; (b)
partially destroyed BDA structures with a faint Au(111) herringbone structure
background at a sample bias of 0.5V; and (c) Au(111) herringbone structure with
a few decorations at a sample bias of -2V. In (a), the fcc sites of the underlying
Au(111) herringbone structure are marked with the blue arrows.

Chapter 3. Study of 1,4-benzenediamine on Au(111) 67
bright line is about 68 . The inset of Figure 3.4d shows that the entire surface, not just
the region of the more pronounced lines, is covered. In addition, the height difference
between the bright spots and the fine structure spots in the dark areas is around 1 Å,
which is less than the height difference for an additional layer of BDA molecules. This
height difference could be induced by different tilting angles of the adsorbed BDA
molecules. The other fully-covered BDA SAM, the square lattice, has a four-fold
symmetry with 2 nm periodicity in both directions.
When the coverage increases, more intermolecular interaction causes the BDA
molecules to stack on the surface with a more upright position, which may cause
different tilting angles of BDA, which makes a small height difference of about 1 Å.
Larger tilting angle due to higher coverage has been observed for thiols SAMs on
Au(111) [11]. XPS study of BDA on polycrystalline Ni surface indicates a coexistence
of tilted BDA and flat BDA at a low coverage [33]. Moreover, the tilting angle has been
theoretically reported by DFT calculation for amine on Au[29], particularly of BDA[19]
as well. An NEXAFS study also confirms the average tilting angle of BDA on
Au(111)[19].

Chapter 3. Study of 1,4-benzenediamine on Au(111) 68
Figure 3.10: XPS spectra of N 1s and C 1s of BDA on Au(111)
form a low to high coverage. (a) N1s peaks of BDA molecules on Au(111), with coverage increasing from
the bottom to the top. At a low coverage, only one peak exists; at a higher
coverage, there are two peaks; at multilayer coverage, only the second peak is
left. (b) Corresponding C1s peaks of BDA on Au(111).

Chapter 3. Study of 1,4-benzenediamine on Au(111) 69
An independent XPS study (Figure 3.10) shows the transition of N 1s peak from a low
coverage to multilayer coverage. The data exhibit only one N 1s peak at a low coverage,
indicating a flat BDA geometry in a cis form. If the BDA molecules are tilted on the
surface or having a trans form, there should be at least two different N peaks, one for the
N interacting with Au and the other is not. As the coverage increases, another N 1s peak
appears at higher energy. The intensity of this peak continues to increase until it
becomes the sole peak for multilayer coverage. The emergence of the 2 peaks implies
that the BDA molecules start to stand up from the surface or stack on each other in a flat
geometry. The former situation was confirmed by the same authors using NEXAFAS
[19]. This phenomenon is consistent with our STM images at different coverages. At
multilayer coverage, XPS can only detect the top few layers. As a result, only one peak
exists for multilayer coverage.
3.4.2. Tip-induced movement of BDA on Au(111)
In our measurement, we also found out that the BDA molecules are extremely sensitive
to the scanning conditions. For stable imaging, we were constrained to bias voltages
below 100meV with a current of 5pA.
If the sample bias was increased without changing the current, those isolated molecules
and the chain structures were not visible whereas the network structure still remained
intact. If we scanned the same area at a higher bias, the molecules were found to be

Chapter 3. Study of 1,4-benzenediamine on Au(111) 70
disturbed and reorganized on the surface. There was no evidence of fragmentation of the
BDA molecules induced by the STM. This process is shown in Figure 3.11a-e.
Figure 3.11: Sequential STM images of the same area under
different bias voltage and current. Scanning conditions of sequential STM images are (a) 0.1V, 5 pA; (b) 0.5V, 5
pA; (c) 0.1V, 5 pA; (d) 2V, 5 pA; (e) 0.1V, 5 pA; (f) 2V, 500 pA; (g) 0.1V, 5pA;
(h) -2V, 5 pA; (i)0.1V, 5 pA. The red circles indicate the new lines formed after
disturbance by the STM tip.

Chapter 3. Study of 1,4-benzenediamine on Au(111) 71
Figure 3.12: Sequential STM images of the same area of the line
lattice. The ordered line lattice is disturbed during scanning at U= -2.5V and I=200pA.

Chapter 3. Study of 1,4-benzenediamine on Au(111) 72
Figure 3.13: Sequential STM images of the same area before
and after a voltage pulse.
(a-b): STM image before and after application of a voltage pulse of 1V. (c-
d): STM image before and after voltage pulse of 2V. The red circles and the red
star indicate the location where the pulse was applied. The scanning condition is
U=40meV and I=3pA.

Chapter 3. Study of 1,4-benzenediamine on Au(111) 73
With the same sample bias, but at a different current, the result was also different.
Figure 3.11f is the STM image with the sample bias of 2V and current of 500pA, the
network structure started to melt. The image taken afterwards (Fig 3.11g) also
confirmed that result.
The surface was scanned at a sample bias of -2V in Fig 3.11h. No BDA molecules could
be resolved at this condition, but instead the underlying Au(111) herringbone could be
observed. A scan afterwards indicated that most of the BDA molecules were scattered
and reorganized on the surface, forming a few new lines in Fig 3.11i.
The fully-covered line lattice and square lattice were also unstable for scanning at 2V
as Figure 3.12 shows.
At a very low coverage, the molecules remain stable on the surface at bias voltage of
40meV and current of 3pA. However, if a voltage pulse is applied at the surface, the
BDA will diffuse to another location within 1-2nm or rotate. When a voltage of 1V is
applied, only the BDA molecule where the pulse was applied would move; when a
voltage of 2V is applied, tens of BDA of a larger range of ~5nm would diffuse (Figure
3.13).
There are two possible causes for the migration of BDA under scanning at high bias. It
could be due to the tip-induced electrical field or tip-induced vibrational excitation.
In order to discuss the tip-induced electrical field, we have to examine how close the tip
is located near the sample in our case. Combining the Landauer theory of the
conductance quantum and the quantum square lattice tunneling model, we can obtain the

Chapter 3. Study of 1,4-benzenediamine on Au(111) 74
tip-sample distance is roughly o
6Az with scanning conditions of U=0.1V and I=5pA.
If the bias voltage is increased to 1V without changing the current, 7o
z A . The tip-
sample distance was confirmed in STM measurements.[42-44]
If we use a rough estimation of /E U z , the electric field is apparently increased
largely by increasing the bias from 0.1V to 1V. In the real STM imaging condition, due
to the asymmetrical geometry, the electric field is inhomogeneous and concentrated in
the vicinity of the tip. With a similar tip-sample distance and a bias of 1 to 10V, the
electrical field strength is in the range of from 0.2 to 2 / AV by simulation.[42]
Tip-induced BDA migration can be discussed in terms of the potential energy difference
of BDA in the electric field. As a first order approximation,
p E , (3.2)
where is the permanent dipole moment, is the field-induced polarizability of the
adsorbate. In the case of BDA, the calculated static dipole moment is 2.49D for the cis,
and 0 for the trans conformer[32]. As a result, the potential energy is given as
21( ) ( ) ( )
2U r E r E r . (3.3)
With only static dipole moment considered, the consequential potential energy of BDA
cis form is about 0.1-1.0eV. This result is confirmed by experiment (1.0eV with Helium
atom spectroscopy measurement[19]) and the DFT calculation (0.1-0.4eV [19, 29]).

Chapter 3. Study of 1,4-benzenediamine on Au(111) 75
Since the diffusion energy of an adsorbate on a metal surface is about 1/10~1/3 of the
binding energy [45, 46], then the diffusion energy of BDA on Au(111) is about 0.01-
0.3eV, which is comparable with the tip-induced electric potential energy of BDA.
Similar STM observations of tip-induced atoms or molecules movement due to
electrical field effect have been reported [42-45, 47-50].
Another possible explanation of the BDA migration is the tip-induced vibrational
excitation. According to Persson, et al. [51, 52], when the tunneling electron injects into
the unoccupied states of an adsorbate, the molecule forms a temporary ionic state. When
the electron then tunnels into the substrate, the molecule goes back to the electronic
neutral state. During the process, the nucleus positions of the molecule could be changed
due to the Coulomb potential changes and thus excites a vibration. After this, the
vibrational excited state can decay with two channels. One is to decay directly to an
electron-hole pair, the other is to decay into a low-frequency translational mode, which
is associated with the lateral hopping of the molecules. Ab-initio calculations[32]
demonstrated that the stretch mode of N-H in BDA is about 0.4eV. STM measurement
with ammonia on Cu(111)[53] also reported that inelastic tunneling electron introduced
by STM tip is capable of the excitation of the N-H stretch mode, ( )s N H in ammonia
with 408meV.
However, this vibrational excitation usually exhibits a sharp increase of the incident rate
(defined as the percentage of the adsorbates that moved after a voltage pulse) around the
excitation energy[27], whereas our measurement indicates a gradual increase of moving

Chapter 3. Study of 1,4-benzenediamine on Au(111) 76
of BDAs with increasing bias above 0.1V. In addition, one voltage pulse can result in
tens of BDAs moving which is much bigger than the range an excited electron can
influence. Therefore, we conclude that the first explanation is more plausible for the
movement of BDA due to higher bias scanning above 0.1V.
3.5. Summary
In summary, We observed 5 different phases of BDA structures on Au(111) with UHV
STM: isolated BDA, chain structure, network structure, line lattice, and square lattice.
The latter three are SAMs. A simple phase diagram of different patterns due to different
coverages is provided. In our studies, isolated BDA adsorbs flat to the surface with a cis
configuration. In addition, we also showed the preferred adsorption sites of BDA,
including step edges, herringbone elbow sites and fcc sites. Finally we also observed
that BDA can be easily disturbed by the tip-induced electric field and hop to 1-2nm
away.
3.6. Bibliography
1. Nuzzo, R.G. and D.L. Allara, Adsorption of bifunctional organic
disulfides on gold surfaces. Journal of the American Chemical Society, 1983.
105(13): p. 4481-4483.
2. Love, J.C., et al., Self-Assembled Monolayers of Thiolates on Metals as a
Form of Nanotechnology. Chemical Reviews, 2005. 105(4): p. 1103-1170.
3. Ginger, D.S., H. Zhang, and C.A. Mirkin, The Evolution of Dip-Pen
Nanolithography. Angewandte Chemie International Edition, 2004. 43(1): p. 30-
45.

Chapter 3. Study of 1,4-benzenediamine on Au(111) 77
4. Krämer, S., R.R. Fuierer, and C.B. Gorman, Scanning Probe Lithography
Using Self-Assembled Monolayers. Chemical Reviews, 2003. 103(11): p. 4367-
4418.
5. Liu, G.-Y., S. Xu, and Y. Qian, Nanofabrication of Self-Assembled
Monolayers Using Scanning Probe Lithography. Accounts of Chemical
Research, 2000. 33(7): p. 457-466.
6. Xia, Y., et al., Unconventional Methods for Fabricating and Patterning
Nanostructures. Chemical Reviews, 1999. 99(7): p. 1823-1848.
7. Bain, C.D., J. Evall, and G.M. Whitesides, Formation of monolayers by
the coadsorption of thiols on gold: variation in the head group, tail group, and
solvent. Journal of the American Chemical Society, 1989. 111(18): p. 7155-7164.
8. Esplandiú, M.J., H. Hagenström, and D.M. Kolb, Functionalized Self-
Assembled Alkanethiol Monolayers on Au(111) Electrodes:1. Surface Structure
and Electrochemistry. Langmuir, 2001. 17(3): p. 828-838.
9. Fitts, W.P., J.M. White, and G.E. Poirier, Low-Coverage Decanethiolate
Structure on Au(111): Substrate Effects. Langmuir, 2002. 18(5): p. 1561-1566.
10. Fitts, W.P., J.M. White, and G.E. Poirier, Thermodynamics of
Decanethiol Adsorption on Au(111):Extension to 0 oC. Langmuir, 2002. 18(6): p.
2096-2102.
11. Poirier, G.E., W.P. Fitts, and J.M. White, Two-Dimensional Phase
Diagram of Decanethiol on Au(111). Langmuir, 2001. 17(4): p. 1176-1183.
12. Cyr, D.M., B. Venkataraman, and G.W. Flynn, STM Investigations of
Organic Molecules Physisorbed at the Liquid-solid Interface. Chemistry of
Materials, 1996. 8(8): p. 1600-1615.
13.Bigelow, W.C., D.L. Pickett, and W.A. Zisman, Oleophobic monolayers :
I. Films adsorbed from solution in non-polar liquids. Journal of Colloid Science,
1946. 1(6): p. 513-538.
14. Bigelow, W.C., E. Glass, and W.A. Zisman, Oleophobic monolayers. II.
Temperature effects and energy of adsorption. Journal of Colloid Science, 1947.
2(6): p. 563-591.
15. Xu, C., et al., Molecular interactions between organized, surface-
confined monolayers and vapor-phase probe molecules. 6. In-situ FT-IR external
reflectance spectroscopy of monolayer adsorption and reaction chemistry.
Analytical Chemistry, 1993. 65(15): p. 2102-2107.
16. Chen, S., et al., In Situ STM Elucidation of the Adsorption and
Polymerization of Alkyl Ring-Substituted Aniline on Au(111) Electrode. The
Journal of Physical Chemistry C. 114(18): p. 8493-8499.

Chapter 3. Study of 1,4-benzenediamine on Au(111) 78
17. Lee, Y., et al., In Situ STM Revelation of the Adsorption and
Polymerization of Aniline on Au(111) Electrode in Perchloric Acid and
Benzenesulfonic Acid. Langmuir. 26(8): p. 5576-5582.
18. Yau, S., et al., Structures of Aniline and Polyaniline Molecules Adsorbed
on Au(111) Electrode: as Probed by in Situ STM, ex Situ XPS, and NEXAFS.
The Journal of Physical Chemistry C, 2009. 113(31): p. 13758-13764.
19. Dell'Angela, M., et al., Relating Energy Level Alignment and Amine-
Linked Single Molecule Junction Conductance. Nano Letters. 10(7): p. 2470-
2474.
20. Aviram, A. and M.A. Ratner, MOLECULAR RECTIFIERS. Chemical
Physics Letters, 1974. 29(2): p. 277-283.
21. Reed, M.A., et al., Conductance of a molecular junction. Science, 1997.
278(5336): p. 252-254.
22. Porath, D., et al., Direct measurement of electrical transport through
DNA molecules. Nature, 2000. 403(6770): p. 635-638.
23. Cui, X.D., et al., Reproducible measurement of single-molecule
conductivity. Science, 2001. 294(5542): p. 571-574.
24. Venkataraman, L., et al., Dependence of single-molecule junction
conductance on molecular conformation. Nature, 2006. 442(7105): p. 904-907.
25. Venkataraman, L., et al., Electronics and Chemistry:Varying Single-
Molecule Junction Conductance Using Chemical Substituents. Nano Letters,
2007. 7(2): p. 502-506.
26. Venkataraman, L., et al., Single-Molecule Circuits with Well-Defined
Molecular Conductance. Nano Letters, 2006. 6(3): p. 458-462.
27. Bilic, A., et al., Adsorption of ammonia on the gold(111) surface. Journal
of Chemical Physics, 2002. 116(20): p. 8981-8987.
28. Li, Z. and D.S. Kosov, Nature of well-defined conductance of amine-
anchored molecular junctions: Density functional calculations. Physical Review
B, 2007. 76(3): p. 035415.
29. Hoft, R.C., et al., Adsorption of Amine Compounds on the Au(111)
Surface: A Density Functional Study. The Journal of Physical Chemistry C, 2007.
111(37): p. 13886-13891.
30. Dupont. [cited 2011 01.07]; Available from:
http://www2.dupont.com/Specialty_Chem_Intermediates/en_US/products/ppd.ht
ml.
31. Smiley, R.A., Phenylene- and Toluenediamines. Ullmann's Encyclopedia
of Industrial Chemistry. 2000: Wiley-VCH Verlag GmbH & Co. KGaA.

Chapter 3. Study of 1,4-benzenediamine on Au(111) 79
32. Tzeng, W.B. and K. Narayanan, Excited-state structure and vibrations of
p-diaminobenzene studied by ab initio calculations. Journal of Molecular
Structure: THEOCHEM, 1998. 434(1-3): p. 247-253.
33. Lindell, L., et al., Characterization of the interface dipole at the
paraphenylenediamine-nickel interface: A joint theoretical and experimental
study. Journal of Chemical Physics, 2005. 122(8): p. 12.
34. McClellan, A.L., Tables of Experimental Dipole Moments. W.H.
Freeman and Company, 1964.
35. Colapietro, M., et al., Molecular structure of p-diaminobenzene in the
gaseous phase and in the crystal. The Journal of Physical Chemistry, 1987.
91(7): p. 1728-1737.
36. Oezel, A.E., S. Akyuez, and J.E.D. Davies, Structural investigation of
1,4-diaminobenzene complexes of nickel and cadmium chloride by FT-IR and
Raman spectroscopy. Journal of Molecular Structure, 1995. 348: p. 77-80.
37. Emsley, J., Very strong hydrogen bonding. Chemical Society Reviews,
1980. 9(1): p. 91-124.
38. Fuller, W., Hydrogen Bond Lengths and Angles Observed in Crystals.
The Journal of Physical Chemistry, 1959. 63(10): p. 1705-1717.
39. Chambliss, D.D., R.J. Wilson, and S. Chiang, Nucleation of ordered Ni
island arrays on Au(111) by surface-lattice dislocations. Physical Review
Letters, 1991. 66(13): p. 1721.
40. Maksymovych, P. and J.T. Yates, Au Adatoms in Self-Assembly of
Benzenethiol on the Au(111) Surface. Journal of the American Chemical Society,
2008. 130(24): p. 7518-7519.
41. Grönbeck, H., A. Curioni, and W. Andreoni, Thiols and Disulfides on the
Au(111) Surface: The Headgroup - gold Interaction. Journal of the American
Chemical Society, 2000. 122(16): p. 3839-3842.
42. Yazdani, A., D.M. Eigler, and N.D. Lang, Off-Resonance Conduction
Through Atomic Wires. Science, 1996. 272(5270): p. 1921-1924.
43. Akiyama, R., T. Matsumoto, and T. Kawai, A Scanning Tunneling
Microscopy Study of Electrostatic and Proximity Effects in Tip-Assisted
Migration and Desorption of a DNA Base Molecule on SrTiO3. The Journal of
Physical Chemistry B, 1999. 103(29): p. 6103-6110.
44. Akiyama, R., T. Matsumoto, and T. Kawai, Mechanism of tip-assisted
migration and desorption of DNA base molecules on an SrTiO3 surface. Applied
Physics A: Materials Science & Processing, 1998. 66(0): p. S719-S722.

Chapter 3. Study of 1,4-benzenediamine on Au(111) 80
45. Stroscio, J.A. and D.M. Eigler, Atomic and Molecular Manipulation with
the Scanning Tunneling Microscope. Science, 1991. 254(5036): p. 1319-1326.
46. Nilekar, A.U., J. Greeley, and M. Mavrikakis, A Simple Rule of Thumb
for Diffusion on Transition-Metal Surfaces. Angewandte Chemie, 2006. 118(42):
p. 7204-7207.
47. Tsong, T.T., Effects of an electric field in atomic manipulations. Physical
Review B, 1991. 44(24): p. 13703.
48. Tsong, T.T. and C.-S. Chang, High Field Effects and Methods Useful for
Transferring Atoms in Scanning Tunneling Microscope. Japanese Journal of
Applied Physics, 1995. 34(Part 1, No. 6B): p. 3309.
49. Whitman, L.J., et al., Manipulation of Adsorbed Atoms and Creation of
New Structures on Room-Temperature Surfaces with a Scanning Tunneling
Microscope. Science, 1991. 251(4998): p. 1206-1210.
50. Saranin, A.A., et al., Growth of thallium overlayers on a Si(100) surface.
Physical Review B, 2005. 71(3): p. 035312.
51. Komeda, T., et al., Lateral Hopping of Molecules Induced by Excitation
of Internal Vibration Mode. Science, 2002. 295(5562): p. 2055-2058.
52. Persson, B.N.J. and H. Ueba, Theory of inelastic tunneling induced
motion of adsorbates on metal surfaces. Surface Science, 2002. 502-503: p. 18-
25.
53. Pascual, J.I., et al., Selectivity in vibrationally mediated single-molecule
chemistry. Nature, 2003. 423(6939): p. 525-528.

81
Chapter 4
Properties of Graphene Nanoislands on Co(0001)
Graphene, as a 2D material, has attracted a lot of attention due to its novel properties
since the successful fabrication in 2004. The high carrier mobility[1, 2], possibility of
chemical doping[3, 4], and optical transparency make it a potential building block for
the future devices[5], such as touchscreens, liquid crystal displays, organic photovoltaic
cells, and organic light-emitting diodes (OLEDs). In addition, its weak spin-orbit
coupling and large phase coherence length have suggested graphene as an ideal material
for spintronics application [6-8].
In order to make devices out of graphene, it is inevitable to make metal electrodes
connected with it, which can alter its electronic properties. Hence, it is essential to
understand the interaction between graphene and metal in the contact region.

Chapter 4. Properties of graphene nanoislands on Co(0001) 82
4.1. Introduction
4.1.1. Introduction to Graphene and Graphene Nanoribbons
Brief history of graphene
The term, “graphene”, was first coined to describe a single sheet of graphite in graphite
intercalation compounds in 1987 [9]. However, it was not a true 2D material then, in the
sense that it is neither in a free-standing form nor supported by a weak-coupled substrate.
In 2004, Andre Geim and Konstantin Novoselov first successfully separated a single
layer sheet of graphene on SiO2, who were awarded the 2010 Nobel Prize in Physics[10].
Since its discovery, graphene has become a popular subject due to its novel properties.
One definition of graphene is described as follows: “Graphene is the name given to a
flat monolayer of carbon atoms tightly packed into a two-dimensional (2D) honeycomb
lattice, and is a basic building block for graphitic materials of all other dimensionalities.
It can be wrapped up into 0D fullerenes, rolled into 1D nanotubes or stacked into 3D
graphite”[11]. Indeed, graphene is the mother of all graphitic materials. Besides the
materials mentioned in the definition, it can also be etched into nanoribbons, which will
be discussed further later. The carbon-carbon bond length in the honeycomb lattice of
graphene is 1.4 Å.
Fabrication methods
The primary methods to fabricate graphene are drawing method and epitaxial growth
method (on SiC, Cu, Ni, Co, etc).

Chapter 4. Properties of graphene nanoislands on Co(0001) 83
Drawing method refers to repeated splitting of a graphite piece into increasingly thinner
pieces until a thin enough piece is achieved. It is often called the scotch tape method as
scotch tape is used to separate the layers. One of the most common substrate used is
SiO2 due to its wide application in the semiconductor industry and the weak coupling
with graphene. In many cases, a special thickness of 300nm of SiO2 is used in order to
increase the contrast between graphene and the underlying substrate under optical
microscope. With this method, graphene with extremely high mobility can be obtained.
However, graphene size and throughput are limited in this case.
Epitaxial growth method refers to the use of the atomic structure of various substrates to
seed the graphene growth. The commonly used substrates are SiC or metal (Cu, Co, and
Ir). With SiC, a direct heating (>1100oC) of SiC can produce graphene[12], whereas in
the case of metal substrates, a chemical vapor deposition procedure is needed with
hydrocarbon precursors[13, 14]. With this method, the graphene size can be as large as
the substrate. However, the graphene thickness might be not uniform and the interaction
between the graphene and substrate can influence the graphene properties.
There are also other ways to produce graphene. For example, graphene can be produced
through reduction of graphite oxide, which can be traced back to 1962 by P. Boehm[15].
By rapid heating of graphite oxide, few percent of graphene flakes can be produced
along with graphite powders. However, the quality of the graphene flakes are not as
good as exfoliated graphene.

Chapter 4. Properties of graphene nanoislands on Co(0001) 84
Selected properties and potential application of graphene
Graphene has unique transport properties due to its band structure. Intrinsic graphene is
a semi-metal or a semiconductor with zero bandgap. The energy dispersion relation E vs.
k is linear for low energies near the six corners of the 2D Brillouin zone. Thus, electrons
or holes with low energy near those conical corners behave like massless Dirac fermions
and those six corners of Brillouin zone are called Dirac points. The linear dispersion
relation can be expressed as:
( ) FE k k , (1.1)
Where F is the Fermi velocity and F ~106 m/s.
Experimental results show that graphene has remarkably high electron mobility at room
temperature. It is also independent of temperature between 10K~100K, which implies
that the dominant scattering mechanism is defect scattering [1, 16, 17].
Graphene is also an ideal material for spin transport due to its weak spin-orbit coupling,
large phase coherent length and near absence of nuclear magnetic moments. Electron
spin-current injection and control in graphene was recently demonstrated [6, 8, 18].

Chapter 4. Properties of graphene nanoislands on Co(0001) 85
Graphene nanoribbons (GNRs)
Graphene nanoribbons are particular patterns that are cut from graphene. Depending on
how the edges are cut, they can have either zigzag or armchair pattern. In Figure 4.2, if
the edges of the graphene nanoribbons are cut along green lines, the edges have zigzag
patterns; if the edges are cut along the purple lines, they have armchair patterns.
Figure 4.1: Schematic of the band structure of graphene near
Fermi level. The valence and conduction bands are connected by 6 Dirac points which are
connected with green lines. The dispersion relation near Dirac points is linear,
which can be depicted by Dirac cones.
(http://www.mirc.gatech.edu/raghu/?page_id=166)

Chapter 4. Properties of graphene nanoislands on Co(0001) 86
Calculations based on density functional theory show that armchair GNRs are
semiconductors with an energy gap proportional to the inverse of the width of
GNRs[19], and zigzag GNRs are also semiconducting and present spin polarized edges.
Transport measurement verifies the inverse relation between the energy gap and the
GNR width[20] but no experiment before 2009 has identified the exact configuration at
the edges[5]. The spin polarized edges make GNRs as a potential application in
Figure 4.2: Schematic of the zigzag edges and armchair edges of
graphene. If the edges of the graphene nanoribbons are cut along green lines, the edges
have zigzag patterns; if the edges are cut along the purple lines, they have
armchair patterns. (Courtesy of Deborah Prezzi.)

Chapter 4. Properties of graphene nanoislands on Co(0001) 87
spintronics. GNRs are also a possible alternative to copper as integrated circuit
interconnects due to their high electrical and thermal conductivity.
4.1.2. Introduction to Cobalt (Co)
Cobalt properties
Cobalt is a strong ferromagnet, with a stable magnetic polarization and high orbital
magnetic moment [5, 21-26], which makes it an ideal material for spintronics
application[27]. Its Curie temperature is 1115oC, and the magnetic moment is 1.6-1.7
Bohr magnetons per atom[28].
Cobalt is known to have two allotropic phases, an hcp phase (at low temperature) and an
fcc phase (at high temperature). The transition between hcp phase and fcc phase is
reversible but enthalpy change ( 440 /h kJ mol ) and volume change
( / 0.0036V V ) is small[24], this makes the intermix of the two crystal structure
possible. The ideal transition temperature is approximately 700K with considerable
thermal hysteresis.
When the transition happens, there is a substantial change in the stacking sequence.
Hence, the electronic structure, electrical resistivity, and work function will also change
[24, 29]. In this way, a single crystal Co sample might be destroyed when the transition
happens, which make the sample preparation more difficult than gold preparation.

Chapter 4. Properties of graphene nanoislands on Co(0001) 88
Co(0001) properties
As mentioned above, the stable structure of cobalt at room temperature is hcp structure,
whose facet is conventionally described by a four-number miller index. The four unit
vectors are shown in Figure 4.3 as1a ,
2a , 3a , and c , where
1a , 2a , and
3a are on the
same plane and 120oC apart. c is perpendicular to all of the other unit vectors. In the
four-number miller index for hcp structure, (ijkl), k=-(i+j).
The hcp(0001) has a ABA stacking order, shown in Figure 4.4(a). In any adjacent two
layers, the atoms of one layer always occupy the hollow sites of the other layer, which is
Figure 4.3: Schematic of the unit vectors in hcp crystals. The four arrows indicate the four exes inside a unit cell of hcp crystals. 1a , 2a
and 3a are on the same place and 120o apart from each. c is perpendicular to all
of the other axes.
(web.mse.uiuc.edu/courses/mse280/notes/03/ch3_p3.ppt)

Chapter 4. Properties of graphene nanoislands on Co(0001) 89
identical to any two adjacent layers in the fcc(111) configuration. Only by adding at
least one more layer can we distinguish between fcc(111) and hcp(0001)
From LEED studies, the Co(0001) atom-to-atom distance is ~2.5 Å. Compared with the
graphene lattice constants, the mismatch is less than 2%. Besides, there is no indication
of reconstruction and little surface relaxation, which suggest that we should observe 1x1
surface atoms without a long-range reconstruction[26, 30].
Figure 4.4: Schematic of hcp(0001) structures. (a) The hcp structure from side view. Gery, blue and green atoms are in three
different layers and form ABA stacking. (b) The same structure from top view.
Blue and red atoms are two different layers.
(web.mse.uiuc.edu/courses/mse280/notes/03/ch3_p3.ppt)

Chapter 4. Properties of graphene nanoislands on Co(0001) 90
Preparation of Co(0001)
We use a traditional sputtering and annealing method, starting from a precut Co(0001)
single crystal, similar to the preparation of Au(111). The most important difference is
the annealing temperature. As mentioned in the previous section, there is a phase
transition of Co hcp to fcc structure around 700K. Therefore, we have to strictly control
the temperature below the transition temperature.
Electronic structures of Co(0001)
The electronic structures of Co(0001) have also been thoroughly studied. The origin of
the states is mostly clear by combining experimental results (mainly obtained by
photoemission spectroscopy and scanning tunneling spectroscopy) and theoretical
calculations [21-23, 25, 26].
In the region of E>EF, 3 peaks have been detected by spin-resolved inverse
photoemission spectroscopy[23] within 2eV above Fermi level. The peak closest to the
Fermi level is located at 0.24eV, which is assigned as a majority-spin surface state
located at the surface Brillouin zone center . Another two features are around 0.75eV
and are very close to each other. They are assigned to be associated with minority-spin
states, and they are either surface states or a mixture of bulk states and surface states.
In the region below Fermi level, different measurements and calculations have some
discrepancies. Photoemission spectroscopy detected a peak at -0.3eV, which was

Chapter 4. Properties of graphene nanoislands on Co(0001) 91
assigned as a sp-like surface state [25, 26]. Scanning Tunneling microscopy detected a
peak at -0.43eV instead and it was identified as a minority-spin -centered surface
state[21]. Later on, a spin-polarized calculation identified an additional state at -0.5eV
as a minority-spin surface state[22].
4.2. Experimental and Calculation Methods
The experiment was performed in a low-temperature Omicron STM under ultrahigh
vacuum conditions, at a base pressure of 1x10-11
Torr. A cobalt single crystal with
precut (0001) orientation was cleaned in situ by repeated cycles of argon sputtering and
annealing at 570K. The STM image of a clean Co(0001) surface was shown in Figure
4.5 with no obvious reconstruction. The lattice constant is 2.5 Å, as expected[30].
After obtaining the clean surface, we dosed contorted hexabenzocoronene (HBC)[31]
molecules (The structure of HBC was shown in the inset of Figure 4.5.) onto the clean
Co(0001) surface (kept at room temperature) by thermal deposition at 605K. By
annealing the sample at ~600K for 20min, we were able to obtain graphene nanoislands.
All the STM and STS were performed at 4.9K.

Chapter 4. Properties of graphene nanoislands on Co(0001) 92
We also carried out DFT calculations based on local-density approximation for the
exchange-correlation potential, using a plane-wave basis set and ultrasoft
pseudopotentials, as implemented in the Quantum-ESPRESSO package. The calculation
was done by collaborators[5].
Figure 4.5: STM topographic image of Co(0001) 1x1 structure of Co(0001) without any obvious reconstruction. .The
measured lattice constant is 2.5 Å. The scanning voltage is 5mV. The structure
of one HBC molecule was illustrated in the inset.

Chapter 4. Properties of graphene nanoislands on Co(0001) 93
4.3. Results and Discussion
4.3.1 Structures of the Graphene Nanoislands
The STM images of as-deposited and after annealing HBC/Co(0001) are shown in
Figure 4.6. The HBC molecules are clustered on the surface without any obvious
ordered structures. After annealing at 600K, which is above the temperature (~410K) of
dehydrogenation and H2-desorption temperature for hydrocarbons on Co(0001)[32],
they were dehydrogenated and epitaxially grow on the substrate to form islands of
nanometer scale.
Most of the islands have triangular or hexagonal shape (shown in Figure 4.6b). All of
the edges preferentially exhibit zigzag configurations which will be discussed in a later
section. The measured height of the graphene adlayer above the metal surface varies
with the scanning voltage, ranging from ~1.5 Å at low tunneling bias to ~2.2 Å at high
tunneling bias (Figure 4.7).

Chapter 4. Properties of graphene nanoislands on Co(0001) 94
Figure 4.6: STM topographic images of as-deposited and after
thermal annealing of HBC/Co(0001) (a-b) Co(0001) after deposition of HBC molecules, which are clustered
on the surface without ordered structures. After thermal annealing, they form
triangular or hexagonal islands in (c). The scanning bias is 3mV in (a-b) and
5mV in (c).

Chapter 4. Properties of graphene nanoislands on Co(0001) 95
We also examined the registry of the carbon atoms on the Co substrate. Under bias
condition of -3mV, both the carbon atoms on the graphene adlayer and cobalt on
Co(0001) are resolved, as in Figure 4.8. However, only every other carbon atoms are
resolved, just like in the case of graphite[33]. This effect is expected due to the
inequivalence of adjacent carbon atoms in the graphene adlayer with respect to the
underlying substrate. With the help of the guidelines in Figure 4.8a, we can clearly see
that the resolved carbon atoms are sitting directly above the cobalt atoms on the
substrate (on-top site, or A-site), which demonstrates epitaxial growth of the graphene
nanoislands. Since one of the two inequivalent carbon atoms in a graphene unit cell is
sitting directly at A-site, the other carbon atoms must be either on an hcp hollow site (B-
site), or on an fcc hollow site (C-site) of the cobalt substrate (See the AB and AC
models in Figure 4.8b). Therefore, a structure model like the BC model in Figure 4.8b is
unlikely.

Chapter 4. Properties of graphene nanoislands on Co(0001) 96
Figure 4.7: STM topographic image of one graphene island and
the corresponding height profile on Co(0001) In (a), an STM topographic image of one hexagonal-shape graphene
island on Co(0001) is shown. Both of the carbon atoms on the graphene
adlayer and the Co atoms on the substrate are resolved. The scanning voltage is
-3mV. (b) The line profile at the light blue curve. The blue profile is from low
bias scanning condition (-3mV) and the red profile is from high bias scanning
condition (-400mV).

Chapter 4. Properties of graphene nanoislands on Co(0001) 97
From DFT calculations, the spacing between the plane of Co atoms and the graphene
adlayer for the on-top geometries was found to be 2.07 Å, which is comparable to the
STM measurement of 1.5~2.2 Å. Comparing this spacing with those between graphene
and other metals such as Au, Ag, Cu, or Pt which have a typical value of 3.3 Å[34], it is
much smaller. This is due to a stronger interaction than van der Waals interaction with
the surface.
In addition, the binding energies for the three different structure models are also
calculated. The AC model appears to be the most stable configuration (Eb=0.264eV),
which has almost the same binding energy of the AB model (Eb=0.256eV). The BC
model has the smallest binding energy (Eb=0.056eV) and is unlikely a stable
configuration if compared to the AC and BC models. Similar results are also obtained
from other calculation[34].

Chapter 4. Properties of graphene nanoislands on Co(0001) 98
Figure 4.8: STM topographic image of one graphene island and
the schematics of possible epitaxial growth models on Co(0001) (a) An STM topographic image of one triangular graphene island on
Co(0001). Both of the carbon atoms on the graphene adlayer and the cobalt
atoms on Co(0001) are resolved under this tunneling condition. The registry of
the carbon atoms relative to the substrate atoms are also shown with the
guidelines. The scanning bias is -3mV. (b) Three structure models of
epitaxially grown graphene on Co substrate are shown. Carbon atoms are
shown in purple; the top layer and the second layer of Co atoms are shown in
green and black, respectively.

Chapter 4. Properties of graphene nanoislands on Co(0001) 99
4.3.2. Electronic Properties
The differential conductance spectra for both of the clean Co(0001) substrate and a
graphene nanoisland on Co(0001) are shown in Figure 4.9. In the spectrum of cobalt in
Figure 4.9a, we observe three main features: a strong peak at -0.52eV, a feature at
+0.1eV, and a feature around +0.74eV. The peak at -0.52eV is found to be a Co(0001)
surface state of minority-spin character, as expected from a theoretical calculation[22]
The feature at +0.1eV is a majority-spin surface state at Brillouin zone center , to
which similar results have been observed by photoemission measurement[23]. The
feature around +0.74eV is associated with minority-spin, corresponding to either a
surface state or a mixture of surface and bulk states[23].
The obtained STS spectra of the central region of the graphene nanoislands are very
different from those of clean Co(0001). Shown in Figure 4.9b is the differential
conductance spectrum averaged over a small area near the center of a graphene island
(see the rectangular region in Figure 4.7a), well separated from the graphene boundaries
and away from any defect. The results have been reproduced by different tips, therefore,
we can rule out the contributions from tip artifacts. In addition, the grid points when the
STS was performed encompass at least 23 graphene unit cells with a fine spacing of
~0.86 Å, therefore, the results represent true spatially averaged spectra over two atoms
in the graphene unit cell. There are three main features on the spectra of graphene/Co at
-0.37eV, 0.25eV, and +0.64eV. They are designated as P1, P2, and P3, respectively.
Compared with the spectra of clean Co(0001), the features are quite different; the results

Chapter 4. Properties of graphene nanoislands on Co(0001) 100
are also unlike those of isolated graphene monolayers on oxide surfaces, which are
relatively featureless[35].
Since the AC structure is the most stable structure among the three possible structures,
the band structure for AC is obtained by DFT calculation. In Figure 4.10, the majority-
spin bands are shown in grey shade, among which the contributions from carbon are
Figure 4.9: Experimental differential conductance spectra,
dI/dV, of Co(0001) and graphene island/Co Experimental differential conductance spectra, dI/dV, of (a) clean
Co(0001) substrate and (b) graphene island on Co(0001), averaged over the
rectangular region shown in Figure 4.7a. The three main features are labeled as
P1, P2, and P3, respectively. All energies are referenced to the Fermi level.

Chapter 4. Properties of graphene nanoislands on Co(0001) 101
shown in red dots. In order to compare with the ideal graphene sheet, we also plot the
band structure of the ideal graphene sheet in the same figure in black lines, only with an
energy downshift of 1.1eV. In the figure, we can find that the downshifted bands for
ideal graphene sheet and graphene/Co perfectly overlap, as expected, because bonds
are in-plane and don’t interact with Co. The downshift of 1.1eV indicates an apparent n-
dope situation. The calculated work function for graphene/Co is 3.65eV, while those for
isolated graphene and Co(0001) are 4.39eV and 5.40eV, respectively. The decrease of
the work function is consistent with the downshift of bands.
The bands are very different between isolated graphene and graphene/Co. The Dirac
cone of the ideal graphene at K point has been destroyed. The apparent portions of the
bands are shifted by an additional ~1eV. These observations indicate a strong
coupling of the bands to Co substrate.
The projected density of states (PDOS) of graphene/Co is calculated by summing up the
projections of each state onto the carbon zp orbitals. The upper majority-spin band in
Figure 4.10b results in two peaks from -2V to 2V: 0.8eV and -0.3eV, which are derived
from the carbon contributions from the region near M-K line. (The main contribution
from carbon to the bands, shown in red dots in Figure 4.10 for the two spin channels
(red dots), is mainly visible around the K point.) On the other hand, the minority-spin
band in Figure 4.10c results in two analogue peaks at 1.7eV and 0.8eV.

Chapter 4. Properties of graphene nanoislands on Co(0001) 102
Figure 4.10: Calculated energy bands are density of states of
graphene on Co(0001) in the AC geometry. (a)Majority-spin bands with Co contributions (grey lines) and carbon
contributions (red dots), against the bulk Co(0001) projected bands (shaded
area) and the energy bands for ideal graphene downshifted by 1.1eV (black
lines). (b) Details of (a) near Fermi level (on the left) and the atom-resolved
and total projected DOS (on the right.) The red and blue curves are the PDOS
from A-site and C-site, respectively. The black curve is the total PDOS. (c)
Same of minority-spin bands.

Chapter 4. Properties of graphene nanoislands on Co(0001) 103
Figure 4.11: Comparison of calculated PDOS and experimental
STS data of graphene/Co(0001). (a) Calculated PDOS and (b) experimental STS data of graphene/Co(0001)
with main features labeled with P1, P2, and P3.

Chapter 4. Properties of graphene nanoislands on Co(0001) 104
Figure 4.12: STM topographic images, conductance map, and
STS of graphene islands on Co(0001). (a-b) Topographic images of graphene islands with the corresponding
conductance map around -150meV. The images were obtained at scanning bias
of -3mV. (c) The STS of different regions on graphene islands. The pink and
green curves were taken from edge regions and the black curve was from center
region. The corresponding area is shown in (b) with the same colors.

Chapter 4. Properties of graphene nanoislands on Co(0001) 105
The sum of the PDOS for majority-spin and minority-spin (shown in Figure 4.11a),
which is consistent with the experimental results (shown again in Figure 4.11b), with
differences in the feature locations of about 0.1-0.2eV. As noted above, those features
result mainly from the regions near M-K line, which are expected to decay quickly as a
function of distance above the surface near the Brillouin zone center. On the other hand,
the states at zone center have little contribution from the graphene states, giving rise to
featureless partial DOS, which is markedly different from the experiment. Therefore, we
think that a mechanism which mixes zone-edge and zone-center states might be present.
4.3.3. Edge States
As mentioned above in Section 4.3.1, the graphene islands are mostly triangular or
hexagonal, with angles either of 60o or 120
o, preserving the edge type (See Figure 4.12a).
In a closer inspection, we found that both of shapes have zigzag edges. In addition, we
have found an edge localized state ~ -150meV if we compare STS in the center region
with that of the edge region in Figure 4.12c. A conductance map around this bias also
shows a bright feature localized at the edges (See insets of Figure 4.12a-b).
It is already known that armchair edge type was found to be more stable according to
theory calculation[36]. However, in our calculation, when the ribbons are adsorbed to
Co(0001) substrate, the zigzag type is found to be more stable, which is consistent with
experimental results.

Chapter 4. Properties of graphene nanoislands on Co(0001) 106
4.4. Summary
In conclusion, we have successfully grown epitaxial graphene nanoislands on Co(0001).
Our STM results indicate an on-top registry with the underlying substrate with zigzag
edges. These phenomena have been further validated by DFT calculations. We also
observed several distinctive features from isolated graphene sheet in the conductance
spectrum, which was interpreted to result from strong coupling with the cobalt substrate
by DFT calculation. Furthermore, distinctive electronic features exist at the edges from
center area, which will need further exploration.
4.5. Bibliography
1. Novoselov, K.S., et al., Two-dimensional gas of massless Dirac fermions
in graphene. Nature, 2005. 438(7065): p. 197-200.
2. Zhang, Y., et al., Experimental observation of the quantum Hall effect
and Berry's phase in graphene. Nature, 2005. 438(7065): p. 201-204.
3. Liu, L., et al., Graphene Oxidation: Thickness-Dependent Etching and
Strong Chemical Doping. Nano Letters, 2008. 8(7): p. 1965-1970.
4. Wehling, T.O., et al., Molecular Doping of Graphene. Nano Letters,
2007. 8(1): p. 173-177.
5. Eom, D., et al., Structure and Electronic Properties of Graphene
Nanoislands on Co(0001). Nano Letters, 2009. 9(8): p. 2844-2848.
6. Cho, S., Y.F. Chen, and M.S. Fuhrer, Gate-tunable graphene spin valve.
Applied Physics Letters, 2007. 91(12).
7. Karpan, V.M., et al., Graphite and Graphene as Perfect Spin Filters.
Physical Review Letters, 2007. 99(17): p. 176602.
8. Ohishi, M., et al., Spin injection into a graphene thin film at room
temperature. Japanese Journal of Applied Physics Part 2-Letters & Express
Letters, 2007. 46(25-28): p. L605-L607.

Chapter 4. Properties of graphene nanoislands on Co(0001) 107
9. Mouras, S., et al., Synthesis of first stage graphite intercalation
compounds with fluorides. Vol. 24. 1987, Paris, FRANCE: Gauthier-Villars.
10. Novoselov, K.S., et al., Electric Field Effect in Atomically Thin Carbon
Films. Science, 2004. 306(5696): p. 666-669.
11. Geim, A.K. and K.S. Novoselov, The rise of graphene. Nat Mater, 2007.
6(3): p. 183-191.
12. Sutter, P., Epitaxial graphene: How silicon leaves the scene. Nat Mater,
2009. 8(3): p. 171-172.
13. Chuhei, O. and N. Ayato, Ultra-thin epitaxial films of graphite and
hexagonal boron nitride on solid surfaces. Journal of Physics: Condensed Matter,
1997. 9(1): p. 1.
14. L. Zhao, K.T.R., H. Zhou, R. He, T. F. Heinz, A. Pinczuk, G. W. Flynn,
A. N. Pasupathy, The Atomic-scale Growth of Large-Area Monolayer Graphene
on Single-Crystal Copper Substrates. Arxiv.org, 2010.
15. http://graphenetimes.com/1961/11/dunnste-kohlenstoff-folien/.
16. Chen, J.-H., et al., Intrinsic and extrinsic performance limits of graphene
devices on SiO2. Nat Nano, 2008. 3(4): p. 206-209.
17. Morozov, S.V., et al., Giant Intrinsic Carrier Mobilities in Graphene and
Its Bilayer. Physical Review Letters, 2008. 100(1): p. 016602.
18. Tombros, N., et al., Electronic spin transport and spin precession in
single graphene layers at room temperature. Nature, 2007. 448(7153): p. 571-
574.
19. Barone, V., O. Hod, and G.E. Scuseria, Electronic Structure and Stability
of Semiconducting Graphene Nanoribbons. Nano Letters, 2006. 6(12): p. 2748-
2754.
20. Han, M.Y., et al., Energy Band-Gap Engineering of Graphene
Nanoribbons. Physical Review Letters, 2007. 98(20): p. 206805.
21. Okuno, S.N., T. Kishi, and K. Tanaka, Spin-Polarized Tunneling
Spectroscopy of Co(0001) Surface States. Physical Review Letters, 2002. 88(6):
p. 066803.
22. Barral, M., et al., Characterization of the surface states of Co(0001),
Co(111), and ultrathin films of Co on Cu(111). Physical Review B, 2005. 72(12):
p. 125433.
23. Math, C., J. Braun, and M. Donath, Unoccupied spin-split surface state
on Co(0001): experiment and theory. Surface Science, 2001. 482-485(Part 1): p.
556-561.

Chapter 4. Properties of graphene nanoislands on Co(0001) 108
24. Erbudak, M., et al., Surface Phase Transitions during Martensitic
Transformations of Single-Crystal Co. Physical Review Letters, 1997. 79(10): p.
1893.
25. Wetli, E., et al., High-resolution photoemission study of hcp-Co(0001).
Surface Science, 1998. 402-404: p. 551-555.
26. Himpsel, F.J. and D.E. Eastman, Intrinsic Lambda _{1}-symmetry
surface state on Co(0001). Physical Review B, 1979. 20(8): p. 3217.
27. Georg Schmidt, R.F.T.G.G. and et al., Electrical spin-injection into
semiconductors-from cobalt contacts to semiconductor spin aligners. 2000,
Springer. p. 309-320.
28. Wikipedia. [cited 2010 12/09]; Available from:
http://en.wikipedia.org/wiki/Cobalt.
29. Giber, J., R. Drube, and V. Dose, Critical point energies in hcp and fcc
cobalt from appearance potential spectra. Applied Physics A: Materials Science
& Processing, 1991. 52(2): p. 167-170.
30.Lee, B.W., et al., Surface structures of the two allotropic phases of cobalt.
Physical Review B, 1978. 17(4): p. 1510.
31. Xiao, S., et al., Molecular Wires from Contorted Aromatic Compounds.
Angewandte Chemie International Edition, 2005. 44(45): p. 7390-7394.
32. Vaari, J., J. Lahtinen, and P. Hautojärvi, The adsorption and
decomposition of acetylene on clean and K-covered Co(0001). Catalysis Letters,
1997. 44(1): p. 43-49.
33. Gwo, S. and C.K. Shih, Site-selective imaging in scanning tunneling
microscopy of graphite: The nature of site asymmetry. Physical Review B, 1993.
47(19): p. 13059.
34. Giovannetti, G., et al., Doping Graphene with Metal Contacts. Physical
Review Letters, 2008. 101(2): p. 026803.
35. Stolyarova, E., unpublished results.
36. Wassmann, T., et al., Structure, Stability, Edge States, and Aromaticity of
Graphene Ribbons. Physical Review Letters, 2008. 101(9): p. 096402.