Chapter -4 Nitrobenzene Hydrogenation -...
30
Chapter -4 Nitrobenzene Hydrogenation
-
Upload
nguyendieu -
Category
Documents
-
view
250 -
download
0
Transcript of Chapter -4 Nitrobenzene Hydrogenation -...
Chapter -4 Nitrobenzene
Hydrogenation
Chapter-4 Nitrobenzene hydrogenation
82
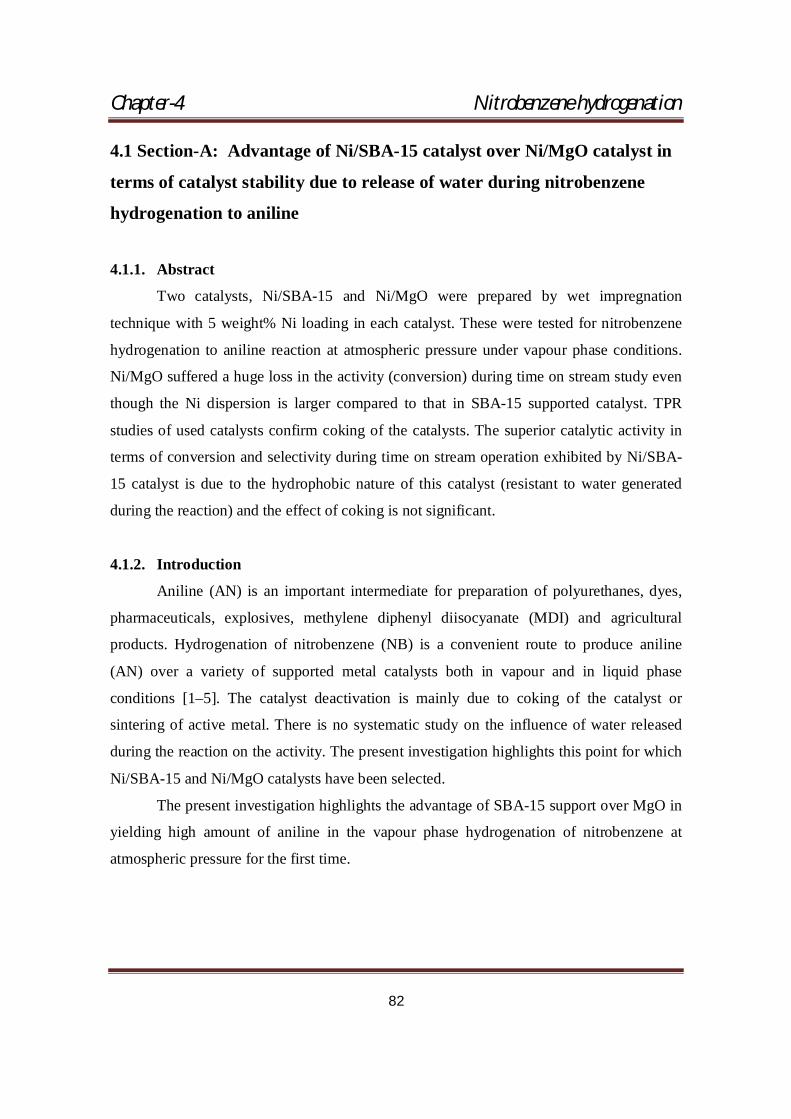
4.1 Section-A: Advantage of Ni/SBA-15 catalyst over Ni/MgO catalyst in
terms of catalyst stability due to release of water during nitrobenzene
hydrogenation to aniline
4.1.1. Abstract
Two catalysts, Ni/SBA-15 and Ni/MgO were prepared by wet impregnation
technique with 5 weight% Ni loading in each catalyst. These were tested for nitrobenzene
hydrogenation to aniline reaction at atmospheric pressure under vapour phase conditions.
Ni/MgO suffered a huge loss in the activity (conversion) during time on stream study even
though the Ni dispersion is larger compared to that in SBA-15 supported catalyst. TPR
studies of used catalysts confirm coking of the catalysts. The superior catalytic activity in
terms of conversion and selectivity during time on stream operation exhibited by Ni/SBA-
15 catalyst is due to the hydrophobic nature of this catalyst (resistant to water generated
during the reaction) and the effect of coking is not significant.
4.1.2. Introduction
Aniline (AN) is an important intermediate for preparation of polyurethanes, dyes,
pharmaceuticals, explosives, methylene diphenyl diisocyanate (MDI) and agricultural
products. Hydrogenation of nitrobenzene (NB) is a convenient route to produce aniline
(AN) over a variety of supported metal catalysts both in vapour and in liquid phase
conditions [1–5]. The catalyst deactivation is mainly due to coking of the catalyst or
sintering of active metal. There is no systematic study on the influence of water released
during the reaction on the activity. The present investigation highlights this point for which
Ni/SBA-15 and Ni/MgO catalysts have been selected.
The present investigation highlights the advantage of SBA-15 support over MgO in
yielding high amount of aniline in the vapour phase hydrogenation of nitrobenzene at
atmospheric pressure for the first time.
Chapter-4 Nitrobenzene hydrogenation
83
4.1.3. Experimental
4.1.3.1. Catalyst preparation
The mesoporous SBA-15 support was prepared by using triblock co-polymer
(P123) as a structure directing agent and Tetraethylorthosilicate (M/s. Sigma Aldrich
Chemicals, USA) as reported by Zhao et al, [6]. MgO was prepared by precipitation of
Mg(NO3)2 (M/s. Loba chemie, India) with 5% Na2CO3 solution (M/s. Loba chemie, India
followed by washing, drying (393 K for 12 h) and calcining (773 K for 5 h) the precipitate.
The Ni based catalysts were prepared by wet impregnation method using Ni(NO3)2 6H2O
(M/s. Loba chemie, India) and the excess water was removed by evaporation followed by
drying at 393 K for 12 h and calcination at 723 K for 5 h.
4.1.3.2. Catalyst characterisation
All the above catalysts are characterized by XRD, BET method, H2 pulse
chemisorption and TPR. Details of all above techniques and procedures have already been
described in chapter-3.
4.1.3.3. Activity studies
The hydrogenation of nitrobenzene was carried out in a fixed bed glass reactor (14
mm i.d and 300 mm long) at atmospheric pressure in the temperature range of 498-573 K
with a liquid feed rate of 1 cm3 h-1 and H2 flow rate of 18 cm3 min-1 over 1 g of catalyst. In a
separate experiment, co-feeding of H2O along with NB (H2O: NB = 2:3) is maintained.
The product mixture was collected in ice trap. The product components were confirmed by
GCMS-QP 5050A and analyzed by FID equipped GC-17A (M/s. Shimadzu Instruments,
Japan).
4.1.4. Results and Discussion
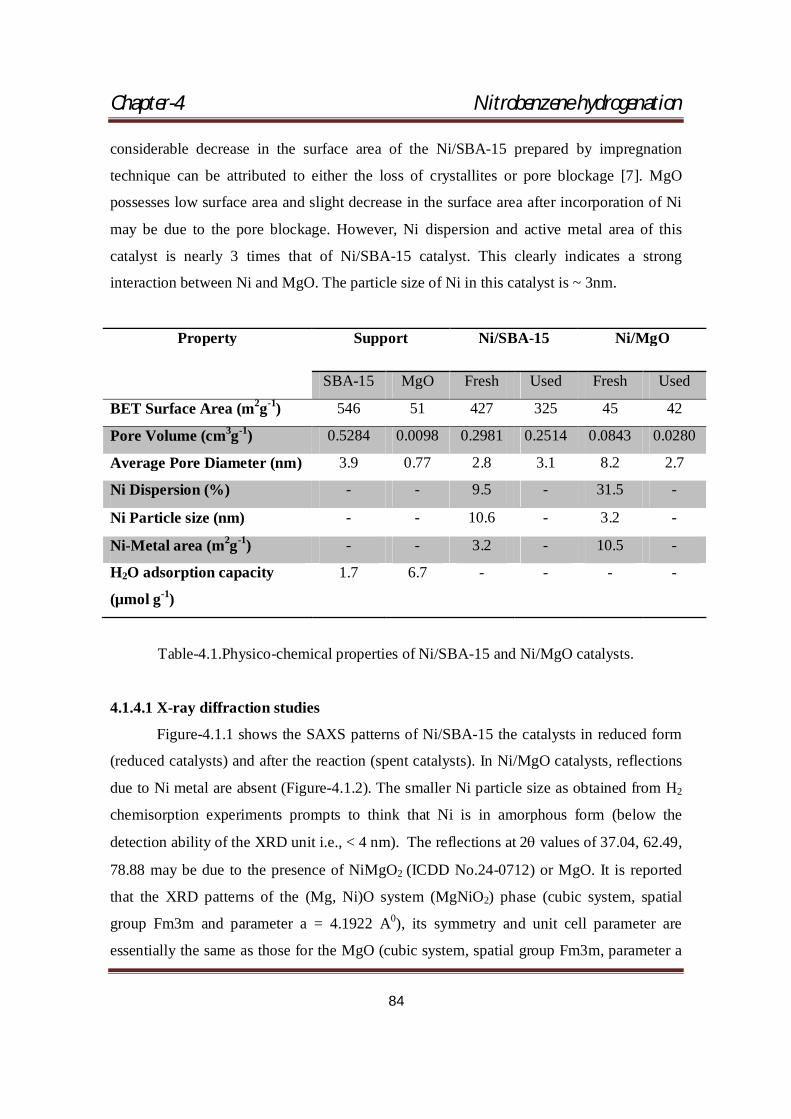
Table-4.1 indicates the BET surface area, pore volume, Average pore diameter, Ni
dispersion by H2 pulse chemisorption, Ni particle size and Water adsorption uptake of the
two catalysts. The decrease in BET surface area of Ni/SBA-15 is due to the pore blockage.
This is clear from the fact that the Ni particle size (10.6 nm) is too big to enter into the
pores of SBA-15 whose average pore diameter (3.9 nm). It was reported that the
Chapter-4 Nitrobenzene hydrogenation
84
considerable decrease in the surface area of the Ni/SBA-15 prepared by impregnation
technique can be attributed to either the loss of crystallites or pore blockage [7]. MgO
possesses low surface area and slight decrease in the surface area after incorporation of Ni
may be due to the pore blockage. However, Ni dispersion and active metal area of this
catalyst is nearly 3 times that of Ni/SBA-15 catalyst. This clearly indicates a strong
interaction between Ni and MgO. The particle size of Ni in this catalyst is ~ 3nm.
Property Support Ni/SBA-15 Ni/MgO
SBA-15 MgO Fresh Used Fresh Used
BET Surface Area (m2g-1) 546 51 427 325 45 42
Pore Volume (cm3g-1) 0.5284 0.0098 0.2981 0.2514 0.0843 0.0280
Average Pore Diameter (nm) 3.9 0.77 2.8 3.1 8.2 2.7
Ni Dispersion (%) - - 9.5 - 31.5 -
Ni Particle size (nm) - - 10.6 - 3.2 -
Ni-Metal area (m2g-1) - - 3.2 - 10.5 -
H2O adsorption capacity
(µmol g-1)
1.7 6.7 - - - -
Table-4.1.Physico-chemical properties of Ni/SBA-15 and Ni/MgO catalysts.
4.1.4.1 X-ray diffraction studies
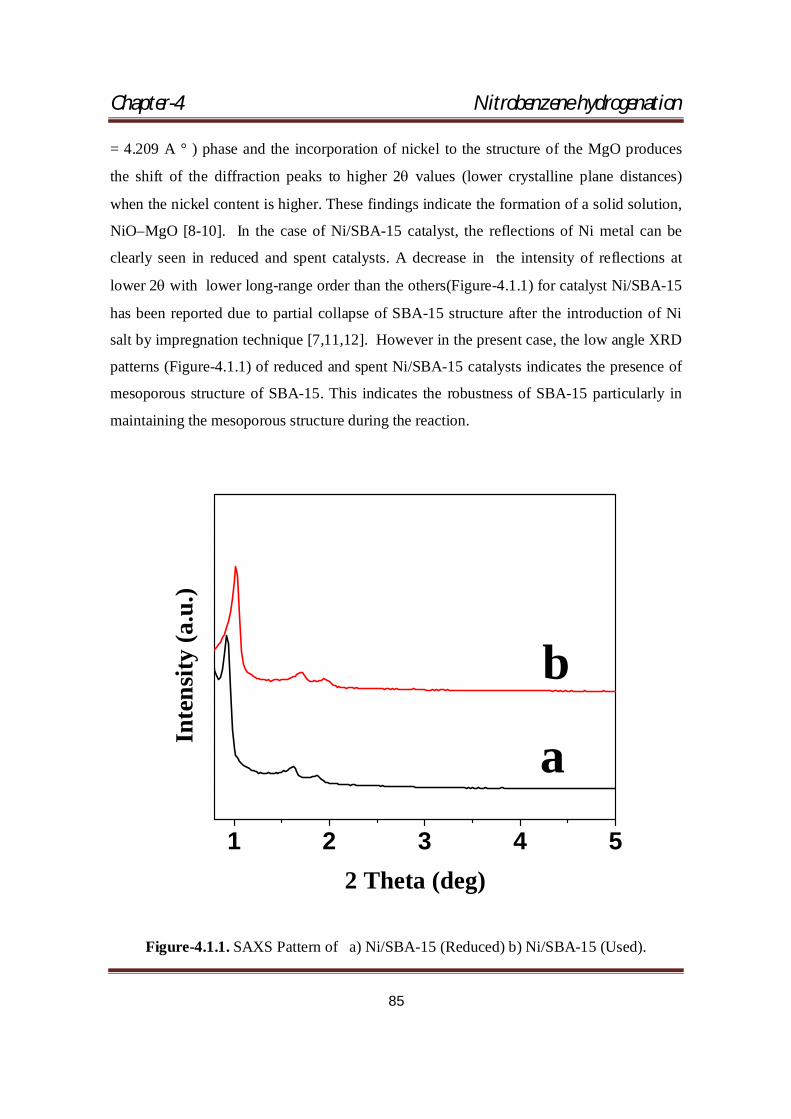
Figure-4.1.1 shows the SAXS patterns of Ni/SBA-15 the catalysts in reduced form
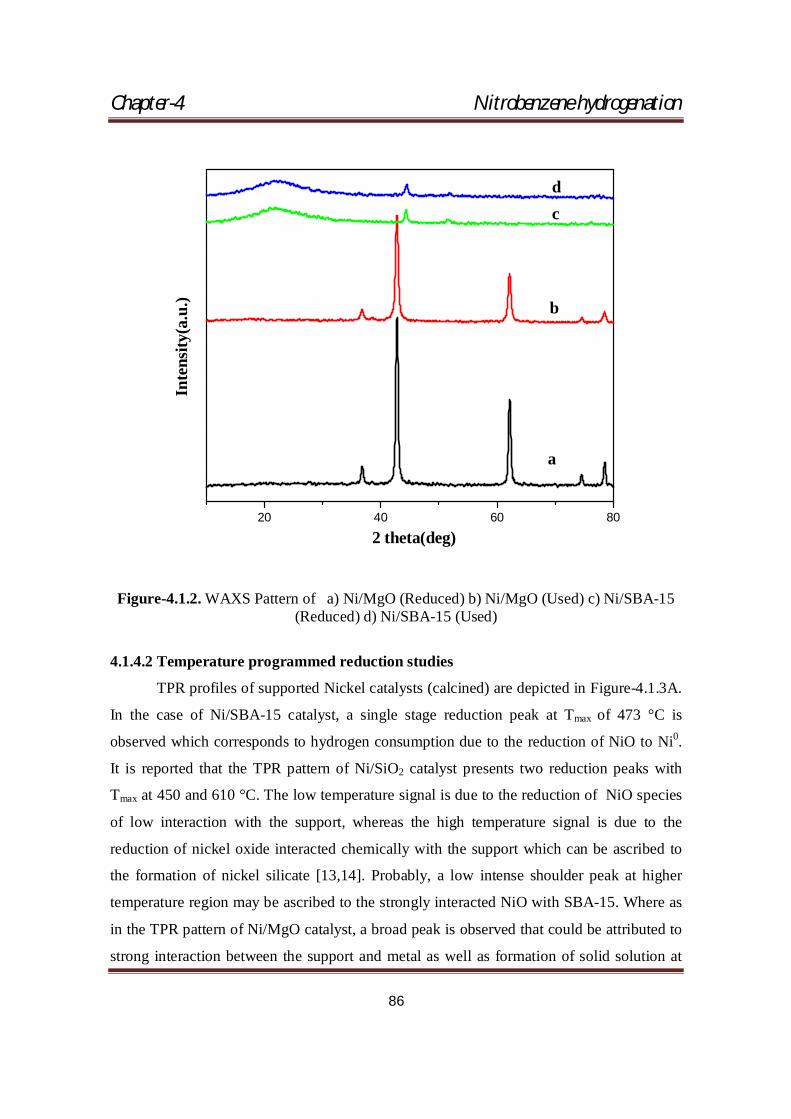
(reduced catalysts) and after the reaction (spent catalysts). In Ni/MgO catalysts, reflections
due to Ni metal are absent (Figure-4.1.2). The smaller Ni particle size as obtained from H2
chemisorption experiments prompts to think that Ni is in amorphous form (below the
detection ability of the XRD unit i.e., < 4 nm). The reflections at 2 values of 37.04, 62.49,
78.88 may be due to the presence of NiMgO2 (ICDD No.24-0712) or MgO. It is reported
that the XRD patterns of the (Mg, Ni)O system (MgNiO2) phase (cubic system, spatial
group Fm3m and parameter a = 4.1922 A0), its symmetry and unit cell parameter are
essentially the same as those for the MgO (cubic system, spatial group Fm3m, parameter a
Chapter-4 Nitrobenzene hydrogenation
85
= 4.209 A ° ) phase and the incorporation of nickel to the structure of the MgO produces
the shift of the diffraction peaks to higher 2 values (lower crystalline plane distances)
when the nickel content is higher. These findings indicate the formation of a solid solution,
NiO–MgO [8-10]. In the case of Ni/SBA-15 catalyst, the reflections of Ni metal can be
clearly seen in reduced and spent catalysts. A decrease in the intensity of reflections at
lower 2 with lower long-range order than the others(Figure-4.1.1) for catalyst Ni/SBA-15
has been reported due to partial collapse of SBA-15 structure after the introduction of Ni
salt by impregnation technique [7,11,12]. However in the present case, the low angle XRD
patterns (Figure-4.1.1) of reduced and spent Ni/SBA-15 catalysts indicates the presence of
mesoporous structure of SBA-15. This indicates the robustness of SBA-15 particularly in
maintaining the mesoporous structure during the reaction.
1 2 3 4 5
b
aInte
nsity
(a.u
.)
2 Theta (deg)
Figure-4.1.1. SAXS Pattern of a) Ni/SBA-15 (Reduced) b) Ni/SBA-15 (Used).
Chapter-4 Nitrobenzene hydrogenation
86
20 40 60 80
dc
b
a
Inte
nsity
(a.u
.)
2 theta(deg)
Figure-4.1.2. WAXS Pattern of a) Ni/MgO (Reduced) b) Ni/MgO (Used) c) Ni/SBA-15 (Reduced) d) Ni/SBA-15 (Used)
4.1.4.2 Temperature programmed reduction studies
TPR profiles of supported Nickel catalysts (calcined) are depicted in Figure-4.1.3A.
In the case of Ni/SBA-15 catalyst, a single stage reduction peak at Tmax of 473 °C is
observed which corresponds to hydrogen consumption due to the reduction of NiO to Ni0.
It is reported that the TPR pattern of Ni/SiO2 catalyst presents two reduction peaks with
Tmax at 450 and 610 °C. The low temperature signal is due to the reduction of NiO species
of low interaction with the support, whereas the high temperature signal is due to the
reduction of nickel oxide interacted chemically with the support which can be ascribed to
the formation of nickel silicate [13,14]. Probably, a low intense shoulder peak at higher
temperature region may be ascribed to the strongly interacted NiO with SBA-15. Where as
in the TPR pattern of Ni/MgO catalyst, a broad peak is observed that could be attributed to
strong interaction between the support and metal as well as formation of solid solution at
Chapter-4 Nitrobenzene hydrogenation
87
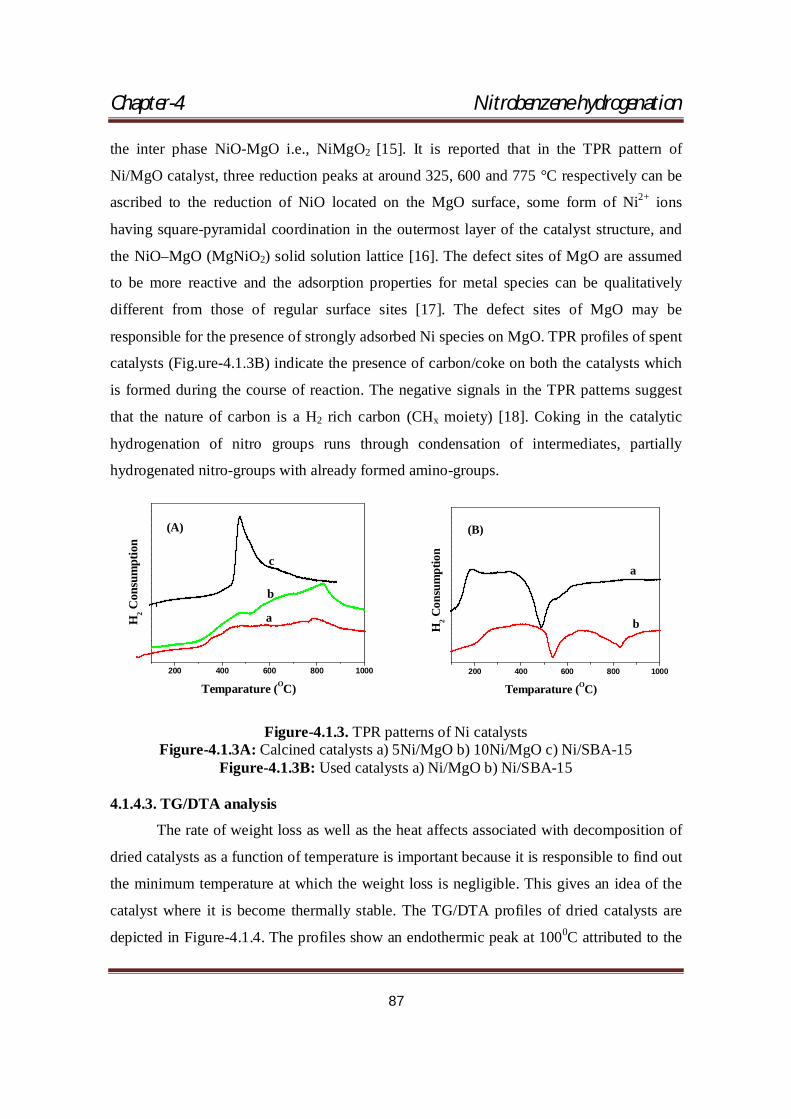
the inter phase NiO-MgO i.e., NiMgO2 [15]. It is reported that in the TPR pattern of
Ni/MgO catalyst, three reduction peaks at around 325, 600 and 775 °C respectively can be
ascribed to the reduction of NiO located on the MgO surface, some form of Ni2+ ions
having square-pyramidal coordination in the outermost layer of the catalyst structure, and
the NiO–MgO (MgNiO2) solid solution lattice [16]. The defect sites of MgO are assumed
to be more reactive and the adsorption properties for metal species can be qualitatively
different from those of regular surface sites [17]. The defect sites of MgO may be
responsible for the presence of strongly adsorbed Ni species on MgO. TPR profiles of spent
catalysts (Fig.ure-4.1.3B) indicate the presence of carbon/coke on both the catalysts which
is formed during the course of reaction. The negative signals in the TPR patterns suggest
that the nature of carbon is a H2 rich carbon (CHx moiety) [18]. Coking in the catalytic
hydrogenation of nitro groups runs through condensation of intermediates, partially
hydrogenated nitro-groups with already formed amino-groups.
200 400 600 800 1000
Temparature (OC)
H2 C
onsu
mpt
ion
(A)
c
b
a
200 400 600 800 1000
(B)
b
a
Temparature (OC)
H2 C
onsu
mpt
ion
Figure-4.1.3. TPR patterns of Ni catalysts Figure-4.1.3A: Calcined catalysts a) 5Ni/MgO b) 10Ni/MgO c) Ni/SBA-15
Figure-4.1.3B: Used catalysts a) Ni/MgO b) Ni/SBA-15
4.1.4.3. TG/DTA analysis
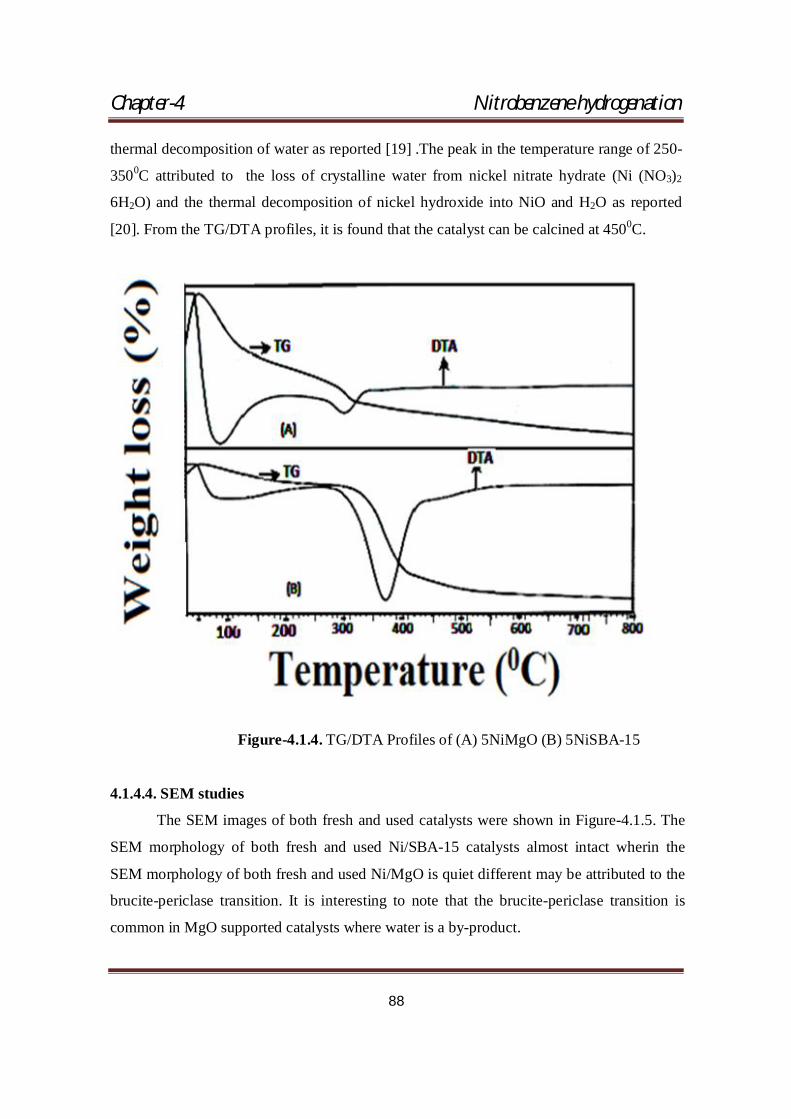
The rate of weight loss as well as the heat affects associated with decomposition of
dried catalysts as a function of temperature is important because it is responsible to find out
the minimum temperature at which the weight loss is negligible. This gives an idea of the
catalyst where it is become thermally stable. The TG/DTA profiles of dried catalysts are
depicted in Figure-4.1.4. The profiles show an endothermic peak at 1000C attributed to the
Chapter-4 Nitrobenzene hydrogenation
88
thermal decomposition of water as reported [19] .The peak in the temperature range of 250-
3500C attributed to the loss of crystalline water from nickel nitrate hydrate (Ni (NO3)2
6H2O) and the thermal decomposition of nickel hydroxide into NiO and H2O as reported
[20]. From the TG/DTA profiles, it is found that the catalyst can be calcined at 4500C.
Figure-4.1.4. TG/DTA Profiles of (A) 5NiMgO (B) 5NiSBA-15
4.1.4.4. SEM studies
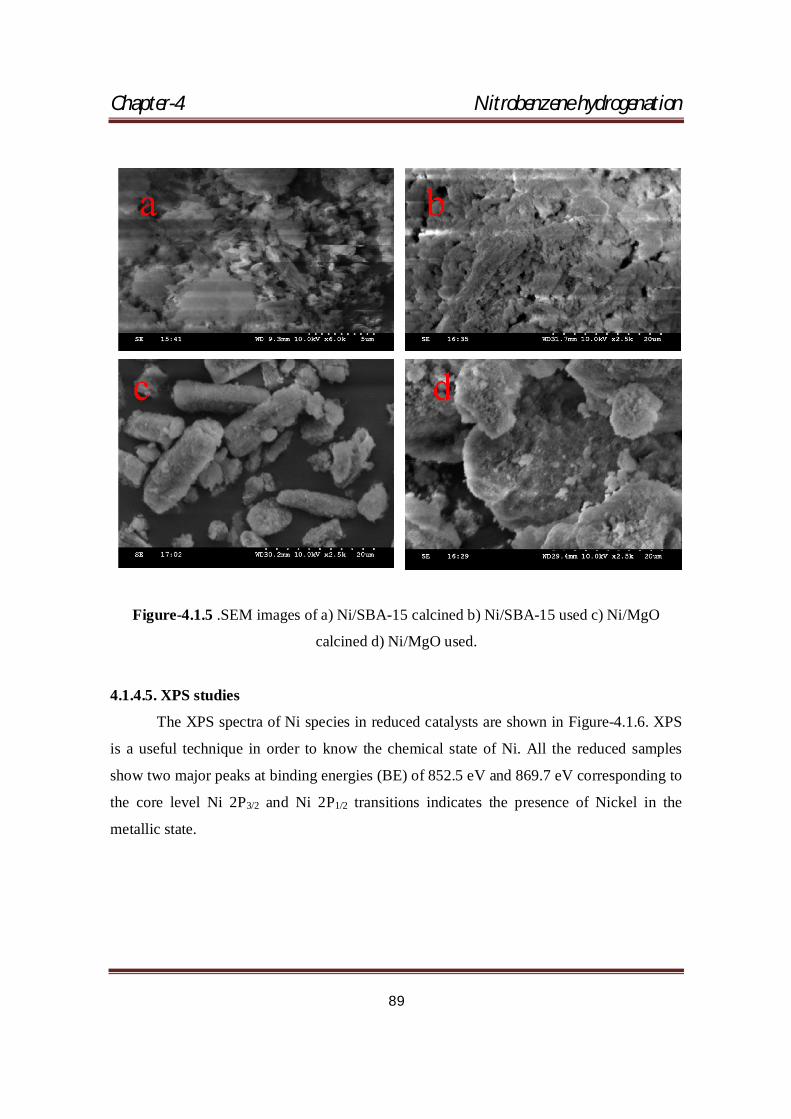
The SEM images of both fresh and used catalysts were shown in Figure-4.1.5. The
SEM morphology of both fresh and used Ni/SBA-15 catalysts almost intact wherin the
SEM morphology of both fresh and used Ni/MgO is quiet different may be attributed to the
brucite-periclase transition. It is interesting to note that the brucite-periclase transition is
common in MgO supported catalysts where water is a by-product.
Chapter-4 Nitrobenzene hydrogenation
89
Figure-4.1.5 .SEM images of a) Ni/SBA-15 calcined b) Ni/SBA-15 used c) Ni/MgO
calcined d) Ni/MgO used.
4.1.4.5. XPS studies
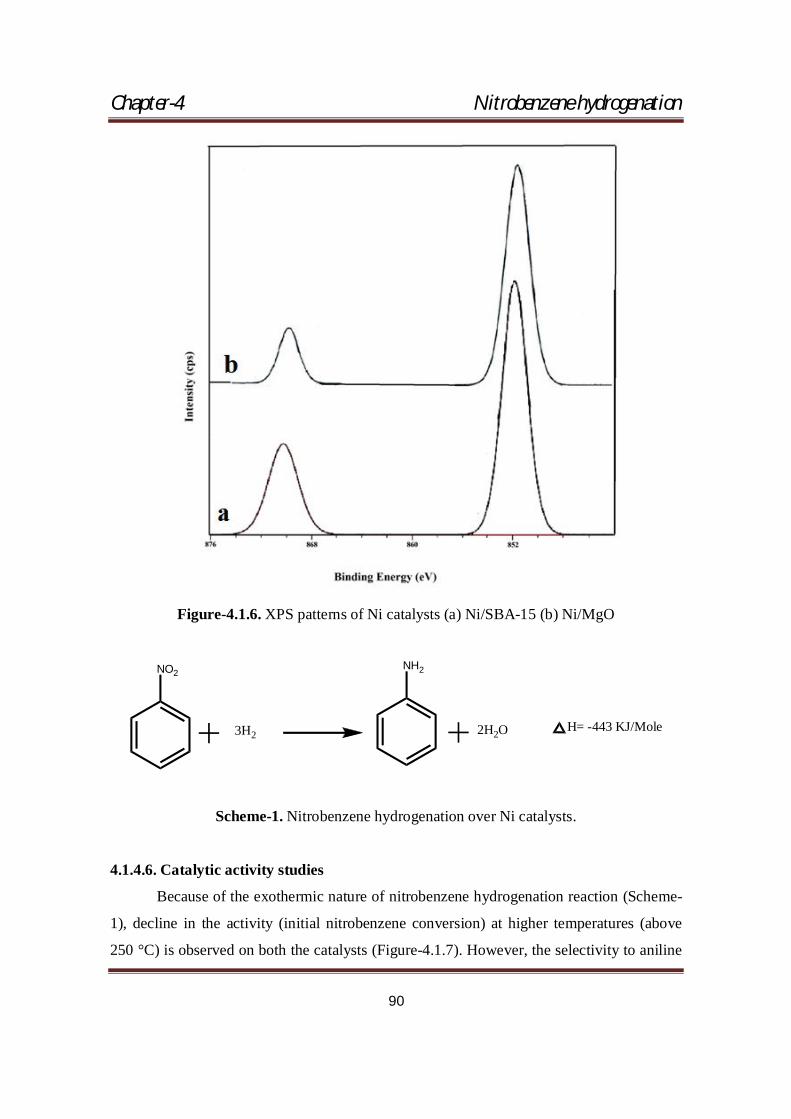
The XPS spectra of Ni species in reduced catalysts are shown in Figure-4.1.6. XPS
is a useful technique in order to know the chemical state of Ni. All the reduced samples
show two major peaks at binding energies (BE) of 852.5 eV and 869.7 eV corresponding to
the core level Ni 2P3/2 and Ni 2P1/2 transitions indicates the presence of Nickel in the
metallic state.
Chapter-4 Nitrobenzene hydrogenation
90
Figure-4.1.6. XPS patterns of Ni catalysts (a) Ni/SBA-15 (b) Ni/MgO
NO2NH2
3H2 2H2O H= -443 KJ/Mole
Scheme-1. Nitrobenzene hydrogenation over Ni catalysts.
4.1.4.6. Catalytic activity studies
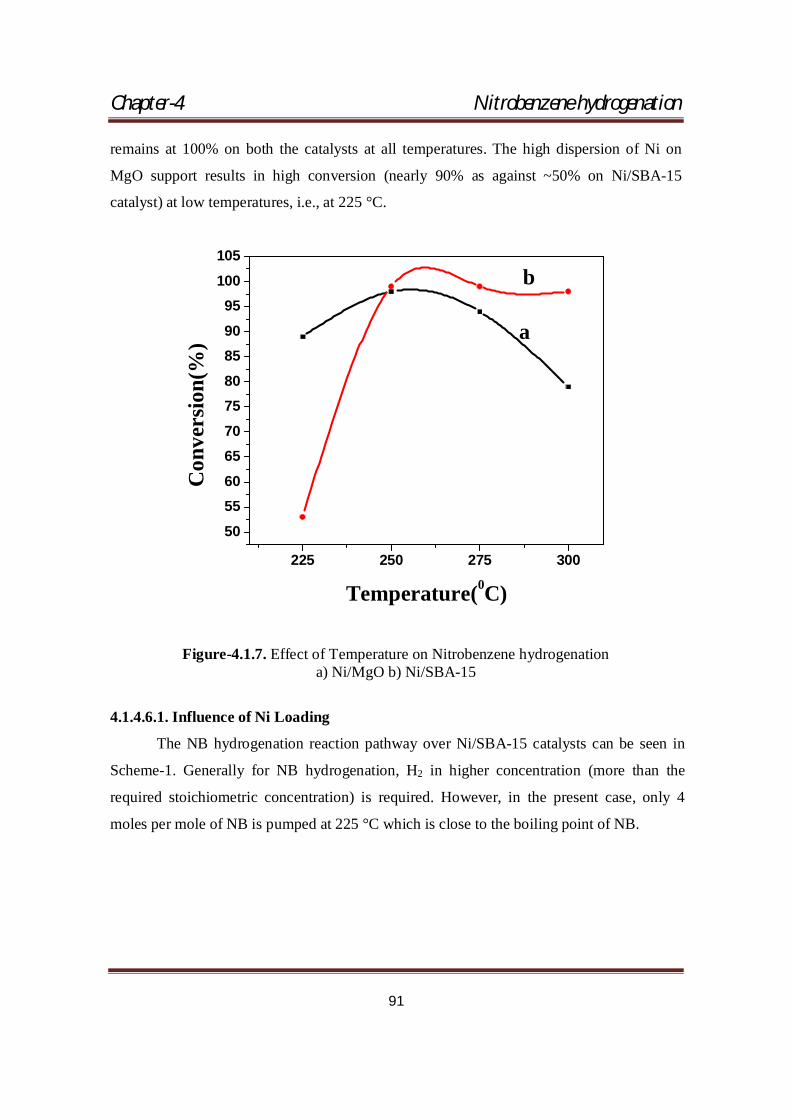
Because of the exothermic nature of nitrobenzene hydrogenation reaction (Scheme-
1), decline in the activity (initial nitrobenzene conversion) at higher temperatures (above
250 °C) is observed on both the catalysts (Figure-4.1.7). However, the selectivity to aniline
Chapter-4 Nitrobenzene hydrogenation
91
remains at 100% on both the catalysts at all temperatures. The high dispersion of Ni on
MgO support results in high conversion (nearly 90% as against ~50% on Ni/SBA-15
catalyst) at low temperatures, i.e., at 225 °C.
225 250 275 300
50556065707580859095
100105
b
a
Con
vers
ion(
%)
Temperature(0C)
Figure-4.1.7. Effect of Temperature on Nitrobenzene hydrogenation a) Ni/MgO b) Ni/SBA-15
4.1.4.6.1. Influence of Ni Loading
The NB hydrogenation reaction pathway over Ni/SBA-15 catalysts can be seen in
Scheme-1. Generally for NB hydrogenation, H2 in higher concentration (more than the
required stoichiometric concentration) is required. However, in the present case, only 4
moles per mole of NB is pumped at 225 °C which is close to the boiling point of NB.
Chapter-4 Nitrobenzene hydrogenation
92
225 250 275 300
50
60
70
80
90
100
Con
vers
ion(
%)
Temparature(0C)
5Ni/SBA-15 10Ni/SBA-15 20Ni/SBA-15 30Ni/SBA-15 40Ni/SBA-15 50Ni/SBA-15
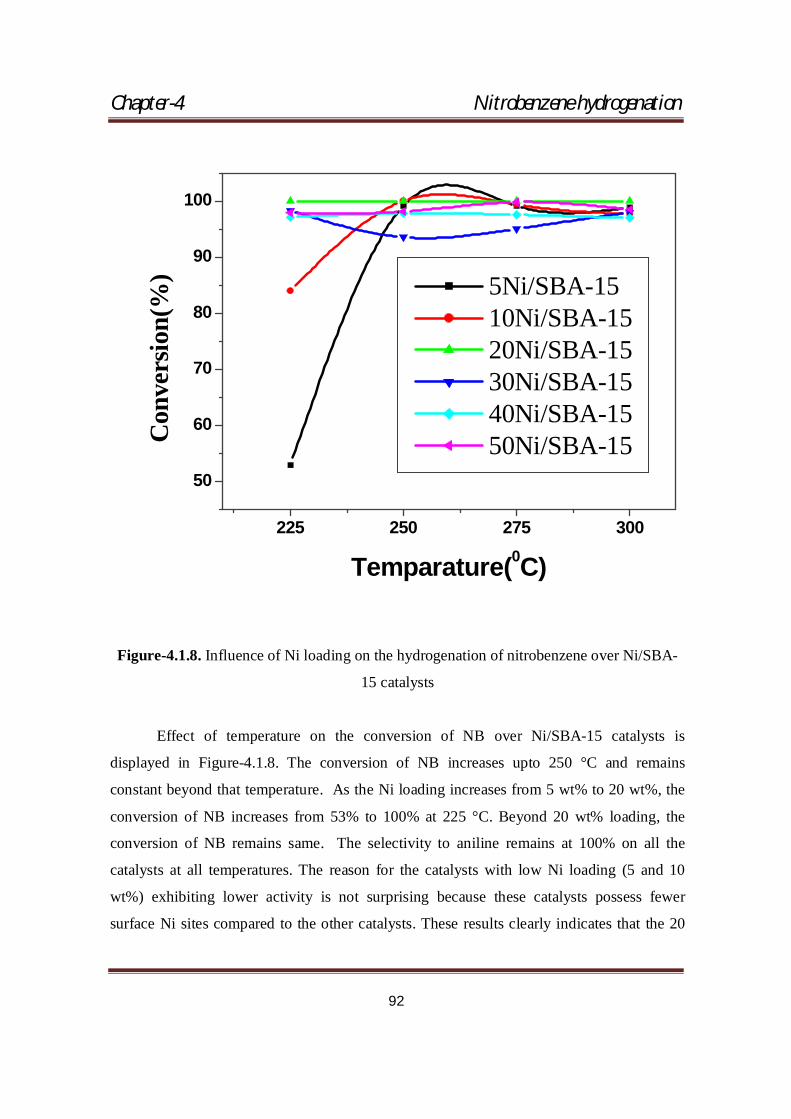
Figure-4.1.8. Influence of Ni loading on the hydrogenation of nitrobenzene over Ni/SBA-
15 catalysts
Effect of temperature on the conversion of NB over Ni/SBA-15 catalysts is
displayed in Figure-4.1.8. The conversion of NB increases upto 250 °C and remains
constant beyond that temperature. As the Ni loading increases from 5 wt% to 20 wt%, the
conversion of NB increases from 53% to 100% at 225 °C. Beyond 20 wt% loading, the
conversion of NB remains same. The selectivity to aniline remains at 100% on all the
catalysts at all temperatures. The reason for the catalysts with low Ni loading (5 and 10
wt%) exhibiting lower activity is not surprising because these catalysts possess fewer
surface Ni sites compared to the other catalysts. These results clearly indicates that the 20
Chapter-4 Nitrobenzene hydrogenation
93
wt% Ni loading enough for getting good conversions and selectivity. The increase in
conversion with increase in loading is due to increase in active species.
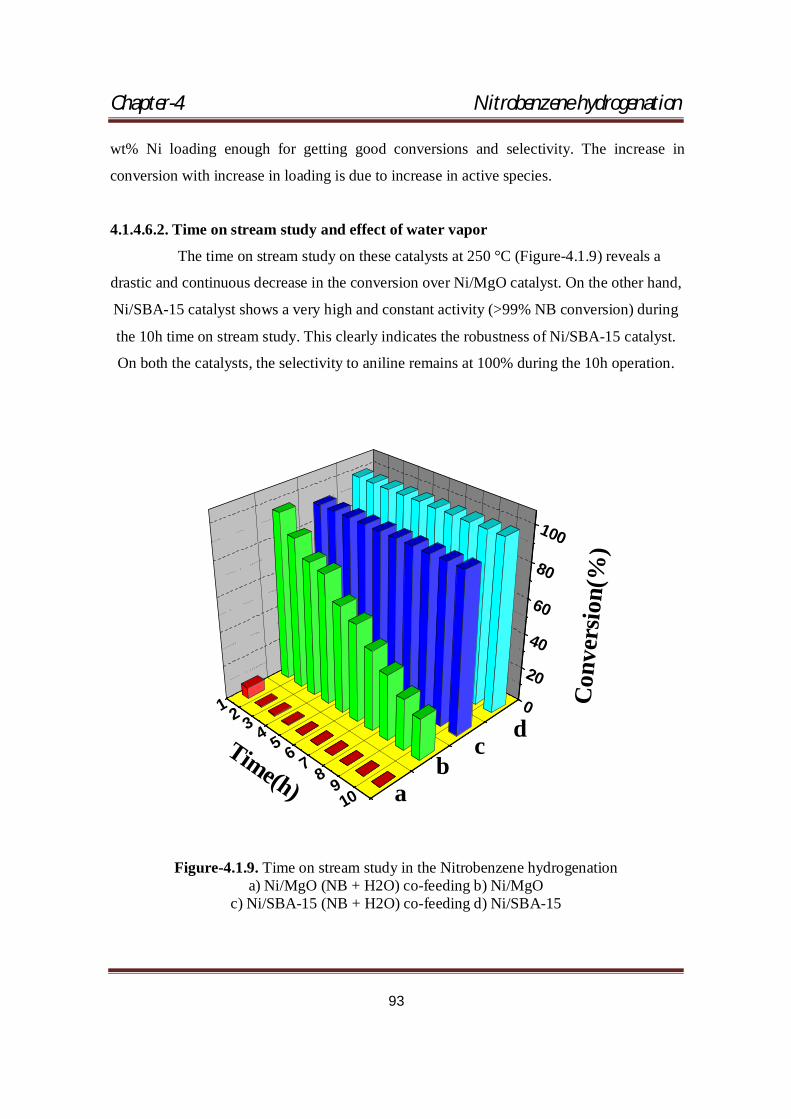
4.1.4.6.2. Time on stream study and effect of water vapor
The time on stream study on these catalysts at 250 °C (Figure-4.1.9) reveals a
drastic and continuous decrease in the conversion over Ni/MgO catalyst. On the other hand,
Ni/SBA-15 catalyst shows a very high and constant activity (>99% NB conversion) during
the 10h time on stream study. This clearly indicates the robustness of Ni/SBA-15 catalyst.
On both the catalysts, the selectivity to aniline remains at 100% during the 10h operation.
10987654321 0
20
40
60
80
100
dc
ba
Time(h)
Con
vers
ion(
%)
Figure-4.1.9. Time on stream study in the Nitrobenzene hydrogenation a) Ni/MgO (NB + H2O) co-feeding b) Ni/MgO
c) Ni/SBA-15 (NB + H2O) co-feeding d) Ni/SBA-15
Chapter-4 Nitrobenzene hydrogenation
94
In our earlier publication, the decline in the NB conversion during time on stream
study over Pd/HT catalyst is attributed to either coke formation or water generated during
the course of reaction (1mole of NB yields 2 mole of H2O) [21]. It appears that the
deactivation of catalyst due to sintering of Ni particles during the course of reaction is ruled
out because of the similarity in the XRD patterns before and after the reaction (Figure-
4.1.2). From water adsorption uptakes (Table-4.1), it is clear that MgO support possesses
more water vapor adsorption uptake (6.65 µ moles per gram support) is nearly 4 times that
on SBA-15 support (1.7 µ moles per gram support). Though the amount of water adsorbed
on either MgO or SBA-15 support is too small when compared to the amount of water
released during 10h operation, one can guess that adsorption of water may block the
adsorption of NB on the surface of the catalyst. Moreover in the case of MgO support,
because of water adsorption, brucite-periclase transformation may not be ruled out. Such
transformation may result in the formation of MgO or Mg(OH)2 over-layer on Ni particles
which blocks the adsorption of NB molecules on Ni sites. This type of transformation is
common in MgO supported catalysts [22-24]. The water adsorption capacity of Ni/MgO
catalyst (Table-4.1) is 1.2μmol g−1 catalyst. No water is adsorbed over Ni/SBA-15 catalyst
(Table-4.1). In addition to the water adsorption experiments, co-feeding of water along
with nitrobenzene was maintained on both the catalysts. During the co-feeding of H2O
along with nitrobenzene (Figure-4.1.9) confirms a drastic decrease in the conversion of
nitrobenzene which is due to the poisoning effect of water over Ni/MgO catalyst. Over
Ni/SBA-15 catalyst, the conversion of nitrobenzene is high and steady, indicating its
resistance to water. The hydrophobic nature of Ni/SBA-15 cannot prevent coking during
the reaction. However, the coke deposition as evidenced from the TPR patterns of both the
catalysts has no or little effect on the activity because Ni/SBA-15 catalyst experiences a
steady conversion of ~90% during the entire 10 h operation of time on stream with water
co-feeding along with nitrobenzene and hydrogen. The reason for the poor performance of
the Ni/MgO catalyst may be due to the incomplete reduction of Ni–MgO interacted species.
However during the co-feeding of water along with nitrobenzene results zero activity at the
second hour over Ni/MgO which is not the case when nitrobenzene alone is injected.
Chapter-4 Nitrobenzene hydrogenation
95
4.1.5. Conclusions
Though the Ni dispersion is lower on SBA-15 support than on MgO support, its
hydrophobic character is advantageous in yielding high and steady activity in the vapour
phase nitrobenzene hydrogenation. The SEM studies reveal the transformation of brucite-
periclase transition. Moreover, the coke deposition (as evidenced from the TPR of used
catalysts) is insignificant on the catalytic performance. Furthermore, water adsorption
capacity of Ni/MgO enables that this catalytic system is not suitable for the hydrogenation
reaction especially water as a byproduct.
4.1.6. References
[1]. S. Diao, W.Qian, G. Luo, F. Wei, Y. Wang, Appl. Catal. A: Gen. 2005, 286, 30.
[2]. K. V.R. Chary, C. S. Srikanth, Catal.Lett. 2009,128, 164.
[3]. A. Nieto-Ma´rquez, S Gil, A. Romero, J. L.Valverde,S. G. mez-Quero, M. A. Keane,
Appl. Catal. A: Gen. 2009, 363, 188.
[4]. J. Wang, Z. Yuan, R. Nie, Z. Hou, X. Zheng, Ind. Eng. Chem. Res., 2010,49, 4664.
[5]. P. Sangeetha, K. Shanthi, K.S. Rama Rao, B. Viswanathan, P. Selvam, Appl. Catal. A:
Gen. 2009, 353, 160.
[6]. D. Zhao, J. Feng, Q. Huo, N. Melosh, G. H. Fredrickson, B. F. Chmelka, G. D.
Stucky, Science. 1998, 279, 548.
[7]. Y. Park, T. Kang, J. Lee, P. Kim, H. Kim, J.Yi, Catal. Today., 2004, 97, 195.
[8]. J. Barbero, M.A. Pen˜a, J.M. Campos-Martin, J.L.G. Fierro, P.L. Arias, Catal. Lett.,
2003, 87, 211.
[9]. E. Ruckenstein, Y.H. Hu, Appl. Catal. A: Gen.,1999, 183, 85.
[10]. J. Requies, M. A. Cabrero, V. L. Barrio, M. B. Guemez, J. F. Cambra, P. L. Arias, F.
J. Perez-Alonso, M. Ojeda, M. A. Pena, J. L. G. Fierro, Appl. Catal. A: Gen., 2005,
289 214.
[11] Y.S. Cho, J.C. Park, B. Lee, Y. Kim, J. Yi, Catal. Lett., 2002, 81, 89.
[12]. Y. Park, T. Kang, Y. Cho, P. Kim, J. Park, J. Yi, Stud. Surf. Sci. Catal., 2003, 146,
637.
[13]. F. Pompeo, N. N. Nichio, M. G. Gonza´lez, M. Montes, (2005) Catal. Today.,
2005,107-108, 856.
Chapter-4 Nitrobenzene hydrogenation
96
[14]. H. V. Fajardo, E. Longo, D. z. Mezalira, G. B. Nuernberg, G. L. Almerindo, A.
Collasiol, L. F. D. Probst, I. T. S. Garcia, N. L. V. Carreno, Environ. Chem. Lett.,
2010, 8, 79.
[15]. S.Tang, J. Lin and K. L. Tan, Catal. Lett., 1998, 51, 169.
[16]. T. Furusawa, A. Tsutsumi, Appl. Catal. A: Gen., 2005, 278, 207.
[17]. A. V. Matveev, K. M. Neyman, I. V. Yudano, N. Rosch, Surf. Sci. 1999, 426, 123.
[18]. S. Chandra Shekar, J. Krishna Murthy, P. Kanta Rao, K.S. Rama Rao, J. Mol.
Catal. A: Chemical, 2003, 191, 45.
[19]. G. Jianjun, H. Lou, H. Zhao, D. Chai, X. Zheng, Appl. Catal. A: Gen., 2004, 273, 75.
[20]. B. Parathasarathi, M. Rajamathi, M.S. Hegde, P. V. Kamath, Bull. Mater. Sci., 2000,
23, 141.
[21]. P. Sangeetha, P. Seetharamulu, K. Shanthi, S. Narayanan, K.S. Rama Rao, J. Mol.
Catal. A: Chem., 2007, 273, 244.
[22]. P. Seetharamulu, V. Siva Kumar, A.H. Padmasri, B. David Raju, K.S. Rama Rao, J.
Mol. Catal. A: Chem. 2007, 263, 253.
[23]. Z. Song, T.H. Cai, J.C. Hanson, J.A. Rodriguez, J. Am. Chem. Soc., 2004, 126, 8576.
[24]. P. Moggi, G. Pedieri, A. Maione, Catal. Lett., 2002, 79, 7.
Chapter-4 Nitrobenzene hydrogenation
97
4.2 Section-B: A comparative study of nitrobenzene hydrogenation over
impregnated and reductive deposition precipitation method catalysts
4.2.1. Abstract
Highly dispersed nickel nanoparticles on supports such as ZrO2 and TiO2 were
prepared by reductive deposition method by using hydrazine as reducing agent. The
highlight of this work is to compare the characteristics and activity of these catalysts with
the catalysts of same composition prepared by impregnation method. All catalysts were
characterised by various techniques such as BET, H2 Pulse chemisorption, SEM
(Morphology), XRD (Crystalline nature), reduction behaviour (TPR) and state of nickel
species (XPS). Ni/TiO2 catalyst prepared by reductive deposition method show excellent
conversion of nitrobenzene to aniline. This is due to the presence of higher number of
surface Ni species than other catalysts as evidenced by H2-chemisorption. TPR results
reveal the formation of metallic Ni species in the reductive deposition method. XRD results
suggest that the all catalytic systems showing peaks corresponding to the supports only and
not due to the metallic Ni because of its presence in highly dispersed form.
4.2.2. Introduction
Nanomaterials are of topical interest, because of their fascinating properties which
are different from the corresponding bulk materials. Due to their unique properties,
nanomaterials are employed in electronic, optical, catalytic, coating, medical and sensor
applications [1-3]. A plethora of research work has been cited on the synthesis Ni
nanoparticles by various methods such as chemical reduction [4], radiolytic reduction [5],
UV photolysis [6], solvent extraction reduction [7], microemulsion technique [8], polyol
reduction method [9] and sonochemical decomposition [10]. Among these methods,
chemical reduction appears to be the most promising method for the large-scale
nanoparticle production, although simple methods for preparing metal supported
nanocatalysts under mild and inexpensive conditions have not still been definitely
addressed. Among the chemical reduction reagents, utilisation of NaBH4 leaves Na+ ions
and B in the catalysts that effects the reaction while the utilisation of Na2HPO4 leaves both
Chapter-4 Nitrobenzene hydrogenation
98
Na+ ions and P in the catalysts which influences the catalytic activity. In our present study,
we used hydrazine as a reducing agent which on decomposition produces H2 as well as N2.
The liberated N2 is enough to act as inert atmosphere coverage to the reaction vessel.
Recently, supported nickel catalysts were reported for various organic
transformations such as hydrogenation [11, 12], steam reforming reactions [13] reductive
amination of alcohols [14] hydrodechlorination [15, 16] partial oxidation [17], and dry
reforming of methane [18]. Amongst, hydrogenation is of great interest for both industry
and academia.
The synthesis of aniline is generally done by the nitrobenzene hydrogenation.
Aniline is an important raw material for synthesis of more than 300 different end products
industrially, aniline is mainly used for the production of methylene diphenyl diisocyanate
(MDI), a key compound in the production of polyurethane rigid and/or semi-rigid foams
and elastomers. It is also used as a solvent, and has been used as an antiknock compound
for gasoline [19, 20].
Aniline finds application in various end-use markets including construction, rubber
products, transportation, consumer, adhesives/sealants, packaging, agriculture, textiles,
coatings, photography, dyes, and pharmaceuticals.
A predominant proportion of the worldwide aniline production is utilized in the
manufacture of polyurethanes, which are used in a wide array of applications including
footwear, insulation and furniture.
The global aniline market is projected to reach 6.2 million tons by the year 2015,
due to the increasing demand from various end-user markets. In particular, the rising
demand from methylene diphenyl diisocyanate (MDI), the chief ingredient in polyurethane
foam, is expected to fuel consumption of aniline [21].
The present section highlights the synthesis of Ni catalysts by reductive deposition
method without using any capping agent as an efficient catalyst for the hydrogenation of
nitrobenzene at atmospheric pressure in vapour phase.
Chapter-4 Nitrobenzene hydrogenation
99
4.2.3. Experimental
4.2.3.1. Catalyst preparation
Materials used in this research work are Ni(NO3)2 6H2O (M/s. LOBA Chemie,
India, 98%); hydrazine hydrate solution (M/s. LOBA Chemie, India, 80%); Sodium
Hydroxide(M/s. Sigma Aldrich, USA); de-ionized water in the preparation of all the
solutions. The nano-sized supported nickel particles were synthesized by dissolving
requisite quantities of Ni(NO3)2 6H2O in deionised water and placing the respective
supports in a vessel. The pH of the solution was then increased to 10 by adding a mixture
of sodium hydroxide and hydrazine hydrate solution. The solution is stirred for 6h. During
the stirring, we have observed a change in colour of the solution from green to violet to
colourless and then to grey/black nickel nanoparticles with the evolution of N2 gas. The
liberated N2 is enough to act as inert atmosphere blanket. In order to avoid the expansion of
volume of N2 during the stirring, precaution has been taken by selecting a flask of bigger
volume. The resultant catalysts were designated as Ni/TiO2 (R) and Ni/ZrO2 (R)
respectively. In comparison, we have also prepared the catalysts by impregnation method
with similar Ni loading. They were designated as Ni/TiO2 (I) and Ni/ZrO2 (I) respectively.
The Ni loading in all the catalysts was maintained at 5 wt%.
4.2.3.2. Catalyst characterisation
All the above catalysts were characterized by XRD, BET method, H2 pulse
decomposition, TPR and SEM. Details of all the above techniques and procedures have
already been described in chapter-3.
4.2.3.3. Activity studies
A layer of silicon beads has been placed to act as a preheating zone, above catalyst
bed taken in a fixed bed reactor. Isothermal conditions were ensured by diluting the catalyst
bed with ground silica beads. Reaction temperature was continuously monitored by a
thermocouple inserted in a thermowell which was placed within the catalyst bed. The liquid
reactant was delivered to the reactor from a glass / Teflon air-tight syringe and Teflon tube
using a microprocessor controlled infusion pump (M/s. B.Braun Co, Germany) at a
required flow rate. NB and ultra pure H2 were maintained at a WHSV ≈ 1 with a inlet NB

Chapter-4 Nitrobenzene hydrogenation
100
flow =1mlh-1 and H2 flow of 1 time in excess of the stoichiometric requirement (H2/NB
molar ratio = 4).
In a blank test, passage of NB reactant along with stream of H2 through an empty
reactor or over the support alone did not result in any appreciable NB conversion. The
product mixture was cooled in a ice cooled trap and the analysis were performed on a gas
chromatograph (GC-17A, M/s. Shimadzu Instruments Co, Japan) equipped with a
programmed split injector and a flame ionization detector, with a OV-1 (30 m length 0.53
mm i.d., 0.33 mm film thickness) capillary column and the product components were
confirmed by Shimadzu-17A gas chromatograph equipped along with the mass spectrum
QP-8080.
4.2.4. Results and discussion
Hydrazine is a normally used as a reducing agent. It can be oxidised depending
upon the medium. In acid medium, it easily undergoes oxidation to NH3 while in case of
basic medium it is easily underwent oxidation to N2 and H2. Hence, it is necessary to use
the basic medium to produce N2 and H2 .For this purpose we have chosen NaOH as a base.
The H2 produced is further utilised for the reduction of nickel precursors which are present
in the solution.
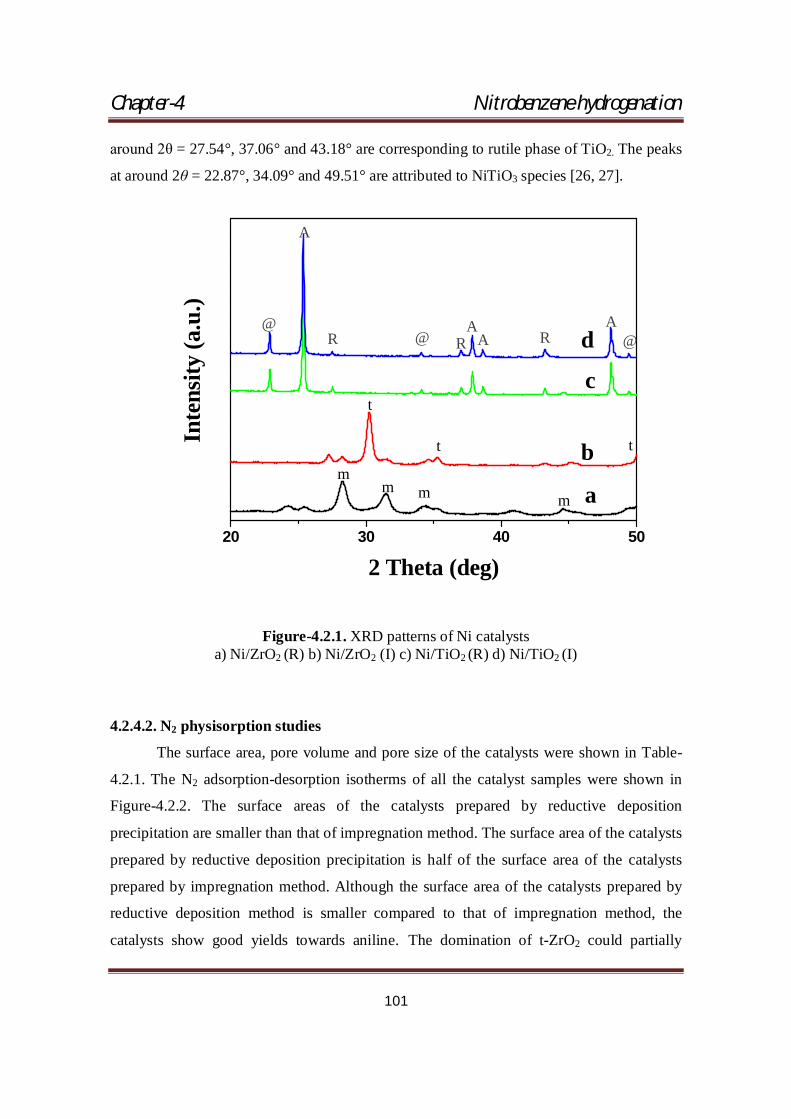
4.2.4.1. X-ray diffraction studies
The XRD patterns of all the catalyst samples displayed in Figure-4.2.1. In case of
Ni/ZrO2 catalyst, it is reported that peaks at 2θ = 30.3° and 35.14° reveal the presence of
indices (111) and (200) planes, respectively corresponds to tetragonal zirconia phase [22].
Major Peak at 2θ = 28.3° reveals the part of the sample containing the monoclinic phase of
zirconia [23]. It is reported that the incorporation of di positive or tetra positive metal ions
into zirconia promotes the transition of tetragonal to monoclinic phase [24,25].
Furthermore, the PH of solution during the synthesis was maintained at 10. PH also
influences the transformation of zirconia phase [23]. In case of Ni/TiO2 catalyst, the peaks
at 2θ = 25.32°, 37.84°, 48.07°, 53.95°, 55.10°, 62.16°, 70.34° and 75.12° reveal the
presence of indices (101), (004), (200), (105), (211) (Tetragonal TiO2, Space group
141/amd 141)) corresponding to titania (anatase) (ICDD .No.84-1286). The peaks at
Chapter-4 Nitrobenzene hydrogenation
101
around 2θ = 27.54°, 37.06° and 43.18° are corresponding to rutile phase of TiO2. The peaks
at around 2θ = 22.87°, 34.09° and 49.51° are attributed to NiTiO3 species [26, 27].
Figure-4.2.1. XRD patterns of Ni catalysts a) Ni/ZrO2 (R) b) Ni/ZrO2 (I) c) Ni/TiO2 (R) d) Ni/TiO2 (I)
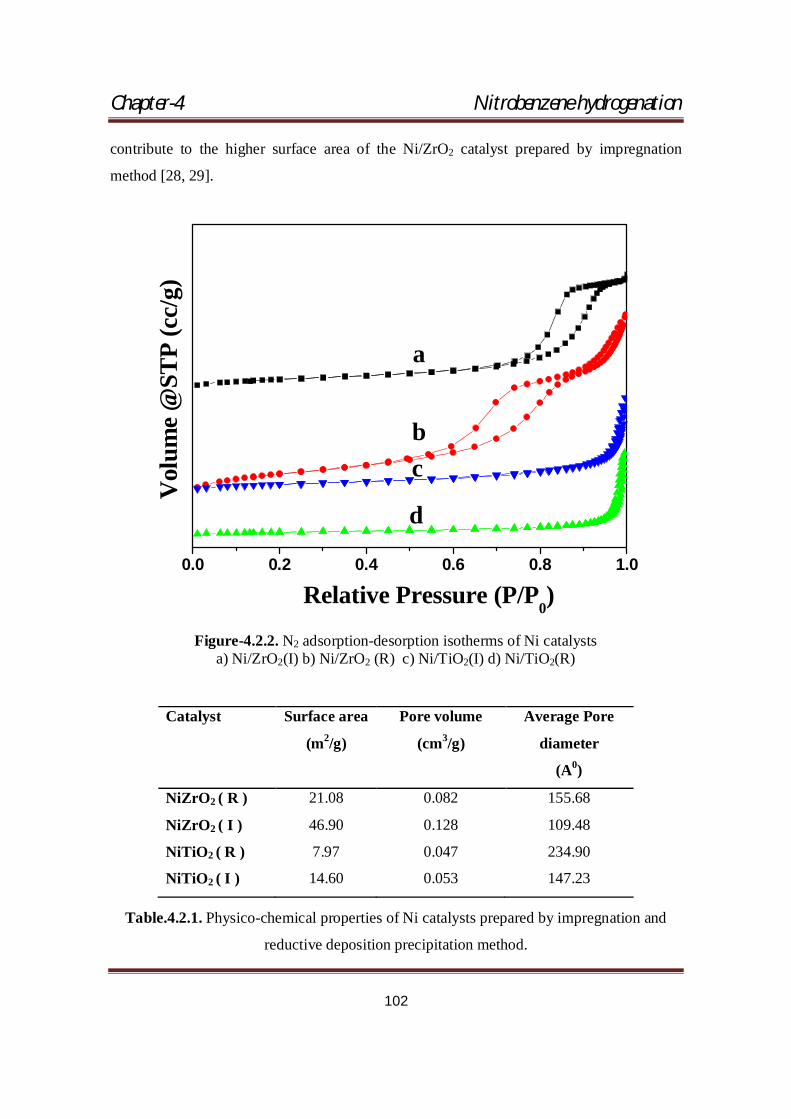
4.2.4.2. N2 physisorption studies
The surface area, pore volume and pore size of the catalysts were shown in Table-
4.2.1. The N2 adsorption-desorption isotherms of all the catalyst samples were shown in
Figure-4.2.2. The surface areas of the catalysts prepared by reductive deposition
precipitation are smaller than that of impregnation method. The surface area of the catalysts
prepared by reductive deposition precipitation is half of the surface area of the catalysts
prepared by impregnation method. Although the surface area of the catalysts prepared by
reductive deposition method is smaller compared to that of impregnation method, the
catalysts show good yields towards aniline. The domination of t-ZrO2 could partially
20 30 40 50
mm m
m
t t
t
d
c
b
a
R R @@@
RA
AA
A
Inte
nsity
(a.u
.)
2 Theta (deg)
Chapter-4 Nitrobenzene hydrogenation
102
contribute to the higher surface area of the Ni/ZrO2 catalyst prepared by impregnation
method [28, 29].
0.0 0.2 0.4 0.6 0.8 1.0
Vol
ume
@ST
P (c
c/g)
Relative Pressure (P/P0)
d
cb
a
Figure-4.2.2. N2 adsorption-desorption isotherms of Ni catalysts
a) Ni/ZrO2(I) b) Ni/ZrO2 (R) c) Ni/TiO2(I) d) Ni/TiO2(R)
Table.4.2.1. Physico-chemical properties of Ni catalysts prepared by impregnation and
reductive deposition precipitation method.
Catalyst Surface area
(m2/g)
Pore volume
(cm3/g)
Average Pore
diameter
(A0)
NiZrO2 ( R ) 21.08 0.082 155.68
NiZrO2 ( I ) 46.90 0.128 109.48
NiTiO2 ( R ) 7.97 0.047 234.90
NiTiO2 ( I ) 14.60 0.053 147.23
Chapter-4 Nitrobenzene hydrogenation
103
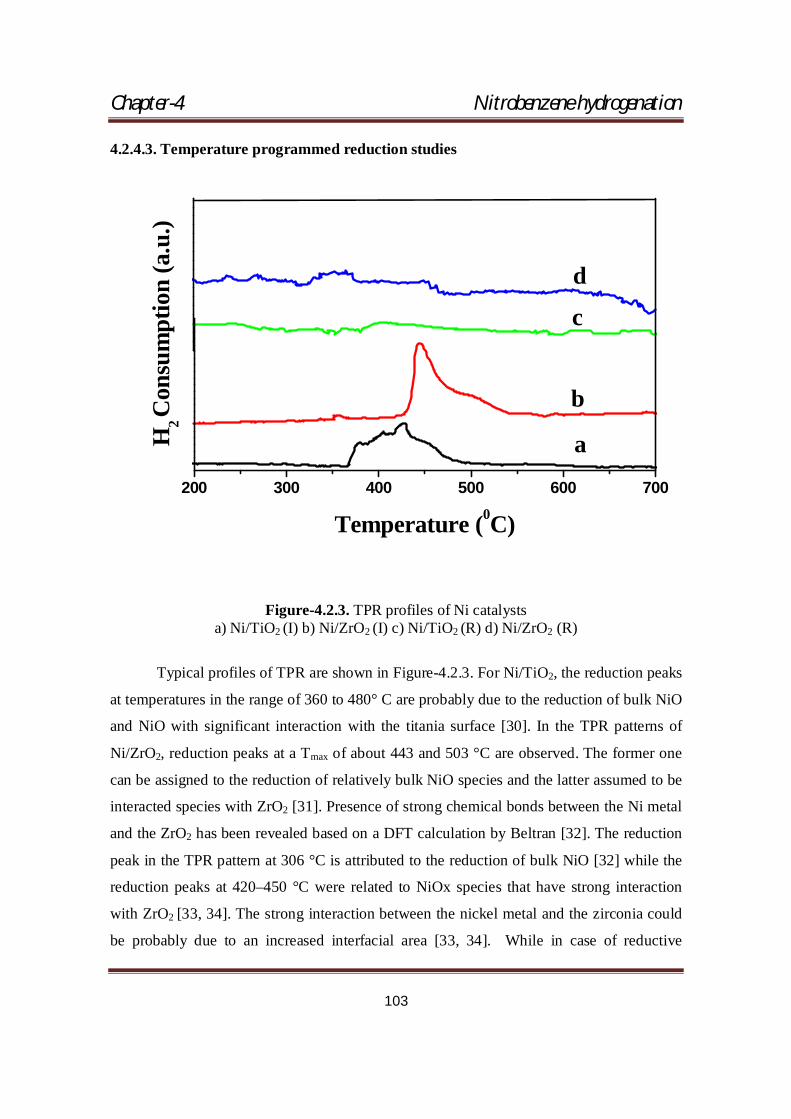
4.2.4.3. Temperature programmed reduction studies
200 300 400 500 600 700
c
b
aH2 C
onsu
mpt
ion
(a.u
.)
Temperature (0C)
d
Figure-4.2.3. TPR profiles of Ni catalysts a) Ni/TiO2 (I) b) Ni/ZrO2 (I) c) Ni/TiO2 (R) d) Ni/ZrO2 (R)
Typical profiles of TPR are shown in Figure-4.2.3. For Ni/TiO2, the reduction peaks
at temperatures in the range of 360 to 480° C are probably due to the reduction of bulk NiO
and NiO with significant interaction with the titania surface [30]. In the TPR patterns of
Ni/ZrO2, reduction peaks at a Tmax of about 443 and 503 °C are observed. The former one
can be assigned to the reduction of relatively bulk NiO species and the latter assumed to be
interacted species with ZrO2 [31]. Presence of strong chemical bonds between the Ni metal
and the ZrO2 has been revealed based on a DFT calculation by Beltran [32]. The reduction
peak in the TPR pattern at 306 °C is attributed to the reduction of bulk NiO [32] while the
reduction peaks at 420–450 °C were related to NiOx species that have strong interaction
with ZrO2 [33, 34]. The strong interaction between the nickel metal and the zirconia could
be probably due to an increased interfacial area [33, 34]. While in case of reductive
Chapter-4 Nitrobenzene hydrogenation
104
precipitation catalysts, no significant consumption of hydrogen was observed which clearly
indicates the presence of Ni is in metallic state.
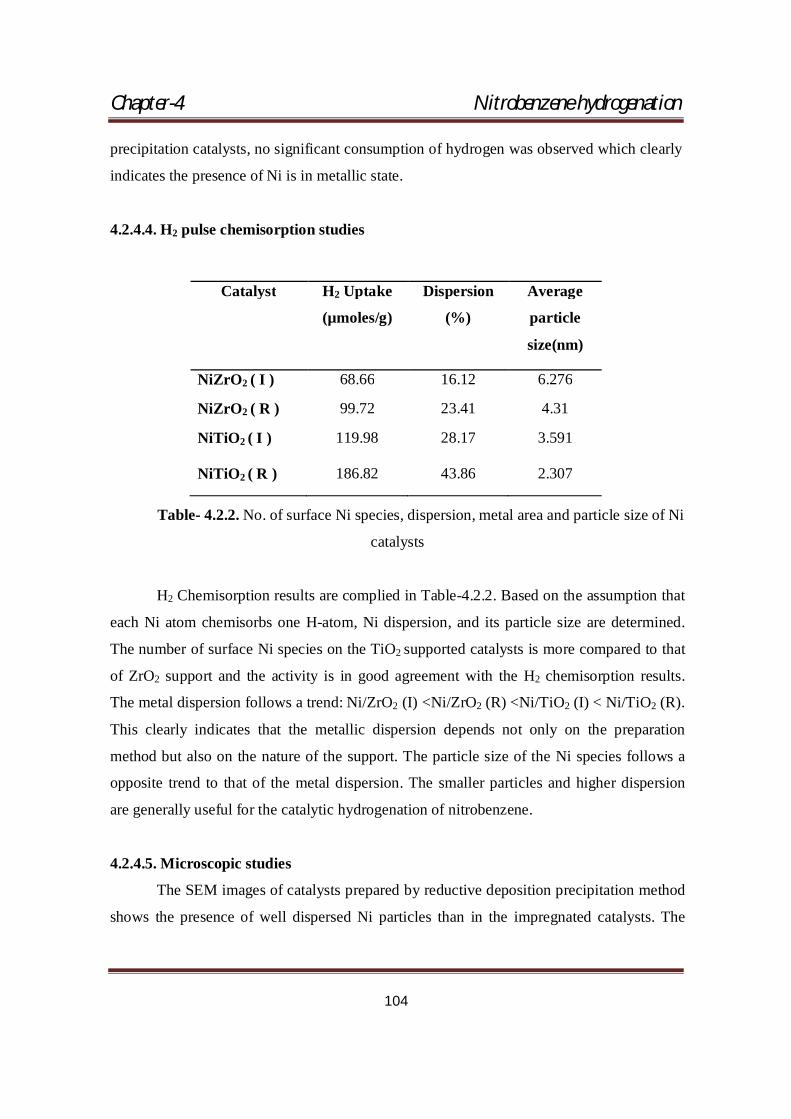
4.2.4.4. H2 pulse chemisorption studies
Table- 4.2.2. No. of surface Ni species, dispersion, metal area and particle size of Ni
catalysts
H2 Chemisorption results are complied in Table-4.2.2. Based on the assumption that
each Ni atom chemisorbs one H-atom, Ni dispersion, and its particle size are determined.
The number of surface Ni species on the TiO2 supported catalysts is more compared to that
of ZrO2 support and the activity is in good agreement with the H2 chemisorption results.
The metal dispersion follows a trend: Ni/ZrO2 (I) <Ni/ZrO2 (R) <Ni/TiO2 (I) < Ni/TiO2 (R).
This clearly indicates that the metallic dispersion depends not only on the preparation
method but also on the nature of the support. The particle size of the Ni species follows a
opposite trend to that of the metal dispersion. The smaller particles and higher dispersion
are generally useful for the catalytic hydrogenation of nitrobenzene.
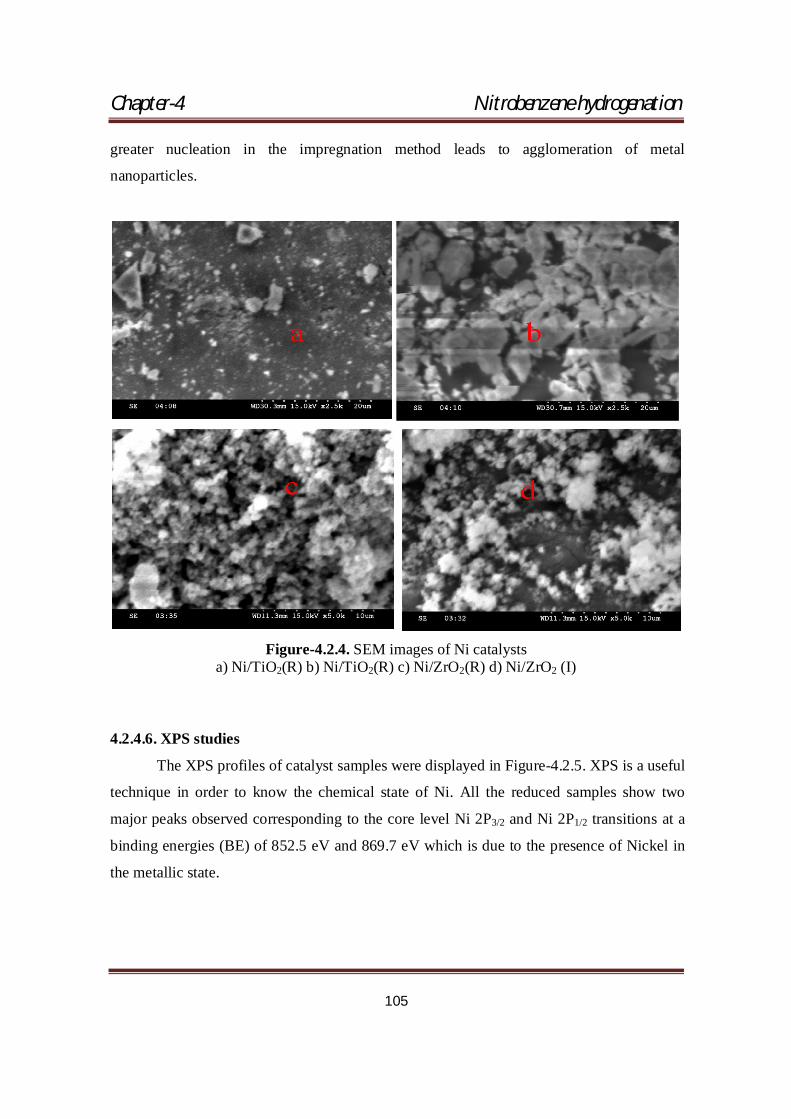
4.2.4.5. Microscopic studies
The SEM images of catalysts prepared by reductive deposition precipitation method
shows the presence of well dispersed Ni particles than in the impregnated catalysts. The
Catalyst H2 Uptake
(µmoles/g)
Dispersion
(%)
Average
particle
size(nm)
NiZrO2 ( I ) 68.66 16.12 6.276
NiZrO2 ( R ) 99.72 23.41 4.31
NiTiO2 ( I ) 119.98 28.17 3.591
NiTiO2 ( R ) 186.82 43.86 2.307
Chapter-4 Nitrobenzene hydrogenation
105
greater nucleation in the impregnation method leads to agglomeration of metal
nanoparticles.
Figure-4.2.4. SEM images of Ni catalysts
a) Ni/TiO2(R) b) Ni/TiO2(R) c) Ni/ZrO2(R) d) Ni/ZrO2 (I)
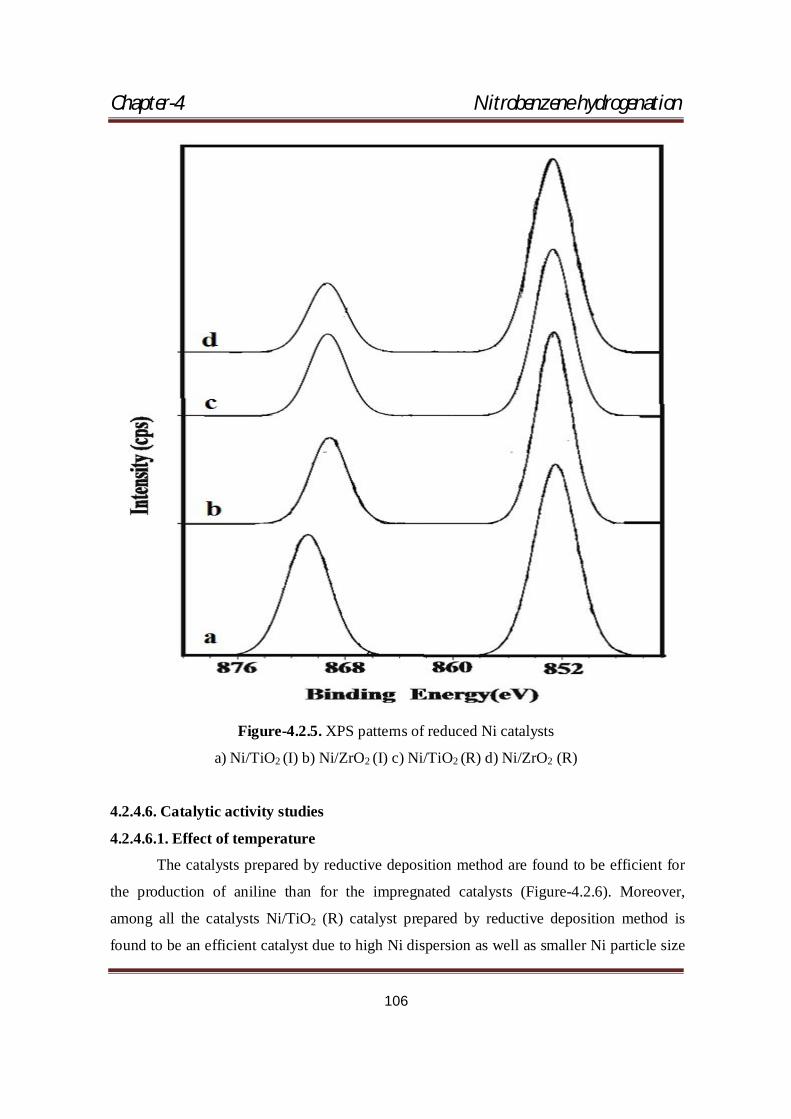
4.2.4.6. XPS studies
The XPS profiles of catalyst samples were displayed in Figure-4.2.5. XPS is a useful
technique in order to know the chemical state of Ni. All the reduced samples show two
major peaks observed corresponding to the core level Ni 2P3/2 and Ni 2P1/2 transitions at a
binding energies (BE) of 852.5 eV and 869.7 eV which is due to the presence of Nickel in
the metallic state.
Chapter-4 Nitrobenzene hydrogenation
106
Figure-4.2.5. XPS patterns of reduced Ni catalysts
a) Ni/TiO2 (I) b) Ni/ZrO2 (I) c) Ni/TiO2 (R) d) Ni/ZrO2 (R)
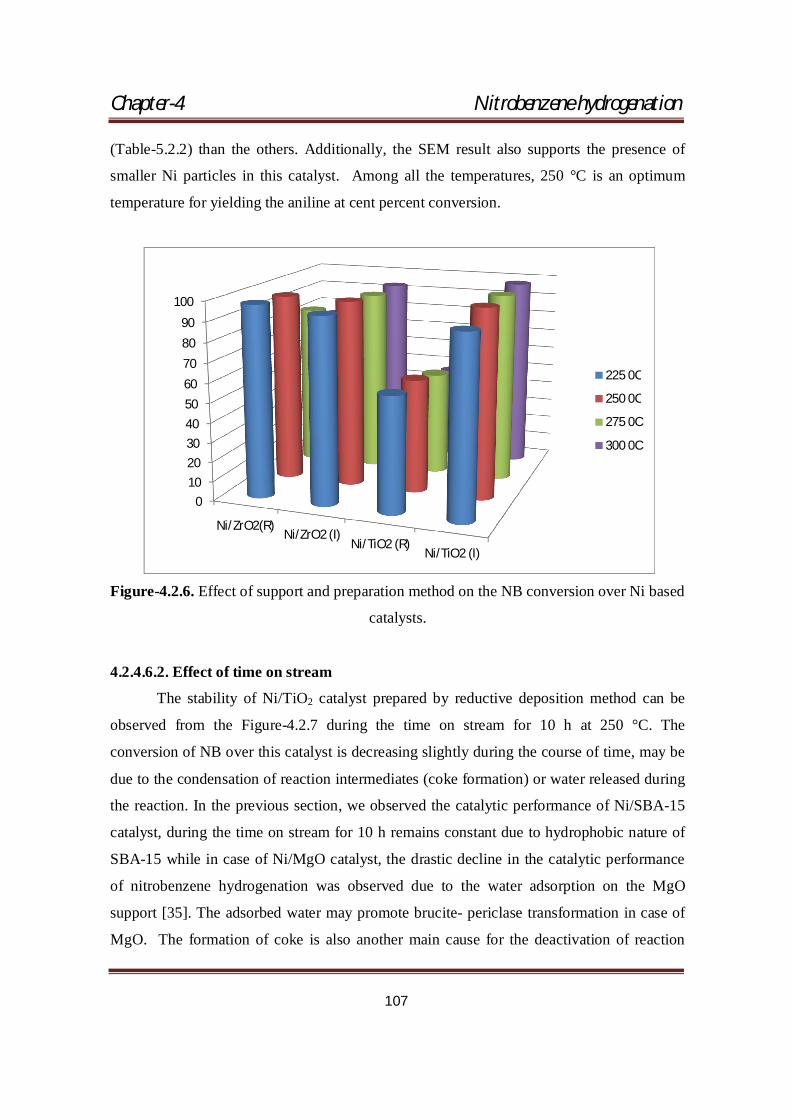
4.2.4.6. Catalytic activity studies
4.2.4.6.1. Effect of temperature
The catalysts prepared by reductive deposition method are found to be efficient for
the production of aniline than for the impregnated catalysts (Figure-4.2.6). Moreover,
among all the catalysts Ni/TiO2 (R) catalyst prepared by reductive deposition method is
found to be an efficient catalyst due to high Ni dispersion as well as smaller Ni particle size
Chapter-4 Nitrobenzene hydrogenation
107
(Table-5.2.2) than the others. Additionally, the SEM result also supports the presence of
smaller Ni particles in this catalyst. Among all the temperatures, 250 °C is an optimum
temperature for yielding the aniline at cent percent conversion.
Figure-4.2.6. Effect of support and preparation method on the NB conversion over Ni based
catalysts.
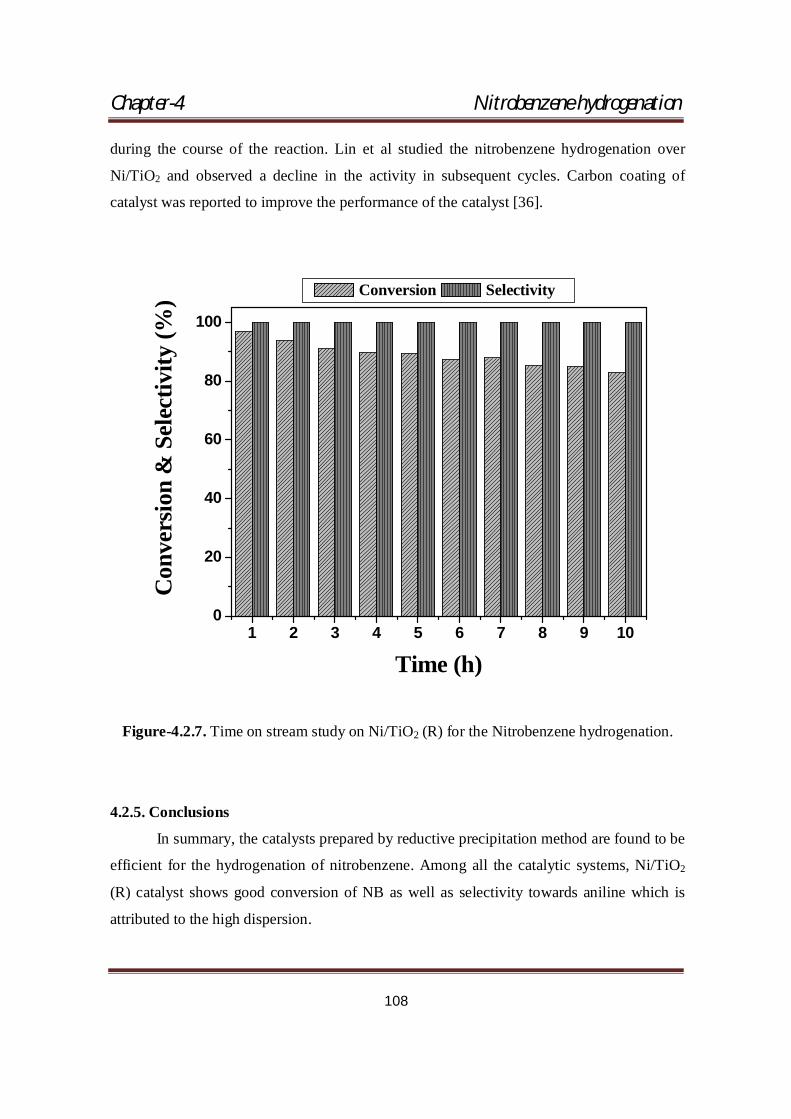
4.2.4.6.2. Effect of time on stream
The stability of Ni/TiO2 catalyst prepared by reductive deposition method can be
observed from the Figure-4.2.7 during the time on stream for 10 h at 250 °C. The
conversion of NB over this catalyst is decreasing slightly during the course of time, may be
due to the condensation of reaction intermediates (coke formation) or water released during
the reaction. In the previous section, we observed the catalytic performance of Ni/SBA-15
catalyst, during the time on stream for 10 h remains constant due to hydrophobic nature of
SBA-15 while in case of Ni/MgO catalyst, the drastic decline in the catalytic performance
of nitrobenzene hydrogenation was observed due to the water adsorption on the MgO
support [35]. The adsorbed water may promote brucite- periclase transformation in case of
MgO. The formation of coke is also another main cause for the deactivation of reaction
0102030405060708090
100
Ni/ZrO2(R)Ni/ZrO2 (I)
Ni/TiO2 (R)Ni/TiO2 (I)
225 0C
250 0C
275 0C
300 0C
Chapter-4 Nitrobenzene hydrogenation
108
during the course of the reaction. Lin et al studied the nitrobenzene hydrogenation over
Ni/TiO2 and observed a decline in the activity in subsequent cycles. Carbon coating of
catalyst was reported to improve the performance of the catalyst [36].
1 2 3 4 5 6 7 8 9 100
20
40
60
80
100
Con
vers
ion
& S
elec
tivity
(%)
Time (h)
Conversion Selectivity
Figure-4.2.7. Time on stream study on Ni/TiO2 (R) for the Nitrobenzene hydrogenation.
4.2.5. Conclusions
In summary, the catalysts prepared by reductive precipitation method are found to be
efficient for the hydrogenation of nitrobenzene. Among all the catalytic systems, Ni/TiO2
(R) catalyst shows good conversion of NB as well as selectivity towards aniline which is
attributed to the high dispersion.
Chapter-4 Nitrobenzene hydrogenation
109
4.2.6. References
[1]. S.Frank and P.C.Lauterbur: Nature, 1993, 363, 334.
[2]. K.Yamaguchi, K.Matsumoto and T.Fujii: J. Appl. Phys., 1990, 67, 4493.
[3]. G.A.Prinz: Science, 1998, 282, 1660.
[4]. J. Y. Choi, K. Y. Lee, B.K. Kim and J. M. Kim, J.Am.Ceram.Soc., 2005, 88, 3020.
[5]. J.H. Hodak, A. Henglein, M. Giersig and G.V. Hartland, J. Phys. Chem. B. 2000, 104,
11708.
[6]. S. Remita, M. Mostafavi and M.O. Delcourt, Radiat. Phys. Chem. 1996, 47, 275.
[7]. M. Brust, M. Walker, D. Bethell, D.J. Schiffrin and R. Whyman, J. Chem. Soc.
Chem. Commun. 1994,7, 801.
[8]. D.H. Chen and S.H. Wu, Chem. Mater. 2000, 12, 1354.
[9]. D.Dutta, B.J.Borah, L.Saikia, M.G.Pathak, P.Sengupta, D.K.Dutta, Applied Clay
Science, 2011, 53, 650.
[10]. Y. Mizukoshi, K. Okitsu, Y. Maeda, T.A. Yamamoto, R. Oshima and Y. Nagata, J.
Phys. Chem. B. 1997, 101, 7033.
[11]. L. P. Tiainen, P. M. Arvela and T. Salmi, Catal. Today, 1999, 48, 57.
[12]. J. P. Jacobs, L. P. Lindfors, J. G. H. Reintjes, O. Jylha and H. H. Brongersma, Catal.
Lett., 1994, 25, 315.
[13]. T. Borowieek, A. Golebiowski and B. Stasinska, Appl. Catal., A, 1997, 153, 141.
[14]. C. Dume and W. F. Holderich, Appl. Catal., A, 1999, 183, 167.
[15]. K. V. R. Chary, P. V. Ramana Rao and V. Vishwanthan, Catal. Commun., 2006, 7,
974.
[16]. Y. Cesteros, P. Salagre, F. Medina and J. E. Sueiras, Appl. Catal., B, 1999, 22, 135.
[17]. Q. Miao, G. X. Xiong, S. S. Sheng, W. Cui, L. Xu and X. X. Guo, Appl. Catal., A,
1997, 154, 17.
[18]. J. H. Kim, D. J. Suh, T. J. Park and K. L. Kim, Appl. Catal., A, 2000, 197, 191.
[19] U.S. Environmental Protection Agency. Health and Environmental Effects Profile for
Aniline. Environmental Criteria and Assessment Office, Office of Health and
Environmental Assessment, Office of Research and Development, Cincinnati, OH.
1985.
Chapter-4 Nitrobenzene hydrogenation
110
[20]. The Merck Index. An Encyclopedia of Chemicals, Drugs, and Biologicals. 11th ed.
Ed. S. Budavari. Merck and Co. Inc., Rahway, NJ. 1989.
[21]. http://www.prweb.com/releases/aniline/amino_benzene/prweb4370264.htm
[22]. S. K. Das, M. K. Bhunia, A. K. Sinha and A. Bhaumik, J. Phys. Chem. C, 2009, 113,
8918.
[23]. A. Peters, F. Nouroozi, D. Richter, M. Lutecki, R. Gläser., ChemCatChem 2011, 3,
598.
[24]. M. B. Gawande, R. V. Jayaram., Cat. Comm., 2006, 7, 931.
[25]. F. D. Monte, W. Larsen, J. D. Mackenzie., J. Am. Ceram. Soc., 2000, 83 (6) 1506.
[26]. S. –H. Chuang, M. –L. Hsieh, S. –C. Wu, H. –C. Lin, T. –S. Chao, T. –H. Hou ., J. Am. Ceram. Soc., 2011, 94 (1) 250.
[27]. K. Joseph Antony Raj, M. G. Prakash, R. Mahalakshmy, T. Elangovan, B.
Viswanathan., Catal. Sci. Technol., 2012, 2, 1429.
[28]. S. Li, C. Zhang, Z. Huang, G. Wu , J. Gong., Chem. Commun., 2013, 49, 4226.
[29]. T. Yamaguchi, Catal. Today, 1994, 20, 199.
[30]. Ho, S.W., Chu, C.Y., Chen, S.G., J. Catal., 1998, 178, 34.
[31]. H. -S. Roh, K. Y. Koo, J. H. Jeong, Y. T. Seo, D. J. Seo, Y. -S. Seo, W. L. Yoon, S.
B. Park , Catal. Lett., Vol. 117, 2007,1 -2, 85.
[32]. S. Tomiyama, R. Takahashi, S. Sato, T. Sodesawa and S. Yoshida, Appl. Catal., A,
2003, 241, 349.
[33]. S. Li, C. Zhang, Z. Huang, G. Wu, J. Gong, Chem. Commun., 2013, 49, 4226.
[34]. J. I. Beltran, S. Gallego, J. Cerda, J. S. Moya and M. C. Munoz, Phys. Rev. B, 2003,
68, 075401.
[35]. V. Mohan, C.V. Pramod, M. Suresh, K. H. P. Reddy, B. D. Raju, K.S. R. Rao., Cat.
Comm, 2012, 18, 89.
[36]. W.Lin, H. Cheng, J. Ming, Y. Yu, F. Zhao, J. Catal., 2012, 291, 149.