CHAPTER 4 FOREST LAND - ipcc-nggip.iges.or.jp · Volume 4: Agriculture, Forestry and Other Land Use...
71
Chapter 4: Forest Land 2019 Refinement to the 2006 IPCC Guidelines for National Greenhouse Gas Inventories 4.1 CHAPTER 4 FOREST LAND
Transcript of CHAPTER 4 FOREST LAND - ipcc-nggip.iges.or.jp · Volume 4: Agriculture, Forestry and Other Land Use...
Chapter 4: Forest Land
2019 Refinement to the 2006 IPCC Guidelines for National Greenhouse Gas Inventories 4.1
CH APTE R 4
FOREST LAND
Volume 4: Agriculture, Forestry and Other Land Use
4.2 2019 Refinement to the 2006 IPCC Guidelines for National Greenhouse Gas Inventories
Authors 1
Grant Domke (USA), Andrea Brandon (New Zealand), Rodel Diaz-Lasco (Philippines), Sandro Federici (San
Marino), Emilio Garcia-Apaza (Bolivia), Giacomo Grassi (EU), Thomas Gschwantner (Austria), Martin Herold
(Netherlands), Yasumasa Hirata (Japan), Åsa Kasimir (Sweden), Mwangi James Kinyanjui (Kenya), Haruni
Krisnawati (Indonesia), Aleksi Lehtonen (Finland), Rogers E. Malimbwi (Tanzania), Sini Niinistö (Finland),
Stephen Michael Ogle (USA), Thomas Paul (New Zealand), Nijavalli H. Ravindranath (India), Joachim Rock
(Germany), Carlos Roberto Sanquetta (Brazil), Maria José Sanz Sanchez (Spain), Marina Vitullo (Italy), Stephen
John Wakelin (New Zealand), Jianhua Zhu (China).
Contributing authors
Raul Abad Vinas (Spain), Valerio Avitabile (Italy), Luca Birigazzi (Italy), Simone Rossi (Italy), Danaë M.A.
Rozendaal (Netherlands), Louis Verchot (Colombia).
1 Biomass Carbon Sections were prepared by lead authors, G. Domke, A. Brandon, R. Diaz Lasco, S. Federici,
E. Garcia-Apaza, G. Grassi, T. Gschwantner, M. Herold, Y. Hirata, M.J. Kinyanjui, H. Krisnawati, R.E. Malimbwi,
S. Niinistö, S.M. Ogle, T. Paul, N.H. Ravindranath, J. Rock, C.R. Sanquetta, M.J. Sanz Sanchez, Y. Son, M.
Vitullo, S.J. Wakelin, and J. Zhu; and contributing authors, R. Abad-Vinas, V. Avitabile, L. Birigazzi, S. Rossi,
D.M.A. Rozendaal, and L. Verchot.
Soil Carbon Sections were prepared by lead authors, S. Niinistö, A. Lehtonen, Å. Kasimir, and S.M. Ogle.
Chapter 4: Forest Land
2019 Refinement to the 2006 IPCC Guidelines for National Greenhouse Gas Inventories 4.3
Contents
4 Forest land ................................................................................................................................................ 4.5
4.1 introduction ......................................................................................................................................... 4.5
4.2 forest land remaining forest land ......................................................................................................... 4.5
4.2.1 Biomass .................................................................................................................................... 4.5
4.2.2 Dead organic matter ................................................................................................................. 4.5
4.2.3 Soil carbon ............................................................................................................................... 4.5
4.2.3.1 Choice of method .......................................................................................................... 4.6
4.2.3.2 Choice of stock change and emission factors ............................................................... 4.7
4.2.3.3 Choice of activity data .................................................................................................. 4.9
4.2.3.4 Calculation steps for Tier 1 ........................................................................................... 4.9
4.2.3.5 Uncertainty assessment ................................................................................................. 4.9
4.2.4 Non-CO2 greenhouse gas emissions from biomass burning .................................................. 4.10
4.3 Land converted to forest land ............................................................................................................ 4.10
4.3.1 Biomass .................................................................................................................................. 4.10
4.3.2 Dead organic matter ............................................................................................................... 4.11
4.3.3 Soil carbon ............................................................................................................................. 4.11
4.3.3.1 Choice of method ........................................................................................................ 4.11
4.3.3.2 Choice of stock change and emission factors ............................................................. 4.12
4.3.3.3 Choice of activity data ................................................................................................ 4.13
4.3.3.4 Calculation steps for Tier 1 ......................................................................................... 4.13
4.3.3.5 Uncertainty assessment ............................................................................................... 4.14
4.4 Completeness, time series, QA/QC, and reporting and documentation ............................................ 4.14
4.4.1 Completeness ......................................................................................................................... 4.14
4.4.2 Developing a consistent time series ....................................................................................... 4.14
4.4.3 Quantity Assurance and Quality Control ............................................................................... 4.16
4.4.4 Reporting and Documentation ............................................................................................... 4.17
4.5 Tables ................................................................................................................................................ 4.17
References .......................................................................................................................................................... 4.54
Volume 4: Agriculture, Forestry and Other Land Use
4.4 2019 Refinement to the 2006 IPCC Guidelines for National Greenhouse Gas Inventories
Tables
Table 4.4 (Updated) Ratio of below-ground biomass to above-ground biomass (R) ............................. 4.18
Table 4.7 (Updated) Above-ground biomass in natural forests .............................................................. 4.22
Table 4.8 (Updated) Aboveground biomass (AGB) in forest plantations .............................................. 4.26
Table 4.9 (Updated) Above-ground net biomass growth in natural forests ........................................... 4.34
Table 4.10 (Updated) Above-ground net biomass growth in tropical and sub-tropical plantation forests 4.39
Table 4.11 (Updated) Reported Mean Annual Increment (growth rate of merchantable volume) values for
some plantation forest species ............................................................................... 4.42
Table 4.12 (Updated) Biomass values from tables 4.7–4.10 .................................................................... 4.47
Boxes
Box 4.3a (New) Developing Tier 2 stock change factors for forest land .......................................... 4.8
Box 4.3b (New) Example of resolving forest data gaps through extrapolation based on functional
relationships .......................................................................................................... 4.16
Chapter 4: Forest Land
2019 Refinement to the 2006 IPCC Guidelines for National Greenhouse Gas Inventories 4.5
4 FOREST LAND
4.1 INTRODUCTION
No refinement.
4.2 FOREST LAND REMAINING FOREST LAND
4.2.1 Biomass
No refinement.
4.2.2 Dead organic matter
No refinement.
4.2.3 Soil carbon
This section elaborates on estimation procedures and good practices for estimating change in forest soil C stocks.
It does not include forest litter, which is a dead organic matter pool. Separate guidance is provided for two types
of forest soils: 1) mineral forest soils, and 2) organic forest soils.
The organic C content of mineral forest soils (to 1 m depth) typically varies between 20 to over 300 tonnes C ha-
1 depending on the forest type and climatic conditions (Jobbagy and Jackson, 2000). Globally, mineral forest soils
contain approximately 700 Pg C (Dixon et al., 1994), but soil organic C pools are not static due to differences
between C inputs and outputs over time. Inputs are largely determined by the forest productivity, the
decomposition of litter and its incorporation into the mineral soil and subsequent loss through
mineralization/respiration (Pregitzer, 2003). Other losses of soil organic C occur through erosion or the dissolution
of organic C that is leached to groundwater or loss through overland flow. A large proportion of input is from
above-ground litter in forest soils, so soil organic matter tends to concentrate in the upper soil horizons, with
roughly half of the soil organic C in the upper 30 cm layer. In some forest ecosystems, rooting zones of trees
extend considerable deeper than 30 cm, which can increase the share of soil organic carbon in deeper layers
(Nepstad et al., 1994). Changes in soil carbon stocks in response to management actions such as thinning and
clear-cutting have been detected below 20–30 cm, but not in all studies or all depths (Achat et al., 2015a; James
and Harrison, 2016; Gross et al., 2018). Moreover, the scarcity of measurements increases uncertainty related to
soil carbon stock changes deeper in soil. The C held in the upper profile is often the most chemically decomposable,
and the most directly exposed to natural and anthropogenic disturbances. This section only deals with soil C and
does not address decomposing litter (i.e., dead organic matter, see Section 4.2.2).
Human activities and other disturbances such as changes in forest type, productivity, decay rates and disturbances
can alter the C dynamics of forest soils. Different forest management activities, such as rotation length; choice of
tree species; drainage; harvest practices (whole tree or sawlog, regeneration, partial cut or thinning); site
preparation activities (prescribed fires, soil scarification); and fertilization, affect soil organic C stocks (Harmon
and Marks, 2002; Liski et al., 2001; Johnson and Curtis, 2001). Changes in disturbance regimes, notably in the
occurrence of severe forest fires, pest outbreaks, and other stand-replacing disturbances are also expected to alter
the forest soil C pool (Li and Apps, 2002; de Groot et al., 2002). In addition, drainage of forest stands on organic
soils reduces soil C stocks.
General information and guidelines on estimating changes soil C stocks are found in Chapter 2, Section 2.3.3, and
needs to be read before proceeding with the specific guidelines dealing with forest soil C stocks. Changes in soil
C stocks associated with forests are computed using Equation 2.24 in Chapter 2, which combines the change in
soil organic C stocks for mineral soils and organic soils; and stock change for soil inorganic C pools (Tier 3 only).
This section elaborates on estimation procedures and good practices for estimating change in forest soil C organic
stocks (Note: It does not include forest litter, i.e., dead organic matter). Separate guidance is provided for two
types of forest soils: 1) mineral forest soils, and 2) organic forest soils. See Section 2.3.3.1 for general discussion
on soil inorganic C (no additional information is provided in the Forest Land discussion below).
To account for changes in soil C stocks associated with Forest Land Remaining Forest Land, countries need to
have, at a minimum, estimates of the total Forest Land area at the beginning and end of the inventory time period,
stratified by climate region and soil type. If land-use and management activity data are limited, Approach 1 activity
Volume 4: Agriculture, Forestry and Other Land Use
4.6 2019 Refinement to the 2006 IPCC Guidelines for National Greenhouse Gas Inventories
data (see Chapter 3) can be used as the basis for a Tier 1 approach, but higher Tiers are likely to need more detailed
records or knowledge of country experts about the approximate distribution of forest management systems. Forest
Land classes must be stratified according to climate regions and major soil types for Tier 1, which can be
accomplished with overlays of suitable climate and soil maps. Further stratification may be useful for development
of Tier 2 or 3 methodology for a country.
4.2.3.1 CHOICE OF METHOD
Inventories can be developed using Tier 1, 2 or 3 approaches, and countries may choose to use different tiers for
mineral and organic soils. Decision trees are provided for mineral soils (Figure 2.4) and organic soils (Figure 2.5)
in Chapter 2 to assist inventory compilers with selection of the appropriate tier for their soil C inventory.
Mineral soils
In spite of a growing body of literature on the effect of forest types, management practices and other disturbances
on soil organic C, the available evidence remains largely site- and study-specific, but eventually may be
generalized based on the influence of climatic conditions, soil properties, the time scale of interest, taking into
consideration sampling intensity and effects across different soil depth increments (Johnson and Curtis, 2001;
Hoover, 2003; Page-Dumroese et al., 2003). However, the current knowledge remains inconclusive on both the
magnitude and direction of C stock changes in mineral forest soils associated with forest type, management and
other disturbances, and cannot support broad generalizations.
Tier 1
Current scientific basis is not sufficient to develop Tier 1 default emission factors for quantification of effects of
forest management by IPCC climate zones. Thus, it is assumed in the Tier 1 method that forest soil C stocks do
not change with management. Recent studies indicate, that effects of forest management actions on soil C stocks
can be difficult to quantify and reported effects have been variable and even contradictory (see Box 4.3a).
Furthermore, if using Approach 2 or 3 activity data (see Chapter 3), it is not necessary to compute C stock changes
for mineral soils (i.e., change in SOC stocks is 0). If using activity data collected via Approach 1 (see Chapter 3),
and it is not possible to identify the amount of land converted from and to Forest Land, then the inventory compiler
should estimate soil C stocks for Forest Land using the areas at the beginning and the end of the inventory period
in order to estimate the change in soil carbon stock. The changes in soil C stocks for Forest Land are summed with
the changes in stocks for other land uses to estimate the influence of land-use change. If the compiler does not
compute a stock for Forest Land, it is likely to create systematic errors in the inventory. For example, land
converted from Forest Land to Cropland or Grassland will have a soil C stock estimated in the final year of the
inventory, but will have no stock in the first year of the inventory (when it was forest). Consequently, conversion
to Cropland or Grassland is estimated as a gain in soil C because the soil C stocks are assumed to be 0 in the Forest
Land, but not in Cropland and Grassland. This would introduce a bias into the inventory estimates. SOC0 and
SOC0-T are estimated for the top 30 cm of the soil profile using Equation 2.25 (Chapter 2). Note that areas of
exposed bedrock in Forest Land are not included in the soil C stock calculation (assume a stock of 0). Further
clarification on soil organic carbon estimation is presented in Section 2.3.3.1.
Tier 2
Using Equation 2.25 (Chapter 2) soil organic C stocks are computed based on reference soil C stocks and country-
specific stock change factors for forest type (FI), management (FMG) and natural disturbance regime (FND). Note
that the stock change factor for natural disturbance regime (FND) is substituted for the land-use factor (FLU) in
Equation 2.25. In addition, country-specific information can be incorporated to better specify reference C stocks,
climate regions, soil types, and/or the land management classification system.
Tier 3
Tier 3 approaches will require considerable knowledge and data allowing for the development of an accurate and
comprehensive domestic estimation methodology, including evaluation of model results and implementation of a
domestic monitoring scheme and/or modelling tool. The basic elements of a country-specific approach are
(adapted from Webbnet Land Resource Services Pty ltd, 1999):
Stratification by climatic zones, major forest types and management regimes coherent with those used for other
C pools in the inventory, especially biomass;
Determination of dominant soil types in each stratum;
Characterization of corresponding soil C pools, identification of determinant processes in SOC input and output
rates and the conditions under which these processes occur; and
Determination and implementation of suitable methods to estimate carbon stock changes from forest soils for
each stratum on an operational basis, including model evaluation procedures; methodological considerations
Chapter 4: Forest Land
2019 Refinement to the 2006 IPCC Guidelines for National Greenhouse Gas Inventories 4.7
are expected to include the combination of monitoring activities – such as repeated forest soil inventories - and
modelling studies, and the establishment of benchmark sites. Further guidance on good soil monitoring
practices is available in the scientific literature (Kimble et al., 2003, Lal et al., 2001, McKenzie et al., 2000).
It is good practice for models developed or adapted for this purpose to be peer-reviewed and validated with
observations representative of the ecosystems under study and independent from the calibration data.
More guidance on Tier 3 methods is given in Chapter 2.3.3.1, such as examples of Tier 3 modelling methods in
Box 2.2d. The examples provide information about types of data required, brief descriptions of models, methods
that are used to apply the models, and how using a Tier 3 model has changed results. General guidance on
measurement-based and model-based Tier 3 inventories for the AFOLU sector can be found in Section 2.5.
Organic soils
No refinement.
See guidance in 2013 Supplement to the 2006 IPCC Guidelines for National Greenhouse Gas Inventories:
Wetlands, Chapter 2, Section 2.2.
4.2.3.2 CHOICE OF STOCK CHANGE AND EMISSION FACTORS
Mineral soils
Tier 1
It is not necessary to compute the stock estimates for Forest Land Remaining Forest Land with Approach 2 or 3
activity data (see Chapter 3). If using Approach 1 activity data, stock change factors, including input, management
and disturbance regime, are equal to 1 using the Tier 1 approach. Consequently, only reference C stocks are
needed to apply the method, and those are provided in Table 2.3 of Chapter 2.
Tier 2
In a Tier 2 approach, stock change factors are derived based on a country-specific classification scheme for
management, forest types, and natural disturbance regimes. A Tier 2 approach should include the derivation of
country-specific reference C stocks, and a more detailed classification of climate and soils than the default
categories provided with the Tier 1 method. The depth for evaluating soil C stock changes can differ from 30 cm
with the Tier 2 method. However, this will require consistency with the depth of the reference C stocks (SOCREF)
and stock change factors (i.e., FLU, FI, and FMG) to ensure consistent application of methods for determining the
impact of land use change on soil C stocks. Box 4.3a provides information and references that can be used as a
starting point for developing Tier 2 factors for forest management as well as observations on related challenges.
It is good practice to focus on the factors that have the largest overall effect, taking into account the impact on
forest SOC and the extent of affected forests. Management practices can be coarsely labeled as intensive (e.g.,
plantation forestry) or extensive (e.g., natural forest); these categories can also be redefined according to national
circumstances. The development of stock change factors is likely to be based on intensive studies at experimental
sites and sampling plots involving replicated, paired site comparisons (Johnson et al., 2002; Olsson et al., 1996;
see also the reviews by Johnson and Curtis, 2001; and Hoover, 2003). In practice, it may not be possible to separate
the effects of different forest types, management practices and disturbance regimes, in which case stock change
factors should be combined into a single modifier. If a country has well-documented data for different forest types
under different management regimes, it might be possible to derive soil organic C estimates directly without using
reference C stocks and adjustment factors. However, a relationship to the reference C stocks must be established
so that the impact of land-use change can be computed without artificial increases or decreases in the C stocks due
to a lack of consistency in the methods across the various land-use categories (i.e., Forest Land, Cropland,
Grassland, Settlements, and Other Land).
Inventories can also be improved by deriving country-specific reference C stocks (SOCREF), compiled from
published studies or surveys. Such values are typically obtained through the development and/or compilation of
large soil profile databases (Siltanen et al., 1997; Scott et al., 2002; Batjes 2011; De Vos et al., 2015). Additional
guidance for deriving stock change factors and reference C stocks is provided in Section 2.3.3.1 (Chapter 2).
Volume 4: Agriculture, Forestry and Other Land Use
4.8 2019 Refinement to the 2006 IPCC Guidelines for National Greenhouse Gas Inventories
BOX 4.3A (NEW)
DEVELOPING TIER 2 STOCK CHANGE FACTORS FOR FOREST LAND
Although the scientific basis is not sufficient for deriving default stock change factors for forest land,
country specific Tier 2 factors can be developed if there is adequate data available to represent
national circumstances. Several meta-analyses and reviews provide analyses and references to
support incorporation of country-specific data into a Tier 2 method with estimation of management
effects and corresponding stock change factors (FMG) for Forest Land Remaining Forest Land.
Quantification of management effects becomes increasingly important in cases in which forests
represent a significant sink or source or in which changes in management intensity or practices result
in gains or losses compared to earlier practices. Increased removal of harvest residues or stumps for
bioenergy is one example of changes in management intensity and practices. Most analyses have
focused on the effects following harvests of different intensities (e.g., Johnson and Curtis, 2001;
Achat et al., 2015a; James and Harrison, 2016; Zhou et al., 2013). Response ratios or effect sizes
based on measurements of soil carbon stocks reflect all changes associated with a management
action; thus, separate carbon stock factors for input of organic matter (FI) cannot be derived from
the existing data.
Most field experiments have been carried out in cool temperate regions, and meta-analyses or
reviews on harvest effects can be found to support adaptation of Tier 2 methods for these regions
(Nave et al., 2010; Thiffault et al., 2011; Clarke et al., 2015; Hume et al., 2017). When selecting
harvesting experiments on which to base the calculation of stock change factors, several factors need
to be considered: intensity of harvest, treatment of harvest residues and other site preparation
practices, such as burning, time since the management action, and soil layers and sampling depths
(Liao et al., 2010; Strömgren et al., 2013; Achat et al., 2015b; James and Harrison, 2016; Dean et
al., 2017; Hume et al., 2017). Tree species composition, i.e., conifers versus broad-leaved or mixed
species, could also influence the management effect although the influence can be confounded by
other factors (e.g. Hume et al., 2017). The question of control conditions for evaluating the
management action is of great importance because the control is often not a native reference
condition, but rather another managed forest (Dean et al., 2017). This should be taken into account
when estimating a stock change factor based on several field studies as well as the relationship to
country-specific reference soil C stock.
Conclusions on the harvesting effects differ between meta-analyses, which could be partly due to
differences in field experiment set-ups and the different data selection and weighting procedures. As
an example, whole-tree harvests resulted in average 7.5percent smaller carbon stocks in mineral soil
than the stocks measured 10–30 years after stem-only harvests (Achat et al., 2015a). However, no
effect of whole-tree harvest was found in some other meta-analyses (Clarke et al., 2015; Hume et
al., 2017) or a positive effect was reported (James and Harrison, 2016). However, there was a
tendency for smaller carbon stocks in forest floor after whole-tree harvesting compared to stem-only
harvesting or pre-treatment conditions (Johnson and Curtis, 2001; Thiffault et al., 2011; Clarke et
al., 2015).
Considerable spatial variability increases the challenge to detect relatively small management effects
in soil C stocks (Jandl et al., 2007). However, most studies include only the first one or two decades
after the harvest, which may too short to reveal impact of forest management actions on soil carbon
stock changes, especially in cool climate regions with long rotation periods (Clarke et al., 2015;
Dean et al., 2017). Non-linearity in the responses has also been observed. For example, an increase
in soil C stocks after an initial decrease has been observed for a group of studies on Spodosols from
a cool and humid climate with longer monitoring periods, up to eight decades of typical rotation
lengths (James and Harrison, 2016).
In addition to guidance in this Chapter 4.2.3.2 above, detailed guidance on estimation of country-
specific stock change factors and reference C stocks in general is given in Chapter 2, in Section
2.3.3.1., including guidance on using models to derive carbon stock change factors.
Tier 3
Constant stock change rate factors per se are less likely to be estimated in favor of variable rates that more
accurately capture land-use and management effects. See Section 2.3.3.1 (Chapter 2) for further discussion.
Organic soils
No refinement.
Chapter 4: Forest Land
2019 Refinement to the 2006 IPCC Guidelines for National Greenhouse Gas Inventories 4.9
See guidance in 2013 Supplement to the 2006 IPCC Guidelines for National Greenhouse Gas Inventories:
Wetlands, Chapter 2, Section 2.2.
4.2.3.3 CHOICE OF ACTIVITY DATA
Mineral soils
Tier 1
For the Tier 1 approach, it is assumed that forest soil C stocks do not change with management, and therefore it is
not necessary to classify forest into various types, management classes or natural disturbance regimes. However,
if using Approach 1 activity data (see Chapter 3), environmental data will be needed to classify the country into
climate regions and soil types in order to apply the appropriate reference C stocks to Forest Land. A detailed
description of the default climate classification scheme is given in Chapter 3, Annex 3A.5. If the information
needed to classify climate types is not available from national databases, there are international sources of climate
data such as United Nations Environmental Program. Data will also be needed to classify soils into the default
categories provided in Chapter 3, and if national data are not available to map the soil types, international soils
data provide a reasonable alternative, such as the FAO Soils Map of the World.
Tier 2
Activity data for the Tier 2 approach consist of the major forest types, management practices, disturbance regimes
and the areas to which they apply. It is preferable for the data to be linked with the national forest inventory, where
one exists, and/or with national soil and climate databases. Typical changes include conversion of unmanaged to
managed forest; conversion of forest type (native forest into a new forest type, such as plantation of exotic species
and vice versa); intensification of forest management activities, such as site preparation, tree planting, interval and
intensity of thinning and rotation length changes; changes in harvesting practices (bole vs. whole-tree harvesting;
amount of residues left on-site); and the frequency of disturbances (e.g., pest and disease outbreaks, flooding, fires,
typhoon/cyclone/hurricane, snow damage). Data sources will vary according to a country’s forest management
system, but could include individual contractors or companies, statutory forest authorities, research institutions
and agencies responsible for forest inventories. Data formats vary widely, and include, among others, activity
reports, forest management inventories and remote sensing imagery.
In addition, Tier 2 methods should involve a finer stratification of environmental data than the Tier 1 approach,
including climate regions and soil types, which would likely be based on national climate and soils data. If a finer
classification scheme is utilized in a Tier 2 inventory, reference C stocks will also need to be derived for the more
detailed set of climate regions and soil types, and the land management data will need to be stratified based on the
country-specific classification.
Tier 3
For application of dynamic models and/or a direct measurement-based inventory in Tier 3, similar or more detailed
data on the combinations of climate, soil, topographic and management data are needed, relative to the Tiers 1 and
2 methods, but the exact requirements will be dependent on the model or measurement design.
Organic soils
No refinement.
See guidance in 2013 Supplement to the 2006 IPCC Guidelines for National Greenhouse Gas Inventories:
Wetlands, Chapter 2, Section 2.2.
4.2.3.4 CALCULATION STEPS FOR TIER 1
No refinement.
4.2.3.5 UNCERTAINTY ASSESSMENT
Three broad sources of uncertainty exists in soil C inventories: 1) uncertainties in land-use and management
activity and environmental data; 2) uncertainties in reference soil C stocks if using Tier 1 or 2 approaches (mineral
soils only); and 3) uncertainties in the stock change/emission factors for Tier 1 or 2 approaches, model
structure/parameter error for Tier 3 model-based approaches, or measurement error/sampling variability associated
with Tier 3 measurement-based inventories. In general, precision of an inventory is increased (i.e., smaller
confidence ranges) with more sampling to estimate values for the three broad categories. In addition, reducing
Volume 4: Agriculture, Forestry and Other Land Use
4.10 2019 Refinement to the 2006 IPCC Guidelines for National Greenhouse Gas Inventories
bias (i.e., improve accuracy) is more likely through the development of a higher Tier inventory that incorporates
country-specific information.
For Tier 1, uncertainties are provided with the reference C stocks in the first footnote of Table 2.3 (Chapter 2), and
emission factor uncertainties for organic soils are provided in Table 4.6, Section 4.5. For organic soils, see
guidance in 2013 Supplement to the 2006 IPCC Guidelines for National Greenhouse Gas Inventories: Wetlands,
Chapter 2, Section 2.2. Uncertainties in land-use and management data will need to be addressed by the inventory
compiler, and then combined with uncertainties for the default factors and reference C stocks (mineral soils only)
using an appropriate method, such as simple error propagation equations. Refer to Section 4.2.1.5 for uncertainty
estimate for land area estimates. However, it is good practice for the inventory compiler to derive uncertainties
from country-specific activity data instead of using a default level.
Default reference C stocks for mineral soils and emission factors for organic soils can have inherently high
uncertainties, particularly bias, when applied to specific countries. Defaults represent globally averaged values of
land-use and management impacts or reference C stocks that may vary from region-specific values (Powers et al.,
2004; Ogle et al., 2006). Bias can be reduced by deriving country-specific factors using Tier 2 method or by
developing a Tier 3 country-specific estimation system. The underlying basis for higher Tier approaches will be
research in the country or neighbouring regions that address the effect of land use and management on soil C. In
addition, it is good practice to further minimize bias by accounting for significant within-country differences in
land-use and management impacts, such as variation among climate regions and/or soil types, even at the expense
of reduced precision in the factor estimates (Ogle et al., 2006). Bias is considered more problematic for reporting
stock changes because it is not necessarily captured in the uncertainty range (i.e., the true stock change may be
outside of the reported uncertainty range if there is significant bias in the factors).
Uncertainties in land-use activity statistics may be improved through a better national system, such as developing
or extending a ground-based survey with additional sample locations and/or incorporating remote sensing to
provide additional coverage. It is good practice to design a classification that captures the majority of land-use
and management activity with a sufficient sample size to minimize uncertainty at the national scale.
For Tier 2 methods, country-specific information is incorporated into the inventory analysis for purposes of
reducing bias. For example, Ogle et al. (2003) utilized country-specific data to construct probability distribution
functions for US specific factors, activity data and reference C stocks for agricultural soils. It is good practice to
evaluate dependencies among the factors, reference C stocks or land-use and management activity data. In
particular, strong dependencies are common in land-use and management activity data because management
practices tend to be correlated in time and space. Combining uncertainties in stock change/emission factors,
reference C stocks and activity data can be done using methods such as simple error propagation equations or
Monte-Carlo procedures.
Tier 3 models are more complex and simple error propagation equations may not be effective at quantifying the
associated uncertainty in resulting estimates. Monte Carlo analyses are possible (Smith and Heath, 2001), but can
be difficult to implement if the model has many parameters (some models can have several hundred parameters)
because joint probability distribution functions must be constructed quantifying the variance as well as covariance
among the parameters (see e.g. Peltoniemi et al., 2006; Metsaranta et al., 2017). However, if soil model parameters
have been estimated with a Bayesian approach, the resultant joint probability distribution for the parameters can
be sampled in a Monte Carlo Analysis to capture parameter uncertainty, along with sampling of probability
distribution functions for model inputs and other associated data, see Lehtonen and Heikkinen (2016). Other
methods are also available such as empirically-based approaches (Monte et al., 1996), which use measurements
from a monitoring network to statistically evaluate the relationship between measured and modelled results
(Falloon and Smith, 2003; Ogle et al., 2007). In contrast to modelling, uncertainties in measurement-based Tier 3
inventories can be determined from the sample variance, measurement error and other relevant sources of
uncertainty.
4.2.4 Non-CO2 greenhouse gas emissions from biomass
burning
No refinement.
4.3 LAND CONVERTED TO FOREST LAND
4.3.1 Biomass
No refinement.
Chapter 4: Forest Land
2019 Refinement to the 2006 IPCC Guidelines for National Greenhouse Gas Inventories 4.11
4.3.2 Dead organic matter
No refinement.
4.3.3 Soil carbon
Land conversions on mineral soils generally either maintain similar levels of C storage or create conditions that
increase soil C stocks, particularly if the land was previously managed for annual crop production (Post and Kwon,
2000). However, under certain circumstances, Grassland conversion to Forest Land has been shown to cause small
C losses in mineral soils for several decades following conversion (Davis and Condron, 2002; Paul et al., 2002).
Emissions of C from organic soils will vary depending on the previous use and level of drainage. Specifically,
conversion from Cropland will tend to decrease emissions; conversions from Grassland will likely maintain similar
emission rates; while conversion from Wetlands often increases C emissions.
General information and guidelines on estimating changes soil C stocks are found in Section 2.3.3 in Chapter 2
(including equations) and need to be read before proceeding with guidelines dealing with forest soil C stocks. The
total change in soil C stocks for Land Converted to Forest Land is computed using Equation 2.24 (Chapter 2),
which combines the change in soil organic C stocks for mineral soils and organic soils; and carbon stock changes
for inorganic soil C pools (Tier 3 only). This section provides specific guidance for estimating soil organic C stock
changes; see Section 2.3.3.1 (Chapter 2) for general discussion on soil inorganic C (no additional information is
provided in the Forest Land discussion below).
To account for changes in soil C stocks associated with Land Converted to Forest Land, countries need to have,
at a minimum, estimates of the areas of Land Converted to Forest Land during the inventory time period, stratified
by climate region and soil type. If land-use and management data are limited, Approach 1 activity data can be used
as a starting point, along with knowledge of country experts of the approximate distribution of land-use types being
converted. If previous lands uses and conversions for Land Converted to Forest Land are unknown, SOC stocks
changes can still be computed using the methods provided in Forest Land Remaining Forest Land, but the land
base will likely be different for forests in the current year relative to the initial year in the inventory. It is critical,
however, that the total land area across all land-use sectors be equal over the inventory time period (e.g., if 5
Million ha is converted from Cropland and Grassland to Forest Land during the inventory time period, then Forest
Land will have an additional 5 Million ha in the last year of the inventory, while Cropland and Grassland will have
a corresponding loss of 5 Million ha in the last year), and the total change will be estimated when summing SOC
stocks across all land uses. Land Converted to Forest Land is stratified according to climate regions and major
soil types, which could either be based on default or country-specific classifications. This can be accomplished
with overlays of climate and soil maps, coupled with spatially-explicit data on the location of land conversions.
Inventories can be developed using Tier 1, 2 or 3 approaches, with each successive Tier requiring more detail and
resources than the previous. It is possible that countries will use different tiers to prepare estimates for the separate
components in this source category (i.e., soil organic C stocks changes in mineral soils and organic soils; and stock
changes associated with soil inorganic C pools).
4.3.3.1 CHOICE OF METHOD
Inventories can be developed using Tier 1, 2 or 3 approaches and countries may choose different tiers for mineral
and organic soils. Decision trees are provided for mineral (Figure 2.4) and organic soils (Figure 2.5) in Section
2.3.3.1 (Chapter 2) to assist inventory compilers with selection of the appropriate tier for their soil C inventory.
Mineral soils
Tier 1
Change in soil organic C stocks can be estimated for mineral soils with land-use conversion to Forest Land using
Equation 2.25 (Chapter 2). For Tier 1, the initial (pre-conversion) soil organic C stock (SOC(0-T)) and C stock in
the last year of the inventory time period (SOC0) are determined from the common set of reference soil organic C
stocks (SOCREF) and default stock change factors (FLU, FMG, FI) as appropriate for describing land use and
management both pre- and post-conversion. Note that area of exposed bedrock in Forest Land or the previous land
use are not included in the soil C stock calculation (assume a stock of 0). Annual rates of stock changes are
calculated as the difference in stocks (over time) divided by the time dependence (D) of the stock change factors
(default is 20 years).
Volume 4: Agriculture, Forestry and Other Land Use
4.12 2019 Refinement to the 2006 IPCC Guidelines for National Greenhouse Gas Inventories
Tier 2
The Tier 2 approach for mineral soils also uses Equation 2.25 (Chapter 2), but involves country or region-specific
reference C stocks and/or stock change factors and possibly more disaggregated land-use activity and
environmental data.
Tier 3
Tier 3 approaches will involve more detailed and country-specific models and/or measurement-based approaches
along with highly disaggregated land-use and management data. It is good practice that Tier 3 approaches
estimating soil C change from land-use conversions to Forest Land, employ models, monitoring networks and/or
data sets that are capable of representing transitions over time from other land uses, including Grassland, Cropland
and possibly Settlements or other land uses. It is important that models be evaluated with independent observations
from country or region-specific field locations that are representative of the interactions of climate, soil and forest
type/management on post-conversion change in soil C stocks.
Organic soils
No refinement.
See guidance in 2013 Supplement to the 2006 IPCC Guidelines for National Greenhouse Gas Inventories:
Wetlands, Chapter 2, Section 2.3.
4.3.3.2 CHOICE OF STOCK CHANGE AND EMISSION FACTORS
Mineral soils
Tier 1
For native unmanaged land, as well as for managed Forest Land, Settlements and nominally managed Grassland
with low disturbance regimes, soil C stocks are assumed equal to the reference values (i.e., land use, disturbance
(forests only), management and input factors equal 1), but it will be necessary to apply the appropriate stock change
factors to represent other systems which may be converted to Forest Land, such as improved and degraded
Grassland, as well as all Cropland systems. See the appropriate land-use section for default stock change factors
(Forest Land in 4.2.3.2, Cropland in Section 5.2.3.2, Grassland in 6.2.3.2, Settlements in 8.2.3.2, and Other Land
in 9.3.3.2). Default reference C stocks are found in Table 2.3 (Chapter 2).
Tier 2
Estimation of country-specific stock change factors is probably the most important development associated with
the Tier 2 approach. Differences in soil organic C stocks among land uses are computed relative to a reference
condition. If default reference C stocks are used, the reference condition is native vegetation that is neither
degraded nor improved through land-use and management practices. Stock change factors for land-use conversion
to native forests will be equal to 1 if the forest represents the reference condition. However, stock change factors
will need to be derived for Land Converted to Forest Land that do not represent the reference condition, accounting
for the influence of disturbance (FD), input (FI) and management (FMG), which are then used to further refine the
C stocks of the new forest system. See the appropriate section for specific information regarding the derivation of
stock change factors for other land-use sectors (Cropland in 5.2.3.2, Grassland in Section 6.2.3.2, Settlements in
8.2.3.2, and Other Land in 9.3.3.2).
Reference C stocks can also be derived from country-specific data in a Tier 2 approach. Reference values in Tier
1 correspond to non-degraded, unimproved lands under native vegetation, but other reference conditions can also
be chosen for Tier 2. In general, reference C stocks should be consistent across the land uses (i.e., Forest Land,
Cropland, Grassland, Wetlands, Settlements, Other Land) (see section 2.3.3.1). Therefore, the same reference stock
should be used for each climate zone and soil type, regardless of the land use. The reference stock is then multiplied
by land use, input and management factors to estimate the stock for each land use based on the set of management
systems that are present in a country. In addition, the depth for evaluating soil C stock changes can be different
with the Tier 2 method. However, this will require consistency with the depth of the reference C stocks (SOCREF)
and stock change factors for all land uses (i.e., FLU, FI, and FMG) to ensure consistency in the application of methods
for estimating the impact of land use change on soil carbon stocks. Additional guidance is provided in Chapter 2,
Section 2.3.3.1.
The carbon stock estimates may be improved when deriving country-specific factors for FLU and FMG, by
expressing carbon stocks on a soil-mass equivalent basis rather than a soil-volume equivalent (i.e., fixed depth)
basis. This is because the soil mass in a certain soil depth changes with the various operations associated with land
use that affect the density of the soil, such as uprooting, land levelling, tillage, and rain compaction due to the
disappearance of the cover of tree canopy. However, it is important to realize that all data used to derive stock
change factors across all land uses must be on an equivalent mass basis if this method is applied. This will be
Chapter 4: Forest Land
2019 Refinement to the 2006 IPCC Guidelines for National Greenhouse Gas Inventories 4.13
challenging to do comprehensively for all land uses. See Box 2.2c in Chapter 2, Section 2.3.3.1 for more
information.
Tier 3
Constant stock change rate factors per se are less likely to be estimated in favor of variable rates that more
accurately capture land-use and management effects. See Section 2.3.3.1 (Chapter 2) for further discussion.
Organic soils
No refinement.
See guidance in 2013 Supplement to the 2006 IPCC Guidelines for National Greenhouse Gas Inventories:
Wetlands, Chapter 2, Section 2.3.
4.3.3.3 CHOICE OF ACTIVITY DATA
Mineral soils
Tier 1 and Tier 2
For purposes of estimating soil carbon stock change, area estimates of Land Converted to Forest Land should be
stratified according to major climate regions and soil types. This can be based on overlays with suitable climate
and soil maps and spatially-explicit data of the location of land conversions. Detailed descriptions of the default
climate and soil classification schemes are provided in Chapter 3. Specific information is provided in the each of
the land-use sections regarding treatment of land-use/management activity data (Forest Land in Section 4.2.3.3,
Cropland in 5.2.3.3, Grassland in 6.2.3.3, Wetlands in 7.2.3.2, Settlements in 8.2.3.3, and Other Land in 9.3.3.3).
One critical issue in evaluating the impact of Land Converted to Forest Land on soil organic C stocks is the
previous land-use and management activity. Activity data gathered using Approach 2 or 3 (see Chapter 3 for
discussion about Approaches) provide the underlying basis for determining the previous land use and management
for Land Converted to Forest Land. In contrast, aggregate data (Approach 1, Chapter 3) only provide the total
amount of area in each land use and do not form a basis for determining specific transitions. Moreover, aggregate
data only represent the net changes in land use and management rather than the gross changes, which could be
considerably larger and may have an impact on the total soil C stock changes. Regardless, with aggregate data
(Approach 1), changes in soil organic C stocks may be computed separately for each land-use category and then
combined to obtain the total stock change even if the total changes do not capture the full dynamics occurring with
land use change. Using this approach, it will be necessary for coordination among each land-use category to ensure
the total land base is remaining constant over time, given that some land area will be lost and gained within
individual land-use category during each inventory year due to land-use change. Further clarification on soil
organic C estimation methods in case of land-use change is presented in Section 2.3.3.1.
Tier 3
For application of dynamic models and/or a direct measurement-based inventory in Tier 3, similar or more detailed
data on the combinations of climate, soil, topographic and management data are needed, relative to Tier 1 or 2
method, but the exact requirements will be dependent on the model or measurement design.
Organic soils
No refinement.
See guidance in 2013 Supplement to the 2006 IPCC Guidelines for National Greenhouse Gas Inventories:
Wetlands, Chapter 2, Section 2.3.
4.3.3.4 CALCULATION STEPS FOR TIER 1
Mineral soils
The steps for estimating SOC0 and SOC(0-T) and net soil C stock change per ha of Land Converted to Forest Land
are as follows:
Step 1: Determine the land-use and management by mineral soil types and climate regions for land at the
beginning of the inventory period, which can vary depending on the time step of the activity data (0-T; e.g., 5, 10
or 20 years ago).
Volume 4: Agriculture, Forestry and Other Land Use
4.14 2019 Refinement to the 2006 IPCC Guidelines for National Greenhouse Gas Inventories
Step 2: Select the native reference C stock value (SOCREF), based on climate and soil type from Table 2.3, for
each area of land being inventoried. The reference C stocks are the same for all land-use categories to ensure that
erroneous changes in the C stocks are not computed due to differences in reference stock values among sectors.
Step 3: Select the land-use factor (FLU), management factor (FMG) and C input levels (FI) representing the land-
use and management system present before conversion to forest. Values for FLU, FMG and FI are given in the
respective section for the land-use sector (Cropland in Chapter 5, and Grassland in Chapter 6).
Step 4: Multiply these values by the reference soil C stock to estimate of ‘initial’ soil organic C stock (SOC(0-T))
for the inventory time period.
Step 5: Estimate SOC0 by repeating step 1 to 4 using the same native reference C stock (SOCREF), but with land-
use, management and input factors that represent conditions in the last (year 0) inventory year. For Tier 1, all stock
change factors are assumed equal to 1 for Forest Land (although for Tier 2, different values for these factors under
newly converted Forest Land should be used, based on country-specific data).
Step 6: Estimate the average annual change in soil C stock for the area over the inventory time period, ∆CCCMineral
,
(see Equation 2.25 in Chapter 2).
Step 7: Repeat Steps 1 to 6 if there are additional inventory time periods (e.g., 1990 to 2000, 2001 to 2010, etc.).
A numerical example is given below for afforestation of cropland soil.
Example: An area of 100,000 ha of cropland was planted to forest. The soil type is an Ultisol in a
tropical moist climate, which has a native reference stock, SOCRef (0-30 cm), of 47 tonnes C ha-1
(Table 2.3). The previous land use was annual row crops, with conventional tillage, no fertilization
and where crop residues are removed, so that the soil carbon stock at the beginning of the inventory
time period (in this example, 5 yrs earlier in 1995) was (SOCRef ● FLU ● FMG ● FI) = 47 tonnes C ha-
1 ● 0.48 ● 1 ● 0.92 = 20.8 tonnes C ha-1 (see Table 5.5, Chapter 5, for stock change factor for
cropland). Under Tier 1, managed forest is assumed to have the same soil C stock as the reference
condition (i.e. all stock change factors are equal to 1). Thus, the average annual change in soil C
stock for the area over the inventory time period is estimated as (47 tonnes C ha-1 – 20.8 tonnes C
ha-1) / 20 yrs = 1.3 tonnes C ha-1 yr-1. For the area reforested there is an increase of 131,000 tonnes
C yr-1. (Note: 20 years is the time dependence of the stock change factor, i.e., factor represents annual
rate of change over 20 years)
Organic soils
No refinement.
See guidance in 2013 Supplement to the 2006 IPCC Guidelines for National Greenhouse Gas Inventories:
Wetlands, Chapter 2, Section 2.3.
4.3.3.5 UNCERTAINTY ASSESSMENT
No refinement.
4.4 COMPLETENESS, TIME SERIES, QA/QC, AND
REPORTING AND DOCUMENTATION
4.4.1 Completeness
No refinement.
4.4.2 Developing a consistent time series
It is good practice to develop a consistent time series of inventories of anthropogenic emissions and removals of
greenhouse gases for all AFOLU categories using the guidance in Volume 1, Chapter 5. Because forest-related
activity data and emission factors may only be available every few years, achieving time series consistency may
require interpolation or extrapolation from longer timeseries or trend.
Chapter 4: Forest Land
2019 Refinement to the 2006 IPCC Guidelines for National Greenhouse Gas Inventories 4.15
In addition to the general guidance on gap filling (e.g. on linear interpolation or extrapolation) in Volume 1,
Chapter 5, further guidance is provided here on how to ensure methodological consistency in the case of the Forest
Land category. When extrapolation may allow reflecting the evolution of the main drivers of emissions and
removals during the period to be gap filled, including forest increment and harvest, with a greater level of accuracy
than a linear interpolation or extrapolation.
Generally, these functional relationships are expressed in models which are applied to simulate the dynamics of
carbon stocks in different pools, taking into account a number of interrelated variables.These variables include:
forest characteristics (i.e. forest types, soil types, tree species composition, growing stock, age-class structure) and
management practices (i.e. regeneration modality, rotation lengths, thinning frequency, etc.); the carbon pools and
gases; the estimation parameters for HWP; the treatment of natural disturbances; the possible inclusion of impact
of “indirect human-induced effects” (see Section 2.5), such as human-induced climate and environmental changes
(e.g., temperature, precipitation, CO2 and nitrogen deposition feedbacks) that affect growth, mortality,
decomposition rates and natural disturbances regimes.
Among these, harvest volume is a key driver of emissions and removals. To this regard, if the actual harvest
volume for the period to be extrapolated is known with confidence, then the model may directly apply this harvest
volume, in combination with the other variables above. However, sometimes no reliable statistics on harvest
volume (or other suitable proxies) are available for the period to be gap-filled. In this case, it is good practice to
assume that the historical management practices continue during the period to be gap-filled. These practices should
be those applied (and documented) in the existing time series, e.g. for the “calibration period” (see below). The
functional relationships between available timber stocks, age structure dynamics, the increment and the harvest
volume under the continuation of management practices (which is the basis of yield tables for forest management)
can be used to calculate a consistent time series of annual C stock gains (forest net increment) and annual C stock
losses (e.g. harvest, etc.). For example, if a given tree species is typically harvested at 80 years, the extrapolation
based on functional relationships will apply this harvesting age (i.e. the historical forest management practice) also
in the period to be gap-filled, taking into account the age structure dynamics (e.g. if the forest is getting older,
more area reaching 80 years may be available); the carbon gains will be calculated using the forest net increment
associated with the age structure and harvest volume simulated for the period to be gap-filled. An example of
resolving data gaps in Forest Land through an extrapolation based on functional relationships is provided in Box
4.3b.
It is good practice that the model used for extrapolation utilizes information on the methodological elements above
that is consistent with those used in the rest of the time series.
A change in any of the variables above used in the existing (non-extrapolated) time series (e.g., adding a new
carbon pool) triggers a methodological inconsistency, to be addressed through a re-run, for the entire time series,
of the model used for the extrapolation. Such re-run should ensure consistency in the variables described above.
As a general check for the consistency, it is good practice to demonstrate that the model used for the extrapolation
reproduces the existing time series, for a selected “calibration period”. The length of this calibration period may
depend on various factors, but it is preferable to have at least 5 or 10 years of comparison between the model’s
results and the existing time series. If the model results for the calibration period fall within the estimated range of
uncertainty of the existing time series (as documented in the GHG inventory), any remaining discontinuity between
the existing time series and the portion extrapolated may be addressed through the application of the “overlap”
technique (Volume 1, Chapter 5.3.3.1) to extrapolated data. This procedure will affect the level of modelled GHG
estimates, but not their trend. If, for the calibration period, the model’s results do not fall within the reported range
of uncertainty of the existing time series, it is not good practice to use these results for extrapolating the time series.
An example of resolving forest data gaps through extrapolation based on functional relationships is provided in
Box 4.3b
Volume 4: Agriculture, Forestry and Other Land Use
4.16 2019 Refinement to the 2006 IPCC Guidelines for National Greenhouse Gas Inventories
BOX 4.3B (NEW)
EXAMPLE OF RESOLVING FOREST DATA GAPS THROUGH EXTRAPOLATION BASED ON FUNCTIONAL
RELATIONSHIPS
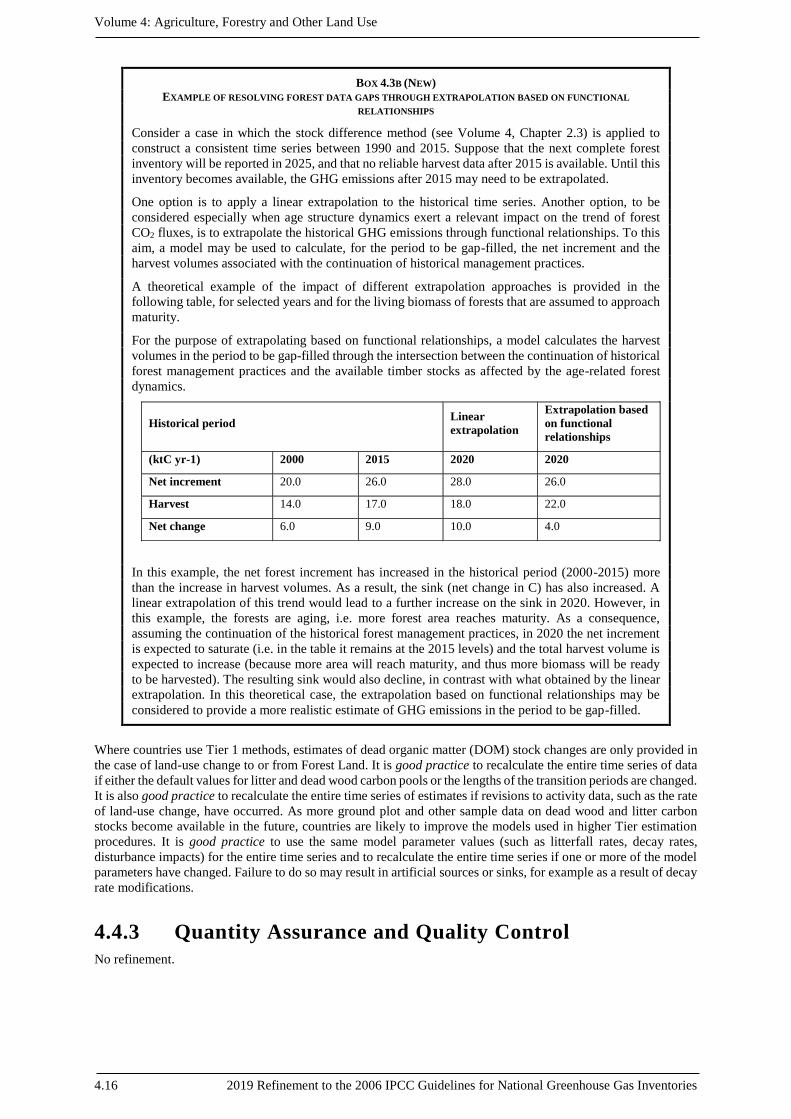
Consider a case in which the stock difference method (see Volume 4, Chapter 2.3) is applied to
construct a consistent time series between 1990 and 2015. Suppose that the next complete forest
inventory will be reported in 2025, and that no reliable harvest data after 2015 is available. Until this
inventory becomes available, the GHG emissions after 2015 may need to be extrapolated.
One option is to apply a linear extrapolation to the historical time series. Another option, to be
considered especially when age structure dynamics exert a relevant impact on the trend of forest
CO2 fluxes, is to extrapolate the historical GHG emissions through functional relationships. To this
aim, a model may be used to calculate, for the period to be gap-filled, the net increment and the
harvest volumes associated with the continuation of historical management practices.
A theoretical example of the impact of different extrapolation approaches is provided in the
following table, for selected years and for the living biomass of forests that are assumed to approach
maturity.
For the purpose of extrapolating based on functional relationships, a model calculates the harvest
volumes in the period to be gap-filled through the intersection between the continuation of historical
forest management practices and the available timber stocks as affected by the age-related forest
dynamics.
Historical period Linear
extrapolation
Extrapolation based
on functional
relationships
(ktC yr-1) 2000 2015 2020 2020
Net increment 20.0 26.0 28.0 26.0
Harvest 14.0 17.0 18.0 22.0
Net change 6.0 9.0 10.0 4.0
In this example, the net forest increment has increased in the historical period (2000-2015) more
than the increase in harvest volumes. As a result, the sink (net change in C) has also increased. A
linear extrapolation of this trend would lead to a further increase on the sink in 2020. However, in
this example, the forests are aging, i.e. more forest area reaches maturity. As a consequence,
assuming the continuation of the historical forest management practices, in 2020 the net increment
is expected to saturate (i.e. in the table it remains at the 2015 levels) and the total harvest volume is
expected to increase (because more area will reach maturity, and thus more biomass will be ready
to be harvested). The resulting sink would also decline, in contrast with what obtained by the linear
extrapolation. In this theoretical case, the extrapolation based on functional relationships may be
considered to provide a more realistic estimate of GHG emissions in the period to be gap-filled.
Where countries use Tier 1 methods, estimates of dead organic matter (DOM) stock changes are only provided in
the case of land-use change to or from Forest Land. It is good practice to recalculate the entire time series of data
if either the default values for litter and dead wood carbon pools or the lengths of the transition periods are changed.
It is also good practice to recalculate the entire time series of estimates if revisions to activity data, such as the rate
of land-use change, have occurred. As more ground plot and other sample data on dead wood and litter carbon
stocks become available in the future, countries are likely to improve the models used in higher Tier estimation
procedures. It is good practice to use the same model parameter values (such as litterfall rates, decay rates,
disturbance impacts) for the entire time series and to recalculate the entire time series if one or more of the model
parameters have changed. Failure to do so may result in artificial sources or sinks, for example as a result of decay
rate modifications.
4.4.3 Quantity Assurance and Quality Control
No refinement.
Chapter 4: Forest Land
2019 Refinement to the 2006 IPCC Guidelines for National Greenhouse Gas Inventories 4.17
4.4.4 Reporting and Documentation
No refinement.
4.5 TABLES
Table 4.1
No refinement.
Table 4.2
No refinement.
Table 4.3
No refinement.
Volume 4: Agriculture, Forestry and Other Land Use
4.18 2019 Refinement to the 2006 IPCC Guidelines for National Greenhouse Gas Inventories
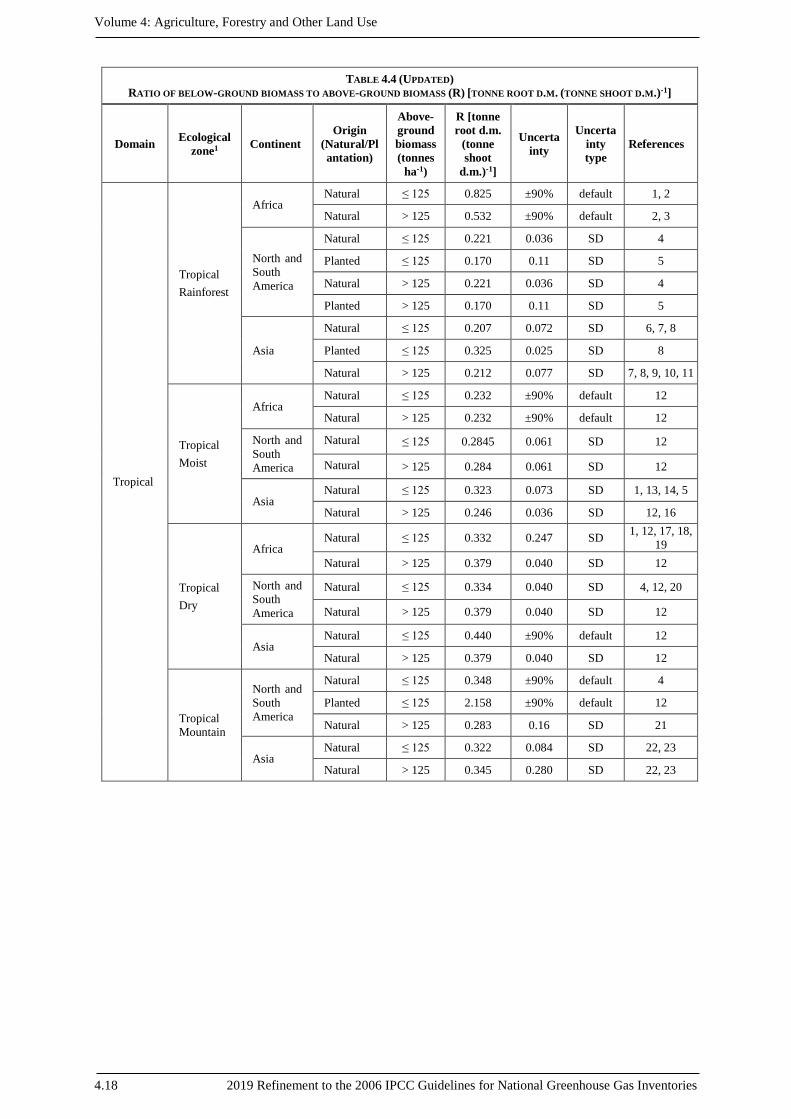
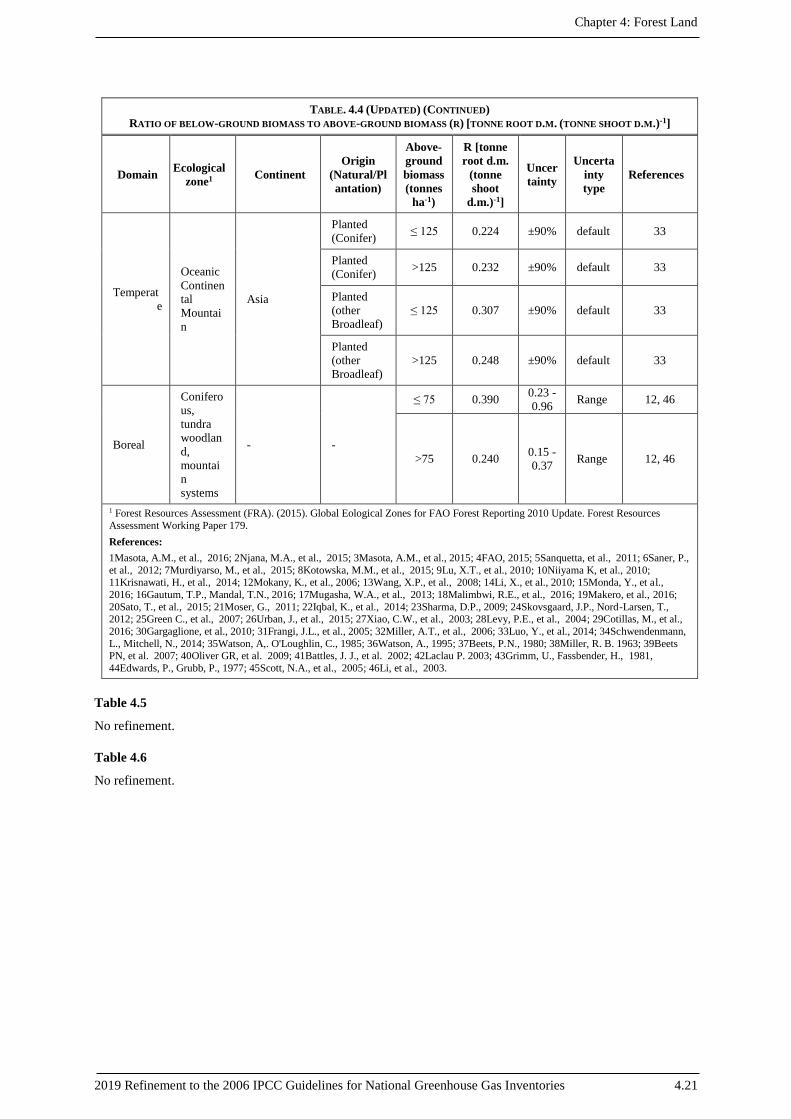
TABLE 4.4 (UPDATED)
RATIO OF BELOW-GROUND BIOMASS TO ABOVE-GROUND BIOMASS (R) [TONNE ROOT D.M. (TONNE SHOOT D.M.)-1]
Domain Ecological
zone1 Continent
Origin
(Natural/Pl
antation)
Above-
ground
biomass
(tonnes
ha-1)
R [tonne
root d.m.
(tonne
shoot
d.m.)-1]
Uncerta
inty
Uncerta
inty
type
References
Tropical
Tropical
Rainforest
Africa Natural ≤ 125 0.825 ±90% default 1, 2
Natural > 125 0.532 ±90% default 2, 3
North and
South
America
Natural ≤ 125 0.221 0.036 SD 4
Planted ≤ 125 0.170 0.11 SD 5
Natural > 125 0.221 0.036 SD 4
Planted > 125 0.170 0.11 SD 5
Asia
Natural ≤ 125 0.207 0.072 SD 6, 7, 8
Planted ≤ 125 0.325 0.025 SD 8
Natural > 125 0.212 0.077 SD 7, 8, 9, 10, 11
Tropical
Moist
Africa Natural ≤ 125 0.232 ±90% default 12
Natural > 125 0.232 ±90% default 12
North and
South
America
Natural ≤ 125 0.2845 0.061 SD 12
Natural > 125 0.284 0.061 SD 12
Asia Natural ≤ 125 0.323 0.073 SD 1, 13, 14, 5
Natural > 125 0.246 0.036 SD 12, 16
Tropical
Dry
Africa Natural ≤ 125 0.332 0.247 SD
1, 12, 17, 18,
19
Natural > 125 0.379 0.040 SD 12
North and
South
America
Natural ≤ 125 0.334 0.040 SD 4, 12, 20
Natural > 125 0.379 0.040 SD 12
Asia Natural ≤ 125 0.440 ±90% default 12
Natural > 125 0.379 0.040 SD 12
Tropical
Mountain
North and
South
America
Natural ≤ 125 0.348 ±90% default 4
Planted ≤ 125 2.158 ±90% default 12
Natural > 125 0.283 0.16 SD 21
Asia Natural ≤ 125 0.322 0.084 SD 22, 23
Natural > 125 0.345 0.280 SD 22, 23
Chapter 4: Forest Land
2019 Refinement to the 2006 IPCC Guidelines for National Greenhouse Gas Inventories 4.19
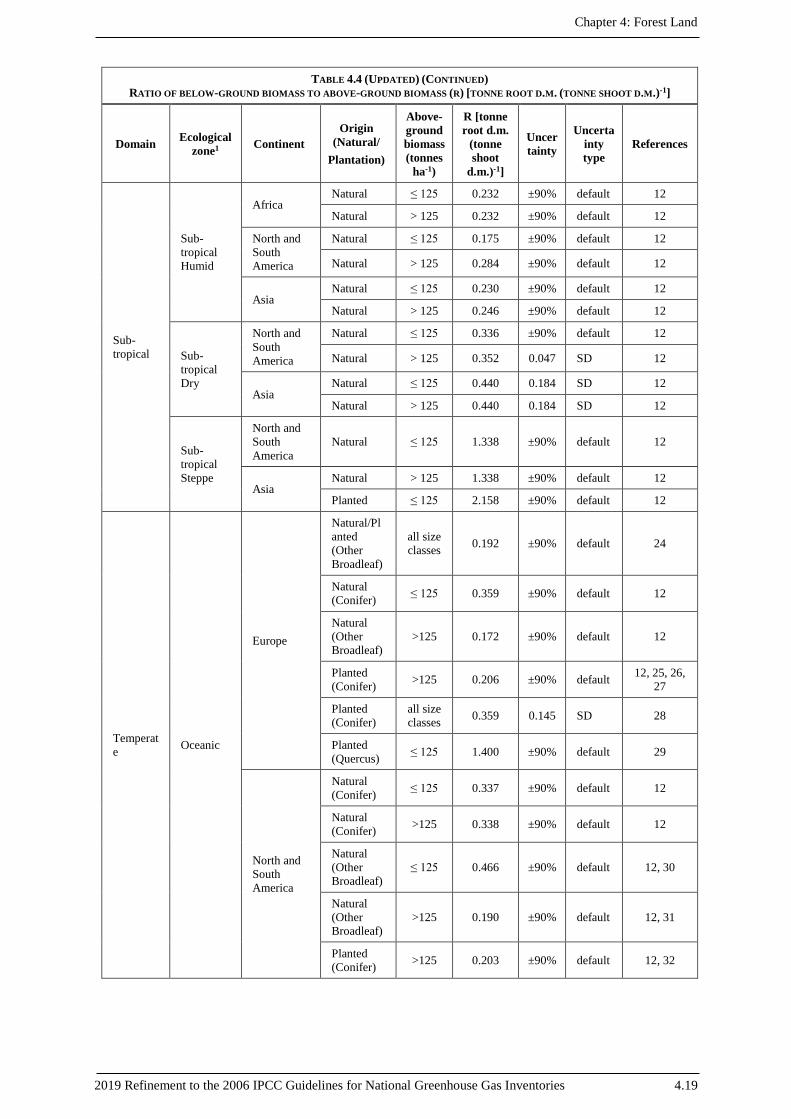
TABLE 4.4 (UPDATED) (CONTINUED)
RATIO OF BELOW-GROUND BIOMASS TO ABOVE-GROUND BIOMASS (R) [TONNE ROOT D.M. (TONNE SHOOT D.M.)-1]
Domain Ecological
zone1 Continent
Origin
(Natural/
Plantation)
Above-
ground
biomass
(tonnes
ha-1)
R [tonne
root d.m.
(tonne
shoot
d.m.)-1]
Uncer
tainty
Uncerta
inty
type
References
Sub-
tropical
Sub-
tropical
Humid
Africa Natural ≤ 125 0.232 ±90% default 12
Natural > 125 0.232 ±90% default 12
North and
South
America
Natural ≤ 125 0.175 ±90% default 12
Natural > 125 0.284 ±90% default 12
Asia Natural ≤ 125 0.230 ±90% default 12
Natural > 125 0.246 ±90% default 12
Sub-
tropical
Dry
North and
South
America
Natural ≤ 125 0.336 ±90% default 12
Natural > 125 0.352 0.047 SD 12
Asia Natural ≤ 125 0.440 0.184 SD 12
Natural > 125 0.440 0.184 SD 12
Sub-
tropical
Steppe
North and
South
America
Natural ≤ 125 1.338 ±90% default 12
Asia Natural > 125 1.338 ±90% default 12
Planted ≤ 125 2.158 ±90% default 12
Temperat
e Oceanic
Europe
Natural/Pl
anted
(Other
Broadleaf)
all size
classes 0.192 ±90% default 24
Natural
(Conifer) ≤ 125 0.359 ±90% default 12
Natural
(Other
Broadleaf)
>125 0.172 ±90% default 12
Planted
(Conifer) >125 0.206 ±90% default
12, 25, 26,
27
Planted
(Conifer)
all size
classes 0.359 0.145 SD 28
Planted
(Quercus) ≤ 125 1.400 ±90% default 29
North and
South
America
Natural
(Conifer) ≤ 125 0.337 ±90% default 12
Natural
(Conifer) >125 0.338 ±90% default 12
Natural
(Other
Broadleaf) ≤ 125 0.466 ±90% default 12, 30
Natural
(Other
Broadleaf) >125 0.190 ±90% default 12, 31
Planted
(Conifer) >125 0.203 ±90% default 12, 32
Volume 4: Agriculture, Forestry and Other Land Use
4.20 2019 Refinement to the 2006 IPCC Guidelines for National Greenhouse Gas Inventories
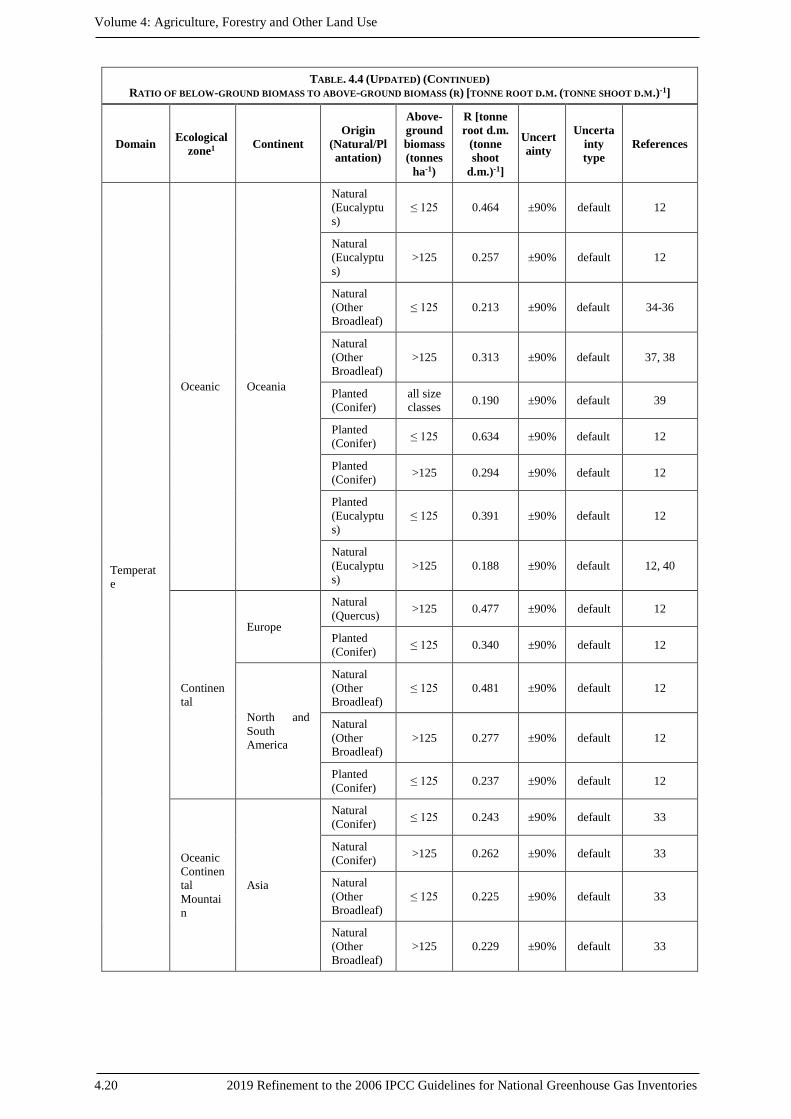
TABLE. 4.4 (UPDATED) (CONTINUED)
RATIO OF BELOW-GROUND BIOMASS TO ABOVE-GROUND BIOMASS (R) [TONNE ROOT D.M. (TONNE SHOOT D.M.)-1]
Domain Ecological
zone1 Continent
Origin
(Natural/Pl
antation)
Above-
ground
biomass
(tonnes
ha-1)
R [tonne
root d.m.
(tonne
shoot
d.m.)-1]
Uncert
ainty
Uncerta
inty
type
References
Temperat
e
Oceanic Oceania
Natural
(Eucalyptu
s)
≤ 125 0.464 ±90% default 12
Natural
(Eucalyptu
s)
>125 0.257 ±90% default 12
Natural
(Other
Broadleaf)
≤ 125 0.213 ±90% default 34-36
Natural
(Other
Broadleaf)
>125 0.313 ±90% default 37, 38
Planted
(Conifer)
all size
classes 0.190 ±90% default 39
Planted
(Conifer) ≤ 125 0.634 ±90% default 12
Planted
(Conifer) >125 0.294 ±90% default 12
Planted
(Eucalyptu
s)
≤ 125 0.391 ±90% default 12
Natural
(Eucalyptu
s)
>125 0.188 ±90% default 12, 40
Continen
tal
Europe
Natural
(Quercus) >125 0.477 ±90% default 12
Planted
(Conifer) ≤ 125 0.340 ±90% default 12
North and
South
America
Natural
(Other
Broadleaf)
≤ 125 0.481 ±90% default 12
Natural
(Other
Broadleaf)
>125 0.277 ±90% default 12
Planted
(Conifer) ≤ 125 0.237 ±90% default 12
Oceanic
Continen
tal
Mountai
n
Asia
Natural
(Conifer) ≤ 125 0.243 ±90% default 33
Natural
(Conifer) >125 0.262 ±90% default 33
Natural
(Other
Broadleaf) ≤ 125 0.225 ±90% default 33
Natural
(Other
Broadleaf) >125 0.229 ±90% default 33
Chapter 4: Forest Land
2019 Refinement to the 2006 IPCC Guidelines for National Greenhouse Gas Inventories 4.21
TABLE. 4.4 (UPDATED) (CONTINUED)
RATIO OF BELOW-GROUND BIOMASS TO ABOVE-GROUND BIOMASS (R) [TONNE ROOT D.M. (TONNE SHOOT D.M.)-1]
Domain Ecological
zone1 Continent
Origin
(Natural/Pl
antation)
Above-
ground
biomass
(tonnes
ha-1)
R [tonne
root d.m.
(tonne
shoot
d.m.)-1]
Uncer
tainty
Uncerta
inty
type
References
Temperat
e
Oceanic
Continen
tal
Mountai
n
Asia
Planted
(Conifer) ≤ 125 0.224 ±90% default 33
Planted
(Conifer) >125 0.232 ±90% default 33
Planted
(other
Broadleaf)
≤ 125 0.307 ±90% default 33
Planted
(other
Broadleaf)
>125 0.248 ±90% default 33
Boreal
Conifero
us,
tundra
woodlan
d,
mountai
n
systems
- -
≤ 75 0.390 0.23 -
0.96 Range 12, 46
>75 0.240 0.15 -
0.37 Range 12, 46
1 Forest Resources Assessment (FRA). (2015). Global Eological Zones for FAO Forest Reporting 2010 Update. Forest Resources
Assessment Working Paper 179.
References:
1Masota, A.M., et al., 2016; 2Njana, M.A., et al., 2015; 3Masota, A.M., et al., 2015; 4FAO, 2015; 5Sanquetta, et al., 2011; 6Saner, P.,
et al., 2012; 7Murdiyarso, M., et al., 2015; 8Kotowska, M.M., et al., 2015; 9Lu, X.T., et al., 2010; 10Niiyama K, et al., 2010;
11Krisnawati, H., et al., 2014; 12Mokany, K., et al., 2006; 13Wang, X.P., et al., 2008; 14Li, X., et al., 2010; 15Monda, Y., et al.,
2016; 16Gautum, T.P., Mandal, T.N., 2016; 17Mugasha, W.A., et al., 2013; 18Malimbwi, R.E., et al., 2016; 19Makero, et al., 2016;
20Sato, T., et al., 2015; 21Moser, G., 2011; 22Iqbal, K., et al., 2014; 23Sharma, D.P., 2009; 24Skovsgaard, J.P., Nord-Larsen, T., 2012; 25Green C., et al., 2007; 26Urban, J., et al., 2015; 27Xiao, C.W., et al., 2003; 28Levy, P.E., et al., 2004; 29Cotillas, M., et al.,
2016; 30Gargaglione, et al., 2010; 31Frangi, J.L., et al., 2005; 32Miller, A.T., et al., 2006; 33Luo, Y., et al., 2014; 34Schwendenmann,
L., Mitchell, N., 2014; 35Watson, A,. O'Loughlin, C., 1985; 36Watson, A., 1995; 37Beets, P.N., 1980; 38Miller, R. B. 1963; 39Beets PN, et al. 2007; 40Oliver GR, et al. 2009; 41Battles, J. J., et al. 2002; 42Laclau P. 2003; 43Grimm, U., Fassbender, H., 1981,
44Edwards, P., Grubb, P., 1977; 45Scott, N.A., et al., 2005; 46Li, et al., 2003.
Table 4.5
No refinement.
Table 4.6
No refinement.
Volume 4: Agriculture, Forestry and Other Land Use
4.22 2019 Refinement to the 2006 IPCC Guidelines for National Greenhouse Gas Inventories
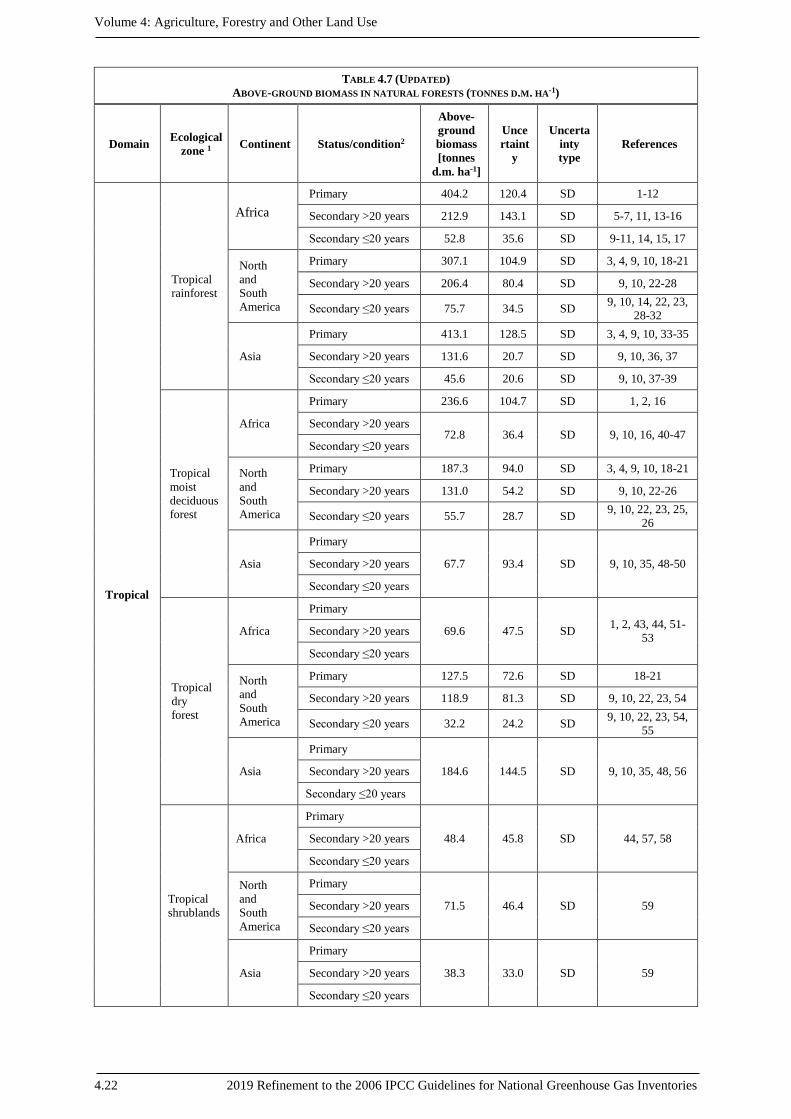
TABLE 4.7 (UPDATED)
ABOVE-GROUND BIOMASS IN NATURAL FORESTS (TONNES D.M. HA-1)
Domain Ecological
zone 1 Continent Status/condition2
Above-
ground biomass
[tonnes
d.m. ha-1]
Unce
rtaint
y
Uncerta
inty
type
References
Tropical
Tropical
rainforest
Africa
Primary 404.2 120.4 SD 1-12
Secondary >20 years 212.9 143.1 SD 5-7, 11, 13-16
Secondary ≤20 years 52.8 35.6 SD 9-11, 14, 15, 17
North
and
South
America
Primary 307.1 104.9 SD 3, 4, 9, 10, 18-21
Secondary >20 years 206.4 80.4 SD 9, 10, 22-28
Secondary ≤20 years 75.7 34.5 SD 9, 10, 14, 22, 23,
28-32
Asia
Primary 413.1 128.5 SD 3, 4, 9, 10, 33-35
Secondary >20 years 131.6 20.7 SD 9, 10, 36, 37
Secondary ≤20 years 45.6 20.6 SD 9, 10, 37-39
Tropical
moist
deciduous
forest
Africa
Primary 236.6 104.7 SD 1, 2, 16
Secondary >20 years 72.8 36.4 SD 9, 10, 16, 40-47
Secondary ≤20 years
North
and
South
America
Primary 187.3 94.0 SD 3, 4, 9, 10, 18-21
Secondary >20 years 131.0 54.2 SD 9, 10, 22-26
Secondary ≤20 years 55.7 28.7 SD 9, 10, 22, 23, 25,
26
Asia
Primary
67.7 93.4 SD 9, 10, 35, 48-50 Secondary >20 years
Secondary ≤20 years
Tropical
dry
forest
Africa
Primary
69.6 47.5 SD 1, 2, 43, 44, 51-
53 Secondary >20 years
Secondary ≤20 years
North
and
South
America
Primary 127.5 72.6 SD 18-21
Secondary >20 years 118.9 81.3 SD 9, 10, 22, 23, 54
Secondary ≤20 years 32.2 24.2 SD 9, 10, 22, 23, 54,
55
Asia
Primary
184.6 144.5 SD 9, 10, 35, 48, 56 Secondary >20 years
Secondary ≤20 years
Tropical
shrublands
Africa
Primary
48.4 45.8 SD 44, 57, 58 Secondary >20 years
Secondary ≤20 years
North
and
South
America
Primary
71.5 46.4 SD 59 Secondary >20 years
Secondary ≤20 years
Asia
Primary
38.3 33.0 SD 59 Secondary >20 years
Secondary ≤20 years
Chapter 4: Forest Land
2019 Refinement to the 2006 IPCC Guidelines for National Greenhouse Gas Inventories 4.23
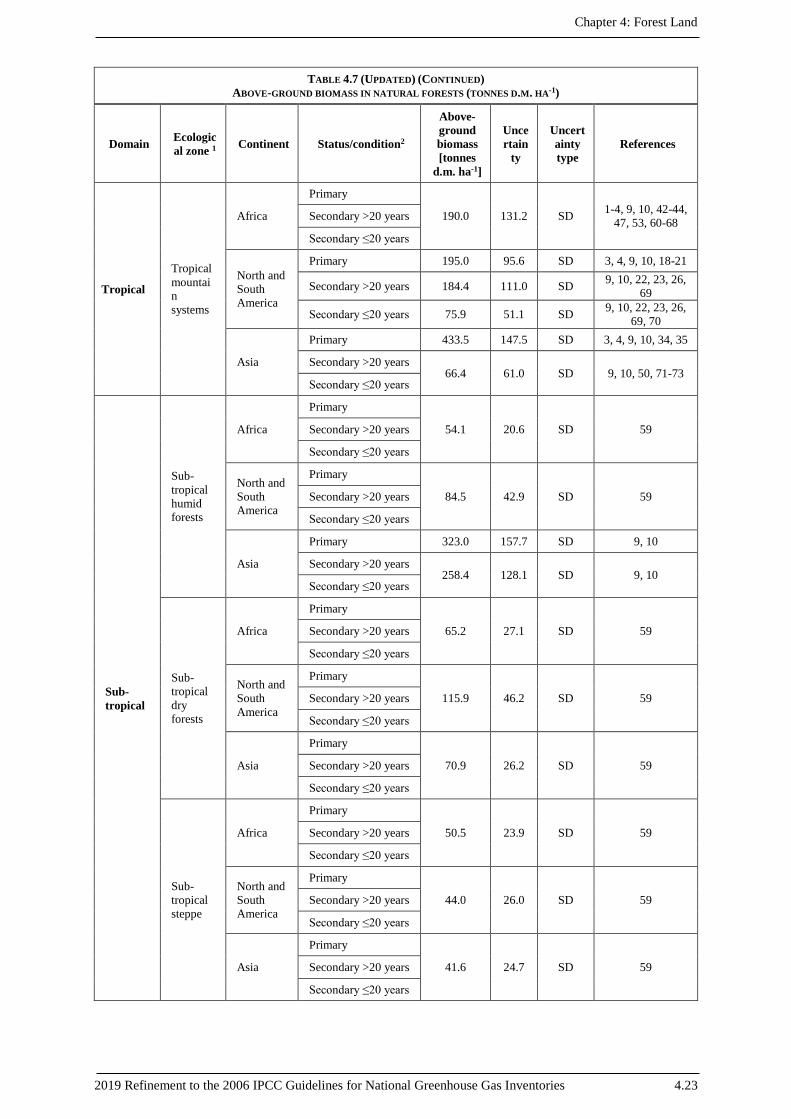
TABLE 4.7 (UPDATED) (CONTINUED)
ABOVE-GROUND BIOMASS IN NATURAL FORESTS (TONNES D.M. HA-1)
Domain Ecologic
al zone 1 Continent Status/condition2
Above-
ground biomass
[tonnes
d.m. ha-1]
Unce
rtain
ty
Uncert
ainty
type
References
Tropical
Tropical
mountai
n
systems
Africa
Primary
190.0 131.2 SD 1-4, 9, 10, 42-44,
47, 53, 60-68 Secondary >20 years
Secondary ≤20 years
North and
South
America
Primary 195.0 95.6 SD 3, 4, 9, 10, 18-21
Secondary >20 years 184.4 111.0 SD 9, 10, 22, 23, 26,
69
Secondary ≤20 years 75.9 51.1 SD 9, 10, 22, 23, 26,
69, 70
Asia
Primary 433.5 147.5 SD 3, 4, 9, 10, 34, 35
Secondary >20 years 66.4 61.0 SD 9, 10, 50, 71-73
Secondary ≤20 years
Sub-
tropical
Sub-
tropical
humid
forests
Africa
Primary
54.1 20.6 SD 59 Secondary >20 years
Secondary ≤20 years
North and
South
America
Primary
84.5 42.9 SD 59 Secondary >20 years
Secondary ≤20 years
Asia
Primary 323.0 157.7 SD 9, 10
Secondary >20 years 258.4 128.1 SD 9, 10
Secondary ≤20 years
Sub-
tropical
dry
forests
Africa
Primary
65.2 27.1 SD 59 Secondary >20 years
Secondary ≤20 years
North and
South
America
Primary
115.9 46.2 SD 59 Secondary >20 years
Secondary ≤20 years
Asia
Primary
70.9 26.2 SD 59 Secondary >20 years
Secondary ≤20 years
Sub-
tropical
steppe
Africa
Primary
50.5 23.9 SD 59 Secondary >20 years
Secondary ≤20 years
North and
South
America
Primary
44.0 26.0 SD 59 Secondary >20 years
Secondary ≤20 years
Asia
Primary
41.6 24.7 SD 59 Secondary >20 years
Secondary ≤20 years
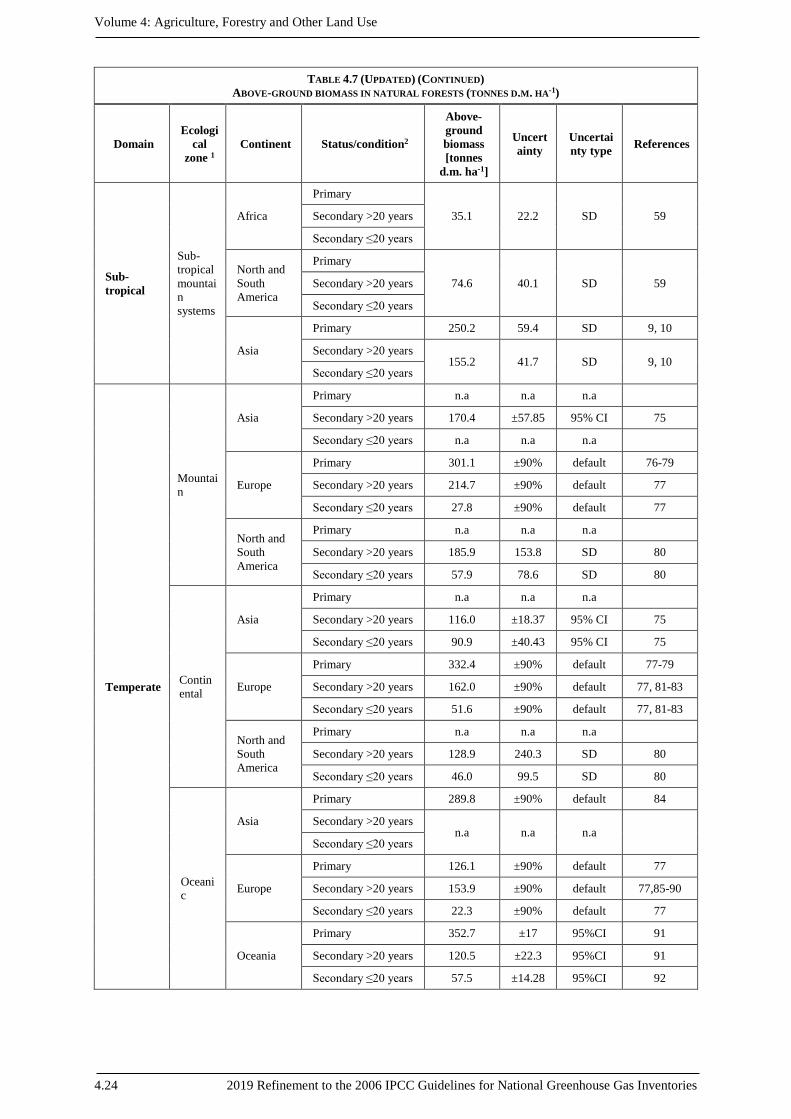
Volume 4: Agriculture, Forestry and Other Land Use
4.24 2019 Refinement to the 2006 IPCC Guidelines for National Greenhouse Gas Inventories
TABLE 4.7 (UPDATED) (CONTINUED)
ABOVE-GROUND BIOMASS IN NATURAL FORESTS (TONNES D.M. HA-1)
Domain
Ecologi
cal
zone 1
Continent Status/condition2
Above-
ground
biomass
[tonnes
d.m. ha-1]
Uncert
ainty
Uncertai
nty type References
Sub-
tropical
Sub-
tropical
mountai
n
systems
Africa
Primary
35.1 22.2 SD 59 Secondary >20 years
Secondary ≤20 years
North and
South
America
Primary
74.6 40.1 SD 59 Secondary >20 years
Secondary ≤20 years
Asia
Primary 250.2 59.4 SD 9, 10
Secondary >20 years 155.2 41.7 SD 9, 10
Secondary ≤20 years
Temperate
Mountai
n
Asia
Primary n.a n.a n.a
Secondary >20 years 170.4 ±57.85 95% CI 75
Secondary ≤20 years n.a n.a n.a
Europe
Primary 301.1 ±90% default 76-79
Secondary >20 years 214.7 ±90% default 77
Secondary ≤20 years 27.8 ±90% default 77
North and
South
America
Primary n.a n.a n.a
Secondary >20 years 185.9 153.8 SD 80
Secondary ≤20 years 57.9 78.6 SD 80
Contin
ental
Asia
Primary n.a n.a n.a
Secondary >20 years 116.0 ±18.37 95% CI 75
Secondary ≤20 years 90.9 ±40.43 95% CI 75
Europe
Primary 332.4 ±90% default 77-79
Secondary >20 years 162.0 ±90% default 77, 81-83
Secondary ≤20 years 51.6 ±90% default 77, 81-83
North and
South
America
Primary n.a n.a n.a
Secondary >20 years 128.9 240.3 SD 80
Secondary ≤20 years 46.0 99.5 SD 80
Oceani
c
Asia
Primary 289.8 ±90% default 84
Secondary >20 years n.a n.a n.a
Secondary ≤20 years
Europe
Primary 126.1 ±90% default 77
Secondary >20 years 153.9 ±90% default 77,85-90
Secondary ≤20 years 22.3 ±90% default 77
Oceania
Primary 352.7 ±17 95%CI 91
Secondary >20 years 120.5 ±22.3 95%CI 91
Secondary ≤20 years 57.5 ±14.28 95%CI 92
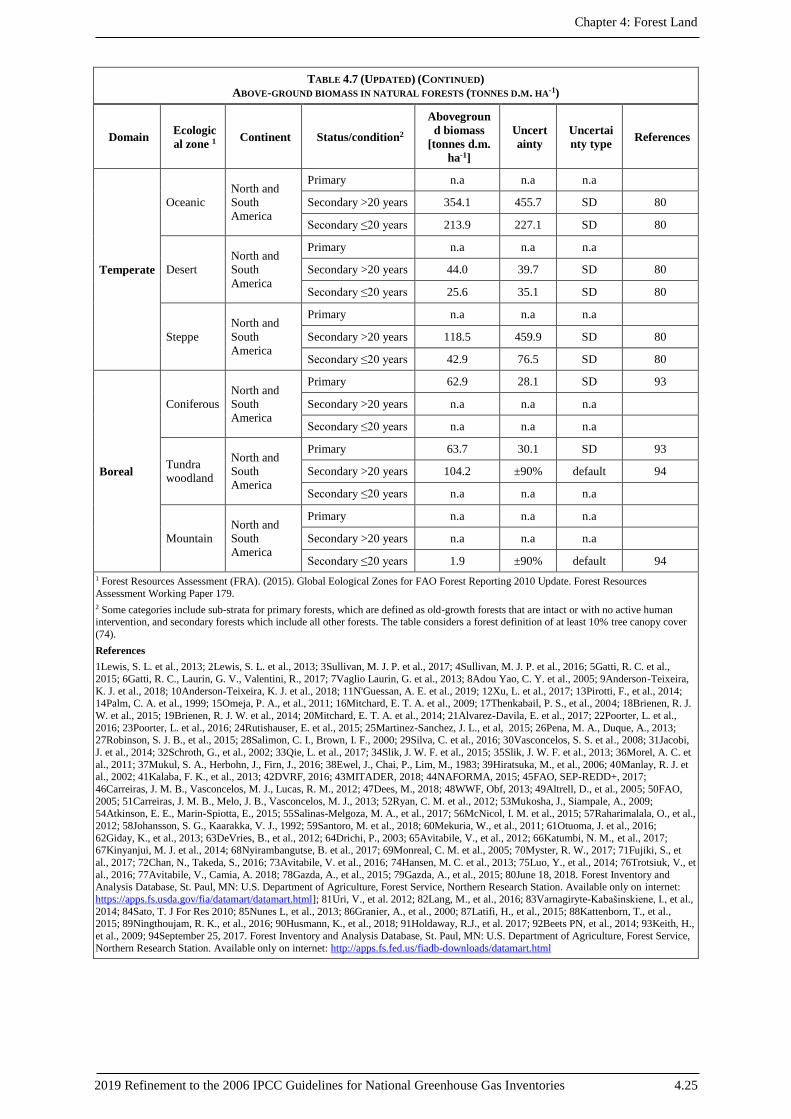
Chapter 4: Forest Land
2019 Refinement to the 2006 IPCC Guidelines for National Greenhouse Gas Inventories 4.25
TABLE 4.7 (UPDATED) (CONTINUED)
ABOVE-GROUND BIOMASS IN NATURAL FORESTS (TONNES D.M. HA-1)
Domain Ecologic
al zone 1 Continent Status/condition2
Abovegroun
d biomass
[tonnes d.m.
ha-1]
Uncert
ainty
Uncertai
nty type References
Temperate
Oceanic
North and
South
America
Primary n.a n.a n.a
Secondary >20 years 354.1 455.7 SD 80
Secondary ≤20 years 213.9 227.1 SD 80
Desert
North and
South
America
Primary n.a n.a n.a
Secondary >20 years 44.0 39.7 SD 80
Secondary ≤20 years 25.6 35.1 SD 80
Steppe
North and
South
America
Primary n.a n.a n.a
Secondary >20 years 118.5 459.9 SD 80
Secondary ≤20 years 42.9 76.5 SD 80
Boreal
Coniferous
North and
South
America
Primary 62.9 28.1 SD 93
Secondary >20 years n.a n.a n.a
Secondary ≤20 years n.a n.a n.a
Tundra
woodland
North and
South
America
Primary 63.7 30.1 SD 93
Secondary >20 years 104.2 ±90% default 94
Secondary ≤20 years n.a n.a n.a
Mountain
North and
South
America
Primary n.a n.a n.a
Secondary >20 years n.a n.a n.a
Secondary ≤20 years 1.9 ±90% default 94
1 Forest Resources Assessment (FRA). (2015). Global Eological Zones for FAO Forest Reporting 2010 Update. Forest Resources
Assessment Working Paper 179.
2 Some categories include sub-strata for primary forests, which are defined as old-growth forests that are intact or with no active human intervention, and secondary forests which include all other forests. The table considers a forest definition of at least 10% tree canopy cover
(74).
References
1Lewis, S. L. et al., 2013; 2Lewis, S. L. et al., 2013; 3Sullivan, M. J. P. et al., 2017; 4Sullivan, M. J. P. et al., 2016; 5Gatti, R. C. et al.,
2015; 6Gatti, R. C., Laurin, G. V., Valentini, R., 2017; 7Vaglio Laurin, G. et al., 2013; 8Adou Yao, C. Y. et al., 2005; 9Anderson-Teixeira,
K. J. et al., 2018; 10Anderson-Teixeira, K. J. et al., 2018; 11N'Guessan, A. E. et al., 2019; 12Xu, L. et al., 2017; 13Pirotti, F., et al., 2014; 14Palm, C. A. et al., 1999; 15Omeja, P. A., et al., 2011; 16Mitchard, E. T. A. et al., 2009; 17Thenkabail, P. S., et al., 2004; 18Brienen, R. J.
W. et al., 2015; 19Brienen, R. J. W. et al., 2014; 20Mitchard, E. T. A. et al., 2014; 21Alvarez-Davila, E. et al., 2017; 22Poorter, L. et al.,
2016; 23Poorter, L. et al., 2016; 24Rutishauser, E. et al., 2015; 25Martinez-Sanchez, J. L., et al, 2015; 26Pena, M. A., Duque, A., 2013; 27Robinson, S. J. B., et al., 2015; 28Salimon, C. I., Brown, I. F., 2000; 29Silva, C. et al., 2016; 30Vasconcelos, S. S. et al., 2008; 31Jacobi,
J. et al., 2014; 32Schroth, G., et al., 2002; 33Qie, L. et al., 2017; 34Slik, J. W. F. et al., 2015; 35Slik, J. W. F. et al., 2013; 36Morel, A. C. et
al., 2011; 37Mukul, S. A., Herbohn, J., Firn, J., 2016; 38Ewel, J., Chai, P., Lim, M., 1983; 39Hiratsuka, M., et al., 2006; 40Manlay, R. J. et al., 2002; 41Kalaba, F. K., et al., 2013; 42DVRF, 2016; 43MITADER, 2018; 44NAFORMA, 2015; 45FAO, SEP-REDD+, 2017;
46Carreiras, J. M. B., Vasconcelos, M. J., Lucas, R. M., 2012; 47Dees, M., 2018; 48WWF, Obf, 2013; 49Altrell, D., et al., 2005; 50FAO,
2005; 51Carreiras, J. M. B., Melo, J. B., Vasconcelos, M. J., 2013; 52Ryan, C. M. et al., 2012; 53Mukosha, J., Siampale, A., 2009;
54Atkinson, E. E., Marin-Spiotta, E., 2015; 55Salinas-Melgoza, M. A., et al., 2017; 56McNicol, I. M. et al., 2015; 57Raharimalala, O., et al.,
2012; 58Johansson, S. G., Kaarakka, V. J., 1992; 59Santoro, M. et al., 2018; 60Mekuria, W., et al., 2011; 61Otuoma, J. et al., 2016;
62Giday, K., et al., 2013; 63DeVries, B., et al., 2012; 64Drichi, P., 2003; 65Avitabile, V., et al., 2012; 66Katumbi, N. M., et al., 2017; 67Kinyanjui, M. J. et al., 2014; 68Nyirambangutse, B. et al., 2017; 69Monreal, C. M. et al., 2005; 70Myster, R. W., 2017; 71Fujiki, S., et
al., 2017; 72Chan, N., Takeda, S., 2016; 73Avitabile, V. et al., 2016; 74Hansen, M. C. et al., 2013; 75Luo, Y., et al., 2014; 76Trotsiuk, V., et
al., 2016; 77Avitabile, V., Camia, A. 2018; 78Gazda, A., et al., 2015; 79Gazda, A., et al., 2015; 80June 18, 2018. Forest Inventory and Analysis Database, St. Paul, MN: U.S. Department of Agriculture, Forest Service, Northern Research Station. Available only on internet:
https://apps.fs.usda.gov/fia/datamart/datamart.html]; 81Uri, V., et al. 2012; 82Lang, M., et al., 2016; 83Varnagiryte-Kabašinskiene, I., et al.,
2014; 84Sato, T. J For Res 2010; 85Nunes L, et al., 2013; 86Granier, A., et al., 2000; 87Latifi, H., et al., 2015; 88Kattenborn, T., et al., 2015; 89Ningthoujam, R. K., et al., 2016; 90Husmann, K., et al., 2018; 91Holdaway, R.J., et al. 2017; 92Beets PN, et al., 2014; 93Keith, H.,
et al., 2009; 94September 25, 2017. Forest Inventory and Analysis Database, St. Paul, MN: U.S. Department of Agriculture, Forest Service,
Northern Research Station. Available only on internet: http://apps.fs.fed.us/fiadb-downloads/datamart.html
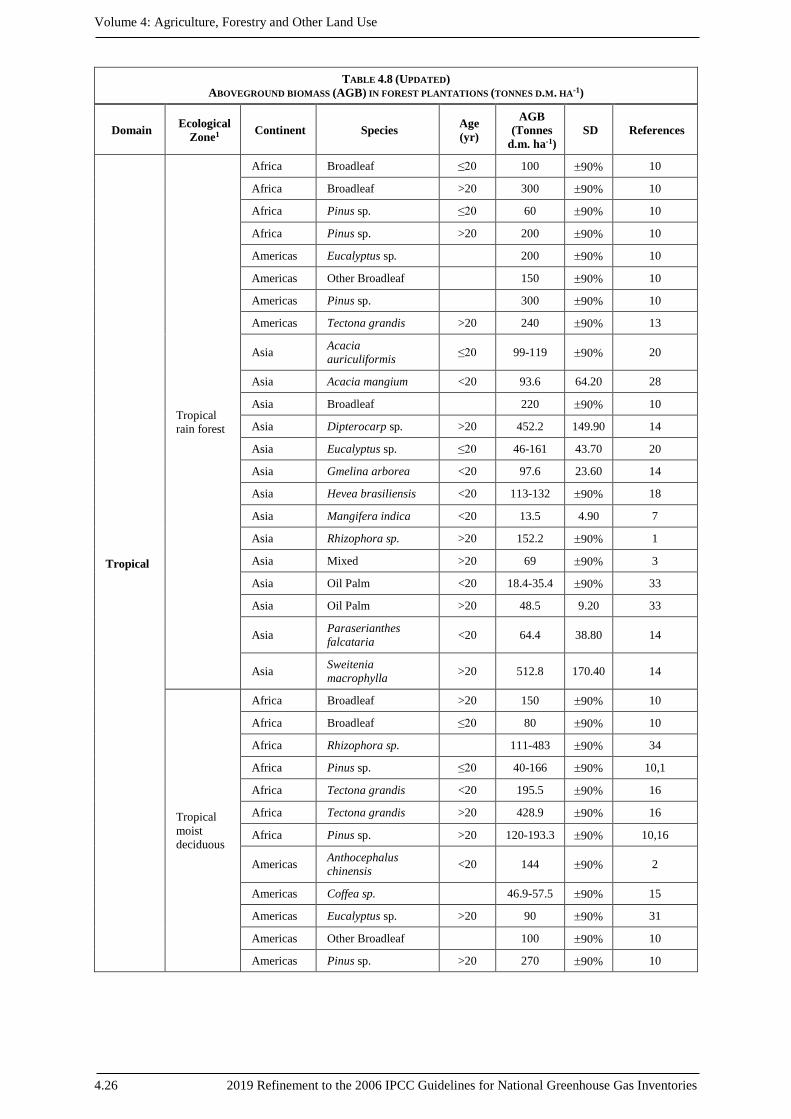
Volume 4: Agriculture, Forestry and Other Land Use
4.26 2019 Refinement to the 2006 IPCC Guidelines for National Greenhouse Gas Inventories
TABLE 4.8 (UPDATED)
ABOVEGROUND BIOMASS (AGB) IN FOREST PLANTATIONS (TONNES D.M. HA-1)
Domain Ecological
Zone1 Continent Species Age
(yr)
AGB
(Tonnes
d.m. ha-1)
SD References
Tropical
Tropical
rain forest
Africa Broadleaf ≤20 100 90% 10
Africa Broadleaf >20 300 90% 10
Africa Pinus sp. ≤20 60 90% 10
Africa Pinus sp. >20 200 90% 10
Americas Eucalyptus sp. 200 90% 10
Americas Other Broadleaf 150 90% 10
Americas Pinus sp. 300 90% 10
Americas Tectona grandis >20 240 90% 13
Asia Acacia
auriculiformis ≤20 99-119 90% 20
Asia Acacia mangium <20 93.6 64.20 28
Asia Broadleaf 220 90% 10
Asia Dipterocarp sp. >20 452.2 149.90 14
Asia Eucalyptus sp. ≤20 46-161 43.70 20
Asia Gmelina arborea <20 97.6 23.60 14
Asia Hevea brasiliensis <20 113-132 90% 18
Asia Mangifera indica <20 13.5 4.90 7
Asia Rhizophora sp. >20 152.2 90% 1
Asia Mixed >20 69 90% 3
Asia Oil Palm <20 18.4-35.4 90% 33
Asia Oil Palm >20 48.5 9.20 33
Asia Paraserianthes
falcataria <20 64.4 38.80 14
Asia Sweitenia
macrophylla >20 512.8 170.40 14
Tropical
moist
deciduous
Africa Broadleaf >20 150 90% 10
Africa Broadleaf ≤20 80 90% 10
Africa Rhizophora sp. 111-483 90% 34
Africa Pinus sp. ≤20 40-166 90% 10,1
Africa Tectona grandis <20 195.5 90% 16
Africa Tectona grandis >20 428.9 90% 16
Africa Pinus sp. >20 120-193.3 90% 10,16
Americas Anthocephalus
chinensis <20 144 90% 2
Americas Coffea sp. 46.9-57.5 90% 15
Americas Eucalyptus sp. >20 90 90% 31
Americas Other Broadleaf 100 90% 10
Americas Pinus sp. >20 270 90% 10
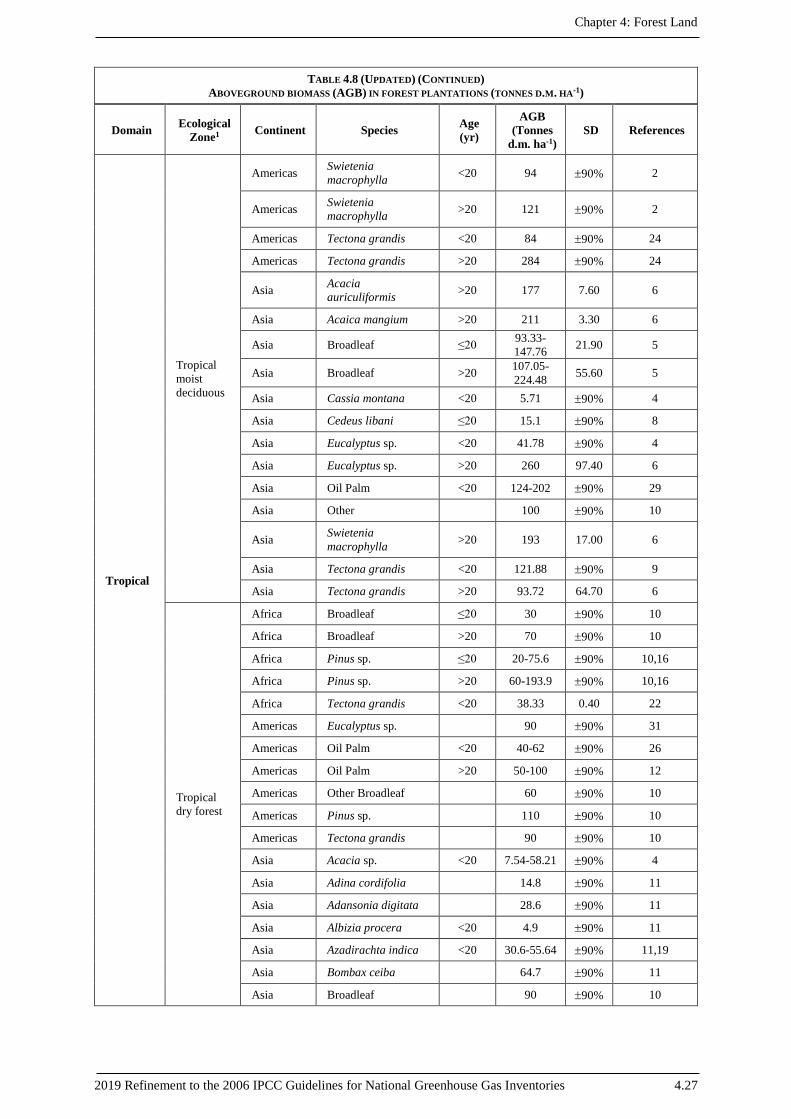
Chapter 4: Forest Land
2019 Refinement to the 2006 IPCC Guidelines for National Greenhouse Gas Inventories 4.27
TABLE 4.8 (UPDATED) (CONTINUED)
ABOVEGROUND BIOMASS (AGB) IN FOREST PLANTATIONS (TONNES D.M. HA-1)
Domain Ecological
Zone1 Continent Species Age
(yr)
AGB
(Tonnes
d.m. ha-1)
SD References
Tropical
Tropical
moist
deciduous
Americas Swietenia
macrophylla <20 94 90% 2
Americas Swietenia
macrophylla >20 121 90% 2
Americas Tectona grandis <20 84 90% 24
Americas Tectona grandis >20 284 90% 24
Asia Acacia
auriculiformis >20 177 7.60 6
Asia Acaica mangium >20 211 3.30 6
Asia Broadleaf ≤20 93.33-
147.76 21.90 5
Asia Broadleaf >20 107.05-
224.48 55.60 5
Asia Cassia montana <20 5.71 90% 4
Asia Cedeus libani ≤20 15.1 90% 8
Asia Eucalyptus sp. <20 41.78 90% 4
Asia Eucalyptus sp. >20 260 97.40 6
Asia Oil Palm <20 124-202 90% 29
Asia Other 100 90% 10
Asia Swietenia
macrophylla >20 193 17.00 6
Asia Tectona grandis <20 121.88 90% 9
Asia Tectona grandis >20 93.72 64.70 6
Tropical
dry forest
Africa Broadleaf ≤20 30 90% 10
Africa Broadleaf >20 70 90% 10
Africa Pinus sp. ≤20 20-75.6 90% 10,16
Africa Pinus sp. >20 60-193.9 90% 10,16
Africa Tectona grandis <20 38.33 0.40 22
Americas Eucalyptus sp. 90 90% 31
Americas Oil Palm <20 40-62 90% 26
Americas Oil Palm >20 50-100 90% 12
Americas Other Broadleaf 60 90% 10
Americas Pinus sp. 110 90% 10
Americas Tectona grandis 90 90% 10
Asia Acacia sp. <20 7.54-58.21 90% 4
Asia Adina cordifolia 14.8 90% 11
Asia Adansonia digitata 28.6 90% 11
Asia Albizia procera <20 4.9 90% 11
Asia Azadirachta indica <20 30.6-55.64 90% 11,19
Asia Bombax ceiba 64.7 90% 11
Asia Broadleaf 90 90% 10
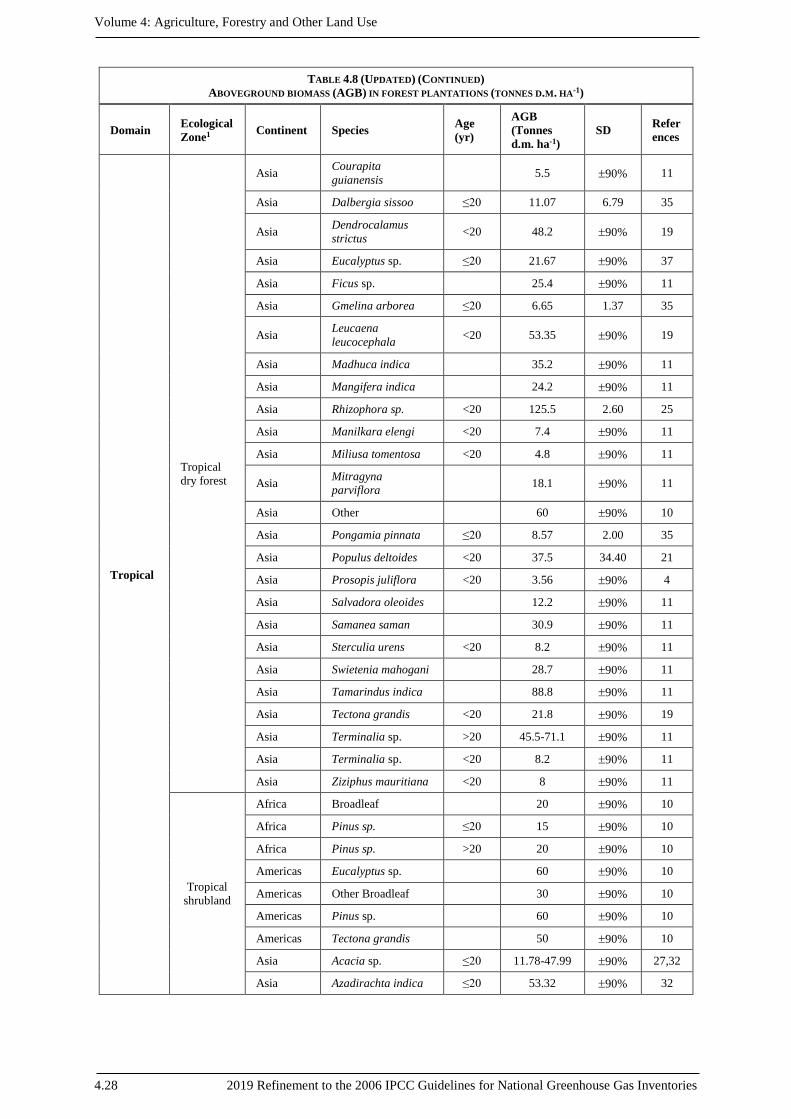
Volume 4: Agriculture, Forestry and Other Land Use
4.28 2019 Refinement to the 2006 IPCC Guidelines for National Greenhouse Gas Inventories
TABLE 4.8 (UPDATED) (CONTINUED)
ABOVEGROUND BIOMASS (AGB) IN FOREST PLANTATIONS (TONNES D.M. HA-1)
Domain Ecological
Zone1 Continent Species Age
(yr)
AGB
(Tonnes
d.m. ha-1)
SD Refer
ences
Tropical
Tropical
dry forest
Asia Courapita
guianensis 5.5 90% 11
Asia Dalbergia sissoo ≤20 11.07 6.79 35
Asia Dendrocalamus
strictus <20 48.2 90% 19
Asia Eucalyptus sp. ≤20 21.67 90% 37
Asia Ficus sp. 25.4 90% 11
Asia Gmelina arborea ≤20 6.65 1.37 35
Asia Leucaena
leucocephala <20 53.35 90% 19
Asia Madhuca indica 35.2 90% 11
Asia Mangifera indica 24.2 90% 11
Asia Rhizophora sp. <20 125.5 2.60 25
Asia Manilkara elengi <20 7.4 90% 11
Asia Miliusa tomentosa <20 4.8 90% 11
Asia Mitragyna
parviflora 18.1 90% 11
Asia Other 60 90% 10
Asia Pongamia pinnata ≤20 8.57 2.00 35
Asia Populus deltoides <20 37.5 34.40 21
Asia Prosopis juliflora <20 3.56 90% 4
Asia Salvadora oleoides 12.2 90% 11
Asia Samanea saman 30.9 90% 11
Asia Sterculia urens <20 8.2 90% 11
Asia Swietenia mahogani 28.7 90% 11
Asia Tamarindus indica 88.8 90% 11
Asia Tectona grandis <20 21.8 90% 19
Asia Terminalia sp. >20 45.5-71.1 90% 11
Asia Terminalia sp. <20 8.2 90% 11
Asia Ziziphus mauritiana <20 8 90% 11
Tropical
shrubland
Africa Broadleaf 20 90% 10
Africa Pinus sp. ≤20 15 90% 10
Africa Pinus sp. >20 20 90% 10
Americas Eucalyptus sp. 60 90% 10
Americas Other Broadleaf 30 90% 10
Americas Pinus sp. 60 90% 10
Americas Tectona grandis 50 90% 10
Asia Acacia sp. ≤20 11.78-47.99 90% 27,32
Asia Azadirachta indica ≤20 53.32 90% 32
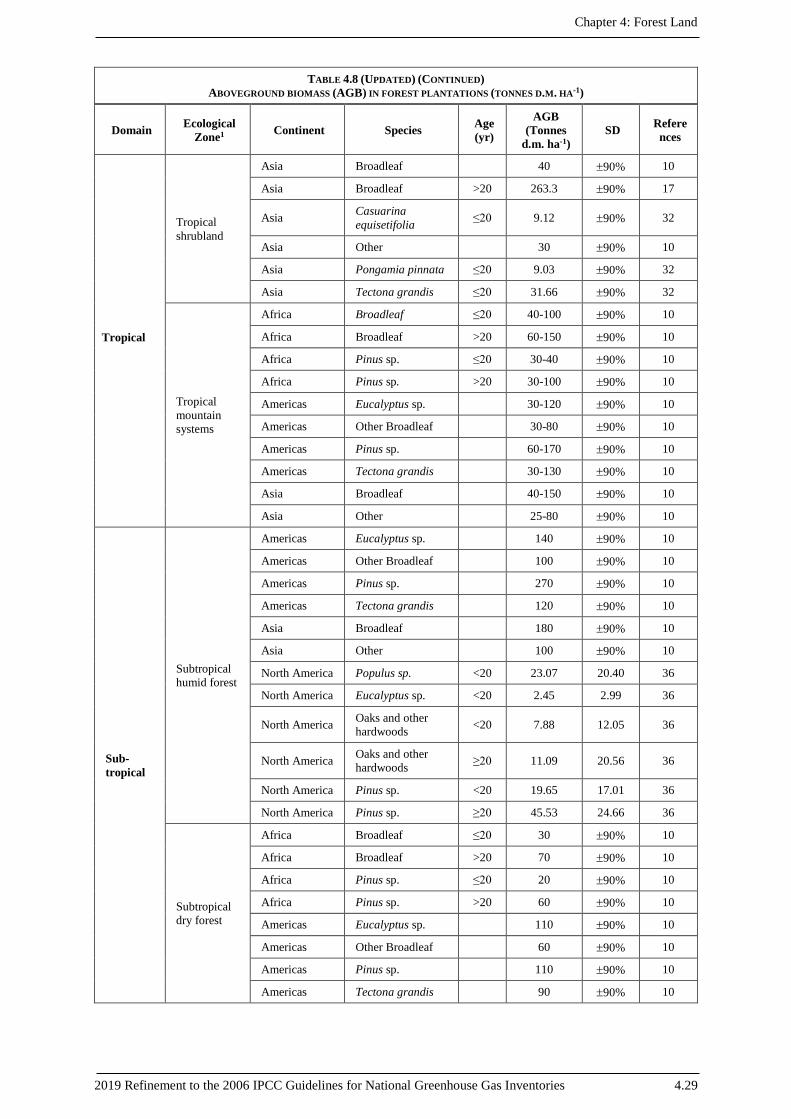
Chapter 4: Forest Land
2019 Refinement to the 2006 IPCC Guidelines for National Greenhouse Gas Inventories 4.29
TABLE 4.8 (UPDATED) (CONTINUED)
ABOVEGROUND BIOMASS (AGB) IN FOREST PLANTATIONS (TONNES D.M. HA-1)
Domain Ecological
Zone1 Continent Species Age
(yr)
AGB
(Tonnes
d.m. ha-1)
SD Refere
nces
Tropical
Tropical
shrubland
Asia Broadleaf 40 90% 10
Asia Broadleaf >20 263.3 90% 17
Asia Casuarina
equisetifolia ≤20 9.12 90% 32
Asia Other 30 90% 10
Asia Pongamia pinnata ≤20 9.03 90% 32
Asia Tectona grandis ≤20 31.66 90% 32
Tropical
mountain
systems
Africa Broadleaf ≤20 40-100 90% 10
Africa Broadleaf >20 60-150 90% 10
Africa Pinus sp. ≤20 30-40 90% 10
Africa Pinus sp. >20 30-100 90% 10
Americas Eucalyptus sp. 30-120 90% 10
Americas Other Broadleaf 30-80 90% 10
Americas Pinus sp. 60-170 90% 10
Americas Tectona grandis 30-130 90% 10
Asia Broadleaf 40-150 90% 10
Asia Other 25-80 90% 10
Sub-
tropical
Subtropical
humid forest
Americas Eucalyptus sp. 140 90% 10
Americas Other Broadleaf 100 90% 10
Americas Pinus sp. 270 90% 10
Americas Tectona grandis 120 90% 10
Asia Broadleaf 180 90% 10
Asia Other 100 90% 10
North America Populus sp. <20 23.07 20.40 36
North America Eucalyptus sp. <20 2.45 2.99 36
North America Oaks and other
hardwoods <20 7.88 12.05 36
North America Oaks and other
hardwoods ≥20 11.09 20.56 36
North America Pinus sp. <20 19.65 17.01 36
North America Pinus sp. ≥20 45.53 24.66 36
Subtropical
dry forest
Africa Broadleaf ≤20 30 90% 10
Africa Broadleaf >20 70 90% 10
Africa Pinus sp. ≤20 20 90% 10
Africa Pinus sp. >20 60 90% 10
Americas Eucalyptus sp. 110 90% 10
Americas Other Broadleaf 60 90% 10
Americas Pinus sp. 110 90% 10
Americas Tectona grandis 90 90% 10
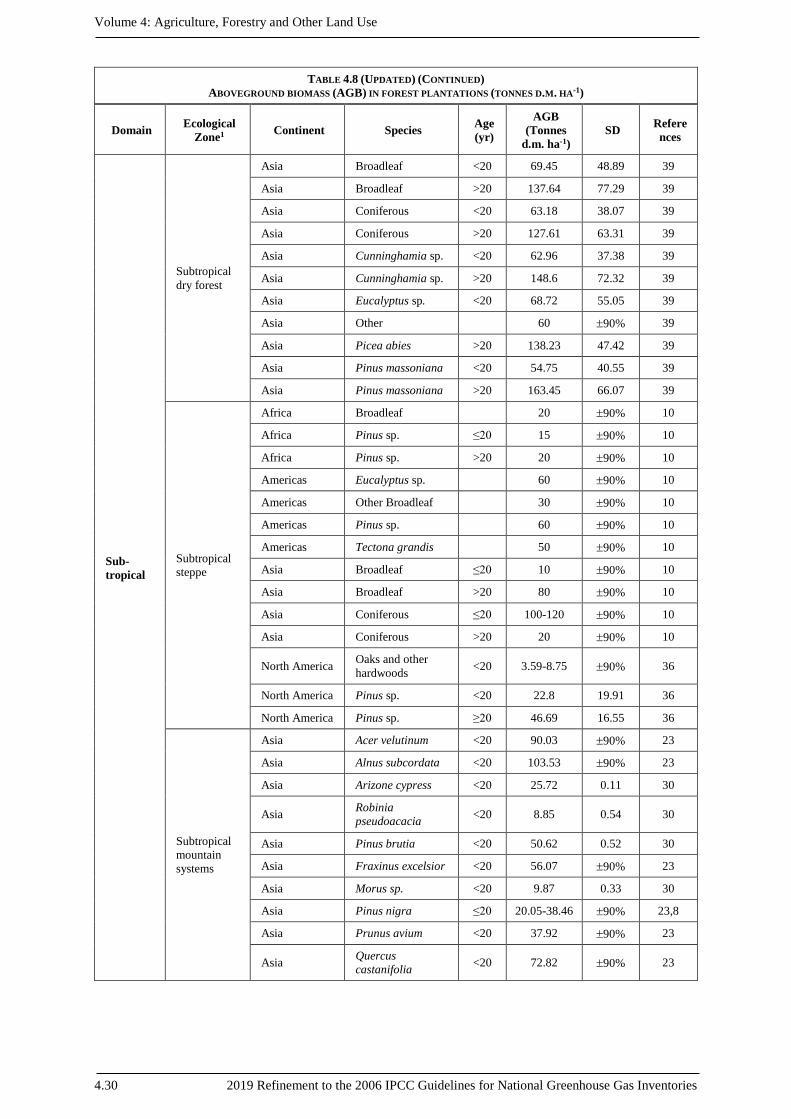
Volume 4: Agriculture, Forestry and Other Land Use
4.30 2019 Refinement to the 2006 IPCC Guidelines for National Greenhouse Gas Inventories
TABLE 4.8 (UPDATED) (CONTINUED)
ABOVEGROUND BIOMASS (AGB) IN FOREST PLANTATIONS (TONNES D.M. HA-1)
Domain Ecological
Zone1 Continent Species Age
(yr)
AGB
(Tonnes
d.m. ha-1)
SD Refere
nces
Sub-
tropical
Subtropical
dry forest
Asia Broadleaf <20 69.45 48.89 39
Asia Broadleaf >20 137.64 77.29 39
Asia Coniferous <20 63.18 38.07 39
Asia Coniferous >20 127.61 63.31 39
Asia Cunninghamia sp. <20 62.96 37.38 39
Asia Cunninghamia sp. >20 148.6 72.32 39
Asia Eucalyptus sp. <20 68.72 55.05 39
Asia Other 60 90% 39
Asia Picea abies >20 138.23 47.42 39
Asia Pinus massoniana <20 54.75 40.55 39
Asia Pinus massoniana >20 163.45 66.07 39
Subtropical
steppe
Africa Broadleaf 20 90% 10
Africa Pinus sp. ≤20 15 90% 10
Africa Pinus sp. >20 20 90% 10
Americas Eucalyptus sp. 60 90% 10
Americas Other Broadleaf 30 90% 10
Americas Pinus sp. 60 90% 10
Americas Tectona grandis 50 90% 10
Asia Broadleaf ≤20 10 90% 10
Asia Broadleaf >20 80 90% 10
Asia Coniferous ≤20 100-120 90% 10
Asia Coniferous >20 20 90% 10
North America Oaks and other
hardwoods <20 3.59-8.75 90% 36
North America Pinus sp. <20 22.8 19.91 36
North America Pinus sp. ≥20 46.69 16.55 36
Subtropical
mountain
systems
Asia Acer velutinum <20 90.03 90% 23
Asia Alnus subcordata <20 103.53 90% 23
Asia Arizone cypress <20 25.72 0.11 30
Asia Robinia
pseudoacacia <20 8.85 0.54 30
Asia Pinus brutia <20 50.62 0.52 30
Asia Fraxinus excelsior <20 56.07 90% 23
Asia Morus sp. <20 9.87 0.33 30
Asia Pinus nigra ≤20 20.05-38.46 90% 23,8
Asia Prunus avium <20 37.92 90% 23
Asia Quercus
castanifolia <20 72.82 90% 23
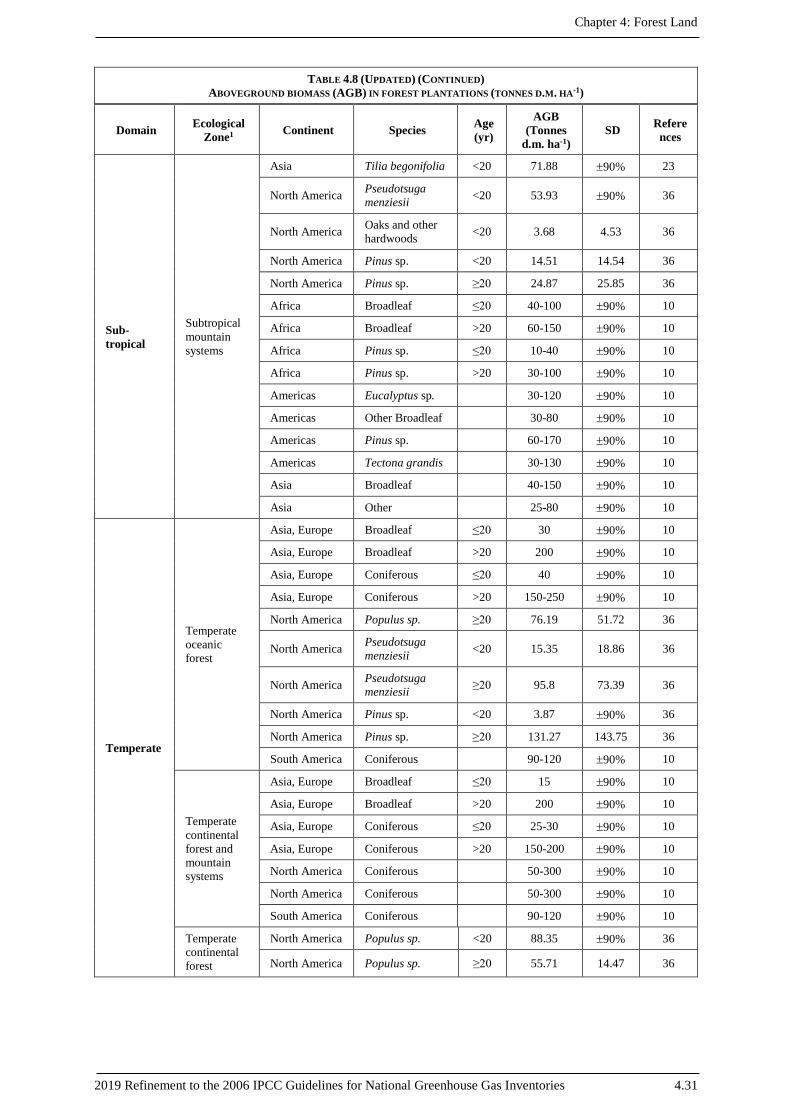
Chapter 4: Forest Land
2019 Refinement to the 2006 IPCC Guidelines for National Greenhouse Gas Inventories 4.31
TABLE 4.8 (UPDATED) (CONTINUED)
ABOVEGROUND BIOMASS (AGB) IN FOREST PLANTATIONS (TONNES D.M. HA-1)
Domain Ecological
Zone1 Continent Species Age
(yr)
AGB
(Tonnes
d.m. ha-1)
SD Refere
nces
Sub-
tropical
Subtropical
mountain
systems
Asia Tilia begonifolia <20 71.88 90% 23
North America Pseudotsuga
menziesii <20 53.93 90% 36
North America Oaks and other
hardwoods <20 3.68 4.53 36
North America Pinus sp. <20 14.51 14.54 36
North America Pinus sp. ≥20 24.87 25.85 36
Africa Broadleaf ≤20 40-100 90% 10
Africa Broadleaf >20 60-150 90% 10
Africa Pinus sp. ≤20 10-40 90% 10
Africa Pinus sp. >20 30-100 90% 10
Americas Eucalyptus sp. 30-120 90% 10
Americas Other Broadleaf 30-80 90% 10
Americas Pinus sp. 60-170 90% 10
Americas Tectona grandis 30-130 90% 10
Asia Broadleaf 40-150 90% 10
Asia Other 25-80 90% 10
Temperate
Temperate
oceanic
forest
Asia, Europe Broadleaf ≤20 30 90% 10
Asia, Europe Broadleaf >20 200 90% 10
Asia, Europe Coniferous ≤20 40 90% 10
Asia, Europe Coniferous >20 150-250 90% 10
North America Populus sp. ≥20 76.19 51.72 36
North America Pseudotsuga
menziesii <20 15.35 18.86 36
North America Pseudotsuga
menziesii ≥20 95.8 73.39 36
North America Pinus sp. <20 3.87 90% 36
North America Pinus sp. ≥20 131.27 143.75 36
South America Coniferous 90-120 90% 10
Temperate
continental
forest and
mountain
systems
Asia, Europe Broadleaf ≤20 15 90% 10
Asia, Europe Broadleaf >20 200 90% 10
Asia, Europe Coniferous ≤20 25-30 90% 10
Asia, Europe Coniferous >20 150-200 90% 10
North America Coniferous 50-300 90% 10
North America Coniferous 50-300 90% 10
South America Coniferous 90-120 90% 10
Temperate
continental
forest
North America Populus sp. <20 88.35 90% 36
North America Populus sp. ≥20 55.71 14.47 36
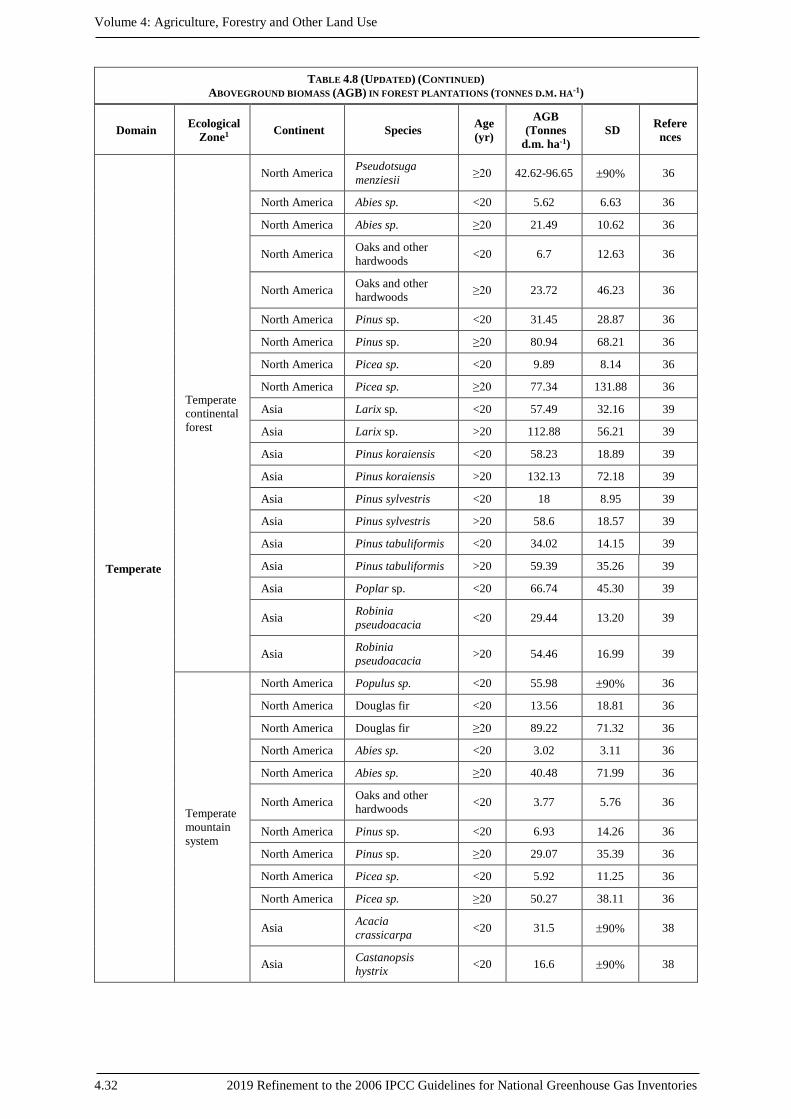
Volume 4: Agriculture, Forestry and Other Land Use
4.32 2019 Refinement to the 2006 IPCC Guidelines for National Greenhouse Gas Inventories
TABLE 4.8 (UPDATED) (CONTINUED)
ABOVEGROUND BIOMASS (AGB) IN FOREST PLANTATIONS (TONNES D.M. HA-1)
Domain Ecological
Zone1 Continent Species Age
(yr)
AGB
(Tonnes
d.m. ha-1)
SD Refere
nces
Temperate
Temperate
continental
forest
North America Pseudotsuga
menziesii ≥20 42.62-96.65 90% 36
North America Abies sp. <20 5.62 6.63 36
North America Abies sp. ≥20 21.49 10.62 36
North America Oaks and other
hardwoods <20 6.7 12.63 36
North America Oaks and other
hardwoods ≥20 23.72 46.23 36
North America Pinus sp. <20 31.45 28.87 36
North America Pinus sp. ≥20 80.94 68.21 36
North America Picea sp. <20 9.89 8.14 36
North America Picea sp. ≥20 77.34 131.88 36
Asia Larix sp. <20 57.49 32.16 39
Asia Larix sp. >20 112.88 56.21 39
Asia Pinus koraiensis <20 58.23 18.89 39
Asia Pinus koraiensis >20 132.13 72.18 39
Asia Pinus sylvestris <20 18 8.95 39
Asia Pinus sylvestris >20 58.6 18.57 39
Asia Pinus tabuliformis <20 34.02 14.15 39
Asia Pinus tabuliformis >20 59.39 35.26 39
Asia Poplar sp. <20 66.74 45.30 39
Asia Robinia
pseudoacacia <20 29.44 13.20 39
Asia Robinia
pseudoacacia >20 54.46 16.99 39
Temperate
mountain
system
North America Populus sp. <20 55.98 90% 36
North America Douglas fir <20 13.56 18.81 36
North America Douglas fir ≥20 89.22 71.32 36
North America Abies sp. <20 3.02 3.11 36
North America Abies sp. ≥20 40.48 71.99 36
North America Oaks and other
hardwoods <20 3.77 5.76 36
North America Pinus sp. <20 6.93 14.26 36
North America Pinus sp. ≥20 29.07 35.39 36
North America Picea sp. <20 5.92 11.25 36
North America Picea sp. ≥20 50.27 38.11 36
Asia Acacia
crassicarpa <20 31.5 90% 38
Asia Castanopsis
hystrix <20 16.6 90% 38
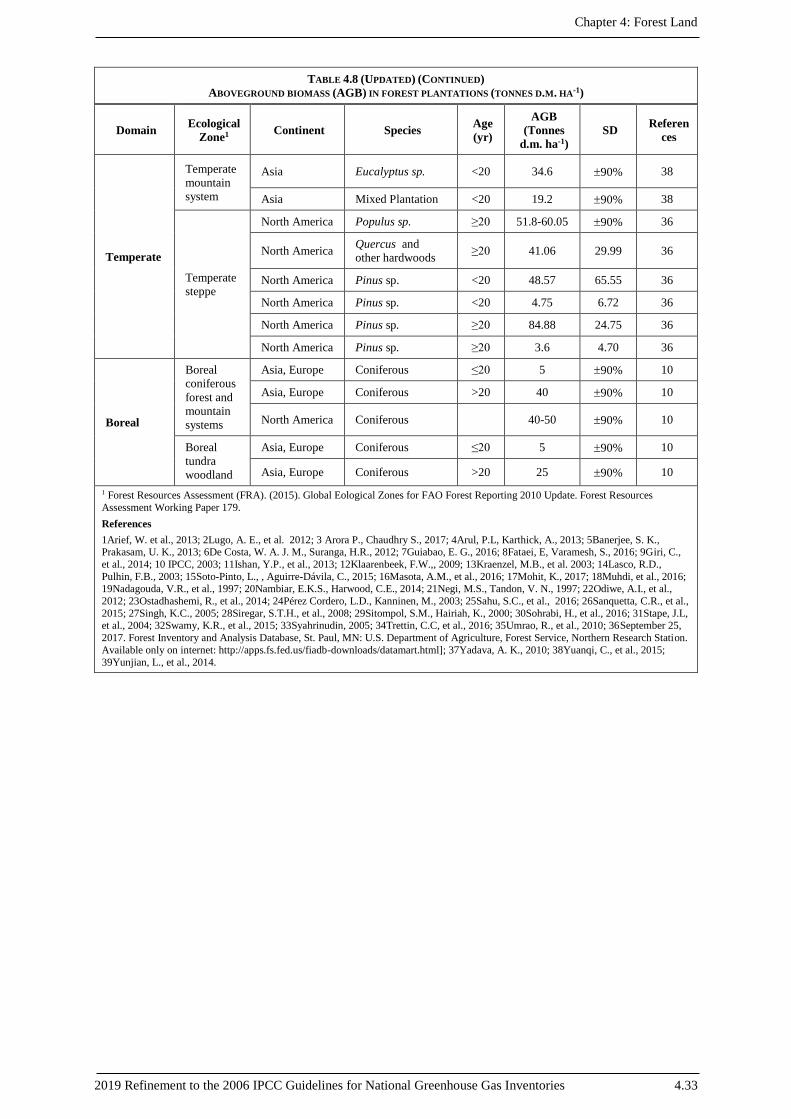
Chapter 4: Forest Land
2019 Refinement to the 2006 IPCC Guidelines for National Greenhouse Gas Inventories 4.33
TABLE 4.8 (UPDATED) (CONTINUED)
ABOVEGROUND BIOMASS (AGB) IN FOREST PLANTATIONS (TONNES D.M. HA-1)
Domain Ecological
Zone1 Continent Species Age
(yr)
AGB
(Tonnes
d.m. ha-1)
SD Referen
ces
Temperate
Temperate
mountain
system
Asia Eucalyptus sp. <20 34.6 90% 38
Asia Mixed Plantation <20 19.2 90% 38
Temperate
steppe
North America Populus sp. ≥20 51.8-60.05 90% 36
North America Quercus and
other hardwoods ≥20 41.06 29.99 36
North America Pinus sp. <20 48.57 65.55 36
North America Pinus sp. <20 4.75 6.72 36
North America Pinus sp. ≥20 84.88 24.75 36
North America Pinus sp. ≥20 3.6 4.70 36
Boreal
Boreal
coniferous
forest and
mountain
systems
Asia, Europe Coniferous ≤20 5 90% 10
Asia, Europe Coniferous >20 40 90% 10
North America Coniferous 40-50 90% 10
Boreal
tundra
woodland
Asia, Europe Coniferous ≤20 5 90% 10
Asia, Europe Coniferous >20 25 90% 10
1 Forest Resources Assessment (FRA). (2015). Global Eological Zones for FAO Forest Reporting 2010 Update. Forest Resources
Assessment Working Paper 179.
References
1Arief, W. et al., 2013; 2Lugo, A. E., et al. 2012; 3 Arora P., Chaudhry S., 2017; 4Arul, P.L, Karthick, A., 2013; 5Banerjee, S. K., Prakasam, U. K., 2013; 6De Costa, W. A. J. M., Suranga, H.R., 2012; 7Guiabao, E. G., 2016; 8Fataei, E, Varamesh, S., 2016; 9Giri, C.,
et al., 2014; 10 IPCC, 2003; 11Ishan, Y.P., et al., 2013; 12Klaarenbeek, F.W.,, 2009; 13Kraenzel, M.B., et al. 2003; 14Lasco, R.D.,
Pulhin, F.B., 2003; 15Soto-Pinto, L., , Aguirre-Dávila, C., 2015; 16Masota, A.M., et al., 2016; 17Mohit, K., 2017; 18Muhdi, et al., 2016;
19Nadagouda, V.R., et al., 1997; 20Nambiar, E.K.S., Harwood, C.E., 2014; 21Negi, M.S., Tandon, V. N., 1997; 22Odiwe, A.I., et al.,
2012; 23Ostadhashemi, R., et al., 2014; 24Pérez Cordero, L.D., Kanninen, M., 2003; 25Sahu, S.C., et al., 2016; 26Sanquetta, C.R., et al.,
2015; 27Singh, K.C., 2005; 28Siregar, S.T.H., et al., 2008; 29Sitompol, S.M., Hairiah, K., 2000; 30Sohrabi, H., et al., 2016; 31Stape, J.L, et al., 2004; 32Swamy, K.R., et al., 2015; 33Syahrinudin, 2005; 34Trettin, C.C, et al., 2016; 35Umrao, R., et al., 2010; 36September 25,
2017. Forest Inventory and Analysis Database, St. Paul, MN: U.S. Department of Agriculture, Forest Service, Northern Research Station.
Available only on internet: http://apps.fs.fed.us/fiadb-downloads/datamart.html]; 37Yadava, A. K., 2010; 38Yuanqi, C., et al., 2015;
39Yunjian, L., et al., 2014.
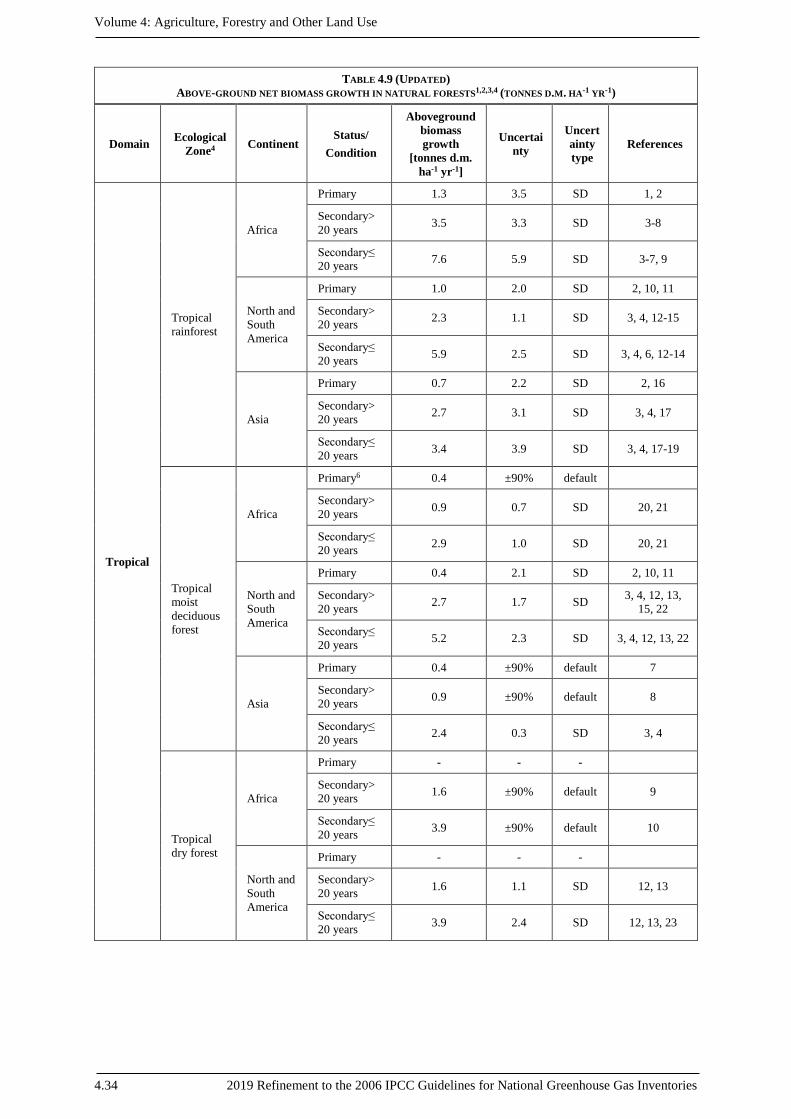
Volume 4: Agriculture, Forestry and Other Land Use
4.34 2019 Refinement to the 2006 IPCC Guidelines for National Greenhouse Gas Inventories
TABLE 4.9 (UPDATED)
ABOVE-GROUND NET BIOMASS GROWTH IN NATURAL FORESTS1,2,3,4 (TONNES D.M. HA-1 YR-1)
Domain Ecological
Zone4 Continent Status/
Condition
Aboveground
biomass
growth
[tonnes d.m.
ha-1 yr-1]
Uncertai
nty
Uncert
ainty
type
References
Tropical
Tropical
rainforest
Africa
Primary 1.3 3.5 SD 1, 2
Secondary>
20 years 3.5 3.3 SD 3-8
Secondary≤
20 years 7.6 5.9 SD 3-7, 9
North and
South
America
Primary 1.0 2.0 SD 2, 10, 11
Secondary>
20 years 2.3 1.1 SD 3, 4, 12-15
Secondary≤
20 years 5.9 2.5 SD 3, 4, 6, 12-14
Asia
Primary 0.7 2.2 SD 2, 16
Secondary>
20 years 2.7 3.1 SD 3, 4, 17
Secondary≤
20 years 3.4 3.9 SD 3, 4, 17-19
Tropical
moist
deciduous
forest
Africa
Primary6 0.4 ±90% default
Secondary>
20 years 0.9 0.7 SD 20, 21
Secondary≤
20 years 2.9 1.0 SD 20, 21
North and
South
America
Primary 0.4 2.1 SD 2, 10, 11
Secondary>
20 years 2.7 1.7 SD
3, 4, 12, 13,
15, 22
Secondary≤
20 years 5.2 2.3 SD 3, 4, 12, 13, 22
Asia
Primary 0.4 ±90% default 7
Secondary>
20 years 0.9 ±90% default 8
Secondary≤
20 years 2.4 0.3 SD 3, 4
Tropical
dry forest
Africa
Primary - - -
Secondary>
20 years 1.6 ±90% default 9
Secondary≤
20 years 3.9 ±90% default 10
North and
South
America
Primary - - -
Secondary>
20 years 1.6 1.1 SD 12, 13
Secondary≤
20 years 3.9 2.4 SD 12, 13, 23
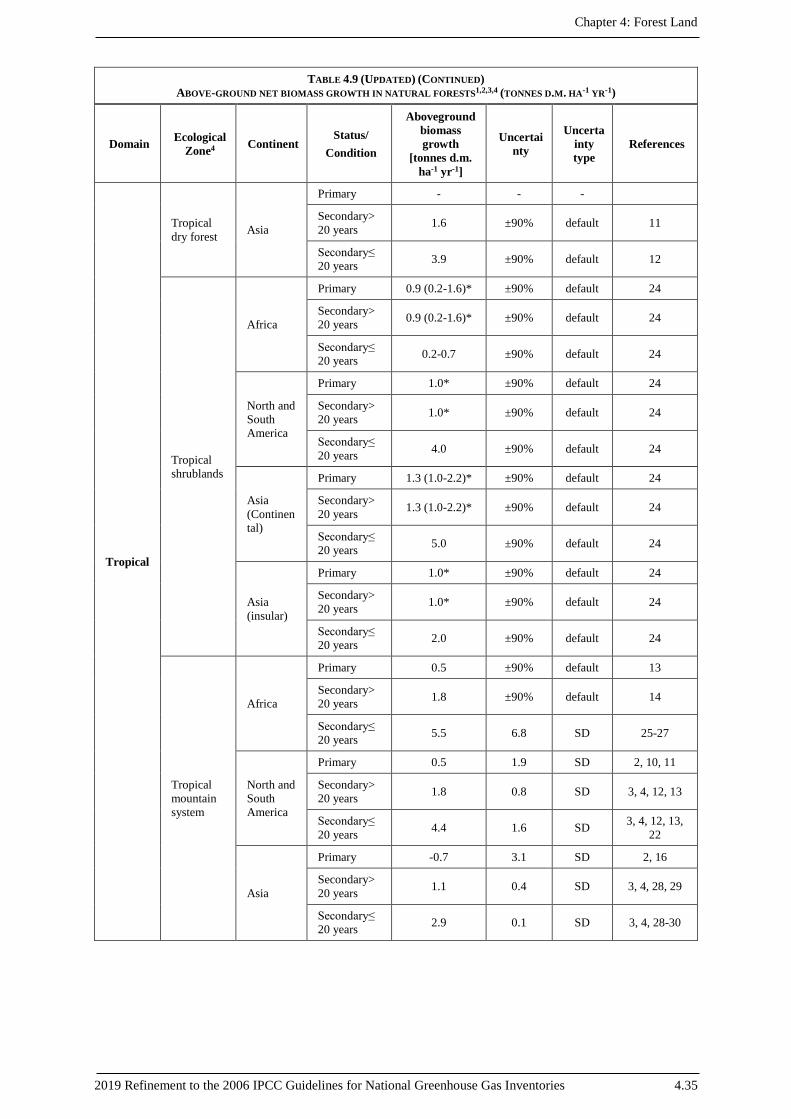
Chapter 4: Forest Land
2019 Refinement to the 2006 IPCC Guidelines for National Greenhouse Gas Inventories 4.35
TABLE 4.9 (UPDATED) (CONTINUED)
ABOVE-GROUND NET BIOMASS GROWTH IN NATURAL FORESTS1,2,3,4 (TONNES D.M. HA-1 YR-1)
Domain Ecological
Zone4 Continent Status/
Condition
Aboveground
biomass
growth
[tonnes d.m.
ha-1 yr-1]
Uncertai
nty
Uncerta
inty
type
References
Tropical
Tropical
dry forest Asia
Primary - - -
Secondary>
20 years 1.6 ±90% default 11
Secondary≤
20 years 3.9 ±90% default 12
Tropical
shrublands
Africa
Primary 0.9 (0.2-1.6)* ±90% default 24
Secondary>
20 years 0.9 (0.2-1.6)* ±90% default 24
Secondary≤
20 years 0.2-0.7 ±90% default 24
North and
South
America
Primary 1.0* ±90% default 24
Secondary>
20 years 1.0* ±90% default 24
Secondary≤
20 years 4.0 ±90% default 24
Asia
(Continen
tal)
Primary 1.3 (1.0-2.2)* ±90% default 24
Secondary>
20 years 1.3 (1.0-2.2)* ±90% default 24
Secondary≤
20 years 5.0 ±90% default 24
Asia
(insular)
Primary 1.0* ±90% default 24
Secondary>
20 years 1.0* ±90% default 24
Secondary≤
20 years 2.0 ±90% default 24
Tropical
mountain
system
Africa
Primary 0.5 ±90% default 13
Secondary>
20 years 1.8 ±90% default 14
Secondary≤
20 years 5.5 6.8 SD 25-27
North and
South
America
Primary 0.5 1.9 SD 2, 10, 11
Secondary>
20 years 1.8 0.8 SD 3, 4, 12, 13
Secondary≤
20 years 4.4 1.6 SD
3, 4, 12, 13,
22
Asia
Primary -0.7 3.1 SD 2, 16
Secondary>
20 years 1.1 0.4 SD 3, 4, 28, 29
Secondary≤
20 years 2.9 0.1 SD 3, 4, 28-30
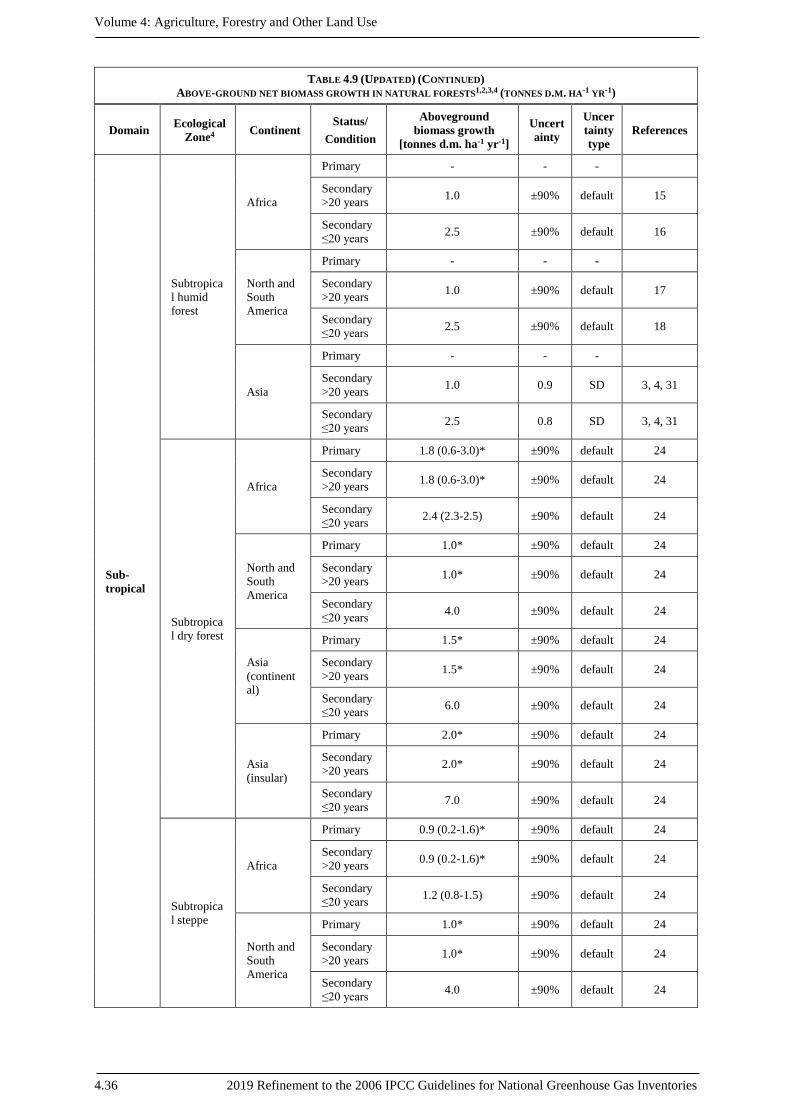
Volume 4: Agriculture, Forestry and Other Land Use
4.36 2019 Refinement to the 2006 IPCC Guidelines for National Greenhouse Gas Inventories
TABLE 4.9 (UPDATED) (CONTINUED)
ABOVE-GROUND NET BIOMASS GROWTH IN NATURAL FORESTS1,2,3,4 (TONNES D.M. HA-1 YR-1)
Domain Ecological
Zone4 Continent Status/
Condition
Aboveground
biomass growth
[tonnes d.m. ha-1 yr-1]
Uncert
ainty
Uncer
tainty
type
References
Sub-
tropical
Subtropica
l humid
forest
Africa
Primary - - -
Secondary
>20 years 1.0 ±90% default 15
Secondary
≤20 years 2.5 ±90% default 16
North and
South
America
Primary - - -
Secondary
>20 years 1.0 ±90% default 17
Secondary
≤20 years 2.5 ±90% default 18
Asia
Primary - - -
Secondary
>20 years 1.0 0.9 SD 3, 4, 31
Secondary
≤20 years 2.5 0.8 SD 3, 4, 31
Subtropica
l dry forest
Africa
Primary 1.8 (0.6-3.0)* ±90% default 24
Secondary
>20 years 1.8 (0.6-3.0)* ±90% default 24
Secondary
≤20 years 2.4 (2.3-2.5) ±90% default 24
North and
South
America
Primary 1.0* ±90% default 24
Secondary
>20 years 1.0* ±90% default 24
Secondary
≤20 years 4.0 ±90% default 24
Asia
(continent
al)
Primary 1.5* ±90% default 24
Secondary
>20 years 1.5* ±90% default 24
Secondary
≤20 years 6.0 ±90% default 24
Asia
(insular)
Primary 2.0* ±90% default 24
Secondary
>20 years 2.0* ±90% default 24
Secondary
≤20 years 7.0 ±90% default 24
Subtropica
l steppe
Africa
Primary 0.9 (0.2-1.6)* ±90% default 24
Secondary
>20 years 0.9 (0.2-1.6)* ±90% default 24
Secondary
≤20 years 1.2 (0.8-1.5) ±90% default 24
North and
South
America
Primary 1.0* ±90% default 24
Secondary
>20 years 1.0* ±90% default 24
Secondary
≤20 years 4.0 ±90% default 24
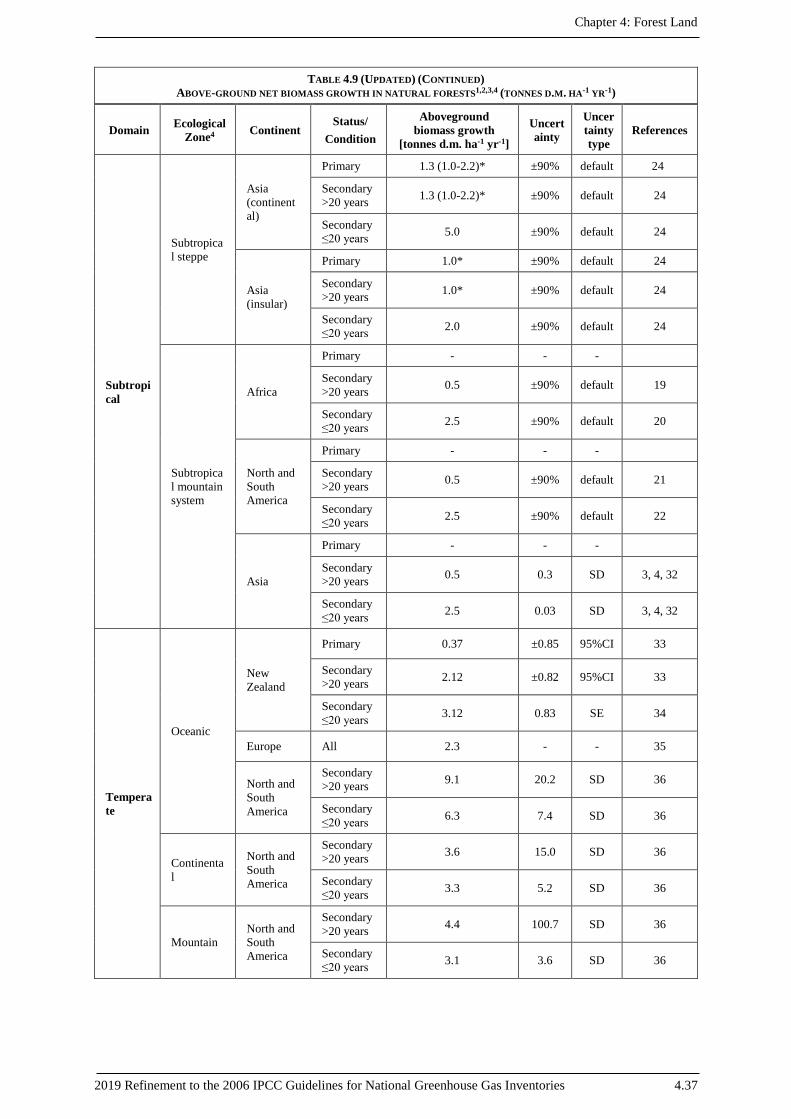
Chapter 4: Forest Land
2019 Refinement to the 2006 IPCC Guidelines for National Greenhouse Gas Inventories 4.37
TABLE 4.9 (UPDATED) (CONTINUED)
ABOVE-GROUND NET BIOMASS GROWTH IN NATURAL FORESTS1,2,3,4 (TONNES D.M. HA-1 YR-1)
Domain Ecological
Zone4 Continent Status/
Condition
Aboveground
biomass growth
[tonnes d.m. ha-1 yr-1]
Uncert
ainty
Uncer
tainty
type
References
Subtropi
cal
Subtropica
l steppe
Asia
(continent
al)
Primary 1.3 (1.0-2.2)* ±90% default 24
Secondary
>20 years 1.3 (1.0-2.2)* ±90% default 24
Secondary
≤20 years 5.0 ±90% default 24
Asia
(insular)
Primary 1.0* ±90% default 24
Secondary
>20 years 1.0* ±90% default 24
Secondary
≤20 years 2.0 ±90% default 24
Subtropica
l mountain
system
Africa
Primary - - -
Secondary
>20 years 0.5 ±90% default 19
Secondary
≤20 years 2.5 ±90% default 20
North and
South
America
Primary - - -
Secondary
>20 years 0.5 ±90% default 21
Secondary
≤20 years 2.5 ±90% default 22
Asia
Primary - - -
Secondary
>20 years 0.5 0.3 SD 3, 4, 32
Secondary
≤20 years 2.5 0.03 SD 3, 4, 32
Tempera
te
Oceanic
New
Zealand
Primary 0.37 ±0.85 95%CI 33
Secondary
>20 years 2.12 ±0.82 95%CI 33
Secondary
≤20 years 3.12 0.83 SE 34
Europe All 2.3 - - 35
North and
South
America
Secondary
>20 years 9.1 20.2 SD 36
Secondary
≤20 years 6.3 7.4 SD 36
Continenta
l
North and
South
America
Secondary
>20 years 3.6 15.0 SD 36
Secondary
≤20 years 3.3 5.2 SD 36
Mountain
North and
South
America
Secondary
>20 years 4.4 100.7 SD 36
Secondary
≤20 years 3.1 3.6 SD 36
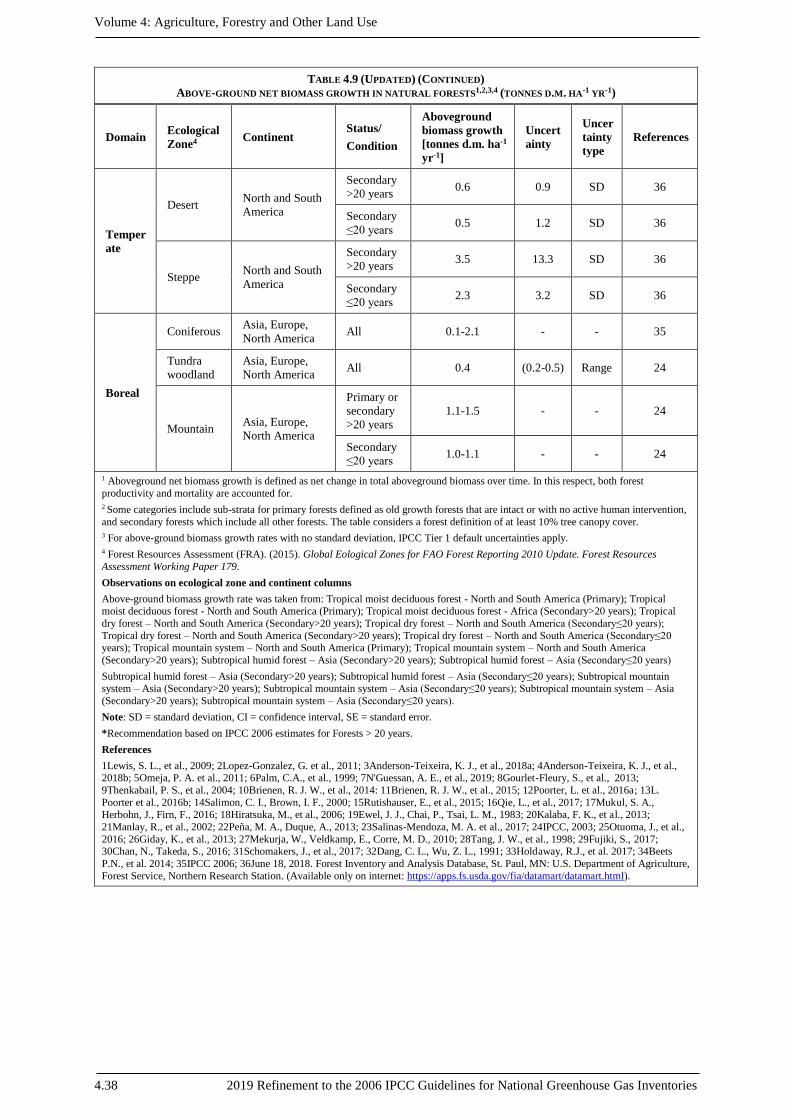
Volume 4: Agriculture, Forestry and Other Land Use
4.38 2019 Refinement to the 2006 IPCC Guidelines for National Greenhouse Gas Inventories
TABLE 4.9 (UPDATED) (CONTINUED)
ABOVE-GROUND NET BIOMASS GROWTH IN NATURAL FORESTS1,2,3,4 (TONNES D.M. HA-1 YR-1)
Domain Ecological
Zone4 Continent Status/
Condition
Aboveground
biomass growth
[tonnes d.m. ha-1
yr-1]
Uncert
ainty
Uncer
tainty
type
References
Temper
ate
Desert North and South
America
Secondary
>20 years 0.6 0.9 SD 36
Secondary
≤20 years 0.5 1.2 SD 36
Steppe North and South
America
Secondary
>20 years 3.5 13.3 SD 36
Secondary
≤20 years 2.3 3.2 SD 36
Boreal
Coniferous Asia, Europe,
North America All 0.1-2.1 - - 35
Tundra
woodland
Asia, Europe,
North America All 0.4 (0.2-0.5) Range 24
Mountain Asia, Europe,
North America
Primary or
secondary
>20 years
1.1-1.5 - - 24
Secondary
≤20 years 1.0-1.1 - - 24
1 Aboveground net biomass growth is defined as net change in total aboveground biomass over time. In this respect, both forest
productivity and mortality are accounted for.
2 Some categories include sub-strata for primary forests defined as old growth forests that are intact or with no active human intervention,
and secondary forests which include all other forests. The table considers a forest definition of at least 10% tree canopy cover. 3 For above-ground biomass growth rates with no standard deviation, IPCC Tier 1 default uncertainties apply.
4 Forest Resources Assessment (FRA). (2015). Global Eological Zones for FAO Forest Reporting 2010 Update. Forest Resources
Assessment Working Paper 179.
Observations on ecological zone and continent columns
Above-ground biomass growth rate was taken from: Tropical moist deciduous forest - North and South America (Primary); Tropical moist deciduous forest - North and South America (Primary); Tropical moist deciduous forest - Africa (Secondary>20 years); Tropical
dry forest – North and South America (Secondary>20 years); Tropical dry forest – North and South America (Secondary≤20 years);
Tropical dry forest – North and South America (Secondary>20 years); Tropical dry forest – North and South America (Secondary≤20 years); Tropical mountain system – North and South America (Primary); Tropical mountain system – North and South America
(Secondary>20 years); Subtropical humid forest – Asia (Secondary>20 years); Subtropical humid forest – Asia (Secondary≤20 years)
Subtropical humid forest – Asia (Secondary>20 years); Subtropical humid forest – Asia (Secondary≤20 years); Subtropical mountain system – Asia (Secondary>20 years); Subtropical mountain system – Asia (Secondary≤20 years); Subtropical mountain system – Asia
(Secondary>20 years); Subtropical mountain system – Asia (Secondary≤20 years).
Note: SD = standard deviation, CI = confidence interval, SE = standard error.
*Recommendation based on IPCC 2006 estimates for Forests > 20 years.
References
1Lewis, S. L., et al., 2009; 2Lopez-Gonzalez, G. et al., 2011; 3Anderson-Teixeira, K. J., et al., 2018a; 4Anderson-Teixeira, K. J., et al., 2018b; 5Omeja, P. A. et al., 2011; 6Palm, C.A., et al., 1999; 7N'Guessan, A. E., et al., 2019; 8Gourlet-Fleury, S., et al., 2013;
9Thenkabail, P. S., et al., 2004; 10Brienen, R. J. W., et al., 2014: 11Brienen, R. J. W., et al., 2015; 12Poorter, L. et al., 2016a; 13L.
Poorter et al., 2016b; 14Salimon, C. I., Brown, I. F., 2000; 15Rutishauser, E., et al., 2015; 16Qie, L., et al., 2017; 17Mukul, S. A.,
Herbohn, J., Firn, F., 2016; 18Hiratsuka, M., et al., 2006; 19Ewel, J. J., Chai, P., Tsai, L. M., 1983; 20Kalaba, F. K., et al., 2013;
21Manlay, R., et al., 2002; 22Peña, M. A., Duque, A., 2013; 23Salinas-Mendoza, M. A. et al., 2017; 24IPCC, 2003; 25Otuoma, J., et al.,
2016; 26Giday, K., et al., 2013; 27Mekurja, W., Veldkamp, E., Corre, M. D., 2010; 28Tang, J. W., et al., 1998; 29Fujiki, S., 2017; 30Chan, N., Takeda, S., 2016; 31Schomakers, J., et al., 2017; 32Dang, C. L., Wu, Z. L., 1991; 33Holdaway, R.J., et al. 2017; 34Beets
P.N., et al. 2014; 35IPCC 2006; 36June 18, 2018. Forest Inventory and Analysis Database, St. Paul, MN: U.S. Department of Agriculture,
Forest Service, Northern Research Station. (Available only on internet: https://apps.fs.usda.gov/fia/datamart/datamart.html).
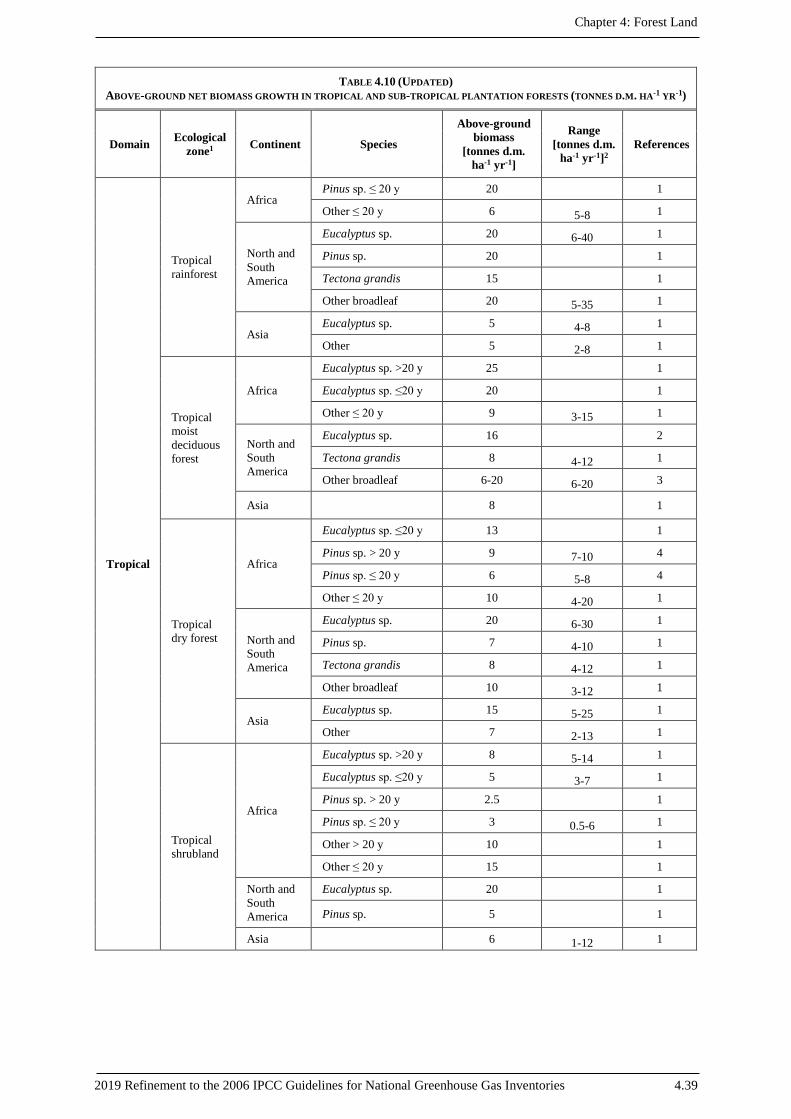
Chapter 4: Forest Land
2019 Refinement to the 2006 IPCC Guidelines for National Greenhouse Gas Inventories 4.39
TABLE 4.10 (UPDATED)
ABOVE-GROUND NET BIOMASS GROWTH IN TROPICAL AND SUB-TROPICAL PLANTATION FORESTS (TONNES D.M. HA-1 YR-1)
Domain Ecological
zone1 Continent Species
Above-ground
biomass
[tonnes d.m.
ha-1 yr-1]
Range
[tonnes d.m.
ha-1 yr-1]2
References
Tropical
Tropical
rainforest
Africa Pinus sp. ≤ 20 y 20 1
Other ≤ 20 y 6 5-8 1
North and
South
America
Eucalyptus sp. 20 6-40 1
Pinus sp. 20 1
Tectona grandis 15 1
Other broadleaf 20 5-35 1
Asia Eucalyptus sp. 5 4-8 1
Other 5 2-8 1
Tropical
moist
deciduous
forest
Africa
Eucalyptus sp. >20 y 25 1
Eucalyptus sp. ≤20 y 20 1
Other ≤ 20 y 9 3-15 1
North and
South
America
Eucalyptus sp. 16 2
Tectona grandis 8 4-12 1
Other broadleaf 6-20 6-20 3
Asia 8 1
Tropical
dry forest
Africa
Eucalyptus sp. ≤20 y 13 1
Pinus sp. > 20 y 9 7-10 4
Pinus sp. ≤ 20 y 6 5-8 4
Other ≤ 20 y 10 4-20 1
North and
South
America
Eucalyptus sp. 20 6-30 1
Pinus sp. 7 4-10 1
Tectona grandis 8 4-12 1
Other broadleaf 10 3-12 1
Asia Eucalyptus sp. 15 5-25 1
Other 7 2-13 1
Tropical
shrubland
Africa
Eucalyptus sp. >20 y 8 5-14 1
Eucalyptus sp. ≤20 y 5 3-7 1
Pinus sp. > 20 y 2.5 1
Pinus sp. ≤ 20 y 3 0.5-6 1
Other > 20 y 10 1
Other ≤ 20 y 15 1
North and
South
America
Eucalyptus sp. 20 1
Pinus sp. 5
1
Asia 6 1-12 1
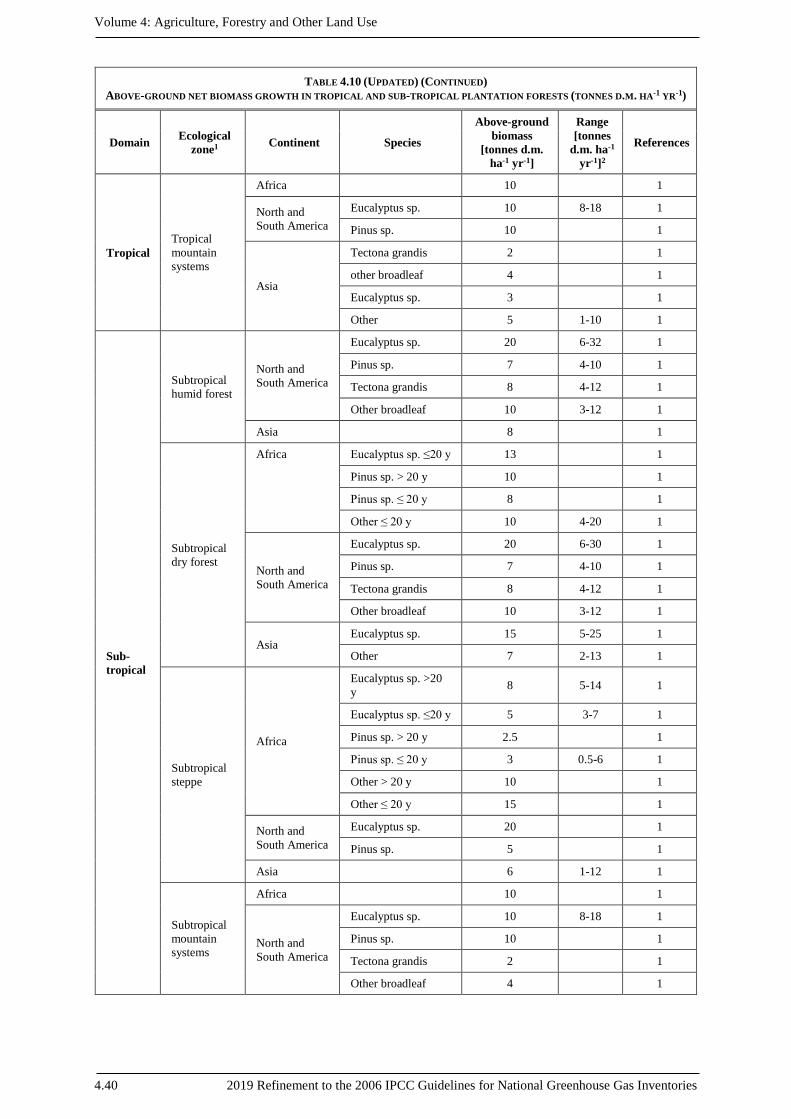
Volume 4: Agriculture, Forestry and Other Land Use
4.40 2019 Refinement to the 2006 IPCC Guidelines for National Greenhouse Gas Inventories
TABLE 4.10 (UPDATED) (CONTINUED)
ABOVE-GROUND NET BIOMASS GROWTH IN TROPICAL AND SUB-TROPICAL PLANTATION FORESTS (TONNES D.M. HA-1 YR-1)
Domain Ecological
zone1 Continent Species
Above-ground
biomass
[tonnes d.m.
ha-1 yr-1]
Range
[tonnes
d.m. ha-1
yr-1]2
References
Tropical
Tropical
mountain
systems
Africa 10 1
North and
South America
Eucalyptus sp. 10 8-18 1
Pinus sp. 10 1
Asia
Tectona grandis 2 1
other broadleaf 4 1
Eucalyptus sp. 3 1
Other 5 1-10 1
Sub-
tropical
Subtropical
humid forest
North and
South America
Eucalyptus sp. 20 6-32 1
Pinus sp. 7 4-10 1
Tectona grandis 8 4-12 1
Other broadleaf 10 3-12 1
Asia 8 1
Subtropical
dry forest
Africa Eucalyptus sp. ≤20 y 13 1
Pinus sp. > 20 y 10 1
Pinus sp. ≤ 20 y 8 1
Other ≤ 20 y 10 4-20 1
North and
South America
Eucalyptus sp. 20 6-30 1
Pinus sp. 7 4-10 1
Tectona grandis 8 4-12 1
Other broadleaf 10 3-12 1
Asia Eucalyptus sp. 15 5-25 1
Other 7 2-13 1
Subtropical
steppe
Africa
Eucalyptus sp. >20
y 8 5-14 1
Eucalyptus sp. ≤20 y 5 3-7 1
Pinus sp. > 20 y 2.5 1
Pinus sp. ≤ 20 y 3 0.5-6 1
Other > 20 y 10 1
Other ≤ 20 y 15 1
North and
South America
Eucalyptus sp. 20 1
Pinus sp. 5 1
Asia 6 1-12 1
Subtropical
mountain
systems
Africa 10 1
North and
South America
Eucalyptus sp. 10 8-18 1
Pinus sp. 10 1
Tectona grandis 2 1
Other broadleaf 4 1
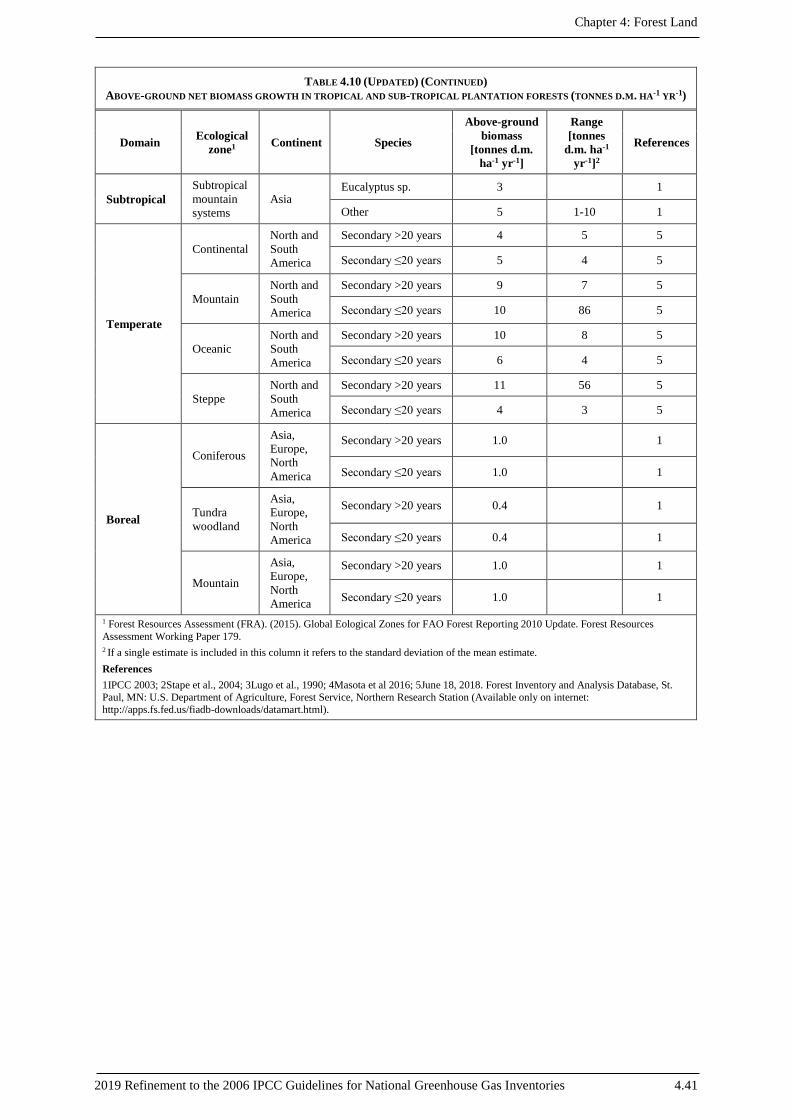
Chapter 4: Forest Land
2019 Refinement to the 2006 IPCC Guidelines for National Greenhouse Gas Inventories 4.41
TABLE 4.10 (UPDATED) (CONTINUED)
ABOVE-GROUND NET BIOMASS GROWTH IN TROPICAL AND SUB-TROPICAL PLANTATION FORESTS (TONNES D.M. HA-1 YR-1)
Domain Ecological
zone1 Continent Species
Above-ground
biomass
[tonnes d.m.
ha-1 yr-1]
Range
[tonnes
d.m. ha-1
yr-1]2
References
Subtropical
Subtropical
mountain
systems
Asia Eucalyptus sp. 3 1
Other 5 1-10 1
Temperate
Continental
North and
South
America
Secondary >20 years 4 5 5
Secondary ≤20 years 5 4 5
Mountain
North and
South
America
Secondary >20 years 9 7 5
Secondary ≤20 years 10 86 5
Oceanic
North and
South
America
Secondary >20 years 10 8 5
Secondary ≤20 years 6 4 5
Steppe
North and
South
America
Secondary >20 years 11 56 5
Secondary ≤20 years 4 3 5
Boreal
Coniferous
Asia,
Europe,
North
America
Secondary >20 years 1.0 1
Secondary ≤20 years 1.0 1
Tundra
woodland
Asia,
Europe,
North
America
Secondary >20 years 0.4 1
Secondary ≤20 years 0.4 1
Mountain
Asia,
Europe,
North
America
Secondary >20 years 1.0 1
Secondary ≤20 years 1.0 1
1 Forest Resources Assessment (FRA). (2015). Global Eological Zones for FAO Forest Reporting 2010 Update. Forest Resources
Assessment Working Paper 179. 2 If a single estimate is included in this column it refers to the standard deviation of the mean estimate.
References
1IPCC 2003; 2Stape et al., 2004; 3Lugo et al., 1990; 4Masota et al 2016; 5June 18, 2018. Forest Inventory and Analysis Database, St.
Paul, MN: U.S. Department of Agriculture, Forest Service, Northern Research Station (Available only on internet:
http://apps.fs.fed.us/fiadb-downloads/datamart.html).
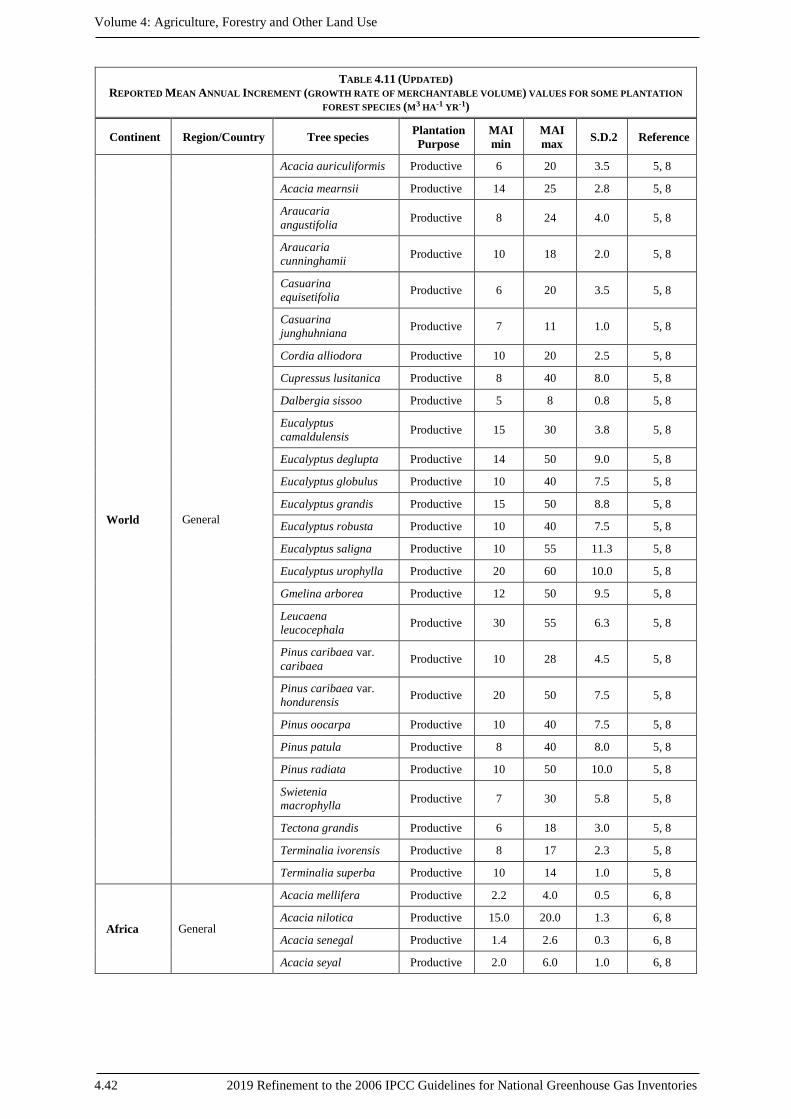
Volume 4: Agriculture, Forestry and Other Land Use
4.42 2019 Refinement to the 2006 IPCC Guidelines for National Greenhouse Gas Inventories
TABLE 4.11 (UPDATED)
REPORTED MEAN ANNUAL INCREMENT (GROWTH RATE OF MERCHANTABLE VOLUME) VALUES FOR SOME PLANTATION
FOREST SPECIES (M3 HA-1 YR-1)
Continent Region/Country Tree species Plantation
Purpose
MAI
min
MAI
max S.D.2 Reference
World General
Acacia auriculiformis Productive 6 20 3.5 5, 8
Acacia mearnsii Productive 14 25 2.8 5, 8
Araucaria
angustifolia Productive 8 24 4.0 5, 8
Araucaria
cunninghamii Productive 10 18 2.0 5, 8
Casuarina
equisetifolia Productive 6 20 3.5 5, 8
Casuarina
junghuhniana Productive 7 11 1.0 5, 8
Cordia alliodora Productive 10 20 2.5 5, 8
Cupressus lusitanica Productive 8 40 8.0 5, 8
Dalbergia sissoo Productive 5 8 0.8 5, 8
Eucalyptus
camaldulensis Productive 15 30 3.8 5, 8
Eucalyptus deglupta Productive 14 50 9.0 5, 8
Eucalyptus globulus Productive 10 40 7.5 5, 8
Eucalyptus grandis Productive 15 50 8.8 5, 8
Eucalyptus robusta Productive 10 40 7.5 5, 8
Eucalyptus saligna Productive 10 55 11.3 5, 8
Eucalyptus urophylla Productive 20 60 10.0 5, 8
Gmelina arborea Productive 12 50 9.5 5, 8
Leucaena
leucocephala Productive 30 55 6.3 5, 8
Pinus caribaea var.
caribaea Productive 10 28 4.5 5, 8
Pinus caribaea var.
hondurensis Productive 20 50 7.5 5, 8
Pinus oocarpa Productive 10 40 7.5 5, 8
Pinus patula Productive 8 40 8.0 5, 8
Pinus radiata Productive 10 50 10.0 5, 8
Swietenia
macrophylla Productive 7 30 5.8 5, 8
Tectona grandis Productive 6 18 3.0 5, 8
Terminalia ivorensis Productive 8 17 2.3 5, 8
Terminalia superba Productive 10 14 1.0 5, 8
Africa General
Acacia mellifera Productive 2.2 4.0 0.5 6, 8
Acacia nilotica Productive 15.0 20.0 1.3 6, 8
Acacia senegal Productive 1.4 2.6 0.3 6, 8
Acacia seyal Productive 2.0 6.0 1.0 6, 8
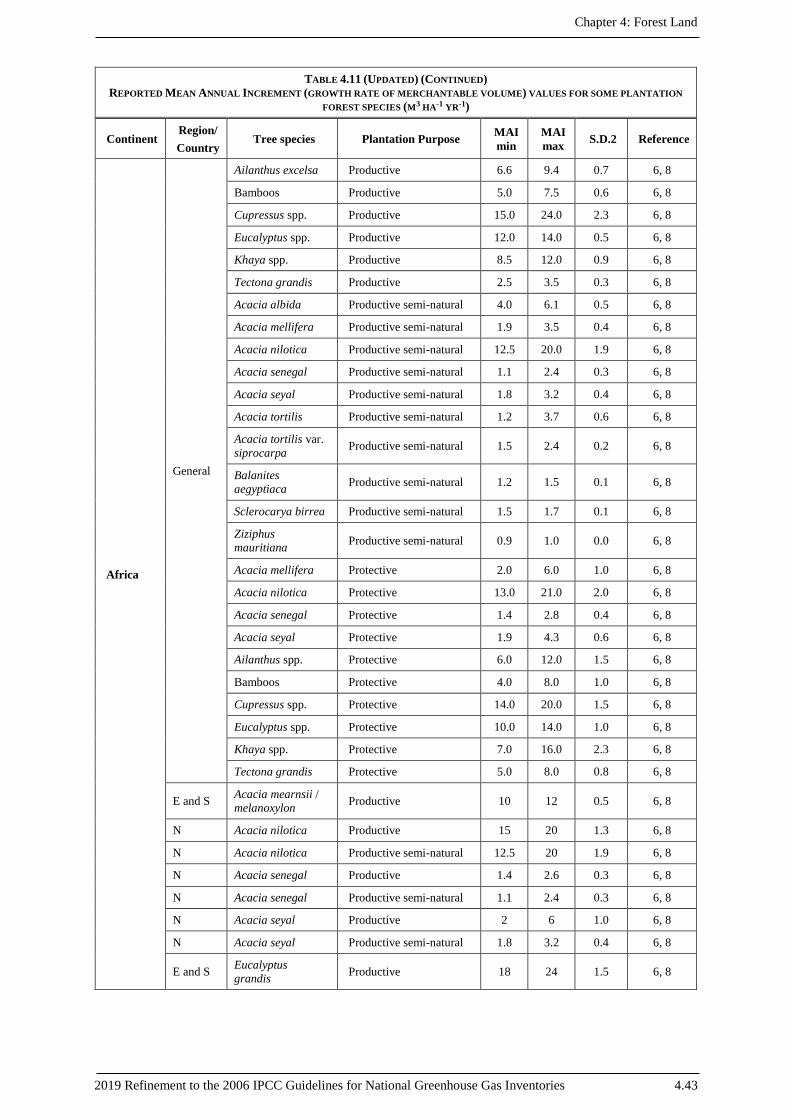
Chapter 4: Forest Land
2019 Refinement to the 2006 IPCC Guidelines for National Greenhouse Gas Inventories 4.43
TABLE 4.11 (UPDATED) (CONTINUED)
REPORTED MEAN ANNUAL INCREMENT (GROWTH RATE OF MERCHANTABLE VOLUME) VALUES FOR SOME PLANTATION
FOREST SPECIES (M3 HA-1 YR-1)
Continent Region/
Country Tree species Plantation Purpose
MAI
min
MAI
max S.D.2 Reference
Africa
General
Ailanthus excelsa Productive 6.6 9.4 0.7 6, 8
Bamboos Productive 5.0 7.5 0.6 6, 8
Cupressus spp. Productive 15.0 24.0 2.3 6, 8
Eucalyptus spp. Productive 12.0 14.0 0.5 6, 8
Khaya spp. Productive 8.5 12.0 0.9 6, 8
Tectona grandis Productive 2.5 3.5 0.3 6, 8
Acacia albida Productive semi-natural 4.0 6.1 0.5 6, 8
Acacia mellifera Productive semi-natural 1.9 3.5 0.4 6, 8
Acacia nilotica Productive semi-natural 12.5 20.0 1.9 6, 8
Acacia senegal Productive semi-natural 1.1 2.4 0.3 6, 8
Acacia seyal Productive semi-natural 1.8 3.2 0.4 6, 8
Acacia tortilis Productive semi-natural 1.2 3.7 0.6 6, 8
Acacia tortilis var.
siprocarpa Productive semi-natural 1.5 2.4 0.2 6, 8
Balanites
aegyptiaca Productive semi-natural 1.2 1.5 0.1 6, 8
Sclerocarya birrea Productive semi-natural 1.5 1.7 0.1 6, 8
Ziziphus
mauritiana Productive semi-natural 0.9 1.0 0.0 6, 8
Acacia mellifera Protective 2.0 6.0 1.0 6, 8
Acacia nilotica Protective 13.0 21.0 2.0 6, 8
Acacia senegal Protective 1.4 2.8 0.4 6, 8
Acacia seyal Protective 1.9 4.3 0.6 6, 8
Ailanthus spp. Protective 6.0 12.0 1.5 6, 8
Bamboos Protective 4.0 8.0 1.0 6, 8
Cupressus spp. Protective 14.0 20.0 1.5 6, 8
Eucalyptus spp. Protective 10.0 14.0 1.0 6, 8
Khaya spp. Protective 7.0 16.0 2.3 6, 8
Tectona grandis Protective 5.0 8.0 0.8 6, 8
E and S Acacia mearnsii /
melanoxylon Productive 10 12 0.5 6, 8
N Acacia nilotica Productive 15 20 1.3 6, 8
N Acacia nilotica Productive semi-natural 12.5 20 1.9 6, 8
N Acacia senegal Productive 1.4 2.6 0.3 6, 8
N Acacia senegal Productive semi-natural 1.1 2.4 0.3 6, 8
N Acacia seyal Productive 2 6 1.0 6, 8
N Acacia seyal Productive semi-natural 1.8 3.2 0.4 6, 8
E and S Eucalyptus
grandis Productive 18 24 1.5 6, 8
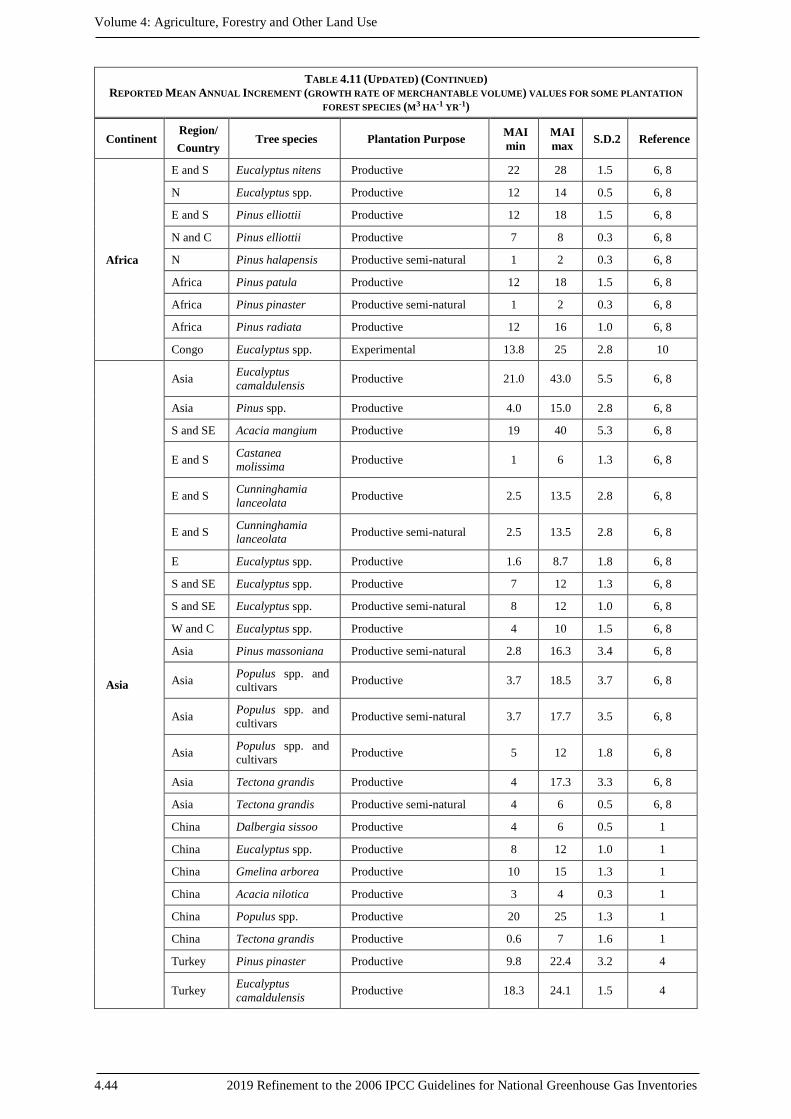
Volume 4: Agriculture, Forestry and Other Land Use
4.44 2019 Refinement to the 2006 IPCC Guidelines for National Greenhouse Gas Inventories
TABLE 4.11 (UPDATED) (CONTINUED)
REPORTED MEAN ANNUAL INCREMENT (GROWTH RATE OF MERCHANTABLE VOLUME) VALUES FOR SOME PLANTATION
FOREST SPECIES (M3 HA-1 YR-1)
Continent Region/
Country Tree species Plantation Purpose
MAI
min
MAI
max S.D.2 Reference
Africa
E and S Eucalyptus nitens Productive 22 28 1.5 6, 8
N Eucalyptus spp. Productive 12 14 0.5 6, 8
E and S Pinus elliottii Productive 12 18 1.5 6, 8
N and C Pinus elliottii Productive 7 8 0.3 6, 8
N Pinus halapensis Productive semi-natural 1 2 0.3 6, 8
Africa Pinus patula Productive 12 18 1.5 6, 8
Africa Pinus pinaster Productive semi-natural 1 2 0.3 6, 8
Africa Pinus radiata Productive 12 16 1.0 6, 8
Congo Eucalyptus spp. Experimental 13.8 25 2.8 10
Asia
Asia Eucalyptus
camaldulensis Productive 21.0 43.0 5.5 6, 8
Asia Pinus spp. Productive 4.0 15.0 2.8 6, 8
S and SE Acacia mangium Productive 19 40 5.3 6, 8
E and S Castanea
molissima Productive 1 6 1.3 6, 8
E and S Cunninghamia
lanceolata Productive 2.5 13.5 2.8 6, 8
E and S Cunninghamia
lanceolata Productive semi-natural 2.5 13.5 2.8 6, 8
E Eucalyptus spp. Productive 1.6 8.7 1.8 6, 8
S and SE Eucalyptus spp. Productive 7 12 1.3 6, 8
S and SE Eucalyptus spp. Productive semi-natural 8 12 1.0 6, 8
W and C Eucalyptus spp. Productive 4 10 1.5 6, 8
Asia Pinus massoniana Productive semi-natural 2.8 16.3 3.4 6, 8
Asia Populus spp. and
cultivars Productive 3.7 18.5 3.7 6, 8
Asia Populus spp. and
cultivars Productive semi-natural 3.7 17.7 3.5 6, 8
Asia Populus spp. and
cultivars Productive 5 12 1.8 6, 8
Asia Tectona grandis Productive 4 17.3 3.3 6, 8
Asia Tectona grandis Productive semi-natural 4 6 0.5 6, 8
China Dalbergia sissoo Productive 4 6 0.5 1
China Eucalyptus spp. Productive 8 12 1.0 1
China Gmelina arborea Productive 10 15 1.3 1
China Acacia nilotica Productive 3 4 0.3 1
China Populus spp. Productive 20 25 1.3 1
China Tectona grandis Productive 0.6 7 1.6 1
Turkey Pinus pinaster Productive 9.8 22.4 3.2 4
Turkey Eucalyptus
camaldulensis Productive 18.3 24.1 1.5 4
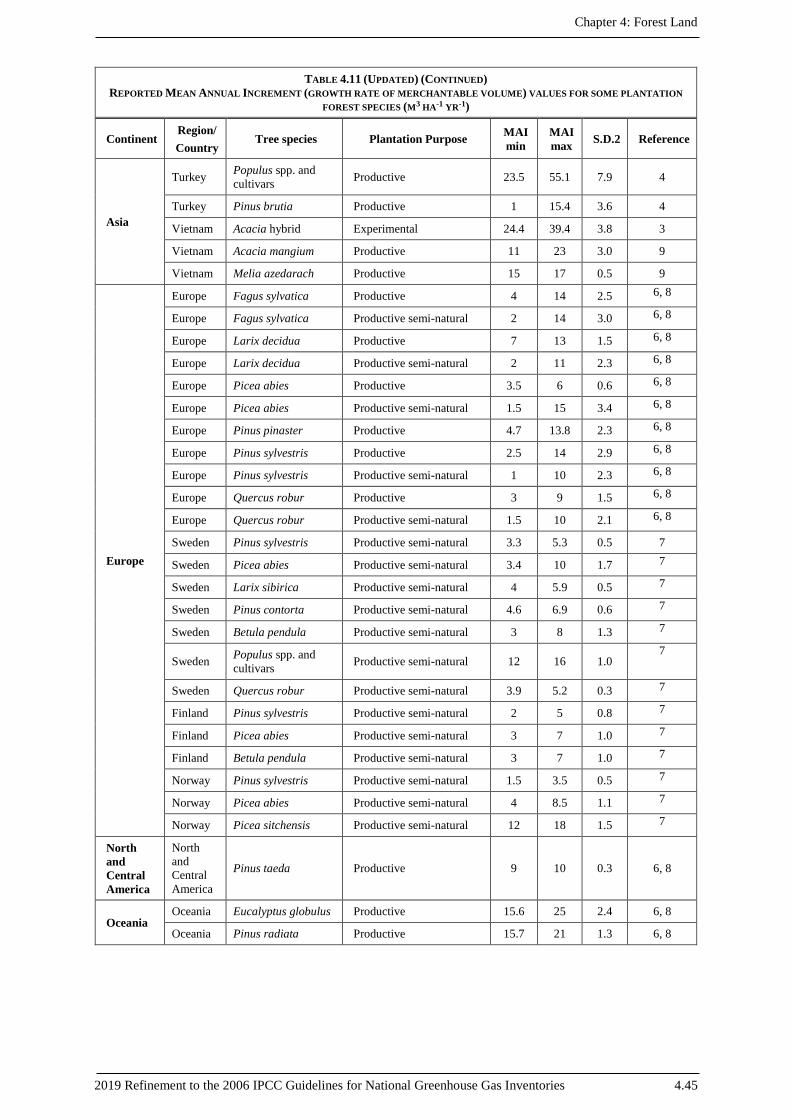
Chapter 4: Forest Land
2019 Refinement to the 2006 IPCC Guidelines for National Greenhouse Gas Inventories 4.45
TABLE 4.11 (UPDATED) (CONTINUED)
REPORTED MEAN ANNUAL INCREMENT (GROWTH RATE OF MERCHANTABLE VOLUME) VALUES FOR SOME PLANTATION
FOREST SPECIES (M3 HA-1 YR-1)
Continent Region/
Country Tree species Plantation Purpose
MAI
min
MAI
max S.D.2 Reference
Asia
Turkey Populus spp. and
cultivars Productive 23.5 55.1 7.9 4
Turkey Pinus brutia Productive 1 15.4 3.6 4
Vietnam Acacia hybrid Experimental 24.4 39.4 3.8 3
Vietnam Acacia mangium Productive 11 23 3.0 9
Vietnam Melia azedarach Productive 15 17 0.5 9
Europe
Europe Fagus sylvatica Productive 4 14 2.5 6, 8
Europe Fagus sylvatica Productive semi-natural 2 14 3.0 6, 8
Europe Larix decidua Productive 7 13 1.5 6, 8
Europe Larix decidua Productive semi-natural 2 11 2.3 6, 8
Europe Picea abies Productive 3.5 6 0.6 6, 8
Europe Picea abies Productive semi-natural 1.5 15 3.4 6, 8
Europe Pinus pinaster Productive 4.7 13.8 2.3 6, 8
Europe Pinus sylvestris Productive 2.5 14 2.9 6, 8
Europe Pinus sylvestris Productive semi-natural 1 10 2.3 6, 8
Europe Quercus robur Productive 3 9 1.5 6, 8
Europe Quercus robur Productive semi-natural 1.5 10 2.1 6, 8
Sweden Pinus sylvestris Productive semi-natural 3.3 5.3 0.5 7
Sweden Picea abies Productive semi-natural 3.4 10 1.7 7
Sweden Larix sibirica Productive semi-natural 4 5.9 0.5 7
Sweden Pinus contorta Productive semi-natural 4.6 6.9 0.6 7
Sweden Betula pendula Productive semi-natural 3 8 1.3 7
Sweden Populus spp. and
cultivars Productive semi-natural 12 16 1.0
7
Sweden Quercus robur Productive semi-natural 3.9 5.2 0.3 7
Finland Pinus sylvestris Productive semi-natural 2 5 0.8 7
Finland Picea abies Productive semi-natural 3 7 1.0 7
Finland Betula pendula Productive semi-natural 3 7 1.0 7
Norway Pinus sylvestris Productive semi-natural 1.5 3.5 0.5 7
Norway Picea abies Productive semi-natural 4 8.5 1.1 7
Norway Picea sitchensis Productive semi-natural 12 18 1.5 7
North
and
Central
America
North
and
Central
America
Pinus taeda Productive 9 10 0.3 6, 8
Oceania Oceania Eucalyptus globulus Productive 15.6 25 2.4 6, 8
Oceania Pinus radiata Productive 15.7 21 1.3 6, 8
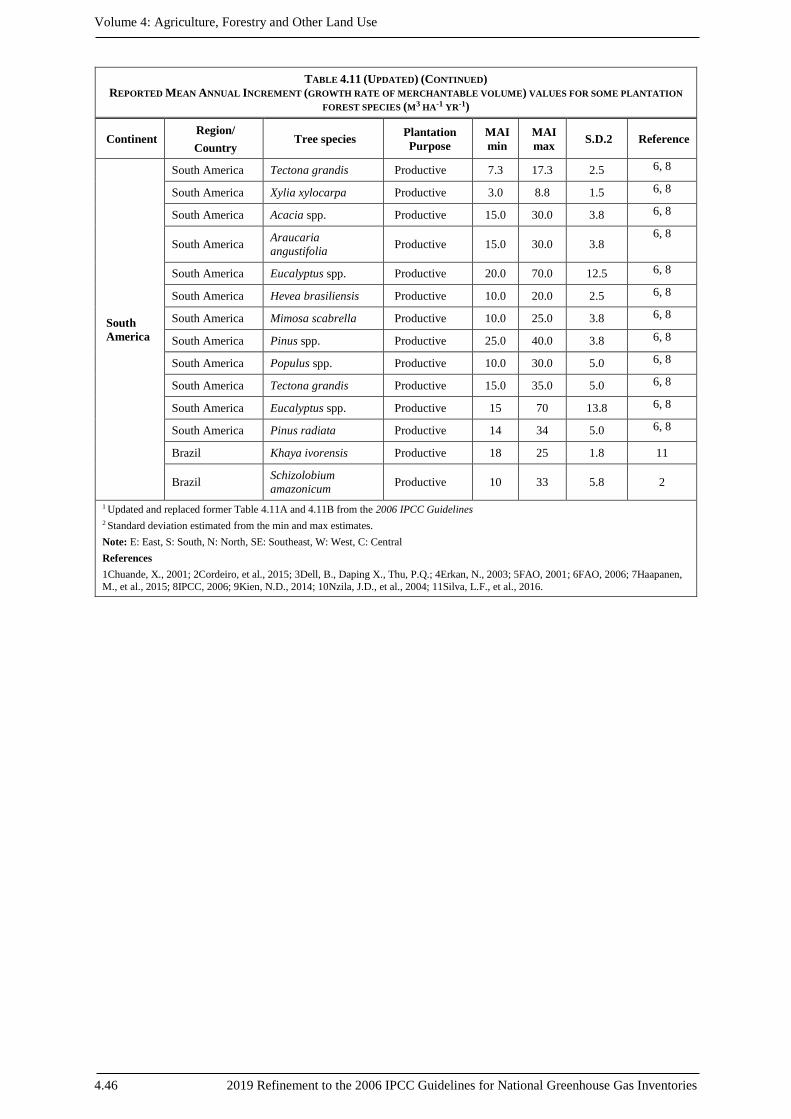
Volume 4: Agriculture, Forestry and Other Land Use
4.46 2019 Refinement to the 2006 IPCC Guidelines for National Greenhouse Gas Inventories
TABLE 4.11 (UPDATED) (CONTINUED)
REPORTED MEAN ANNUAL INCREMENT (GROWTH RATE OF MERCHANTABLE VOLUME) VALUES FOR SOME PLANTATION
FOREST SPECIES (M3 HA-1 YR-1)
Continent Region/
Country Tree species
Plantation
Purpose
MAI
min
MAI
max S.D.2 Reference
South
America
South America Tectona grandis Productive 7.3 17.3 2.5 6, 8
South America Xylia xylocarpa Productive 3.0 8.8 1.5 6, 8
South America Acacia spp. Productive 15.0 30.0 3.8 6, 8
South America Araucaria
angustifolia Productive 15.0 30.0 3.8
6, 8
South America Eucalyptus spp. Productive 20.0 70.0 12.5 6, 8
South America Hevea brasiliensis Productive 10.0 20.0 2.5 6, 8
South America Mimosa scabrella Productive 10.0 25.0 3.8 6, 8
South America Pinus spp. Productive 25.0 40.0 3.8 6, 8
South America Populus spp. Productive 10.0 30.0 5.0 6, 8
South America Tectona grandis Productive 15.0 35.0 5.0 6, 8
South America Eucalyptus spp. Productive 15 70 13.8 6, 8
South America Pinus radiata Productive 14 34 5.0 6, 8
Brazil Khaya ivorensis Productive 18 25 1.8 11
Brazil Schizolobium
amazonicum Productive 10 33 5.8 2
1 Updated and replaced former Table 4.11A and 4.11B from the 2006 IPCC Guidelines
2 Standard deviation estimated from the min and max estimates.
Note: E: East, S: South, N: North, SE: Southeast, W: West, C: Central
References
1Chuande, X., 2001; 2Cordeiro, et al., 2015; 3Dell, B., Daping X., Thu, P.Q.; 4Erkan, N., 2003; 5FAO, 2001; 6FAO, 2006; 7Haapanen,
M., et al., 2015; 8IPCC, 2006; 9Kien, N.D., 2014; 10Nzila, J.D., et al., 2004; 11Silva, L.F., et al., 2016.
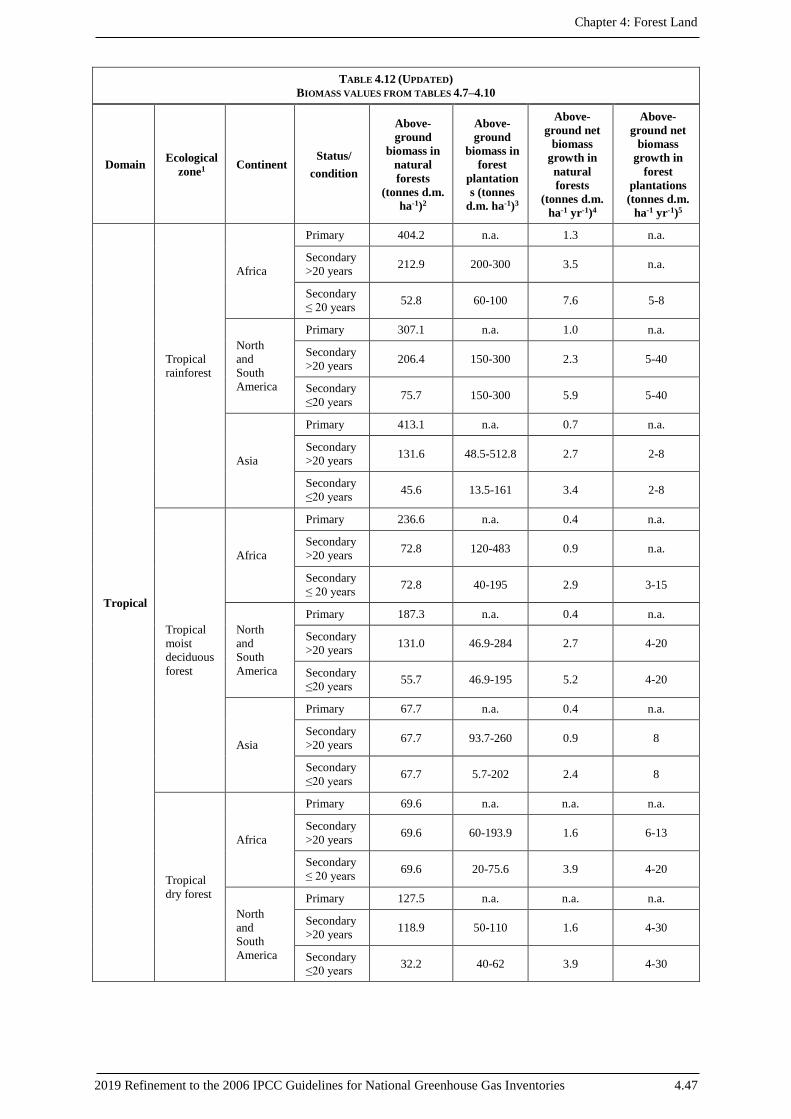
Chapter 4: Forest Land
2019 Refinement to the 2006 IPCC Guidelines for National Greenhouse Gas Inventories 4.47
TABLE 4.12 (UPDATED)
BIOMASS VALUES FROM TABLES 4.7–4.10
Domain Ecological
zone1 Continent
Status/
condition
Above-
ground
biomass in
natural
forests
(tonnes d.m.
ha-1)2
Above-
ground
biomass in
forest
plantation
s (tonnes
d.m. ha-1)3
Above-
ground net
biomass
growth in
natural
forests
(tonnes d.m.
ha-1 yr-1)4
Above-
ground net
biomass
growth in
forest
plantations
(tonnes d.m.
ha-1 yr-1)5
Tropical
Tropical
rainforest
Africa
Primary 404.2 n.a. 1.3 n.a.
Secondary
>20 years 212.9 200-300 3.5 n.a.
Secondary
≤ 20 years 52.8 60-100 7.6 5-8
North
and
South
America
Primary 307.1 n.a. 1.0 n.a.
Secondary
>20 years 206.4 150-300 2.3 5-40
Secondary
≤20 years 75.7 150-300 5.9 5-40
Asia
Primary 413.1 n.a. 0.7 n.a.
Secondary
>20 years 131.6 48.5-512.8 2.7 2-8
Secondary
≤20 years 45.6 13.5-161 3.4 2-8
Tropical
moist
deciduous
forest
Africa
Primary 236.6 n.a. 0.4 n.a.
Secondary
>20 years 72.8 120-483 0.9 n.a.
Secondary
≤ 20 years 72.8 40-195 2.9 3-15
North
and
South
America
Primary 187.3 n.a. 0.4 n.a.
Secondary
>20 years 131.0 46.9-284 2.7 4-20
Secondary
≤20 years 55.7 46.9-195 5.2 4-20
Asia
Primary 67.7 n.a. 0.4 n.a.
Secondary
>20 years 67.7 93.7-260 0.9 8
Secondary
≤20 years 67.7 5.7-202 2.4 8
Tropical
dry forest
Africa
Primary 69.6 n.a. n.a. n.a.
Secondary
>20 years 69.6 60-193.9 1.6 6-13
Secondary
≤ 20 years 69.6 20-75.6 3.9 4-20
North
and
South
America
Primary 127.5 n.a. n.a. n.a.
Secondary
>20 years 118.9 50-110 1.6 4-30
Secondary
≤20 years 32.2 40-62 3.9 4-30
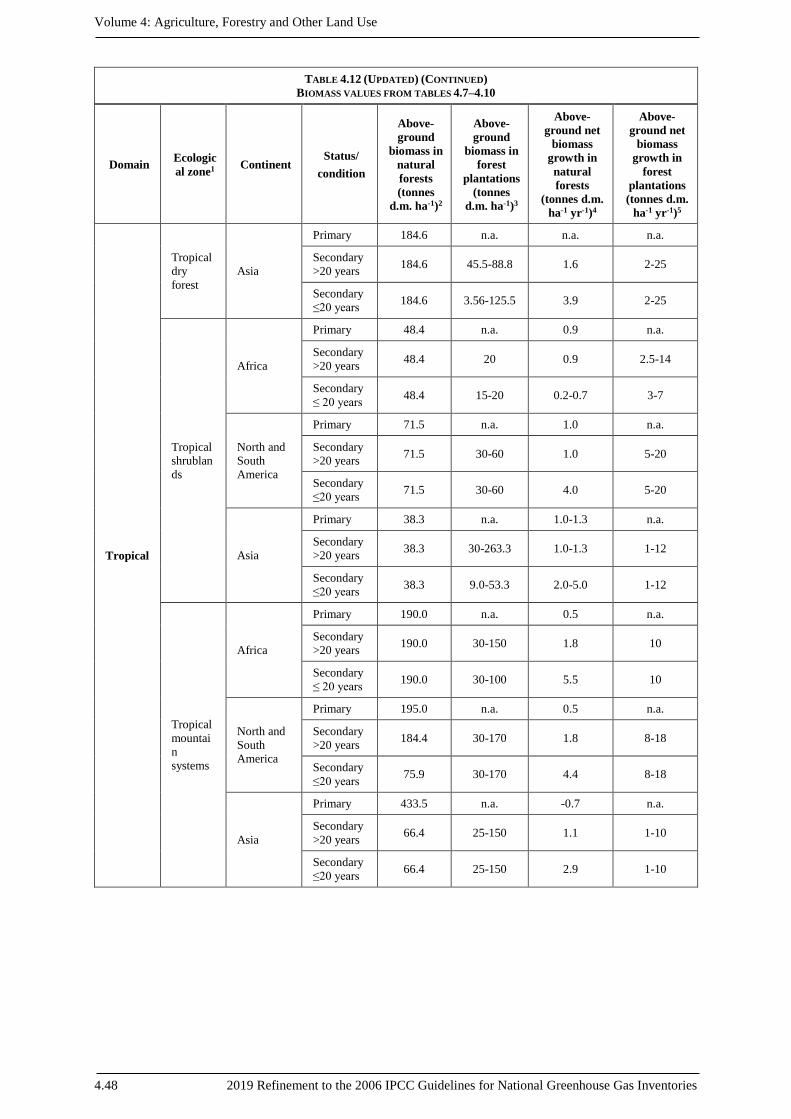
Volume 4: Agriculture, Forestry and Other Land Use
4.48 2019 Refinement to the 2006 IPCC Guidelines for National Greenhouse Gas Inventories
TABLE 4.12 (UPDATED) (CONTINUED)
BIOMASS VALUES FROM TABLES 4.7–4.10
Domain Ecologic
al zone1 Continent
Status/
condition
Above-
ground
biomass in
natural
forests
(tonnes
d.m. ha-1)2
Above-
ground
biomass in
forest
plantations
(tonnes
d.m. ha-1)3
Above-
ground net
biomass
growth in
natural
forests
(tonnes d.m.
ha-1 yr-1)4
Above-
ground net
biomass
growth in
forest
plantations
(tonnes d.m.
ha-1 yr-1)5
Tropical
Tropical
dry
forest
Asia
Primary 184.6 n.a. n.a. n.a.
Secondary
>20 years 184.6 45.5-88.8 1.6 2-25
Secondary
≤20 years 184.6 3.56-125.5 3.9 2-25
Tropical
shrublan
ds
Africa
Primary 48.4 n.a. 0.9 n.a.
Secondary
>20 years 48.4 20 0.9 2.5-14
Secondary
≤ 20 years 48.4 15-20 0.2-0.7 3-7
North and
South
America
Primary 71.5 n.a. 1.0 n.a.
Secondary
>20 years 71.5 30-60 1.0 5-20
Secondary
≤20 years 71.5 30-60 4.0 5-20
Asia
Primary 38.3 n.a. 1.0-1.3 n.a.
Secondary
>20 years 38.3 30-263.3 1.0-1.3 1-12
Secondary
≤20 years 38.3 9.0-53.3 2.0-5.0 1-12
Tropical
mountai
n
systems
Africa
Primary 190.0 n.a. 0.5 n.a.
Secondary
>20 years 190.0 30-150 1.8 10
Secondary
≤ 20 years 190.0 30-100 5.5 10
North and
South
America
Primary 195.0 n.a. 0.5 n.a.
Secondary
>20 years 184.4 30-170 1.8 8-18
Secondary
≤20 years 75.9 30-170 4.4 8-18
Asia
Primary 433.5 n.a. -0.7 n.a.
Secondary
>20 years 66.4 25-150 1.1 1-10
Secondary
≤20 years 66.4 25-150 2.9 1-10
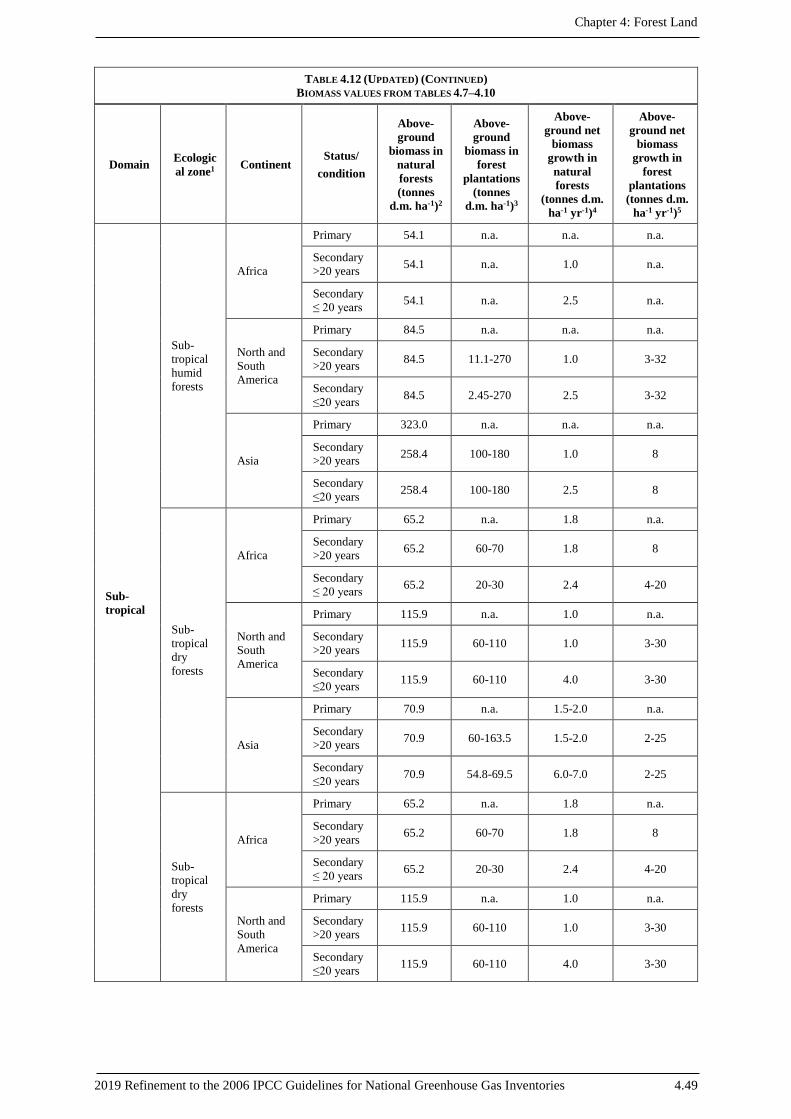
Chapter 4: Forest Land
2019 Refinement to the 2006 IPCC Guidelines for National Greenhouse Gas Inventories 4.49
TABLE 4.12 (UPDATED) (CONTINUED)
BIOMASS VALUES FROM TABLES 4.7–4.10
Domain Ecologic
al zone1 Continent
Status/
condition
Above-
ground
biomass in
natural
forests
(tonnes
d.m. ha-1)2
Above-
ground
biomass in
forest
plantations
(tonnes
d.m. ha-1)3
Above-
ground net
biomass
growth in
natural
forests
(tonnes d.m.
ha-1 yr-1)4
Above-
ground net
biomass
growth in
forest
plantations
(tonnes d.m.
ha-1 yr-1)5
Sub-
tropical
Sub-
tropical
humid
forests
Africa
Primary 54.1 n.a. n.a. n.a.
Secondary
>20 years 54.1 n.a. 1.0 n.a.
Secondary
≤ 20 years 54.1 n.a. 2.5 n.a.
North and
South
America
Primary 84.5 n.a. n.a. n.a.
Secondary
>20 years 84.5 11.1-270 1.0 3-32
Secondary
≤20 years 84.5 2.45-270 2.5 3-32
Asia
Primary 323.0 n.a. n.a. n.a.
Secondary
>20 years 258.4 100-180 1.0 8
Secondary
≤20 years 258.4 100-180 2.5 8
Sub-
tropical
dry
forests
Africa
Primary 65.2 n.a. 1.8 n.a.
Secondary
>20 years 65.2 60-70 1.8 8
Secondary
≤ 20 years 65.2 20-30 2.4 4-20
North and
South
America
Primary 115.9 n.a. 1.0 n.a.
Secondary
>20 years 115.9 60-110 1.0 3-30
Secondary
≤20 years 115.9 60-110 4.0 3-30
Asia
Primary 70.9 n.a. 1.5-2.0 n.a.
Secondary
>20 years 70.9 60-163.5 1.5-2.0 2-25
Secondary
≤20 years 70.9 54.8-69.5 6.0-7.0 2-25
Sub-
tropical
dry
forests
Africa
Primary 65.2 n.a. 1.8 n.a.
Secondary
>20 years 65.2 60-70 1.8 8
Secondary
≤ 20 years 65.2 20-30 2.4 4-20
North and
South
America
Primary 115.9 n.a. 1.0 n.a.
Secondary
>20 years 115.9 60-110 1.0 3-30
Secondary
≤20 years 115.9 60-110 4.0 3-30
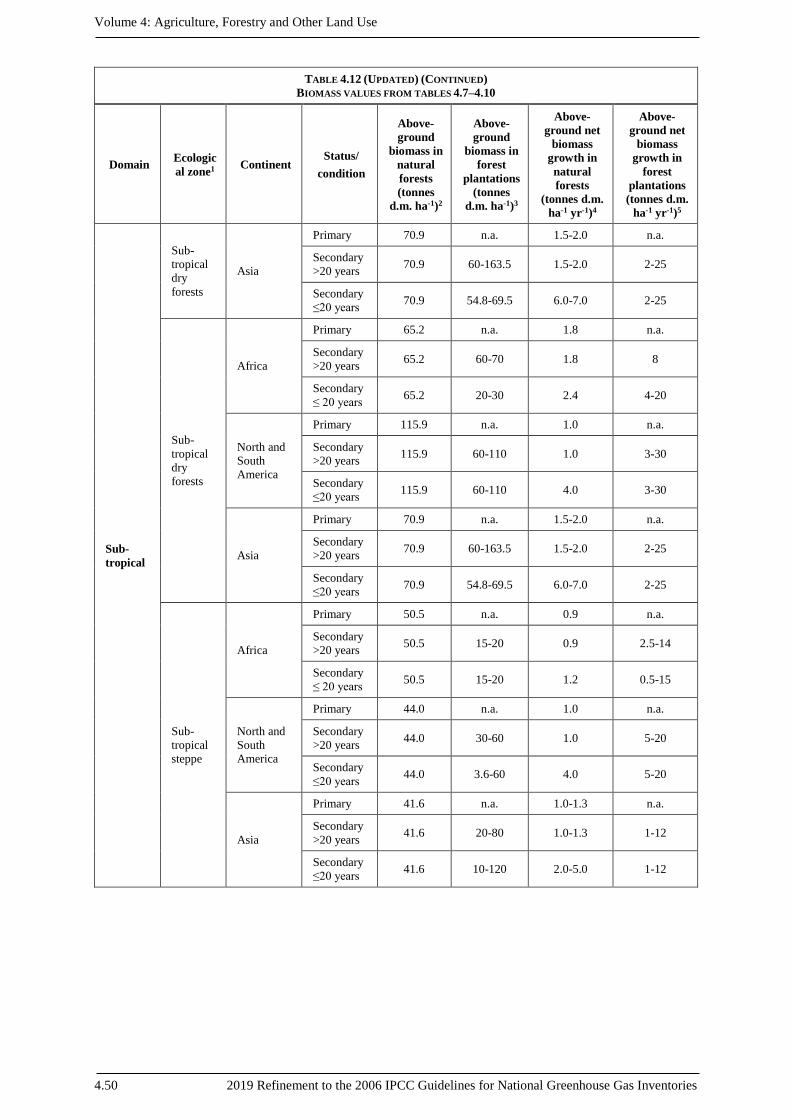
Volume 4: Agriculture, Forestry and Other Land Use
4.50 2019 Refinement to the 2006 IPCC Guidelines for National Greenhouse Gas Inventories
TABLE 4.12 (UPDATED) (CONTINUED)
BIOMASS VALUES FROM TABLES 4.7–4.10
Domain Ecologic
al zone1 Continent
Status/
condition
Above-
ground
biomass in
natural
forests
(tonnes
d.m. ha-1)2
Above-
ground
biomass in
forest
plantations
(tonnes
d.m. ha-1)3
Above-
ground net
biomass
growth in
natural
forests
(tonnes d.m.
ha-1 yr-1)4
Above-
ground net
biomass
growth in
forest
plantations
(tonnes d.m.
ha-1 yr-1)5
Sub-
tropical
Sub-
tropical
dry
forests
Asia
Primary 70.9 n.a. 1.5-2.0 n.a.
Secondary
>20 years 70.9 60-163.5 1.5-2.0 2-25
Secondary
≤20 years 70.9 54.8-69.5 6.0-7.0 2-25
Sub-
tropical
dry
forests
Africa
Primary 65.2 n.a. 1.8 n.a.
Secondary
>20 years 65.2 60-70 1.8 8
Secondary
≤ 20 years 65.2 20-30 2.4 4-20
North and
South
America
Primary 115.9 n.a. 1.0 n.a.
Secondary
>20 years 115.9 60-110 1.0 3-30
Secondary
≤20 years 115.9 60-110 4.0 3-30
Asia
Primary 70.9 n.a. 1.5-2.0 n.a.
Secondary
>20 years 70.9 60-163.5 1.5-2.0 2-25
Secondary
≤20 years 70.9 54.8-69.5 6.0-7.0 2-25
Sub-
tropical
steppe
Africa
Primary 50.5 n.a. 0.9 n.a.
Secondary
>20 years 50.5 15-20 0.9 2.5-14
Secondary
≤ 20 years 50.5 15-20 1.2 0.5-15
North and
South
America
Primary 44.0 n.a. 1.0 n.a.
Secondary
>20 years 44.0 30-60 1.0 5-20
Secondary
≤20 years 44.0 3.6-60 4.0 5-20
Asia
Primary 41.6 n.a. 1.0-1.3 n.a.
Secondary
>20 years 41.6 20-80 1.0-1.3 1-12
Secondary
≤20 years 41.6 10-120 2.0-5.0 1-12
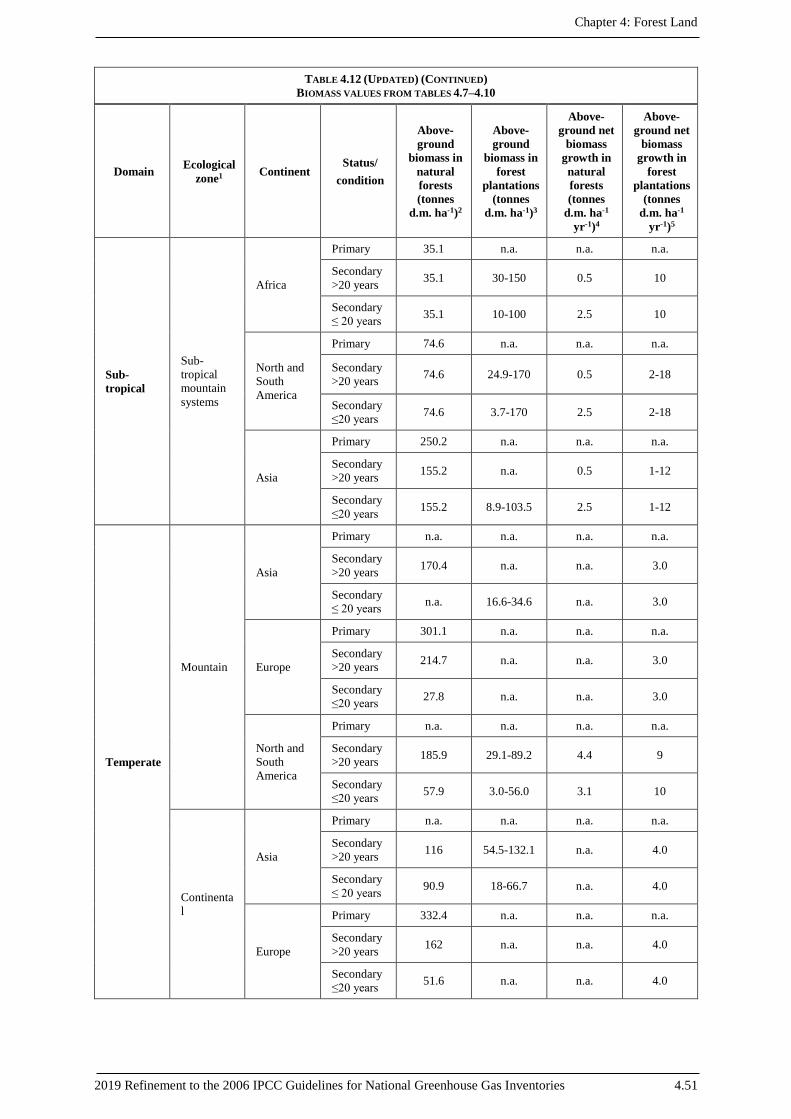
Chapter 4: Forest Land
2019 Refinement to the 2006 IPCC Guidelines for National Greenhouse Gas Inventories 4.51
TABLE 4.12 (UPDATED) (CONTINUED)
BIOMASS VALUES FROM TABLES 4.7–4.10
Domain Ecological
zone1 Continent
Status/
condition
Above-
ground
biomass in
natural
forests
(tonnes
d.m. ha-1)2
Above-
ground
biomass in
forest
plantations
(tonnes
d.m. ha-1)3
Above-
ground net
biomass
growth in
natural
forests
(tonnes
d.m. ha-1
yr-1)4
Above-
ground net
biomass
growth in
forest
plantations
(tonnes
d.m. ha-1
yr-1)5
Sub-
tropical
Sub-
tropical
mountain
systems
Africa
Primary 35.1 n.a. n.a. n.a.
Secondary
>20 years 35.1 30-150 0.5 10
Secondary
≤ 20 years 35.1 10-100 2.5 10
North and
South
America
Primary 74.6 n.a. n.a. n.a.
Secondary
>20 years 74.6 24.9-170 0.5 2-18
Secondary
≤20 years 74.6 3.7-170 2.5 2-18
Asia
Primary 250.2 n.a. n.a. n.a.
Secondary
>20 years 155.2 n.a. 0.5 1-12
Secondary
≤20 years 155.2 8.9-103.5 2.5 1-12
Temperate
Mountain
Asia
Primary n.a. n.a. n.a. n.a.
Secondary
>20 years 170.4 n.a. n.a. 3.0
Secondary
≤ 20 years n.a. 16.6-34.6 n.a. 3.0
Europe
Primary 301.1 n.a. n.a. n.a.
Secondary
>20 years 214.7 n.a. n.a. 3.0
Secondary
≤20 years 27.8 n.a. n.a. 3.0
North and
South
America
Primary n.a. n.a. n.a. n.a.
Secondary
>20 years 185.9 29.1-89.2 4.4 9
Secondary
≤20 years 57.9 3.0-56.0 3.1 10
Continenta
l
Asia
Primary n.a. n.a. n.a. n.a.
Secondary
>20 years 116 54.5-132.1 n.a. 4.0
Secondary
≤ 20 years 90.9 18-66.7 n.a. 4.0
Europe
Primary 332.4 n.a. n.a. n.a.
Secondary
>20 years 162 n.a. n.a. 4.0
Secondary
≤20 years 51.6 n.a. n.a. 4.0
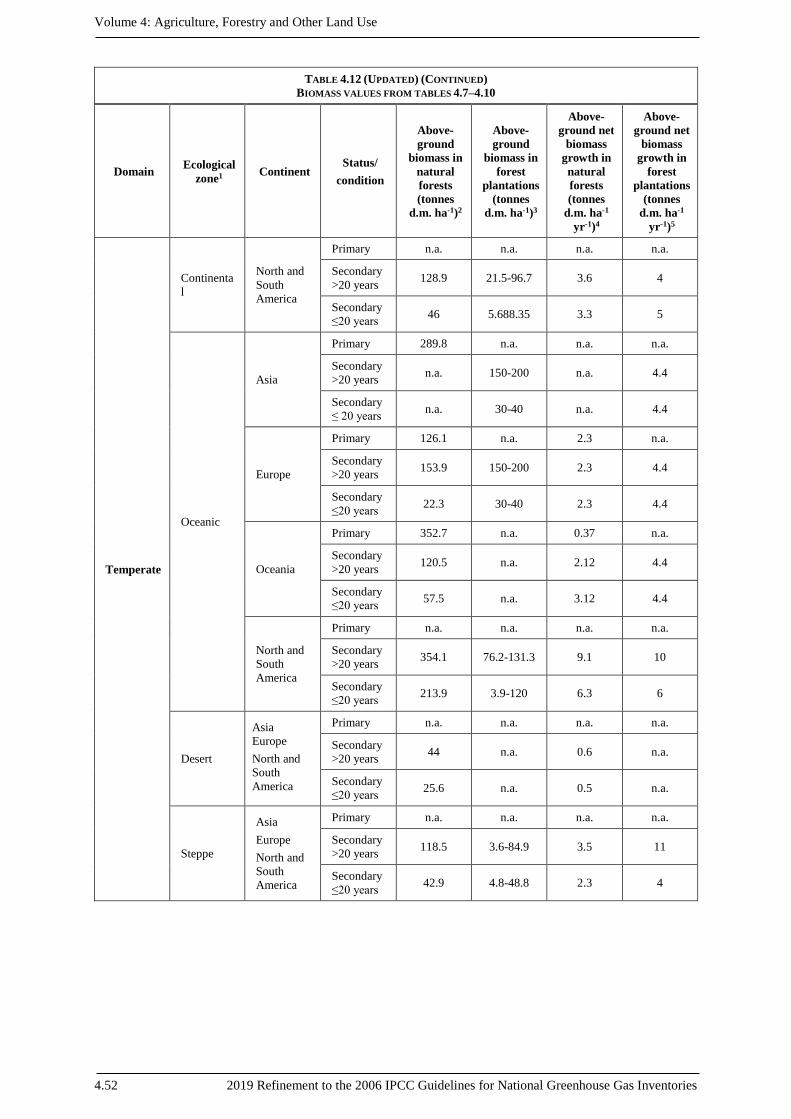
Volume 4: Agriculture, Forestry and Other Land Use
4.52 2019 Refinement to the 2006 IPCC Guidelines for National Greenhouse Gas Inventories
TABLE 4.12 (UPDATED) (CONTINUED)
BIOMASS VALUES FROM TABLES 4.7–4.10
Domain Ecological
zone1 Continent
Status/
condition
Above-
ground
biomass in
natural
forests
(tonnes
d.m. ha-1)2
Above-
ground
biomass in
forest
plantations
(tonnes
d.m. ha-1)3
Above-
ground net
biomass
growth in
natural
forests
(tonnes
d.m. ha-1
yr-1)4
Above-
ground net
biomass
growth in
forest
plantations
(tonnes
d.m. ha-1
yr-1)5
Temperate
Continenta
l
North and
South
America
Primary n.a. n.a. n.a. n.a.
Secondary
>20 years 128.9 21.5-96.7 3.6 4
Secondary
≤20 years 46 5.688.35 3.3 5
Oceanic
Asia
Primary 289.8 n.a. n.a. n.a.
Secondary
>20 years n.a. 150-200 n.a. 4.4
Secondary
≤ 20 years n.a. 30-40 n.a. 4.4
Europe
Primary 126.1 n.a. 2.3 n.a.
Secondary
>20 years 153.9 150-200 2.3 4.4
Secondary
≤20 years 22.3 30-40 2.3 4.4
Oceania
Primary 352.7 n.a. 0.37 n.a.
Secondary
>20 years 120.5 n.a. 2.12 4.4
Secondary
≤20 years 57.5 n.a. 3.12 4.4
North and
South
America
Primary n.a. n.a. n.a. n.a.
Secondary
>20 years 354.1 76.2-131.3 9.1 10
Secondary
≤20 years 213.9 3.9-120 6.3 6
Desert
Asia
Europe
North and
South
America
Primary n.a. n.a. n.a. n.a.
Secondary
>20 years 44 n.a. 0.6 n.a.
Secondary
≤20 years 25.6 n.a. 0.5 n.a.
Steppe
Asia
Europe
North and
South
America
Primary n.a. n.a. n.a. n.a.
Secondary
>20 years 118.5 3.6-84.9 3.5 11
Secondary
≤20 years 42.9 4.8-48.8 2.3 4
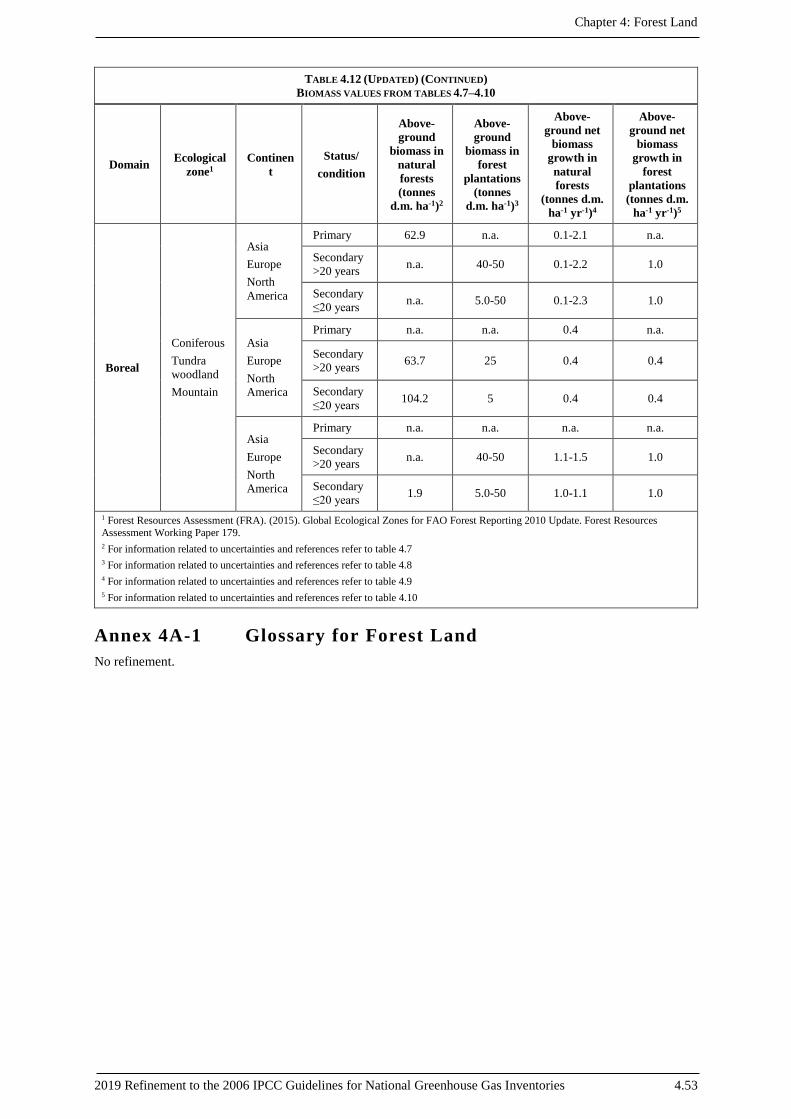
Chapter 4: Forest Land
2019 Refinement to the 2006 IPCC Guidelines for National Greenhouse Gas Inventories 4.53
TABLE 4.12 (UPDATED) (CONTINUED)
BIOMASS VALUES FROM TABLES 4.7–4.10
Domain Ecological
zone1
Continen
t
Status/
condition
Above-
ground
biomass in
natural
forests
(tonnes
d.m. ha-1)2
Above-
ground
biomass in
forest
plantations
(tonnes
d.m. ha-1)3
Above-
ground net
biomass
growth in
natural
forests
(tonnes d.m.
ha-1 yr-1)4
Above-
ground net
biomass
growth in
forest
plantations
(tonnes d.m.
ha-1 yr-1)5
Boreal
Coniferous
Tundra
woodland
Mountain
Asia
Europe
North
America
Primary 62.9 n.a. 0.1-2.1 n.a.
Secondary
>20 years n.a. 40-50 0.1-2.2 1.0
Secondary
≤20 years n.a. 5.0-50 0.1-2.3 1.0
Asia
Europe
North
America
Primary n.a. n.a. 0.4 n.a.
Secondary
>20 years 63.7 25 0.4 0.4
Secondary
≤20 years 104.2 5 0.4 0.4
Asia
Europe
North
America
Primary n.a. n.a. n.a. n.a.
Secondary
>20 years n.a. 40-50 1.1-1.5 1.0
Secondary
≤20 years 1.9 5.0-50 1.0-1.1 1.0
1 Forest Resources Assessment (FRA). (2015). Global Ecological Zones for FAO Forest Reporting 2010 Update. Forest Resources
Assessment Working Paper 179.
2 For information related to uncertainties and references refer to table 4.7 3 For information related to uncertainties and references refer to table 4.8
4 For information related to uncertainties and references refer to table 4.9
5 For information related to uncertainties and references refer to table 4.10
Annex 4A-1 Glossary for Forest Land
No refinement.
Volume 4: Agriculture, Forestry and Other Land Use
4.54 2019 Refinement to the 2006 IPCC Guidelines for National Greenhouse Gas Inventories
References
REFERENCES NEWLY CITED IN THE 2019 REFINEMENT
Soil C References
Achat, D. L., Deleuze, C., Landmann, G., Pousse, N., Ranger, J., and Augusto, L. (2015b). Quantifying
consequences of removing harvesting residues on forest soils and tree growth–A meta-analysis. Forest Ecology
and Management 348: 124–141.
Achat, D.L., Fortin, M., Landmann, G., Ringeval, B. and Augusto, L. (2015a). Forest soil carbon is threatened by
intensive biomass harvesting. Scientific Reports 5, 15991.
Clarke, N., Gundersen, P., Jönsson-Belyazid, U., Kjønaas, O. J., Persson, T., Sigurdsson, B. D., ... and Vesterdal,
L. (2015). Influence of different tree-harvesting intensities on forest soil carbon stocks in boreal and northern
temperate forest ecosystems. Forest Ecology and Management 351: 9–19.
Dean, C., Kirkpatrick, J. B. and Friedland, A. J. (2017). Conventional intensive logging promotes loss of organic
carbon from the mineral soil. Global Change Biology 23: 1–11.
De Vos, B., Cools, N., Ilvesniemi, H., Vesterdal, L., Vanguelova, E. and Carnicelli. S. (2015). Benchmark values
for forest soil carbon stocks in Europe: Results from a large scale forest soil survey. Geoderma 251: 33–46.
Falloon, P. and Smith, P. (2003). Accounting for changes in soil carbon under the Kyoto Protocol: need for
improved long‐term data sets to reduce uncertainty in model projections. Soil Use and Management 19: 265–
269.
Gross, C. D., James, J.N.,Turnblom, E. C. and Harrison, R.B. (2018). Thinning treatments reduce deep soil carbon
and nitrogen stocks in a Coastal Pacific Northwest forest. Forests 9(5): 238.
Hume, A. M., Chen, H.Y.H. and Taylor, A.R. (2017). Intensive forest harvesting increases susceptibility of
northern forest soils to carbon, nitrogen and phosphorus loss. Journal of Applied Ecology.
James, J. and Harrison, R. (2016). The effect of harvest on forest soil carbon: A meta-analysis. Forests 7(12): 308.
Jandl, R., Lindner, M., Vesterdal, L., Bauwens, B., Baritz, R., Hagedorn, F., Johnson, D.W., Minkkinen, K. and
Byrne, K. A. (2007). How strongly can forest management influence soil carbon sequestration? Geoderma
137(3): 253–268.
Johnson, D.W. and Curtis, P.S. (2001). Effects of forest management on soil C and N storage: meta-analysis.
Forest Ecology and Management 140: 227–238.
Lehtonen, A., Heikkinen, J., (2015). Uncertainty of upland soil carbon sink estimate for Finland. Canadian Journal
of Forest Research 46: 310–322.
Liao, C., Luo, Y., Fang, C., and Li, B. (2010). Ecosystem carbon stock influenced by plantation practice:
implications for planting forests as a measure of climate change mitigation. PloS one 5(5): e10867.
Metsaranta, J.M., Shaw, C., Kurz, W.A., Boisvenue, C. and Morken, S., 2017. Uncertainty of inventory-based
estimates of the carbon dynamics of Canada’s managed forest (1990–2014). Canadian Journal of Forest
Research 47: 1082–1094.
Monte, L., Håkanson, L., Bergström, U., Brittain, J. and Heling, R. (1996). Uncertainty analysis and validation of
environmental models: the empirically based uncertainty analysis. Ecological Modelling 91: 139–152.
Nave, L. E., Vance, E. D., Swanston, C. W., and Curtis, P. S. (2010). Harvest impacts on soil carbon storage in
temperate forests. Forest Ecology and Management 259(5): 857–866.
Nepstad, D.C., de Carvalho, C.R., Davidson, E.A., Jipp, P.H., Lefebvre, P.A., Negelros, G.H., da Silva, E.D.,
Stone, T.A., Trumbore, S.E. and Vieira, S. (1994). The role of deep roots in the hydrological and carbon cycles
of Amazonian forests and pastures. Nature 372: 666–669.
Ogle, S.M., Breidt, F.J., Easter, M., Williams, S. and Paustian, K. (2007). An empirically based approach for
estimating uncertainty associated with modelling carbon sequestration in soils. Ecological Modelling 205:
453–463.
Peltoniemi, M., Palosuo, T., Monni, S. and Mäkipää, R. (2006). Factors affecting the uncertainty of sinks and
stocks of carbon in Finnish forests soils and vegetation. Forest Ecology and Management 232: 75–85.
Smith, J.E. and Heath, L.S. (2001). Identifying influences on model uncertainty: an application using a forest
carbon budget model. Environmental Management 27: 253–267.
Chapter 4: Forest Land
2019 Refinement to the 2006 IPCC Guidelines for National Greenhouse Gas Inventories 4.55
Stewart, C., Paustian, K., Conant, R., Plante, A. and Six, J. (2007). Soil carbon saturation: concept, evidence and
evaluation. Biogeochemistry 86(1): 19–31.
Strömgren, M., Egnell, G., and Olsson, B. A. (2013). Carbon stocks in four forest stands in Sweden 25 years after
harvesting of slash and stumps. Forest Ecology and Management 290: 59–66.
Thiffault, E., Hannam, K. D., Paré, D., Titus, B. D., Hazlett, P. W., Maynard, D. G., and Brais, S. (2011). Effects
of forest biomass harvesting on soil productivity in boreal and temperate forests—a review. Environmental
Reviews 19(NA): 278–309.
Villarino, S.H., Studdert, G.A., Laterra, P. and Cendoya, M.G. (2014). Agricultural impact on soil organic carbon
content: Testing the IPCC carbon accounting method for evaluations at county scale. Agriculture, ecosystems
& environment 185: 118–132.
Zhou, D., Zhao, S. Q., Liu, S., and Oeding, J. (2013). A meta-analysis on the impacts of partial cutting on forest
structure and carbon storage, Biogeosciences 10: 3691–3703.
Updated table 4.4.
Battles, J. J., Armesto, J. J., Vann, D. R., Zarin, D. J., Aravena, J. C., Pérez, C., Johnson, A. H. (2002). Vegetation
composition, structure, and biomass of two unpolluted watersheds in the Cordillera de Piuchué, Chiloé Island,
Chile. Plant Ecology, 158(1): 5-19.
Beets, P. N. (1980). Amount and distribution of dry matter in a mature beech/podocarp community. New Zealand
Journal of Forestry Science, 10(2): 395-418.
Beets, P. N., Pearce, S. H., Oliver, G. R., Clinton, P. W. (2007). Root/shoot ratios for deriving below-ground
biomass of Pinus radiata stands. New Zealand Journal of Forestry Science, 37(2): 267-288.
Cotillas, M., Espelta, J. M., Sánchez-Costa, E., Sabaté, S. (2016). Aboveground and belowground biomass
allocation patterns in two Mediterranean oaks with contrasting leaf habit: an insight into carbon stock in young
oak coppices. European Journal of Forest Research, 135(2): 243-252.
Edwards, P. J., Grubb, P. J. (1977). Studies of Mineral Cycling in a Montane Rain Forest in New Guinea: I. The
Distribution of Organic Matter in the Vegetation and Soil. The Journal of Ecology, 65(3): 943-969.
Food and Agriculture Organization (FA0) (Ed.) (2015). The Global Forest Resources Assessment. Rome, Italy:
Food and Agriculture Office of the United Nations.
Forest Resources Assessment (FRA). (2015). Global Eological Zones for FAO Forest Reporting 2010 Update.
Forest Resources Assessment Working Paper 179.
Frangi, J. L., Barrera, M. D., Puigdefábregas, J., Yapura, P. F., Arambarri, A. M., Richter, L. (2004). Ecología de
los bosques de Tierra del Fuego. Ecología y Manejo de los Bosques de Argentina. La Plata, Argentina. Editorial
de la Universidad Nacional de La Plata.
Gargaglione, V., Peri, P. L., Rubio, G. (2010). Allometric relations for biomass partitioning of Nothofagus
antarctica trees of different crown classes over a site quality gradient. Forest Ecology and Management, 259(6):
1118-1126.
Gautam, T. P., Mandal, T. N. (2016). Effect of disturbance on biomass, production and carbon dynamics in moist
tropical forest of eastern Nepal. Forest Ecosystems, 3(1): 11.
Green, C., Tobin, B., O’Shea, M., Farrell, E. P., Byrne, K. A. (2007). Above- and belowground biomass
measurements in an unthinned stand of Sitka spruce (Picea sitchensis (Bong) Carr.). European Journal of
Forest Research, 126(2): 179-188.
Grimm, U., Fassbender, H. W. (1981). Ciclos biogeoquimicos en un ecosistema forestal de los Andes Occidentales
de Venezuela. III. Ciclo hidrologico y translocacion de elementos quimicos con el agua. Turrialba, 31: 89-99.
Iqbal, K., Bhat, J. A., Pala, N. A., Hussain, A., Negi, A. K. (2014). Carbon and Biomass Density of Trees in
Duggada Area of Garhwal Himalaya, India. Indian Forester, 140(1): 18-22.
Kotowska, M. M., Leuschner, C., Triadiati, T., Meriem, S., Hertel, D. (2015). Quantifying above- and
belowground biomass carbon loss with forest conversion in tropical lowlands of Sumatra (Indonesia). Glob
Chang Biol, 21(10): 3620-3634.
Krisnawati, H., Adinugroho, W. C., Imanuddin, R., Hutabarat, S. (2014). Estimation of Forest Biomass for
Quantifying CO2 Emissions in Central Kalimantan. Indonesia: Forestry Research and Development Agency.
Laclau, P. (2003). Biomass and carbon sequestration of ponderosa pine plantations and native cypress forests in
northwest Patagonia. Forest Ecology and Management, 180(1): 317-333.
Volume 4: Agriculture, Forestry and Other Land Use
4.56 2019 Refinement to the 2006 IPCC Guidelines for National Greenhouse Gas Inventories
Levy, P. E., Hale, S. E., Nicoll, B. C. (2004). Biomass expansion factors and root : shoot ratios for coniferous tree
species in Great Britain. Forestry, 77(5): 421-430.
Li, X., Yi, M. J., Son, Y., Park, P. S., Lee, K. H., Son, Y. M., . . . Jeong, M. J. (2010). Biomass Expansion Factors
of Natural Japanese Red Pine (Pinus densiflora) Forests in Korea. Journal of Plant Biology, 53(6), 381-386.
Li, Z., Kurz, W. A., Apps, M. J., Beukema, S. J. (2003). Belowground biomass dynamics in the Carbon Budget
Model of the Canadian Forest Sector: recent improvements and implications for the estimation of NPP and
NEP. Canadian Journal of Forest Research, 33(1): 126-136.
Lü, X.-T., Yin, J.-X., Jepsen, M. R., Tang, J. W. (2010). Ecosystem carbon storage and partitioning in a tropical
seasonal forest in Southwestern China. Forest Ecology and Management, 260(10): 1798-1803.
Luo, Y., Zhang, X., Wang, X. P., Lu, F. (2014). Biomass and its allocation of Chinese forest ecosystems. Ecology,
95(7): 2026-2026.
Makero, J. S., Malimbwi, R. E., Eid, T., Zahabu, E. (2016). Allometric biomass and volume models for Itigi thicket.
In R. E. Malimbwi, T. Eid, & S. A. O. Chamshama (Eds.), Allometric tree biomass and volume models in
Tanzania. Tanzania: Department of Forest Mensuration and Management Faculty of Forestry and Nature
Conservation, Sokoine University of Agriculture.
Malimbwi, R. E., Eid, T., Chamshama, S. A. O. (2016). Allometric tree biomass and volume models in Tanzania.
Tanzania: Department of Forest Mensuration and Management, Faculty of Forestry and Nature Conservation,
Sokoine University of Agriculture.
Masota, A. M., Bollandsås, O. M., Zahabu, E., Eid, T. (2015). Allometric biomass and volume models for lowland
and humid montane forests. In R. E. Malimbwi, Eid, T. Chamshama, S.A.O. (Ed.), Allometric tree biomass
and volume models in Tanzania (pp. 19-34). Tanzania: Department of Forest Mensuration and Management
Faculty of Forestry and Nature Conservation, Sokoine University of Agriculture.
Masota, A. M., Chamshama, S. A. O., Malimbwi, R. E., Eid, T. (2016). Stocking estimates of biomass and volume
using developed models. In R. E. Malimbwi, Eid, T. Chamshama, S.A.O. (Ed.), Allometric tree biomass and
volume models in Tanzania (pp. 19-34). Tanzania: Department of Forest Mensuration and Management
Faculty of Forestry and Nature Conservation, Sokoine University of Agriculture.
Miller, A. T., Allen, H. L., Maier, C. A. (2006). Quantifying the coarse-root biomass of intensively managed
loblolly pine plantations. Canadian Journal of Forest Research, 36(1): 12-22.
Miller, R. B. (1963). Plant nutrients in hard beech. III. The cycle of nutrients. New Zealand journal of science, 6:
388-413.
Mokany, K., Raison, R. J., Prokushkin, A. S. (2006). Critical analysis of root: shoot ratios in terrestrial biomes.
Global Change Biology, 12: 84-96.
Monda, Y., Ito, E., Kiyono, Y., Sato, T., Toriyama, J., Sokh, H., . . . Bounthabandid, S. (2016). Allometric
Equations for Tropical Seasonal Deciduous Forests in Cambodia: A Method of Estimating Belowground Tree
Biomass with Reduced Sampling Loss of Roots. Japan Agricultural Research Quarterly: JARQ, 50(4): 369-
377.
Moser, G., Leuschner, C., Hertel, D., Graefe, S., Soethe, N., Iost, S. (2011). Elevation effects on the carbon budget
of tropical mountain forests (S Ecuador): the role of the belowground compartment. Global Change Biology,
17(6): 2211-2226.
Mugasha, W. A., Eid, T., Bollandsås, O. M., Malimbwi, R. E., Chamshama, S. A. O., Zahabu, E., Katani, J. Z.
(2013). Allometric models for prediction of above- and belowground biomass of trees in the miombo
woodlands of Tanzania. Forest Ecology and Management, 310: 87-101.
Murdiyarso, D., Purbopuspito, J., Kauffman, J. B., Warren, M. W., Sasmito, S. D., Donato, D. C., . . . Kurnianto,
S. (2015). The potential of Indonesian mangrove forests for global climate change mitigation. Nature Climate
Change, 5: 1089.
Niiyama, K., Kajimoto, T., Matsuura, Y., Yamashita, T., Matsuo, N., Yashiro, Y., . . . Noor, N. S. (2010).
Estimation of root biomass based on excavation of individual root systems in a primary dipterocarp forest in
Pasoh Forest Reserve, Peninsular Malaysia. Journal of Tropical Ecology, 26(3): 271-284.
Njana, M. A., Eid, T. Z., E., Malimbwi, R. (2015). Procedures for quantification of belowground biomass of three
mangrove tree species. Wetlands Ecology and Management, 23(4): 749-764.
Oliver, G. R., Pearce, S. H., Graham, J. D., Beets, P. N. (2009). Above- and below-ground carbon in Eucalyptus
fastigata in the central North Island of New Zealand (2011/44 ). Retrieved from Wellington, New Zealand.
Chapter 4: Forest Land
2019 Refinement to the 2006 IPCC Guidelines for National Greenhouse Gas Inventories 4.57
Saner, P., Loh, Y. Y., Ong, R. C., Hector, A. (2012). Carbon stocks and fluxes in tropical lowland dipterocarp
rainforests in Sabah, Malaysian Borneo. PLOS ONE, 7(1): 29642.
Sanquetta, C. R., Corte, A. P., da Silva, F. (2011). Biomass expansion factor and root-to-shoot ratio for Pinus in
Brazil. Carbon Balance Manag, 6(6): 6.
Sato, T., Saito, M., RamÍRez, D., PÉRez De Molas, L. F., Toriyama, J., Monda, Y., . . . Vera De Ortiz, M. (2015).
Development of Allometric Equations for Tree Biomass in Forest Ecosystems in Paraguay. Japan Agricultural
Research Quarterly: JARQ, 49(3): 281-291.
Schwendenmann, L., Mitchell, N. D. (2014). Carbon accumulation by native trees and soils in an urban park,
Auckland. New Zealand Journal of Ecology, 38(2): 213-220.
Scott, N. A., White, J. D., Townsend, J. A., Whitehead, D., Leathwick, J. R., Hall, G. M. J., . . . Whaley, P. T.
(2000). Carbon and nitrogen distribution and accumulation in a New Zealand scrubland ecosystem. Canadian
Journal of Forest Research, 30(8): 1246-1255.
Sharma, D. P. (2009). Biomass distribution in sub-tropical forests of Solan Forest Division (HP). Indian Journal
of Ecology, 36(1): 1-5.
Skovsgaard, J. P., Nord-Larsen, T. (2012). Biomass, basic density and biomass expansion factor functions for
European beech (Fagus sylvatica L.) in Denmark. European Journal of Forest Research, 131(4): 1035-1053.
Urban, J., Čermák, J., Ceulemans, R. (2015). Above- and below-ground biomass, surface and volume, and stored
water in a mature Scots pine stand. European Journal of Forest Research, 134(1): 61-74.
Wang, X. P., Fang, J. Y., Zhu, B. (2008). Forest biomass and root–shoot allocation in northeast China. Forest
Ecology and Management, 255(12): 4007-4020.
Watson, A., O’Loughlin, C. (1985). Morphology, strength, and biomass of manuka roots and their influence on
slope stability. New Zealand Journal of Forestry Science, 15(3): 337-348.
Watson, A. J., Marden, M., Rowan, D. (1994). Tree species performance and slope stability. Paper presented at
the Vegetation and slopes: stabilisation, protection and ecology, University Museum, Oxford.
Xiao, C. W., Yuste, J. C., Janssens, I. A., Roskams, P., Nachtergale, L., Carrara, A., . . . Ceulemans, R. (2003).
Above- and belowground biomass and net primary production in a 73-year-old Scots pine forest. Tree Physiol,
23(8): 505-516.
Updated table 4.7.
Adou Yao, C. Y., Blom, E.C., Dengueadhé, K. T. S., Van Rompaey, R. S.A. R., N’Guessan, E. K., Wittebolle,
G., Bongers F., (2005). Diversité floristique et végétation dans le Parc National de Taï, Côte d’Ivoire.
Tropenbos-Côte d’Ivoire Série 5. Wageningen, the Netherlands. 92 pp.
Altrell, D., Saket, M., Lyckebäck, L., Piazza, M. (2005). National Forest and Tree Resources Assessment 2005-
2007. Bangladesh. Ministry of Environment; Forest (MoEF). http://www.fao.org/forestry/15466-
0af9a225183f27cf84c440a6a1bf90d6e.pdf.
Alvarez-Davila, E, Cayuela. L., González-Caro, S., Aldana, A.M., Stevenson, P.R., Phillips, O., ....Rey-Benayas,
J.M. (2017). Forest biomass density across large climate gradients in northern South America is related to water
availability but not with temperature. Plos One, 12
Anderson-Teixeira, K. J., Wang, M.M.H., McGarvey, J.C., Herrmann, V., Tepley, A.J., Bond-Lamberty,
B., LeBauer, D.S. (2018a). ForC: a global database of forest carbon stocks and fluxes. Ecology, 99:1507.
Anderson-Teixeira, K. J., Wang, M.M.H., McGarvey, J.C., Herrmann, V., Tepley, A.J., Bond-Lamberty,
B., LeBauer, D.S. (2018b). Forest Carbon database (ForC-db) v. 2.0-alpha.
Atkinson, E. E., Marin-Spiotta, E. (2015). Land use legacy effects on structure and composition of subtropical dry
forests in St. Croix, US Virgin Islands. Forest Ecology and Management, 335: 270-280.
Avitabile, V., Camia, A. (2018). An assessment of forest biomass maps in Europe using harmonized national
statistics and inventory plots. Forest Ecology and Management, 409: 489–498.
Avitabile, V., Baccini, A., Friedl, M. A., Schmullius, C. (2012). Capabilities and limitations of Landsat and land
cover data for aboveground woody biomass estimation of Uganda. Remote Sensing of Environment, 117: 366-
380.
Avitabile, V., Schultz, M., Herold, N., de Bruin, S.,, Pratihast, A.K.,, Manh, C.P., Quang, H.V., Herold, M. (2016).
Carbon emissions from land cover change in Central Vietnam. Carbon Management, 7: 333-346.
https://www.ncbi.nlm.nih.gov/pubmed/?term=Herrmann%20V%5BAuthor%5D&cauthor=true&cauthor_uid=29603730
https://www.ncbi.nlm.nih.gov/pubmed/?term=LeBauer%20DS%5BAuthor%5D&cauthor=true&cauthor_uid=29603730
Volume 4: Agriculture, Forestry and Other Land Use
4.58 2019 Refinement to the 2006 IPCC Guidelines for National Greenhouse Gas Inventories
Beets, P.N., Kimberley, M.O., Paul, T.S.H., Oliver, G.R., Pearce, S.H., Buswell, J.M. (2014). The Inventory of
Carbon Stocks in New Zealand’s Post-1989 Natural Forest for Reporting under the Kyoto Protocol. Forests,
5(9): 2230–2252.
Brienen, R. J. W., Philips, O.L., Feldpaussch, T.R., ... Zagt, R.J. (2014). Plot Data from: Long-term decline of the
Amazon carbon sink. ForestPlots.NET.
Brienen, R. J. W., Philips, O.L., Feldpaussch, T.R., ... Zagt, R.J. (2015). Long-term decline of the Amazon carbon
sink. Nature, 519: 344-348.
Carreiras, J. M. B., Melo, J. B., Vasconcelos, M. J., (2013). Estimating the above-ground biomass in miombo
savanna woodlands (Mozambique, East Africa) using L-band Synthetic Aperture Radar data. Remote Sensing,
5: 1524-1548.
Carreiras, J. M. B., Vasconcelos, M. J., Lucas, R. M. (2012). Understanding the relationship between aboveground
biomass and ALOS PALSAR data in the forests of Guinea-Bissau (West Africa). Remote Sensing of
Environment, 121: 426-442.
Chan, N., Takeda, S. (2016). The transition away from swidden agriculture and trends in biomass accumulation in
fallow forests. Mountain Research and Development, 36: 320-331.
Dees, M. (2018). IPCC Data contribution Cameroon from NFI 2003-2004. Report for Cameroon REDD+ TS,
USFS/Silvacarbon & IUCN.
DeVries, B., Avitabile, V., Kooistra, L., Herold, M. (2012). Monitoring the impact of REDD+ implementation in
the Unesco Kafa biosphere reserve, Ethiopia. Proceedings of the “Sensing a Changing World”
Workshop (2012).
Drichi, P. (2003). National Biomass Study, Technical Report. Forestry Department, Ministry of Water, Lands &
Environment. Kampala, Uganda.
DVRF (2016). Rapport de mission d’inventaire forestier et d’évaluation de l’intégrité écologique – Ecorégion des
forêts humides de l’est de Madagascar.
Ewel, J., Chai, P., Tsai, L.M. (1983). Biomass and floristics of three young second-growth forests in Sarawak.
The Malaysian Forester, 46: 347-364.
FAO, SEP-REDD+ (2017). Données forestières de base pour la REDD+ en Côte d'Ivoire: Inventaire de la biomasse
forestière pour l'estimation des facteurs d'émission. Abidjan, Ivory Coast.
Food and Agriculture Organization (FAO) (2005). National forest and Tree Resources Assessment 2003-05.
Working Paper 96. The Philippines. http://www.fao.org/forestry/15603-
0b641a2f5813896ac8a5220e5e8bc4106.pdf.
Forest Resources Assessment (FRA) (2015). Global Eological Zones for FAO Forest Reporting 2010 Update.
Forest Resources Assessment Working Paper 179.
Fujiki, S., Nishio, S., Okada, K., Nais, J., Kitayama, K. (2017). Plant communities and ecosystem processes in a
succession-altitude matrix after shifting cultivation in the tropical montane forest zone of northern Borneo.
Journal of Tropical Ecology, 33: 33-49.
Gatti, R. C., Castaldi, S., Lindsell, J.A., Coomes, D.A., Marchetti, Maesano, M., Di Paola, A., Paparella, F.,
Valentini, R. (2015). The impact of selective logging and clearcutting on forest structure, tree diversity and
above-ground biomass of African tropical forests. Ecological Research, 30: 119-132.
Gatti, R. C., Laurin, G. V., Valentini, R. (2017). Tree species diversity of three Ghanaian reserves. Iforest-
Biogeosciences and Forestry, 10: 362-368.
Gazda, A., Miścicki, S., Chwistek, K. (2015). Tree species diversity and above-ground biomass of natural
temperate forest: montane versus lowland forest. Dendrobiology, 73: 3–10.
Giday, K., Eshete, G., Barklund, R., Aertsen, W., Muys, B. (2013). Wood biomass functions for Acacia abyssinica
trees and shrubs and implications for provision of ecosystem services in a community managed exclosure in
Tigray, Ethiopia. Journal of Arid Environments, 94: 80-86.
Granier, A., Ceschia, E., Damesin, C., Dufrêne, E., Epron, D., Gross, P., … Saugier, B. (2000). The carbon balance
of a young Beech forest. Functional Ecology, 14(3): 312–325.
Hansen, M. C., Ptapov, P.V., Moore, R., Hancher, M., … Townshend, J. R. G. et al.(2013). High-resolution global
maps of 21st-century forest cover change. Science, 342: 850-853.
Chapter 4: Forest Land
2019 Refinement to the 2006 IPCC Guidelines for National Greenhouse Gas Inventories 4.59
Hiratsuka, M., Toma, T., Diana, R., Hadriyanto, D., Morikawa, Y., (2006). Biomass recovery of naturally
regenerated vegetation after the 1998 forest fire in East Kalimantan, Indonesia. Jarq-Japan Agricultural
Research Quarterly, 40: 277-282.
Holdaway, R.J., Easdale, T.A., Carswell, F.E., Richardson, S.J., Peltzer, D.A., Mason, N.W.H., Brandon, A.M.,
Coomes, D.A., et al. (2017). Nationally Representative Plot Network Reveals Contrasting Drivers of Net
Biomass Change in Secondary and Old-Growth Forests. Ecosystems, 20: 944.
Husmann, K., Rumpf, S., Nagel, J. (2018). Biomass functions and nutrient contents of European beech, oak,
sycamore maple and ash and their meaning for the biomass supply chain. Journal of Cleaner Production, 172:
4044–4056.
Jacobi, J., Andres, C., Schnedider, M., Pillco, M., Calizaya, P., Rist, S. (201). Carbon stocks, tree diversity, and
the role of organic certification in different cocoa production systems in Alto Beni, Bolivia. Agroforestry
Systems 88, 1117-1132.
Johansson, S. G., Kaarakka, V. J. (1992). Regeneration of cleared Acacia-Zanzibarica Bushland in Kenya. Journal
of Vegetation Science, 3: 401-406.
Kalaba, F. K., Quinn, C. H., Dougill, A. J., Vinya, R. (2013). Floristic composition, species diversity and carbon
storage in charcoal and agriculture fallows and management implications in Miombo woodlands of Zambia.
Forest Ecology and Management, 304: 99-109.
Kattenborn, T., Maack, J., Faßnacht, F., Enßle, F., Ermert, J., Koch, B. (2015). Mapping forest biomass from space
– Fusion of hyperspectral EO1-hyperion data and Tandem-X and WorldView-2 canopy height models.
International Journal of Applied Earth Observation and Geoinformation, 35(PB): 359–367.
Katumbi, N. M., Mwangi, J. K., Kimondo, J. M., Mware, M. J. (2017). Biomass energy resource of the highland
bamboo (Yushania alpina) and its potential for sustainable exploitation in southern Aberdares forest. Journal
of Sustainable Bioenergy Systems, 7: 85-97.
Keith, H., Mackey, B.G. and Lindenmayer, D.B. (2009). Re-evaluation of forest biomass carbon stocks and lessons
from the world's most carbon-dense forests. Proceedings of the National Academy of Sciences, 106(28): 11635-
11640.
Kinyanjui, M.J., Latva-Käyrä, P., Bhuwneshwar, P.S., Kariuki, P., Alfred Gichu, Wamichwe, K. (2014). An
inventory of the above ground biomass in the Mau forest ecosystem, Kenya. Open Journal of Ecology, 4: 619-
627.
Lang, M., Lilleleht, A., Neumann, M., Bronisz, K., Rolim, S. G., Seedre, M., … Kiviste, A. (2016). Estimation of
above-ground biomass in forest stands from regression on their basal area and height. Forestry Studies, 64(1).
Latifi, H., Fassnacht, F. E., Hartig, F., Berger, C., Hernández, J., Corvalán, P., Koch, B. (2015). Stratified
aboveground forest biomass estimation by remote sensing data. International Journal of Applied Earth
Observation and Geoinformation, 38: 229–241.
Lewis, S. L., Sonke, B., Sunderland, T., Begne, S. K., Lopez-Gonzalez, G., .... Zemagho, L. (2013). Above-ground
biomass and structure of 260 African tropical forests. Philosophical Transactions of the Royal Society B-
Biological Sciences 368.
Lewis, S. L., Sonke, B., Sunderland, T., Begne, S. K., Lopez-Gonzalez, G., .... Zemagho, L. (2013). Plot data from
"Above-ground biomass and structure of 260 African tropical forests". ForestPlots.NET.
Luo, Y., Zhang, X., Wang, X., Lu, F. (2014). Biomass and its allocation of Chinese forest ecosystems. Ecology,
95(7): 2026–2026.
Manlay, R. J. et al., (2002). Carbon, nitrogen and phosphorus allocation in agro-ecosystems of a West African
savanna I. The plant component under semi-permanent cultivation. Agriculture Ecosystems & Environment 88,
215-232.
Martinez-Sanchez, J. L., Tigar, B. J., Camara, L., Castillo, O. (2015). Relationship between structural diversity
and carbon stocks in humid and sub-humid tropical forest of Mexico. Ecoscience, 22: 125-131.
McNicol, I. M., Berry, N. J., BechBruun, T., Hergoualc’h, K., Mertz, O., Neergaard, A., Ryan C. M., (2015).
Development of allometric models for above and belowground biomass in swidden cultivation fallows of
Northern Laos. Forest Ecology and Management, 357: 104-116.
Mekuria, W., Veldkamp, E., Corre, M. D., Haile, M., (2011). Restoration of ecosystem carbon stocks following
exclosure establishment in communal grazing lands in Tigray, Ethiopia. Soil Science Society of America
Journal, 75: 246-256.
Volume 4: Agriculture, Forestry and Other Land Use
4.60 2019 Refinement to the 2006 IPCC Guidelines for National Greenhouse Gas Inventories
MITADER (2018). National Forest Inventory Report. Ministry of Land, Environment and Rural Development.
Maputo, Mozambique.
Mitchard, E. T. A., Feldpausch, T. R., Brienen, R. J. W., Lopez‐Gonzalez, G., Monteagudo, A., Baker, T. R.,
Lewis, S. L.,.... Phillips, O. L. (2014). Markedly divergent estimates of Amazon forest carbon density from
ground plots and satellites. Global Ecology and Biogeography, 23: 935-946.
Mitchard, E. T. A., Saatchi, S. S.; Woodhouse, I. H.; Nangendo, G.; Ribeiro, N. S.; Williams, M.; Ryan, C. M.;
Lewis, S. L.; Feldpausch, T. R.; Meir, P. (2009). Using satellite radar backscatter to predict above-ground
woody biomass: A consistent relationship across four different African landscapes. Geophysical Research
Letters, 36(23): L23401.
Monreal, C.M., Etchevers, J. D., Acosta, M., Hidalgo, C., Padilla, J., López, R. M., Jiménez, L., Velázquez, A.
(2005). A method for measuring above- and below-ground C stocks in hillside landscapes. Canadian Journal
of Soil Science, 85: 523-530.
Morel, A.C., Saatchi, S.S., Malhi, Y., Berry, N. J., Banin, L., Burslem, D., Nilus, R., Ong, R. C. (2011). Estimating
aboveground biomass in forest and oil palm plantation in Sabah, Malaysian Borneo using ALOS PALSAR
data. Forest Ecology and Management, 262: 1786-1798.
Mukosha, J., Siampale, A. (2009). "Integrated Land Use Assessment (ILUA) 2005-2008. Republic of Zambia,"
(FAO & Zambia Forestry Department).
Mukul, S. A., Herbohn, J., Firn, J. (2016). Tropical secondary forests regenerating after shifting cultivation in the
Philippines uplands are important carbon sinks. Scientific Reports, 6: 22483 .
Myster, R. W. (2017). Gradient (elevation) vs. disturbance (agriculture) effects on primary cloud forest in Ecuador:
floristics and physical structure. New Zealand Journal of Forestry Science, 47: 3.
NAFORMA (2015). National Forest Resources Monitoring and Assessment of Tanzania Mainland (NAFORMA):
Main Results. MINISTRY OF NATURAL RESOURCES & TOURISM.
N'Guessan, A. E., Kassi, N´D. J., Yao, O.N., .... Herault, B. (2018). Drivers of biomass recovery in a secondary
forested landscape of West Africa. Forest Ecology and Management, 433: 325-331.
Ningthoujam, R. K., Balzter, H., Tansey, K., Morrison, K., Johnson, S. C. M., Gerard, F., … Bermejo, J. P. (2016).
Airborne S-band SAR for forest biophysical retrieval in temperate mixed forests of the UK. Remote Sensing,
8(7).
Nunes, L., Lopes, D., Castro Rego, F., Gower, S.T. (2013). Aboveground biomass and net primary production of
pine, oak and mixed pine–oak forests on the Vila Real district, Portugal. Forest Ecology and Management,
305: 38-47.
Nyirambangutse, B., Zibera, E., Uwizeye, F. K.,Nsabimana, D., Bizuru, E., Pleijel, H., Uddling, J., Wallin, G.
(2017). Carbon stocks and dynamics at different successional stages in an Afromontane tropical forest.
Biogeosciences, 14: 1285-1303.
Omeja, P. A., Lwanga, J. S., Obua, J., Chapman, C. A. (2011). Fire control as a simple means of promoting tropical
forest restoration. Tropical Conservation Science. 4: 287-299.
Otuoma, J., Anyango, B., Ouma, G., ....Oindo, O. (2016). Determinants of aboveground carbon offset additionality
in plantation forests in a moist tropical forest in western Kenya. Forest Ecology and Management, 365: 61-
68.
Palm, C. A., Woomer, P.L., Alegre, J., Arevalo, L., Cstilla, C.,......va Noordwijk. (1999). Carbon sequestration and
trace gas emissions in slash-and-burn and alternative land-uses in the humid tropics. Alternatives to Slash and
Burn Program Climate Change Working Group Final Report Phase II. ASB Coordination Office, ICRAF.
Nairobi, Kenya.
Pena, M. A., Duque, A. (2013). Patterns of stocks of aboveground tree biomass, dynamics, and their determinants
in secondary Andean forests. Forest Ecology and Management, 302: 54-61.
Pirotti, F., Laurin, G. V., Vettore, A., Masiero, A., Valentini, R. (2014). Small footprint full-waveform metrics
contribution to the prediction of biomass in tropical forests. Remote Sensing, 6: 9576-9599.
Poorter, L., Bongers, F., Aide, T.M., Almeida-Zambarno, A.M.,... Rozendaal, D.M.A. (2016). Biomass resilience
of Neotropical secondary forests. Nature, 530: 211-214.
Poorter, L., Bongers, F., Aide, T.M., Almeida-Zambarno, A.M.,... Rozendaal, D.M.A. (2016). Data from: Biomass
resilience of Neotropical secondary forests. Dryad Digital Repository.
Chapter 4: Forest Land
2019 Refinement to the 2006 IPCC Guidelines for National Greenhouse Gas Inventories 4.61
Qie, L., Lewis, S.L., Sullivan, M.J.P., Lopez-Gonzalez, G., ..... Phillips, O.L. (2017). Long-term carbon sink in
Borneo's forests halted by drought and vulnerable to edge effects. Nature Communications, 8: 1966.
Raharimalala, O., Buttler, A., Schlaepfer, R., Gobat, J. M. (2012). Quantifying biomass of secondary forest after
slash-and-burn cultivation in central Menabe, Madagascar. Journal of Tropical Forest Science, 24: 474-489.
Robinson, S. J. B., van den Berg, E., Meirelles, G. S., Ostle, N. (2015). Factors influencing early secondary
succession and ecosystem carbon stocks in Brazilian Atlantic Forest. Biodiversity and Conservation, 24: 2273-
2291.
Rutishauser, E., Herault, B., Baraloto, C., Blanc, L., .....Sist, P.(2015). Rapid tree carbon stock recovery in
managed Amazonian forests. Current Biology, 25:787-788.
Ryan, C. M., Hill, T. C., Woollen, E., Ghee, C., Mitchard, E., Cassells, G., Grace, J.; Woodhouse, I. H., Williams,
M. (2012). Quantifying small-scale deforestation and forest degradation in African woodlands using radar
imagery. Global Change Biology, 18: 243-257.
Salimon, C. I., Brown, I. F. (2000). Secondary forests in western Amazonia: Significant sinks for carbon released
from deforestation? Interciencia, 25: 198-202.
Salinas-Melgoza, M. A., Skutsch, M., Lovett, J. C., Borrego, A. (2017). Carbon emissions from dryland shifting
cultivation: a case study of Mexican tropical dry forest. Silva Fennica, 51(1B): 1553.
Santoro, M., Cartus, O., Mermoz, S., Bouvet, A., …..Seifert, F. M. (2018). GlobBiomass - global datasets of forest
biomass. PANGAEA.
Sato, T. (2010). Stocks of coarse woody debris in old-growth lucidophyllous forests in southwestern Japan. J
For Res, 15: 404.
Schroth, G., D'Angelo, S. A., Teixeira, W. G., Haag, D., Lieberei, R. (2002). Conversion of secondary forest into
agroforestry and monoculture plantations in Amazonia: consequences for biomass, litter and soil carbon stocks
after 7 years. Forest Ecology and Management, 163: 131-150.
Silva, C. V. D., dos Santos, J. R., Galvao, L. S., da Silva, R. D., Moura, Y. M. (2016). Floristic and structure of an
Amazonian primary forest and a chronosequence of secondary succession. Acta Amazonica, 46: 133-150.
Slik, J. W. F., Arroyo-Rodriguez, V., Aiba, S., Alvarez-Loayza, O., ......Venticinque, E.M. (2015). An estimate of
the number of tropical tree species. Proceedings of the National Academy of Sciences of the United States of
America, 112: 4628-4629.
Slik, J. W. F., Paoli, G.D., Mcguire, K.L., Amaral, L., Barroso, J., .....Zweifel, N. (2013). Large trees drive forest
aboveground biomass variation in moist lowland forests across the tropics. Global Ecology and Biogeography,
22: 1261-1271.
Sullivan, M. J. P., Talnot, J., Lewis, S.L., Phillips, I.L., ......Zemagho, L. (2016). Data from "Diversity and carbon
storage across the tropical forest biome". ForestPlots.NET
Sullivan, M. J. P., Talnot, J., Lewis, S.L., Phillips, I.L., ......Zemagho, L. (2017). Diversity and carbon storage
across the tropical forest biome. Scientific Reports, 7: 39102.
Thenkabail, P. S., Enclona, E. A., Ashton, M. S., Legg, C., De Dieu, M. J. (2004). Hyperion, IKONOS, ALI, and
ETM plus sensors in the study of African rainforests. Remote Sensing of Environment, 90: 23-43.
Trotsiuk, V., Svoboda, M., Weber, P., Pederson, N., Klesse, S., Janda, P., … Frank, D. (2016). The legacy of
disturbance on individual tree and stand-level aboveground biomass accumulation and stocks in primary
mountain Picea abies forests. Forest Ecology and Management, 373: 108–115.
Uri, V., Varik, M., Aosaar, J., Kanal, A., Kukumägi, M., Lõhmus, K. (2012). Biomass production and carbon
sequestration in a fertile silver birch (Betula pendula Roth) forest chronosequence. Forest Ecology and
Management, 267: 117–126.
USDA. September 25, 2017. Forest Inventory and Analysis Database, St. Paul, MN: U.S. Department of
Agriculture, Forest Service, Northern Research Station. [Available only on internet: http://apps.fs.fed.us/fiadb-
downloads/datamart.html]
USDA. June 18, 2018. Forest Inventory and Analysis Database, St. Paul, MN: U.S. Department of Agriculture,
Forest Service, Northern Research Station. [Available only on internet: http://apps.fs.fed.us/fiadb-
downloads/datamart.html]
Vaglio Laurin, G. Chen, Q., Lindsell, J.A., Coomes, D., ..... Valentini, R. (2013). Above ground biomass estimation
from lidar and hyperspectral airbone data in West African moist forests. EGU General Assembly Conference
Abstracts, 15: 6227.
Volume 4: Agriculture, Forestry and Other Land Use
4.62 2019 Refinement to the 2006 IPCC Guidelines for National Greenhouse Gas Inventories
Varnagiryte-Kabašinskiene, I., Armolaitis, K., Stupak, I., Kukkola, M., Wójcik, J., Mikšys, V. (2014). Some
metals in aboveground biomass of Scots pine in Lithuania. Biomass and Bioenergy, 66: 434–441.
Vasconcelos, S. S., Zarin, D. J., Machado Araújo, M., Gabrig, L., Rangel-Vasconcelos, T., Reis de Carvalho, C.
J., Staudhammer, C. L., de Assis Oliveira, F. (2008). Effects of seasonality, litter removal and dry-season
irrigation on litterfall quantity and quality in eastern Amazonian forest regrowth, Brazil. Journal of Tropical
Ecology, 24: 27-38.
WWF, Obf, (2013). Xe Pian REDD+ project document. Gland, Switzerland.
Updated table 4.8.
Arief, W., Sigit-Deni, S., Joko, P., Daniel, M. (2013). Calibration of Global Above Ground Biomass Estimate
Using Multi-Source Remote Sensing Data, Living Planet Symposium, Edinburgh.
Arora P., Chaudhry S., (2017). Vegetation and Soil Carbon Pools of Mixed Plantation of Acacia nilotica and
Dalbergia sissoo under Social Forestry Scheme in Kurukshetra, India. J. Mater. Environ. Sci., 8(12): 4565-
4572.
Arul, P.L., Karthick, A. (2013). Carbon Stock Sequestered by tree plantations in University campus at Coimbatore,
India. International Journal of Environmental Sciences, 3(5): 1700-1710.
Banerjee, S. K and Prakasam, U. K. (2013). Biomass carbon pool and soil organic carbon sequestration in Tectona
grandis plantations. Ind. For., 139: 797-802.
Chen, Y., Liu, Z., Rao, X., Wang, X., Liang, C., Lin, Y., Zhou, L., Cai, X., Fu, S. (2015). Carbon Storage and
Allocation Pattern in Plant Biomass among Different Forest Plantation Stands in Guangdong, China. Forests, 6:
794-808.Yunjian, L., Xiaoquan, Z., Xiaoke, W., Fei, L., (2014) Biomass and its allocation in Chinese forest
ecosystems. Ecology, 95: 20-26.
De Costa, W.A.J.M., Suranga, H.R. (2012). Estimation of carbon stocks in the forest plantations of Sri Lanka. J.
Natn. Sci.Foundation Sri Lanka, 40(1): 9-41.
Fataei, E., Varamesh, S. (2016). Carbon stocks in a 20-year-old coniferous plantation ‒ A Case Study in
Fandoghloo Region Northwestern Iran. Applied Ecology and Environmental Research, 14(3): 325-337.
Forest Resources Assessment (FRA). (2015). Global Eological Zones for FAO Forest Reporting 2010 Update.
Forest Resources Assessment Working Paper 179.
Giri, C., Long, J.B., Abbas, S., Thau, D. (2014). Distribution and dynamics of mangrove forests of South Asia.
Journal of Environmental Management, 148:101-11.
Guiabao, E. G. 2016. Above-Ground Carbon Stock Assessment of Mango-Based Agroforestry in Bulbul, Rizal,
Kalinga, Philip Pinus sp.. International Journal of Interdisciplinary Research and Innovations, 4(2): 19-25.
Intergovernmental Panel on Climate Change (2003). Good Practice Guidance for Land Use, Land-Use Change
and Forestry. IPCC Guidelines for National Greenhouse Gas Inventories, Prepared by the National
Greenhouse Gas Inventories Programme.
Ishan, Y.P., Harshad, S., Omprakash, C., Nilesh, V. (2013). Quantitative analysis on carbon storage of 25 valuable
tree species of Gujarat, Incredible India. Indian J.Sci.Res., 4(1): 137-141.
Klaarenbeek Singel, F.W. (2009). Greenhouse gas emissions from palm oil production: Literature review and
proposals from the RSPO Working Group on Greenhouse Gases. (https://www.rspo.org/files/project/
GreenHouse.Gas.Working.Group/Report-GHG-October2009.pdf)
Kraenzel, M.B., Moore, T., Castillo, A., Potvin, C. (2003). Carbon storage of harvest-age teak (Tectona grandis)
plantations. Panama. Forest Ecology and Management, 173(1–3): 213–225.
Lasco, R.D., Pulhin, F.B. (2003). Philippine forest ecosystems and climate change: Carbon stocks, rate of
sequestration and the Kyoto Protocol. Annals of Tropical Research, 25(2): 37-51.
Lugo, A.E., Abelleira Martínez, O., Fonseca da Silva, J. (2012). Aboveground biomass, wood volume, nutrient
stocks and leaf litter in novel forests compared to native forests and tree plantations in Puerto Rico. Boiset
Forêts Des Tropiques, 314(4): 7-16.
Masota, A. M., Chamshama, S. A. O., Malimbwi, R. E., Eid, T. (2016). Stocking estimates of biomass and volume
using developed models. Ed.; Malimbwi, R.E; Eid, T and Chamshama, S.A.O; (2016). Allometric tree biomass
and volume models in Tanzania. Department of Forest Mensuration and Management Faculty of Forestry and
Nature Conservation, Sokoine University of Agriculture. Pp.19-34.
Chapter 4: Forest Land
2019 Refinement to the 2006 IPCC Guidelines for National Greenhouse Gas Inventories 4.63
Mohit, K. (2017). Carbon Sequestration in a Agroforestry system at Kurukshetra in Northern India. International
Journal of Theoretical and Applied Science, 9(1): 43-46.
Muhdi, Haryati, Hanafiah, D. S., Saragih, E. S., Sipayung, F. R., Situmorang, F. M. S. (2016). The potency of
biomass and carbon stocks in smallholder rubber trees (Hevea Brasiliensis Muell. Arg), Serdang bedagai,
Indonesia. Journal of Biodiversity and Environmental Sciences (JBES), 9(1): 474-477.
Nadagouda, V.R., Patil, C.V., Desai, B.K., Manjappa, K. (1997). Growth and yield of seven tree species under
high density planting and irrigation. Indian Forester, 123(1): 61-65.
Nambiar, E.K.S., Harwood, C. E. (2014). Productivity of Acacia and Eucalyptus Plantations in Southeast Asia. 1.
Bio-Physical Determinants of Production: Opportunities and Challenges. International Forestry Review, 16(2):
249-260.
Negi, M.S., Tandon, V. N. (1997). Biomass and nutrient distribution in an age sequence of Populus deltoides
ecosystem in Haryana. Indian Forester, 123: 111–117.
Odiwe, A.I., Adewumi, R. A., Alimi, A. A., Ogunsanwo, O. (2012). Carbon stock in topsoil, standing floor litter
and above ground biomass in Tectona grandis plantation 10-years after establishment in Ile-Ife, Southwestern
Nigeria. Int. J. Biol. Chem. Sci., 6(6): 3006-3016
Ostadhashemi, R., Rostami Shahraji, T., Roehle, H., Mohammadi-Limaei, S. (2014). Estimation of biomass and
carbon storage of tree plantations in northern Iran. J. For. Sci., 60(9): 363–371.
Pérez Cordero, L. D., Kanninen, M. (2003). Above-Ground Biomass of Tectona grandis Plantations in Costa Rica.
Journal of Tropical Forest Science, 15: 199-213.
Sahu, S. C., Manish, K., Ravindranath, N. H. (2016) Carbon stocks in natural and planted mangrove forests of
Mahanadi Mangrove Wetland, East Coast of India. Current Science, 110(12): 2253-2260.
Sanquetta, C. R., Péllico-Netto, S., Corte, A. P. D., Rodrigues, A. L., Behling, A., Sanquetta, M. N. I. (2015).
Quantifying biomass and carbon stocks in oil palm (Elaeis guineensis Jacq.) in Northeastern Brazil. Afr. J.
Agric. Res., 10(43): 4067-4075.
Singh, K. C. (2005). Relative Growth and Biomass Production of some MPTS under Silvi-pastoral system on a
stony Rangeland of Arid-Zone. Indian Forester, 131(5): 719-723.
Siregar, S. T. H., Nurwahyudi, and Mulawarman, K. (2008) Effects of inter-rotation management on site
productivity of Acacia mangium in Riau Province, Sumatra, Indonesia. In: Nambiar, E.K.S. (ed.) Site
management and productivity in tropical plantation forests. Proceedings of Workshop in Brazil, November
2004, and Indonesia, November 2006. Center for International Forestry Research, Bogor, Indonesia.
Sitompol, S. M., Hairiah, K. (2000). Biomass measurement of home garden. Proceedings of Workshop on LUCC
and Greenhouse Gas Emissions, Biophysical Data, IPB, Bogor.
Sohrabi, H., Bakhtiari, S. B., Ahamad, K. (2016). Above- and below-ground biomass and carbon stocks of different
tree plantations in Central Iran. J. Arid Land, 8(1): 138–145
Soto-Pinto, L., Aguirre-Dávila, C., (2015). Carbon Stocks in Organic Coffee Systems in Chiapas, Mexico, Journal
of Agricultural Science, 7(1): ISSN 1916-9752 E-ISSN 1916-9760.
Stape, J. L., Binkleyb, D., Ryanc, G. M. (2004). Eucalyptus production and the supply, use and efficiency of use
of water, light and nitrogen across a geographic gradient in Brazil. Forest ecology and management, 193(1/2):
17-31.
Swamy, K. R., Shivaprasad, D., Bammanahalli, S., Lamani, T. N., Shivanna, H. (2015). Assessment of carbon
sequestration of different tree species planted under shelterbelt of Northern Transitional Zone of Karnataka.
Res. Environ. Life Sci., 8(4): 657-658.
Syahrinudin (2005). The potential of palm oil and forest plantations for carbon sequestration on degraded land in
Indonesia. In: Vlek PLG, Denich M, Martiuns C, Rodgers C, van de Giesen N, editors. Ecol. Dev. Series No.
27. Cuvillier Verlag, Inhaberin Annette Jentzsch-Cuvillier, Nonnenstieg 8, 37075 Göttingen, Germany.
Trettin, C. C., Stringer, C. E., Zarnoch, S. J. (2016). Composition, biomass and structure of mangroves within the
Zambezi River Delta. Wetlands Ecology and Management, 24(2): 173-186.
Umrao, R., Bijalwan, A., Naugraiya, M. N. (2010). Productivity status of ten-year old silvipasture system in
Lateritic soil of Chhattisgarh Plains. Indian Forester, 136(1): 107-116.
USDA, (2017). September 25, 2017. Forest Inventory and Analysis Database, St. Paul, MN: U.S. Department of
Agriculture, Forest Service, Northern Research Station. Available only on internet: http://apps.fs.fed.us/fiadb-
downloads/datamart.html]
Volume 4: Agriculture, Forestry and Other Land Use
4.64 2019 Refinement to the 2006 IPCC Guidelines for National Greenhouse Gas Inventories
Yadava, A. K. (2010). Biomass Production and Carbon Sequestration in Different Agroforestry Systems in Tarai
Region of Central Himalaya. Indian Forester, 136(2): 234-244.
Updated table 4.9.
Anderson-Teixeira, K. J., Wang, M. M. H., McGarvey, J. C., Herrmann, V., Tepley, A. J., Bond-Lamberty,
B., LeBauer, D. S. (2018a). ForC: a global database of forest carbon stocks and fluxes. Ecology, 99:1507.
Anderson-Teixeira, K. J., Wang, M. M. H., McGarvey, J. C., Herrmann, V., Tepley, A. J., Bond-Lamberty, B.,
LeBauer, D. S. (2018b). Forest Carbon database (ForC-db) v. 2.0-alpha.
Beets, P. N., Kimberley, M. O., Paul, T. S. H., Oliver, G. R., Pearce, S. H., Buswell, J. M. (2014). The Inventory
of Carbon Stocks in New Zealand’s Post-1989 Natural Forest for Reporting under the Kyoto Protocol. Forests,
5(9): 2230–2252.
Brienen, R. J. W., Philips, O. L., Feldpaussch, T. R., ... Zagt, R. J. (2014). Plot Data from: Long-term decline of
the Amazon carbon sink. ForestPlots.NET
Brienen, R. J. W., Philips, O. L., Feldpaussch, T. R., ... Zagt, R. J. (2015). Long-term decline of the Amazon
carbon sink. Nature, 519: 344-348.
Chan, N., Takeda, S. (2016). The Transition Away From Swidden Agriculture and Trends in Biomass
Accumulation in Fallow Forests: Case Studies in the Southern Chin Hills of Myanmar. Mountain Research
and Development, 36: 320-331.
Dang, C.L., Wu, Z.L. (1991) Studies on the biomass of Pinus yunnanensis forest. Acta Bot. Yunnanica 13, 59-64.
Ewel, J. J., Chai, P., Tsai, L. M. (1983) Biomass and floristics of three young second-growth forests in Sarawak.
The Malaysian Forester, 46: 347-364.
Forest Resources Assessment (FRA). (2015). Global Eological Zones for FAO Forest Reporting 2010 Update.
Forest Resources Assessment Working Paper 179.
Fujiki, S., Nishio, S., Okada, K., Nais, J., Kitayama, K. (2017). Plant communities and ecosystem processes in a
succession-altitude matrix after shifting cultivation in the tropical montane forest zone of northern Borneo.
Journal of Tropical Ecology, 33: 33-49.
Giday, K., Eshete, G., Barklund, P., Aertsen, W., Muys, B. (2013). Wood biomass functions for Acacia abyssinica
trees and shrubs and implications for provision of ecosystem services in a community managed exclosure in
Tigray, Ethiopia. Journal of Arid Environments 94, 80-86.
Gourlet-Fleury, S., Mortier, F., Fayolle, A., Baya, F., Ouédraogo, D., Bénédet, F., Picard, N. (2013). Tropical
forest recovery from logging: a 24 year silvicultural experiment from Central Africa. Phil. Trans. R. Soc. B,
368: 1625.
Hiratsuka, M., Toma, T., Diana, R., Hadriyanto, D.,Morikawa, Y. (2006). Biomass Recovery of Naturally
Regenerated Vegetation after the 1988 Forest Fire in East Kalimantan, Indonesia. JARQ, 40: 277-282.
Holdaway, R.J., Easdale, T.A., Carswell, F.E. et al. (2017). Ecosystems, 20: 944.
Intergovernmental Panel on Climate Change (2003). Good Practice Guidance for Land Use, Land-Use Change
and Forestry. IPCC Guidelines for National Greenhouse Gas Inventories, Prepared by the National
Greenhouse Gas Inventories Programme.
Intergovernmental Panel on Climate Change (2006). IPCC Guidelines for National Greenhouse Gas Inventories.
Volume 4: Agriculture, Forestry and Other Land Use.
Kalaba, F.K., Quinn, C.H., Dougill, A.J., Vinya, R. (2013). Floristic composition, species diversity and carbon
storage in charcoal and agriculture fallows and management implications in Miombo woodlands of Zambia.
Forest Ecology and Management, 304: 99-109.
Lewis, S.L. Lopez-Gonzalez, G., Sonké, B., Affum-Baffoe, K., Baler, T.R., ….. Wöll, H. (2009) Increasing carbon
storage in intact African tropical forests. Nature, 457: 1003-1006.
Lopez-Gonzalez, G., Lewis, S.L., Burkitt, M., Phillips, O. L. (2011) ForestPlots.net: a web application and
research tool to manage and analyse tropical forest plot data. Journal of Vegetation Science, 22: 610-613.
Manlay, R. J., Kairé, M., Masse, D., Chotte, J. L., Ciornei, G., Floret, C. (2002). Carbon, nitrogen and
phosphorus allocation in agro-ecosystems of a West African savanna I. The plant component under semi-
permanent cultivation. Agriculture, Ecosystems and Environment, 88: 215-232.
Mekurja,W., Veldkamp, E., Corre, M. D. (2010) Restoration of Ecosystem Carbon Stocks Following Exclosure
Establishment in Communal Grazing Lands in Tigray, Ethiopia. SSSAJ, 75: 246-256.
https://www.ncbi.nlm.nih.gov/pubmed/?term=Herrmann%20V%5BAuthor%5D&cauthor=true&cauthor_uid=29603730
https://www.ncbi.nlm.nih.gov/pubmed/?term=LeBauer%20DS%5BAuthor%5D&cauthor=true&cauthor_uid=29603730
Chapter 4: Forest Land
2019 Refinement to the 2006 IPCC Guidelines for National Greenhouse Gas Inventories 4.65
Mukul, S.A., Herbohn, J., Firn, F. (2016). Tropical secondary forests regenerating after shifting cultivation in the
Philippines uplands are important carbon sinks. Scientific Reports, 6: 22483-22483.
Nygård, R., Sawadogo, L., Elfving, B. (2004). Wood-fuel yields in short-rotation coppice growth in the north
Sudan savanna in Burkina Faso. Forest Ecology and Management, 189: 77-85.
N'Guessan, A. E., Kassi, N´D. J., Yao, O.N., .... Herault, B. (2018). Drivers of biomass recovery in a secondary
forested landscape of West Africa. Forest Ecology and Management, 433: 325-331.
Omeja, P. A., Lwanga, J. S., Obua, J., Chapman, C. (2011). Fire control as a simple means of promoting tropical
forest restoration. Tropical Conservation Science, 4: 287-299.
Otuoma, J., Anyango, B., Ouma, G., Okeyo, D.,, ....Oindo, B. O. (2016). Determinants of aboveground carbon
offset additionality in plantation forests in a moist tropical forest in western Kenya. Forest Ecology and
Management, 365: 61-68.
Palm, C. A., Woomer, P. L., Alegre, J., Arevalo, L., Cstilla, C.,......va Noordwijk. (1999). Carbon sequestration
and trace gas emissions in slash-and-burn and alternative land-uses in the humid tropics. Alternatives to Slash
and Burn Program Climate Change Working Group Final Report Phase II. ASB Coordination Office,
ICRAF. Nairobi, Kenya.
Peña, M. A., Duque, A. (2013) Patterns of stocks of aboveground tree biomass, dynamics, and their determinants
in secondary Andean forests. Forest Ecology and Management, 302: 54-61.
Poorter, L., Bongers, F., Aide, T. M., Almeida-Zambarno, A. M.,... Rozendaal, D. M. A. (2016). Biomass
resilience of Neotropical secondary forests. Nature, 530: 211-214.
Poorter, L., Bongers, F., Aide, T. M., Almeida-Zambarno, A. M.,... Rozendaal, D. M. A. (2016). Data from:
Biomass resilience of Neotropical secondary forests. Dryad Digital Repository.
Qie, L., Lewis, S. L., Sullivan, M. J. P., Lopez-Gonzalez, G., ..... Phillips, O.L. (2017). Long-term carbon sink in
Borneo's forests halted by drought and vulnerable to edge effects. Nature Communications, 8: 1966.
Rutishauser, E., Herault, B., Baraloto, C., Blanc, L., .....Sist, P., (2015). Rapid tree carbon stock recovery in
managed Amazonian forests. Current Biology, 25:787-788.
Salimon, C. I., Brown, I. F. (2000) Secondary forests in Western Amazonia: Significant sinks for carbon released
from deforestation? Interciencia, 25: 198-202.
Salinas-Mendoza, M.A., Skutsch, M., Lovett,J.C., Borrego, A., (2017). Carbon emissions from dryland shifting
cultivation: a case study of Mexican tropical dry forest. Silva Fennica, 51: 1553-1553.
Schomakers, J., Jien, S. H., Lee, T. Y., ...... Zehetner, F. (2017). Soil and biomass carbon re-accumulation after
landslide disturbances. Geomorphology, 288: 164-174.
Tang, J. W., Zhang, J. H., Song, Q. S., Cao, M., Feng, Z. L. (1998). A preliminary study on the biomass of
secondary tropical forest in Xishuangbann. J. Plant Ecol., 22: 489–498.
Thenkabail, P. S., Enclona, E. A., Ashton, M. S., Legg, C., De Dieu, M. J. (2004). Hyperion, IKONOS, ALI, and
ETM+ sensors in the study of African rainforests. Remote Sensing of Environment, 90: 23-43.
USDA, June 18, (2018). June 2018. Forest Inventory and Analysis Database, St. Paul, MN: U.S. Department of
Agriculture, Forest Service, Northern Research Station. Available only on internet:
https://apps.fs.usda.gov/fia/datamart/datamart.html]
Updated table 4.10.
Forest Resources Assessment (FRA) (2015). Global Eological Zones for FAO Forest Reporting 2010 Update.
Forest Resources Assessment Working Paper 179.
Intergovernmental Panel on Climate Change (2003). Good Practice Guidance for Land Use, Land-Use Change
and Forestry. IPCC Guidelines for National Greenhouse Gas Inventories, Prepared by the National
Greenhouse Gas Inventories Programme.
Lugo, A. E., Wang, D., Bormann, F. H. (1990). A comparative analysis of biomass production in five tropical tree
species. Forest Ecology and Management, 31(3):153-166.
Masota, A. M., Chamshama, S. A. O., Malimbwi, R. E., Eid, T. (2016). Stocking estimates of biomass and volume
using developed models. Ed.; Malimbwi, R. E; Eid, T and Chamshama, S. A. O; (2016). Allometric tree
biomass and volume models in Tanzania. Department of Forest Mensuration and Management Faculty of
Forestry and Nature Conservation, Sokoine University of Agriculture. Pp.19-34.
Volume 4: Agriculture, Forestry and Other Land Use
4.66 2019 Refinement to the 2006 IPCC Guidelines for National Greenhouse Gas Inventories
Stape, J. L., Binkley, D., Ryan, M. G. (2004). Eucalyptus production and the supply, use and efficiency of use of
water, light and nitrogen across a geographic gradient in Brazil. Forest Ecology and Management, 193(1-2):17-
31.
Updated table 4.11.
Chuande, X., (2001). Timber Plantation in China. FAO Forestry - Proceedings of the International Conference on
Timber Plantation Development. Manila, The Phillipines.
Cordeiro, I. M. C. C., Contente de Barros, P.L., Lameira, O. A., Filho, A. B. G. (2015). Assessment of parica
(Schizolobium parahyba var. amazonicum (Huber ex Ducke) Barneby) plantations at different ages and
cultivation systems in Aurora do Para (Para State-Brazil). Ciencia Florestal, 25(3):679-687.
Dell, B., Daping, X., Thu, P.Q. (2012). Managing threats to the health of tree plantations in Asia. New Perspectives
in Plant Protection. Intechopen. Edited by A. R. Bandani. 63-92p.
Erkan, N. (2003). Fast growing species and economic analyses for plantations in Turkey. XII World Forestry
Congress, 2003, Québec City, Canada.
Food and Agriculture Organization (2001). Forest Plantations Thematic Papers: mean annual volume increment
of selected industrial forest plantation species, by L. Ugalde & O. Pérez. Forest Plantation Thematic Papers,
Working Paper 1. Forest Resources Development Service, Forest Resources Division. FAO, Rome
(unpublished). 27 pp.
Food and Agriculture Organization (2006). Global planted forests thematic study: results and analysis, by A. Del
Lungo, J. Ball and J. Carle. Planted Forests and Trees Working Paper 38. Rome (also available at
www.fao.org/forestry/site/10368/en).
Haapanen, M., Jansson, G., Nielsen, U. B., Steffenrem, A., Stener, L. G. (2015). The status of tree breeding and
its potential for improving biomass production – A review of breeding activities and genetic gains in
Scandinavia and Finland. Skogforsk. Uppsala. Edited by L. G. Stener. 55pp.
Intergovernmental Panel on Climate Change (2006). IPCC Guidelines for National Greenhouse Gas Inventories.
Volume 4. Agriculture, Forestry and Other Land Use.
Kien, N. D. (2014). Timber supply and demand and growth potential of fast growing tree species in the northwest
region of Vietnam. AFLI Technical Report No. 6. World Agroforestry Centre, Nairobi, Kenya.
Nzila, J. D., Deleporte, P., Bouillet, J. P., .... Ramger, J. (2004). Effects of Slash Management on Tree Growth and
Nutrient Cycling in Second-rotation Eucalyptus Replanted Sites in the Congo. In: Site Management and
Productivity in Tropical Plantation Forests: Proceedings of Workshops in Congo July 2001 and China February
2003. Edited by E. K. S. Nambiar, J. Ranger, A. Tiarks and T. Toma. CIFOR 2004: 15-30.
Silva, L. F., Ferreira, G. L., Alburquerque dos Santos, A. C., Leite, H. G., Lopes da Silva, M. (2016). Tree height,
volume and growth equations for Khaya ivorensis, planted in Pirapora. Floresta e Ambiente, 23(3): 362-368.
Updated table 4.12.
Forest Resources Assessment (FRA) (2015). Global Eological Zones for FAO Forest Reporting 2010 Update.
Forest Resources Assessment Working Paper 179.
REFERENCES FROM THE 2006 GUIDELINES
Soil C References
Australian Greenhouse Gas Office (AGO) (2002). Greenhouse Gas Emissions from Land Use Change in Australia:
An Integrated Application of the National Carbon Accounting System (2002).
Andreae, M.O. and Merlet, P. (2001). Emission of trace gases and aerosols from biomass burning. Global
Biogeochemical Cycles 15: 955-966.
Armentano, T.V. and Menges, E.S. (1986). Patterns of change in the carbon balance of organic soil-wetlands of
the temperate zone. Journal of Ecology 74: 755-774.
Baker, T.R., Phillips, O.L., Malhi, Y., Almeida, S., Arroyo, L., Di Fiore, A., Erwin, T., Higuchi, N., Killeen,
T.J.Laurance, S.G., Laurance, W.F., Lewis, S.L., Monteagudo, A., Neill, D.A., Vargas, P.N., Pitman,
N.C.A.,Silva, J.N.M. and Martínez, R.V. (2004a). Increasing biomass in Amazonian forest plots. Philosophical
Transactions of the Royal Society of London B 359: 353-365.
Baker, T.R., Phillips, O.L., Malhi, Y., Almeida, S., Arroyo, L., Di Fiore, A., Erwin, T., Killeen, T.J., Laurance,
S.G., Laurance, W.F., Lewis, S.L., Lloyd, J., Monteagudo, A., Neill, D.A., Patiño, S., Pitman, N.C.A., Silva,
Chapter 4: Forest Land
2019 Refinement to the 2006 IPCC Guidelines for National Greenhouse Gas Inventories 4.67
J.N.M. and Martínez, R.V. (2004b). Variation in wood density determines spatial patterns in Amazonian forest
biomass. Global Change Biology 10: 545-562.
Barbosa, R.I. and Fearnside, P.M. (2004). Wood density of trees in open savannas of the Brazilian Amazon. Forest
Ecology and Management 199: 115-123.
Battles, J.J., Armesto, J.J., Vann, D.R., Zarin, D.J., Aravena, J.C., Pérez, C. and Johnson, A.H. (2002). Vegetation
composition, structure, and biomass of two unpolluted watersheds in the Cordillera de Piuchué, Chiloé Island,
Chile. Plant Ecology 158: 5-19.
Beets, P.N., Gilchrist, K. and Jeffreys, M.P. (2001). Wood density of radiata pine: Effect of nitrogen supply. Forest
Ecology and Management 145: 173-180.
Bhatti, J.S., Apps, M.J., and Jiang, H. (2001). Examining the carbon stocks of boreal forest ecosystems at stand
and regional scales. In: Lal R. et al. (eds.) Assessment Methods for Soil Carbon, Lewis Publishers, Boca Raton
FL, pp. 513-532.
Cairns, M.A., Brown, S., Helmer, E.H. and Baumgardner, G.A. (1997). Root biomass allocation in the world’s
upland forests. Oecologia 111: 1-11.
Cannell, M.G.R. (1982). World forest biomass and primary production data. Academic Press, New York, NY.
Centre Technique Forestier Tropical (CTFT) (1989). Memento du Forestier, 3e Édition. Ministère Français de la
Coopération et du Développement, Paris, France.
Chambers, J.Q., dos Santos, J., Ribeiro, R.J., and Higuchi, N. (2001a). Tree damage, allometric relationships, and
above-ground net primary production in a tropical forest. Forest Ecology and Management 152: 73-84.
Chambers, J.Q., Schimel, J.P. and Nobre, A.D. (2001b). Respiration from coarse wood litter in Central Amazon
Forests. Biogeochemistry 52: 115-131.
Chambers, J.Q., Tribuzy, E.S., Toledo, L.C., Crispim, B.F., Higuchi, N., dos Santos, J., Araújo, A.C., Kruijt, B.,
Nobre, A.D. and Trumbore, S.E. (2004). Respiration from a tropical forest ecosystem: Partitioning of sources
and low carbon use efficiency. Ecological Applications 14: S72-S88.
Clark, D.A., Piper, S.C., Keeling, C.D. and Clark, D.B. (2003). Tropical rain forest tree growth and atmospheric
carbon dynamics linked to interannual temperature variation during 1984-2000. Proceedings of the National
Academy of Sciences of the USA 100: 5852-5857.
de Groot, W.J., Bothwell, P.M., Carlsson, D.H. and Logan, K.A. (2003). Simulating the effects of future fire
regimes on western Canadian boreal forests. Journal of Vegetation Science 14: 355-364
DeWalt, S.J. and Chave, J. (2004). Structure and biomass of four lowland Neotropical forests. Biotropica 36: 7-
19.
Dietz, P. (1975). Dichte und Rindengehalt von Industrieholz. Holz Roh- Werkstoff 33: 135-141.
Dixon, R.K., Brown, S., Houghton, R.A., Solomon, A.M., Trexler, M.C. and Wisniewski, J. (1994). Carbon pools
and flux of global forest ecosystems. Science 263(1544): 185-190.
Dong, J., Kaufmann, R.K., Myneni, R.B., Tucker, C.J., Kauppi, P.E., Liski, J., Buermann, W., Alexeyev, V. and
Hughes, M.K. (2003). Remote sensing estimates of boreal and temperate forest woody biomass: Carbon pools,
sources, and sinks. Remote Sensing of Environment 84: 393-410.
Dubé, S., Plamondon, A.P. and Rothwell, R.L. (1995). Watering up after clear-cutting on forested wetlands of the
St. Lawrence lowland. Water Resources Research 31:1741-1750.
Echeverria, C. and Lara, A. (2004). Growth patterns of secondary Nothofagus obliqua-N. alpina forests in southern
Chile. Forest Ecology and Management 195: 29-43.
Ellert, B.H., Janzen, H.H. and McConkey, B.G. (2001). Measuring and comparing soil carbon storage. In: R. Lal,
J.M. Kimble, R.F. Follett and B.A. Stewart (eds.). Soil Management for Enhancing Carbon Sequestration. CRC
Press, Boca Raton, FL., pp. 593-610.
Falloon, P. and Smith, P. (2003). Accounting for changes in soil carbon under the Kyoto Protocol: need for
improved long-term data sets to reduce uncertainty in model projections. Soil Use and Management, 19, 265-
269.
Fearnside, P.M. (1997). Wood density for estimating forest biomass in Brazilian Amazonia. Forest Ecology and
Management 90: 59-87.
Feldpausch, T.R., Rondon, M.A., Fernandes, E.C.M. and Riha, S.J. (2004). Carbon and nutrient accumulation in
secondary forests regenerating on pastures in central Amazonia. Ecological Applications 14: S164-S176.
Volume 4: Agriculture, Forestry and Other Land Use
4.68 2019 Refinement to the 2006 IPCC Guidelines for National Greenhouse Gas Inventories
Filipchuk, A.N., Strakhov, V.V., Borisov, B.A. et al. (2000). A Brief National Overview on Forestry Sector and
Wood Products: Russian Federation. UN ECE, FAO. New York, Geneva. ECE/TIM/SP/18, p. 94 (In Russian).
Fittkau, E.J. and Klinge, N.H. (1973). On biomass and trophic structure of the central Amazonian rainforest
ecosystem. Biotropica 5: 2-14.
Food and Agriculture Organization (FAO) 2001. Global forest resources assessment 2000. FAO, Rome, Italy.
Food and Agriculture Organization (FAO) 2006. Global forest resources assessment 2005. FAO, Rome, Italy.
Forest Resources Assessment (FRA). (2015). Global Eological Zones for FAO Forest Reporting 2010 Update.
Forest Resources Assessment Working Paper 179.
Gayoso, J., Guerra, J. and Alarcón, D. (2002). Contenido de carbono y funciones de biomasa en especies natives
y exóticas. Universidad Austral de Chile, Valdivia, Chile.
Gayoso, J. and Schlegel, B. (2003). Estudio de línea de base de carbono: Carbono en bosques nativos, matorrales
y praderas de la Décima Región de Chile. Universidad Austral de Chile, Valdivia, Chile.
Gower, S.T., Krankina, O., Olson, R.J., Apps, M., Linder, S. and Wang, C. (2001). Net primary production and
carbon allocation patterns of boreal forest ecosystems. Ecological Applications 11: 1395-1411.
Hall, G.M.J. (2001). Mitigating an organization's future net carbon emissions by native forest restoration.
Ecological Applications 11: 1622-1633.
Hall, G.M.J. and Hollinger, D. Y. (1997). Do the indigenous forests affect the net CO2 emission policy of New
Zealand? New Zealand Forestry 41: 24-31.
Hall, G.M.J., Wiser, S.K., Allen, R.B., Beets, P.N. and Goulding, C.J. (2001). Strategies to estimate national forest
carbon stocks from inventory data: The 1990 New Zealand baseline. Global Change Biology 7:389-403.
Harmand, J.M., Njiti, C.F., Bernhard-Reversat, F. and Puig, H. (2004). Aboveground and belowground biomass,
productivity and nutrient accumulation in tree improved fallows in the dry tropics of Cameroon. Forest Ecology
and Management 188: 249-265.
Harmon, M.E. and Marks, B. (2002). Effects of silvicultural practices on carbon stores in Douglas-fir-western
hemlock forests in the Pacific Northwest, USA: results from a simulation model. Canadian Journal of Forest
Research 32 (5): 863-877.
Harmon, M.E., Franklin, J.F., Swanson, F.J., Sollins, P., Gregory, S.V., Lattin, J.D., Anderson, N.H., Cline, S.P.,
Aumen, N.G., Sedell, J.R., Lienkaemper, G.W., Cromack, J.R. and Cummins, K.W. (1986). Ecology of coarse
woody debris in temperate ecosystems. Advances in Ecological Research 15: 133–302.
Hessl, A.E., Milesi, C., White, M.A., Peterson, D.L. and Keane, R. (2004). Ecophysiological parameters for Pacific
Northwest trees. U.S. Department of Agriculture, Forest Service, Portland, OR.
Hinds, H.V. and Reid, J.S. (1957). Forest trees and timbers of New Zealand. New Zealand Forest Service Bulletin
12: 1-221.
Hughes, R.F., Kauffman, J.B. and Jaramillo, V.J. (1999). Biomass, carbon, and nutrient dynamics of secondary
forests in a humid tropical region of México. Ecology 80: 1892-1907.
Hughes, R.F., Kauffman, J.B. and Jaramillo, V.J. (2000). Ecosystem-scale impacts of deforestation and land use
in a humid tropical region of México. Ecological Applications 10: 515-527.
IPCC (1997). Revised 1996 IPCC Guidelines for National Greenhouse Inventories. Houghton J.T., Meira
FilhoL.G., Lim B., Tréanton K., Mamaty I., Bonduki Y., Griggs D.J. Callander B.A. (Eds). Intergovernmental
Panel on Climate Change (IPCC), IPCC/OECD/IEA, Paris, France.
IPCC (2003). Good Practice Guidance for Land Use, Land-Use Change and Forestry. Penman J., Gytarsky M.,
Hiraishi T., Krug, T., Kruger D., Pipatti R., Buendia L., Miwa K., Ngara T., Tanabe K., Wagner F.
(Eds).Intergovernmental Panel on Climate Change (IPCC), IPCC/IGES, Hayama, Japan.
Jenkins, J.C., Chojnacky, D.C., Heath, L.S. and Birdsey, R.A. (2004). Comprehensive database of diameterbased
biomass regressions for North American tree species. U.S. Department of Agriculture, Forest Service,
Newtown Square, PA.
Jobbagy, E.G. and Jackson, R.B. (2000). The vertical distribution of soil organic carbon and its relation to climate
and vegetation. Ecological Applications 19(2):423-436.
Johnson, D.W., and Curtis, P.S. (2001). Effects of forest management on soil C and N storage: meta-analysis.
Forest Ecology and Management 140: 227-238.
Chapter 4: Forest Land
2019 Refinement to the 2006 IPCC Guidelines for National Greenhouse Gas Inventories 4.69
Johnson, D.W., Knoepp, J.D. and Swank, W.T. (2002). Effects of forest management on soil carbon: results of
some long-term resampling studies. Environment Pollution 116: 201-208.
Knigge, W. and Schulz, H. (1966). Grundriss der Forstbenutzung. Verlag Paul Parey, Hamburg, Berlin.
Köppen, W. (1931). Grundriss der Klimakunde. Walter deGruyter Co., Berlin, Germany.
Kraenzel, M., Castillo, A., Moore, T. and Potvin, C. (2003). Carbon storage of harvest-age teak (Tectona grandis)
plantations, Panama. Forest Ecology and Management 173: 213-225.
Kurz, W.A. and Apps, M.J. (2006). Developing Canada's national forest carbon monitoring, accounting and
reporting system to meet the reporting requirements of the Kyoto Protocol. Mitigation and Adaptation
Strategies for Global Change 11(1): 33-43.
Kurz, W.A., Apps, M.J., Banfield, E. and Stinson, G. (2002). Forest carbon accounting at the operational scale.
The Forestry Chronicle 78: 672-679.
Kurz, W.A., Apps, M.J., Webb, T.M. and McNamee, P.J. (1992). The carbon budget of the Canadian forest sector:
phase I. Forestry Canada, Northwest Region. Information Report NOF-X-326, 93 pp.
Kurz, W.A., Beukema, S.J. and Apps, M.J. (1998). Carbon budget implications of the transition from natural to
managed disturbance regimes in forest landscapes. Mitigation and Adaptation Strategies for Global Change
2:405-421.
Kurz, W.A., Beukema, S.J. and Apps, M.J. (1996). Estimation of root biomass and dynamics for the carbon budget
model of the Canadian forest sector. Canadian Journal of Forest Research 26:1973-1979.
Lamlom, S.H. and Savidge, R.A. (2003). A reassessment of carbon content in wood: variation within and between
41 North American species. Biomass and Bioenergy 25: 381-388.
Lasco, R.D. and Pulhin, F.B. (2003). Philippine forest ecosystems and climate change: Carbon stocks, rate of
sequestration and the Kyoto Protocol. Annals of Tropical Research 25: 37-51.
Levy, P.E., Hale, S.E. and Nicoll, B.C. (2004). Biomass expansion factors and root:shoot ratios for coniferous tree
species in Great Britain. Forestry 77: 421-430.
Li, C. and Apps, M.J. (2002). Fire Regimes and the Carbon Dynamics of Boreal Forest Ecosystems. In Shaw C.
and Apps MJ (Eds). The role of Boreal Forests and Forestry in the Global Carbon Budget, Northern Forestry
Centre Report Fo42-334/2000E, 107-118.
Li, C., Kurz, W.A., Apps, M.J. and Beukema, S.J. (2003). Belowground biomass dynamics in the Carbon Budget
Model of the Canadian Forest Sector: recent improvements and implications for the estimation of NPP and
NEP. Canadian Journal of Forest Research 33: 126-136.
Liski, J., Pussinen, A., Pingoud, K., Makipaa, R. and Karjalainen, T. (2001). Which rotation length is favourable
to carbon sequestration? Canadian Journal of Forest Research 31: 2004-2013.
Loveland, T.R, Reed, B.C., Brown, J.F., Ohlen, D.O., Zhu, Z., Yang, L. and Merchant, J.W. (2000). Development
of a global land cover characteristics database and IGBP DISCover from 1-km AVHRR data. International
Journal of Remote Sensing 21: 1303-1330.
Lugo, A.E., Wang, D. and Bormann, F.H. (1990). A comparative analysis of biomass production in five tropical
tree species. Forest Ecology and Management 31: 153-166.
Malhi, Y., Baker, T.R., Phillips, O.L., Almeida, S., Alvarez, E., Arroyo, L., Chave, J., Czimczik, C.I., Di Fiore,
A., Higuchi, N., Killeen, T.J., Laurance, S.G., Laurance, W.F., Lewis, S.L., Montoya, L.M.M., Monteagudo,
A., Neill, D.A.; Vargas, P., Patiño, S., Pitman, N.C.A., Quesada, C.A., Salomão, R., Silva, J.N.M., Lezama,
A.T., Martínez, R.V., Terborgh, J., Vinceti, B., Lloyd, J. 2004. The above-ground coarse wood productivity of
104 neotropical forest plots. Global Change Biology, 10(5): 563-591.
Matthews, G.A.R. (1993). The carbon content of trees. UK Forestry Commission, Edinburgh, UK.
McGroddy, M.E., Daufresne, T. and Hedin, L.O. (2004). Scaling of C:N:P stoichiometry in forests worldwide:
Implications of terrestrial Redfield-type ratios. Ecology 85: 2390-2401.
McKenzie, N.J., Cresswell, H.P., Ryan, P.J. and Grundy, M. (2000). Opportunities for the 21st century: Expanding
the horizons for soil, plant, and water analysis. Communications in Soil Science and Plant Analysis 31: 1553-
1569.
Mokany, K., Raison, J.R. and Prokushkin, A.S. (2006). Critical analysis of root:shoot ratios in terrestrial biomes.
Global Change Biology 12: 84-96.
Volume 4: Agriculture, Forestry and Other Land Use
4.70 2019 Refinement to the 2006 IPCC Guidelines for National Greenhouse Gas Inventories
Monte, L, Hakanson, L., Bergstrom, U., Brittain, J. and Heling, R. (1996). Uncertainty analysis and validation of
environmental models: the empirically based uncertainty analysis. Ecological Modelling 91:139-152.
Monteagudo, A., Neill, D.A., Vargas, P.N., Patiño, S., Pitman, N.C.A., Quesada, C.A., Salomãos, R., Silva, J.N.M.,
Lezama, A.T., Martínez, R.V., Terborgh, J., Vinceti, B. and Lloyd, J. (2004). The aboveground coarse wood
productivity of 104 Neotropical forest plots. Global Change Biology 10: 563-591.
Montès, N., Bertaudière-Montes, V., Badri, W., Zaoui, E.H. and Gauquelin, T. (2002). Biomass and nutrient
content of a semi-arid mountain ecosystem: the Juniperus thurifera L. woodland of Azzaden Valley (Morocco).
Forest Ecology and Management 166: 35-43.
Nygård, R., Sawadogo, L. and Elfving, B. (2004). Wood-fuel yields in short-rotation coppice growth in the north
Sudan savanna in Burkina Faso. Forest Ecology and Management 189: 77-85.
Ogle, S.M., Breidt, F.J., Eve, M.D. and Paustian, K. (2003). Uncertainty in estimating land use and management
impacts on soil organic carbon storage for U.S. agricultural lands between 1982 and 1997. Global Change
Biology 9:1521-1542.
Ogle, S.M., Breidt, F.J. and Paustian, K. (2006). Bias and variance in model results associated with spatial scaling
of measurements for parameterization in regional assessments. Global Change Biology 12:516-523.
Post, W.M. and Kwon, K.C. (2000). Soil carbon sequestration and land-use change: processes and potential.
Global Change Biology 6:317-327.
Poupon, H. (1980). Structure et dynamique de la strate ligneuse d’une steppe Sahélienne au nord du Sénégal.
Office de la Recherche Scientifique et Technique Outre-Mer, Paris, France.
Powers, J.S., Read, J.M., Denslow, J.S. and Guzman, S.M. (2004). Estimating soil carbon fluxes following
landcover change: a test of some critical assumptions for a region in Costa Rica. Global Change Biology
10:170-181.
Pregitzer, K.S. (2003). Woody plants, carbon allocation and fine roots. New Phytologist 158 (3): 421-424. Reyes,
G., Brown, S., Chapman, J. and Lugo, A.E. (1992). Wood densities of tropical tree species. U.S. Department
of Agriculture, Forest Service, New Orleans, LA.
Rijsdijk, J.F. and Laming, P.B. (1994). Physical and related properties of 145 timbers. Kluwer Academic
Publishers, Dordrecht, Netherlands.
Saldarriaga, J.G., West, D.C., Tharp, M.L. and Uhl, C. (1988). Long term chronosequence of forest succession in
the upper Rio Negro of Colombia and Venezuela. Journal of Ecology 76: 938-958.
Scott, N.A., Tate, K.R., Giltrap, D.J., et al. (2002). Monitoring land-use change effects on soil carbon in New
Zealand: quantifying baseline soil carbon stocks. Environmental Pollution 116: 167-186.
Sebei, H., Albouchi, A., Rapp, M. and El Aouni, M.H. (2001). Évaluation de la biomasse arborée et arbustive dans
une séquence de dégradation de la suberaie à Cytise de Kroumirie (Tunisie). Annals of Forest Science 58: 175-
191.
Siltanen, et al. (1997). A soil profile and organic carbon data base for Canadian forest and tundra mineral soils.
Natural Resources Canada, Canadian Forest Service, Northern Forestry Centre, Edmonton, Alberta.
Singh, K. and Misra, R. (1979). Structure and Functioning of Natural, Modified and Silvicultural Ecosystems in
Eastern Uttar Pradesh. Banras Hindu University, Varanasi, India.
Singh, S.S., Adhikari, B.S. and Zobel, D.B. (1994). Biomass, productivity, leaf longevity, and forest structure in
the central Himalaya. Ecological Monographs 64: 401-421.
Smith, J.E. and Heath, L.S. (2001). Identifying influences on model uncertainty: an application using a forest
carbon budget model. Environmental Management 27:253-267.
Smithwick, E.A.H., Harmon, M.E., Remillard, S.M., Acker, S.A. and Franklin, J.F. (2002). Potential upper bounds
of carbon stores in forests of the Pacific Northwest. Ecological Applications 12: 1303-1317.
Somogyi, Z., Cienciala, E., Mäkipää, R., Muukkonen, P., Lehtonen, A. and Weiss, P. (2006). Indirect methods of
large-scale forest biomass estimation. European Journal of Forest Research.
Stape, J.L., Binkley, D. and Ryan, M.G. (2004). Eucalyptus production and the supply, use and efficiency of use
of water, light and nitrogen across a geographic gradient in Brazil. Forest Ecology and Management 193:17-
31.
Stephens, P., Trotter, C., Barton, J., Beets, P., Goulding, C., Moore, J., Lane, P. and Payton, I. (2005). Key elements
in the development of New Zealand’s carbon monitoring, accounting and reporting system to meet Kyoto
Chapter 4: Forest Land
2019 Refinement to the 2006 IPCC Guidelines for National Greenhouse Gas Inventories 4.71
Protocol LULUCF good practice guidance, Poster paper presented at IUFRO World Congress, Brisbane
Australia, August 2005.
Stocks, B.J., Mason, J.A., Todd, J.B., Bosch, E.M., Wotton, B.M., Amiro, B.D., Flannigan, M.D., Hirsch,
K.G.,Logan, K.A., Martell, D.L., and Skinner, W.R. (2002). “Large forest fires in Canada, 1959 – 1997”,
Journal of Geophysical Research, 107, 8149 printed 108(D1), 2003].
Trotter, C., Barton, J., Beets, P., Goulding, C., Lane, P., Moore, J., Payton, I., Rys, G., Stephens, P., Tate, K. and
Wakelin, S. (2005). New Zealand’s approach to forest inventory under the UNFCCC and Kyoto Protocol.
Proceedings of the International Workshop of Forest Inventory for the Kyoto Protocol (Eds Matsumoto,M. and
Kanomata, H.), pp. 33–43, published by: Division of Policy and Economics, Forestry and Forest Products
Research Institute, 1 Matsunosato, Tsukuba, Ibaraki, 305-8687, Japan.
Trotter, C.M. (1991). Remotely sensed data as an information source for Geographical Information Systems in
natural resource management. International Journal of Geographical Information Systems 5, No. 2, 225-240.
Ugalde, L. and Perez, O. (2001). Mean annual volume increment of selected industrial forest planatation species.
Food and Agriculture Organization, Rome, Italy.
VandenBygaart, A.J., Gregorich, E.G., Angers, D.A., et al. (2004). Uncertainty analysis of soil organic carbon
stock change in Canadian cropland from 1991 to 2001. Global Change Biology 10:983-994.
Wulder, M., Kurz, W.A. and Gillis, M. (2004). National level forest monitoring and modeling in Canada, Progress
in Planning, Volume 61:365-381.
Zianis, D., Muukkonen, P., Mäkipää, R. and Mencuccini, M. (2005). Biomass and stem volume equations for tree
species in Europe. Silva Fennica, Monographs 4. 63. p.