CHAPTER 4 FINDINGS AND DISCUSSIONS 4.1 Goodwill ...thesis.binus.ac.id/Asli/Bab4/BAB 4_07-01.pdfNO....
31
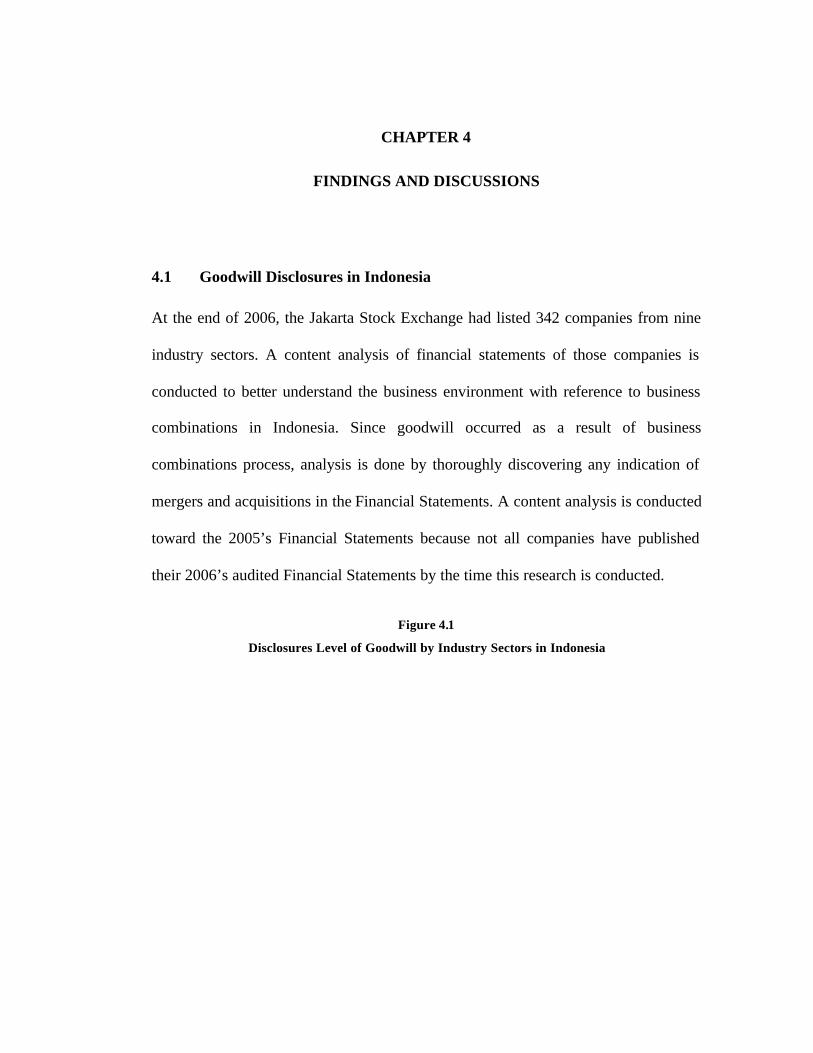
CHAPTER 4 FINDINGS AND DISCUSSIONS 4.1 Goodwill Disclosures in Indonesia At the end of 2006, the Jakarta Stock Exchange had listed 342 companies from nine industry sectors. A content analysis of financial statements of those companies is conducted to better understand the business environment with reference to business combinations in Indonesia. Since goodwill occurred as a result of business combinations process, analysis is done by thoroughly discovering any indication of mergers and acquisitions in the Financial Statements. A content analysis is conducted toward the 2005’s Financial Statements because not all companies have published their 2006’s audited Financial Statements by the time this research is conducted. Figure 4.1 Disclosures Level of Goodwill by Industry Sectors in Indonesia
Transcript of CHAPTER 4 FINDINGS AND DISCUSSIONS 4.1 Goodwill ...thesis.binus.ac.id/Asli/Bab4/BAB 4_07-01.pdfNO....
CHAPTER 4
FINDINGS AND DISCUSSIONS
4.1 Goodwill Disclosures in Indonesia
At the end of 2006, the Jakarta Stock Exchange had listed 342 companies from nine
industry sectors. A content analysis of financial statements of those companies is
conducted to better understand the business environment with reference to business
combinations in Indonesia. Since goodwill occurred as a result of business
combinations process, analysis is done by thoroughly discovering any indication of
mergers and acquisitions in the Financial Statements. A content analysis is conducted
toward the 2005’s Financial Statements because not all companies have published
their 2006’s audited Financial Statements by the time this research is conducted.
Figure 4.1
Disclosures Level of Goodwill by Industry Sectors in Indonesia
31
4
9 98
65
17
02468
1012141618
AGRIMINING
BASIC IND. & CHEMICALS MISC.
CONSUMER GOODS
PROP, REAL EST. & BLDG CONST
INFRASTR, UTIL. & TRANSPORT
FINANCE
TRADE, SERV. & INVEST.
INDUSTRY
NO
. OF
CO
MP
AN
IES
It was found that from a population of 342 companies, 62 companies (18%) disclosed
goodwill under the non-current asset section in the balance sheet of 2005. The
majority of goodwill disclosure is from trade, service and investment industry
(27.4%). Both basic industry and chemicals, and the consumer goods industry take
the second place at 14.5%. Business acquisitions might be an advantageous strategy
for these industries to expand as well as to maintain an excellent performance.
As shown in Figure 4.1, industry with the lowest goodwill disclosure level is the
mining industry (1.6%). There are 10 mining companies listed in the Jakarta Stock
Exchange and the existence of goodwill is found in three of them. However, two
companies include the amount of goodwill as part of the account “oil and gas
properties” and do not disclose it clearly as goodwill. Consequently, the actual
amount of goodwill is undetectable. The other company discloses goodwill normally
as a separate account on the balance sheet.
4.1.1 The Size of Goodwill Compared To Total Assets
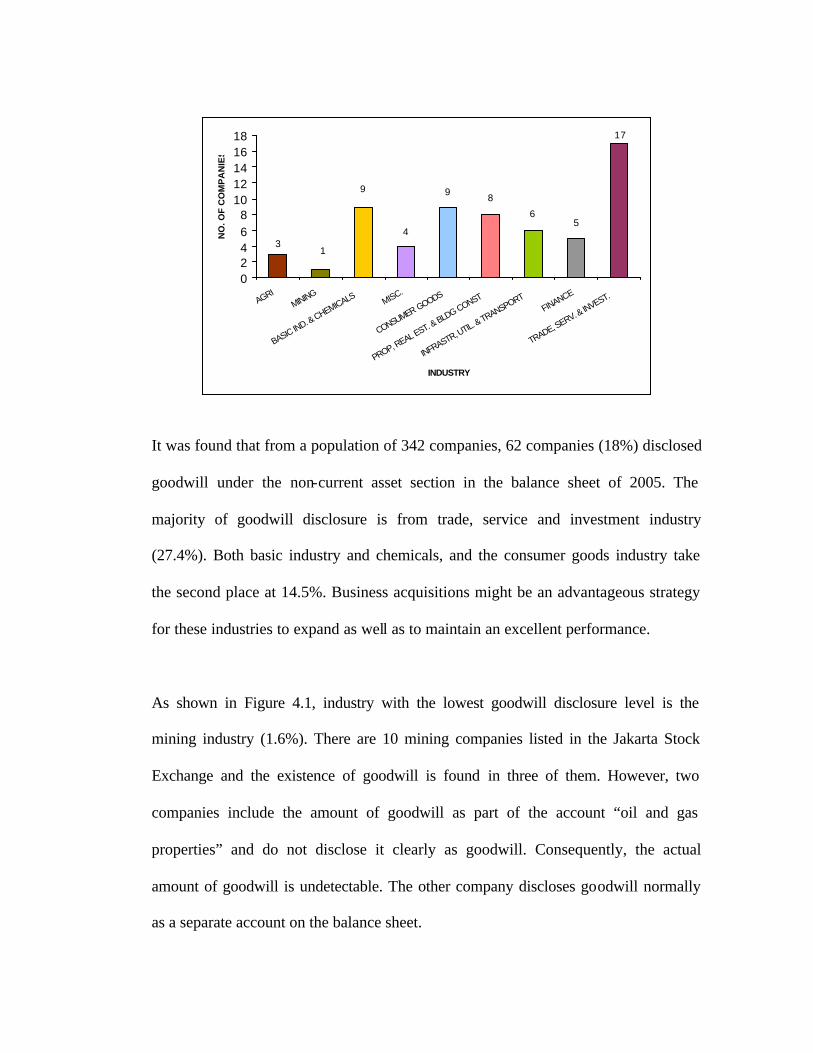
General observation, goodwill is not a material asset in most of the companies in
Indonesia. As much as 87.1% listed companies only have goodwill le ss than 5% from
their total assets. In fact, 59.68% listed companies only have goodwill of less than 1%
from their total assets. Only about 13% companies have goodwill of more than 5% of
their total assets and these companies came from various industries such as
advertising, printing and media, mining, and telecommunication.
Figure 4.2
Classification of Goodwill Proportion to Total Assets
59.68%
27.42%
12.90%
LESS THAN 1% BETWEEN 1% - 5% MORE THAN 5%
THE PROPORTION OF GOODWILL TO TOTAL ASSETS
4.1.2 Various Goodwill Terminologies Adopted in Indonesia
From the sample of 62 companies, the author found several terminologies that
represent the account of goodwill. The most popular terminology used by 50% of
firm observation is “net goodwill” or “goodwill after accumulated amortization” The
next popular terminology used is a simply “Goodwill”, which is adopted by 19% of
the 62 companies. Although these companies do not describe the net amount of
goodwill after accumulated amortization, the term “goodwill” actually represents so.
Another 18% companies use the term “excess gain of investment over net assets of
subsidiaries”. These companies typically own less than 1% goodwill over total assets.
However, the latter term represents the same meaning as goodwill. The rational of
“hiding” the word goodwill behind other term probably because that the goodwill
amount is not material. Table 4.1 also shows that 6% companies use the account
“intangible assets” and 6% companies use other terms, such as “goodwill and other
intangible assets” and “other assets”.
Those companies which disclose goodwill as something else and not clearly as
goodwill on the face of the balance sheet may deviate from Indonesia’s General
Accepted Accounting Principal (GAAP) which actually requires goodwill to be
presented on the face of the balance sheet.
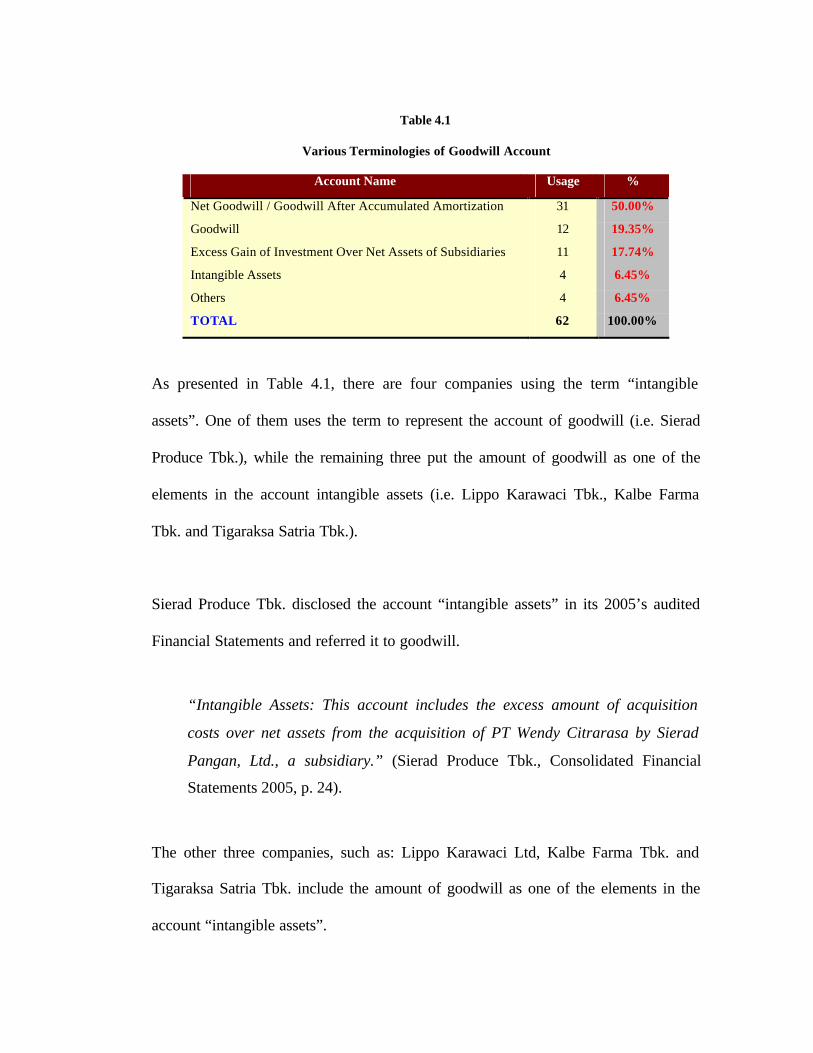
Table 4.1
Various Terminologies of Goodwill Account
Account Name Usage %
Net Goodwill / Goodwill After Accumulated Amortization 31 50.00%
Goodwill 12 19.35%
Excess Gain of Investment Over Net Assets of Subsidiaries 11 17.74%
Intangible Assets 4 6.45%
Others 4 6.45%
TOTAL 62 100.00%
As presented in Table 4.1, there are four companies using the term “intangible
assets”. One of them uses the term to represent the account of goodwill (i.e. Sierad
Produce Tbk.), while the remaining three put the amount of goodwill as one of the
elements in the account intangible assets (i.e. Lippo Karawaci Tbk., Kalbe Farma
Tbk. and Tigaraksa Satria Tbk.).
Sierad Produce Tbk. disclosed the account “intangible assets” in its 2005’s audited
Financial Statements and referred it to goodwill.
“Intangible Assets: This account includes the excess amount of acquisition
costs over net assets from the acquisition of PT Wendy Citrarasa by Sierad
Pangan, Ltd., a subsidiary.” (Sierad Produce Tbk., Consolidated Financial
Statements 2005, p. 24).
The other three companies, such as: Lippo Karawaci Ltd, Kalbe Farma Tbk. and
Tigaraksa Satria Tbk. include the amount of goodwill as one of the elements in the
account “intangible assets”.
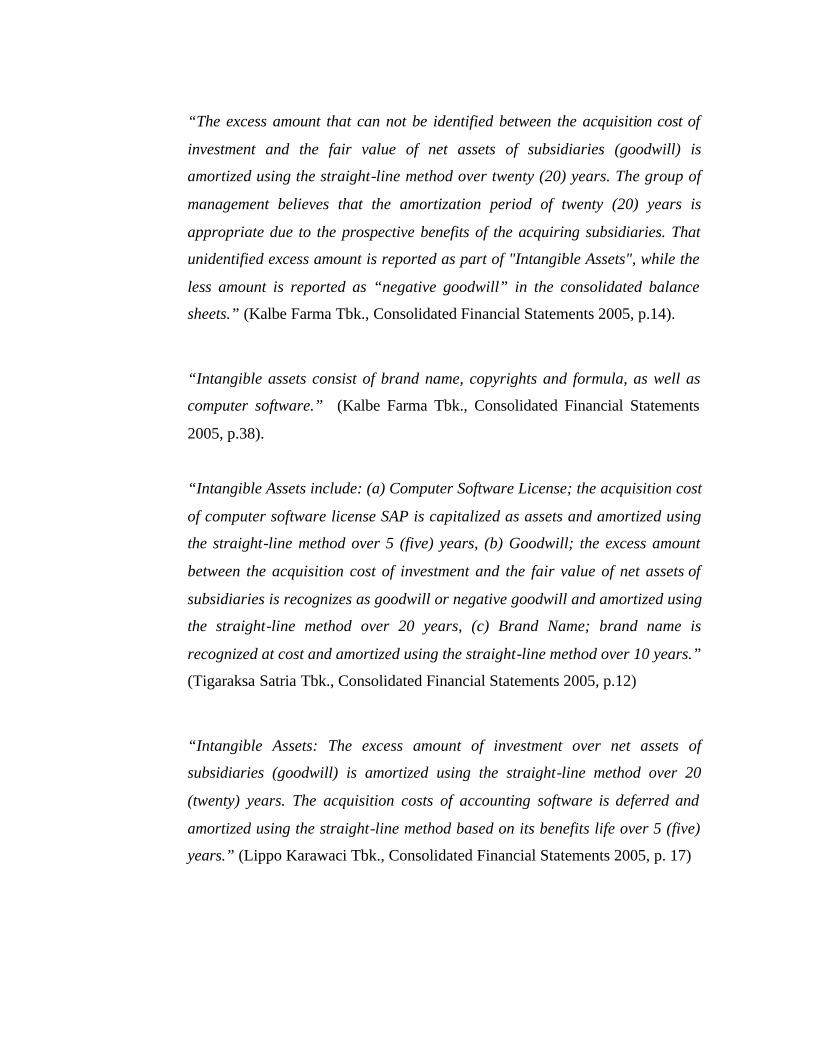
“The excess amount that can not be identified between the acquisition cost of
investment and the fair value of net assets of subsidiaries (goodwill) is
amortized using the straight-line method over twenty (20) years. The group of
management believes that the amortization period of twenty (20) years is
appropriate due to the prospective benefits of the acquiring subsidiaries. That
unidentified excess amount is reported as part of "Intangible Assets", while the
less amount is reported as “negative goodwill” in the consolidated balance
sheets.” (Kalbe Farma Tbk., Consolidated Financial Statements 2005, p.14).
“Intangible assets consist of brand name, copyrights and formula, as well as
computer software.” (Kalbe Farma Tbk., Consolidated Financial Statements
2005, p.38).
“Intangible Assets include: (a) Computer Software License; the acquisition cost
of computer software license SAP is capitalized as assets and amortized using
the straight-line method over 5 (five) years, (b) Goodwill; the excess amount
between the acquisition cost of investment and the fair value of net assets of
subsidiaries is recognizes as goodwill or negative goodwill and amortized using
the straight-line method over 20 years, (c) Brand Name; brand name is
recognized at cost and amortized using the straight-line method over 10 years.”
(Tigaraksa Satria Tbk., Consolidated Financial Statements 2005, p.12)
“Intangible Assets: The excess amount of investment over net assets of
subsidiaries (goodwill) is amortized using the straight-line method over 20
(twenty) years. The acquisition costs of accounting software is deferred and
amortized using the straight-line method based on its benefits life over 5 (five)
years.” (Lippo Karawaci Tbk., Consolidated Financial Statements 2005, p. 17)
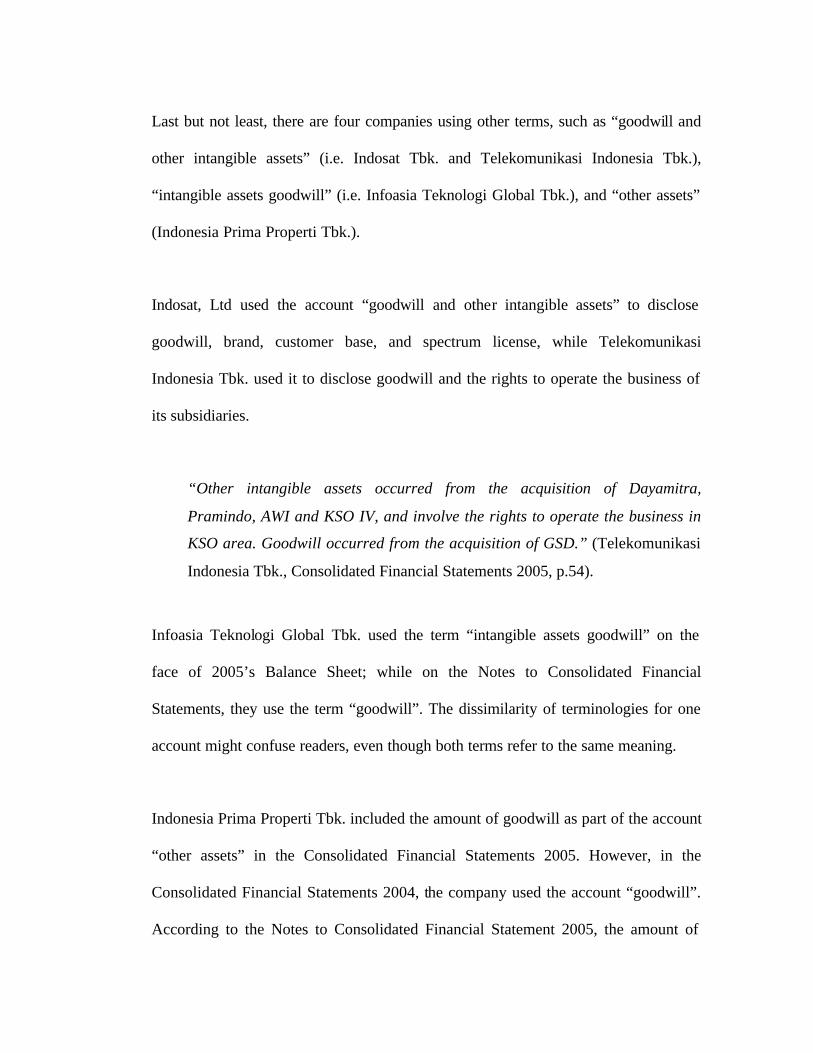
Last but not least, there are four companies using other terms, such as “goodwill and
other intangible assets” (i.e. Indosat Tbk. and Telekomunikasi Indonesia Tbk.),
“intangible assets goodwill” (i.e. Infoasia Teknologi Global Tbk.), and “other assets”
(Indonesia Prima Properti Tbk.).
Indosat, Ltd used the account “goodwill and other intangible assets” to disclose
goodwill, brand, customer base, and spectrum license, while Telekomunikasi
Indonesia Tbk. used it to disclose goodwill and the rights to operate the business of
its subsidiaries.
“Other intangible assets occurred from the acquisition of Dayamitra,
Pramindo, AWI and KSO IV, and involve the rights to operate the business in
KSO area. Goodwill occurred from the acquisition of GSD.” (Telekomunikasi
Indonesia Tbk., Consolidated Financial Statements 2005, p.54).
Infoasia Teknologi Global Tbk. used the term “intangible assets goodwill” on the
face of 2005’s Balance Sheet; while on the Notes to Consolidated Financial
Statements, they use the term “goodwill”. The dissimilarity of terminologies for one
account might confuse readers, even though both terms refer to the same meaning.
Indonesia Prima Properti Tbk. included the amount of goodwill as part of the account
“other assets” in the Consolidated Financial Statements 2005. However, in the
Consolidated Financial Statements 2004, the company used the account “goodwill”.
According to the Notes to Consolidated Financial Statement 2005, the amount of
goodwill after accumulated amortization for that period is zero. Thus, the company
used the account “other assets” in 2005 to re-disclose the 2004’s goodwill amount.
The inclusion of goodwill among other intangible assets under one specific account,
by nature, is inappropriate. PSAK No. 19 article 12 states that intangible asset can be
clearly distinguished from goodwill if that asset can be separated from the firm’s
entity. Such intangible assets as patents, copyrights, trademarks, and trade secrets are
“separable” because its value is identifiable. Goodwill, on the other hand, can not be
separated from the firm’s entity and exchanged or sold singly due to its unidentifiable
characteristic. Seeing that the nature and characteristic of goodwill is different from
other intangible assets, it should be separated from other intangible assets and
recognized separately in the balance sheet.
Business combinations of oil and gas industry use different accounting treatment
pertaining to goodwill. Goodwill of the acquired oil and gas companies is recognized
under the account “Oil and Gas Properties1” if applicable for capitalization and is
amortized over the life of the Production Sharing Contracts (PSC) using the unit of
production method2. Negative goodwill is treated in a normal manner. There are two
companies using such treatment; Medco Energi International Tbk. and Energi Mega
Persada Tbk.
1 Indonesian: Aktiva minyak dan gas bumi 2 Notes to the Consolidated Financial Statements of PT Medco Energi International and PT Energi
Mega Persada
4.1.3 The Compliance of Goodwill Disclosures with PSAK 22
From the author’s observation the compliance rate of goodwill disclosure in
Indonesia is considerably low. From 62 sample companies, there are 33 companies
(53.23%) that have met all the disclosure requirements of goodwill as stated in the
PSAK 22 article 66. It means that almost a half of those companies failed to meet the
standard.
The similar result also founded in US in 1988, when the accounting standard of
goodwill was still amortization. Duval, et.al (1992) conducted a survey in 1988
among 621 firms of New York and American Stock Exchange. Twenty-one percent
did not disclose net goodwill, 58 percent did not disclose accumulated goodwill
amortization and 76 percent did not disclose goodwill amortization expense.
According to the PSAK No. 22 article 66, a financial statement should disclose:
a) Accounting treatment for goodwill including its amortization periods
b) If the benefits life of goodwill is more than five years, an explanation of
reasons and considerations being used
c) If goodwill not to be amortized using the straight- line method, other method
used and its reasons
d) Goodwill reconciliation at the beginning and end of the period
The author have conducted a thorough examination over financial statements of the
62 sample companies to indicate if those companies have followed goodwill
disclosure requirements stated in the PSAK 22 article 66. The examination results are
presented below.
Disclosure of accounting treatment for goodwill including its amortization periods
All sample companies treated goodwill as an element of assets and amortized it
against profit annually. Goodwill amortization periods varied among companies. The
result shows that three companies did not disclose or unclearly disclosed the
amortization periods of goodwill. The remaining companies complied with the
standard, which requires five-year periods of amortization, yet allows a period not
excess 20 years with reasonable explanation.
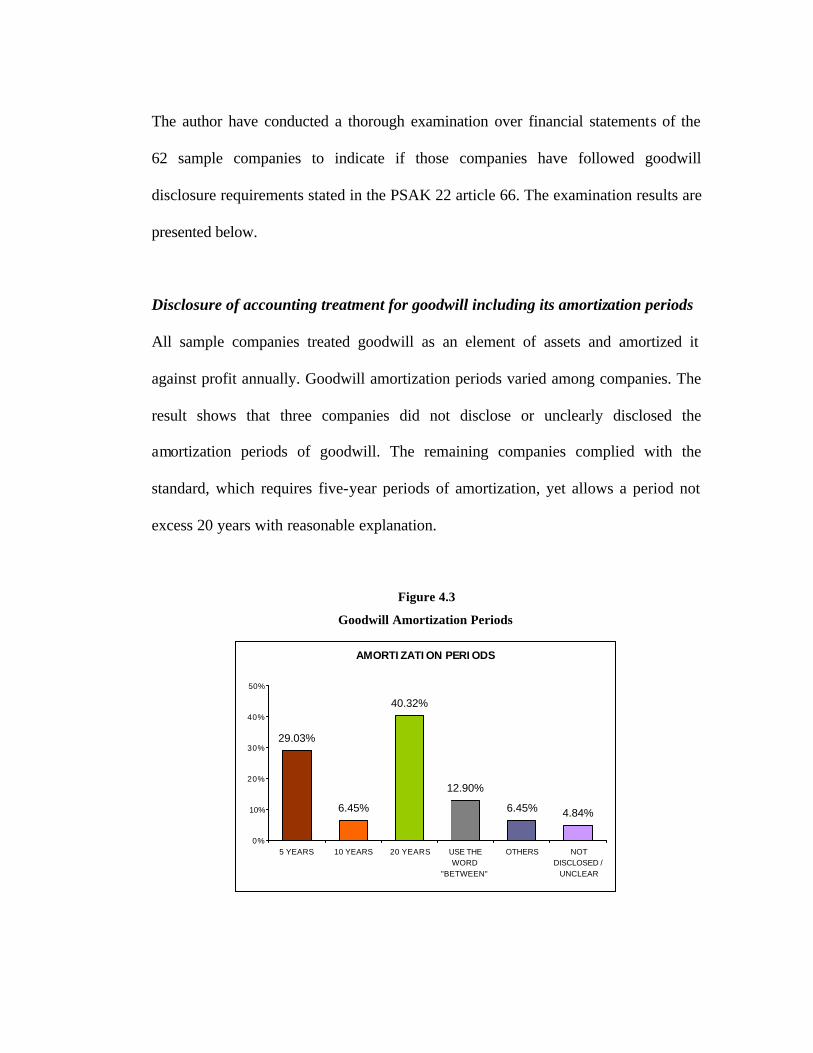
Figure 4.3
Goodwill Amortization Periods
AMORTIZATION PERIODS
29.03%
6.45%
40.32%
12.90%
6.45% 4.84%
0%
10%
20%
30%
40%
50%
5 YEARS 10 YEARS 20 YEARS USE THEWORD
"BETWEEN"
OTHERS NOTDISCLOSED /
UNCLEAR
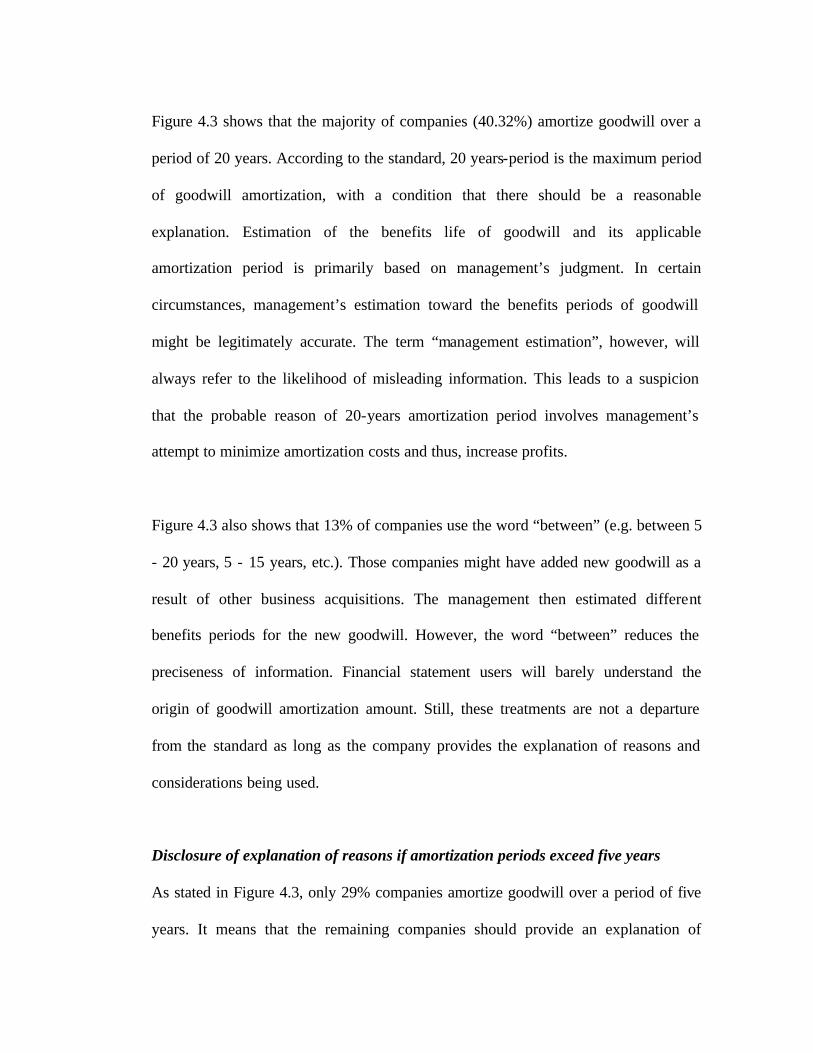
Figure 4.3 shows that the majority of companies (40.32%) amortize goodwill over a
period of 20 years. According to the standard, 20 years-period is the maximum period
of goodwill amortization, with a condition that there should be a reasonable
explanation. Estimation of the benefits life of goodwill and its applicable
amortization period is primarily based on management’s judgment. In certain
circumstances, management’s estimation toward the benefits periods of goodwill
might be legitimately accurate. The term “management estimation”, however, will
always refer to the likelihood of misleading information. This leads to a suspicion
that the probable reason of 20-years amortization period involves management’s
attempt to minimize amortization costs and thus, increase profits.
Figure 4.3 also shows that 13% of companies use the word “between” (e.g. between 5
- 20 years, 5 - 15 years, etc.). Those companies might have added new goodwill as a
result of other business acquisitions. The management then estimated different
benefits periods for the new goodwill. However, the word “between” reduces the
preciseness of information. Financial statement users will barely understand the
origin of goodwill amortization amount. Still, these treatments are not a departure
from the standard as long as the company provides the explanation of reasons and
considerations being used.
Disclosure of explanation of reasons if amortization periods exceed five years
As stated in Figure 4.3, only 29% companies amortize goodwill over a period of five
years. It means that the remaining companies should provide an explanation of
reasons and considerations that affect their decision to amortize goodwill over a
period more than five years.
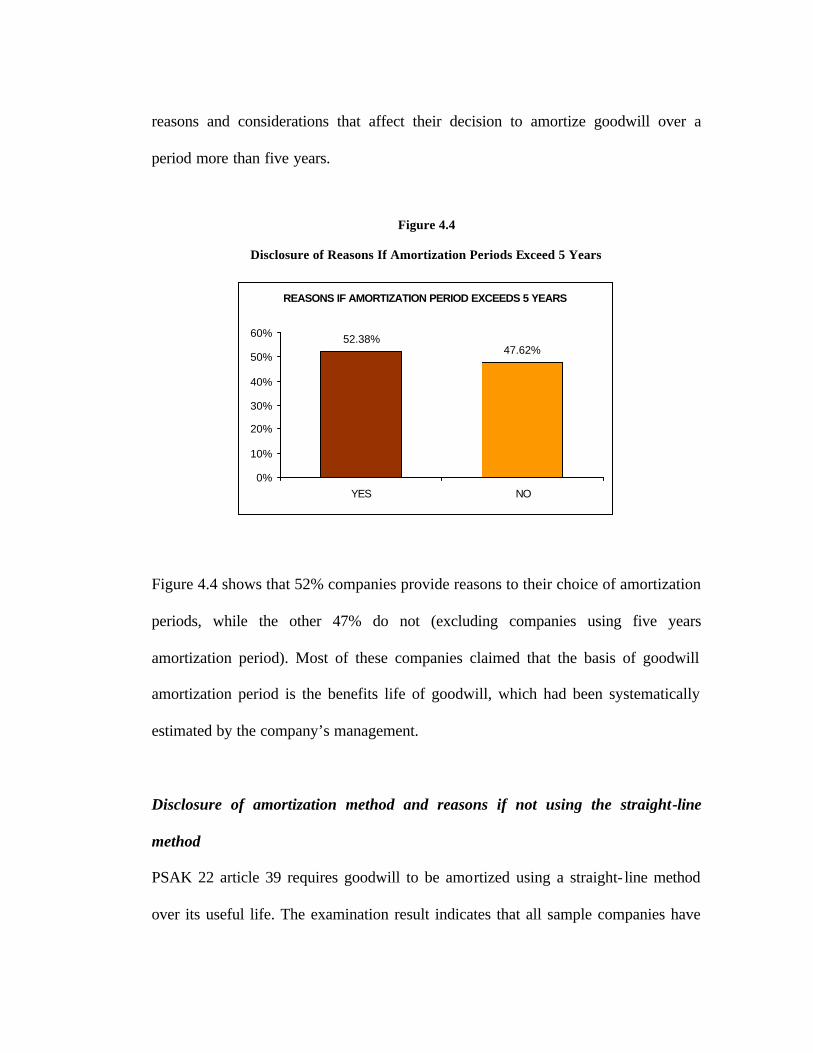
Figure 4.4
Disclosure of Reasons If Amortization Periods Exceed 5 Years
REASONS IF AMORTIZATION PERIOD EXCEEDS 5 YEARS
52.38%47.62%
0%
10%
20%
30%
40%
50%
60%
YES NO
Figure 4.4 shows that 52% companies provide reasons to their choice of amortization
periods, while the other 47% do not (excluding companies using five years
amortization period). Most of these companies claimed that the basis of goodwill
amortization period is the benefits life of goodwill, which had been systematically
estimated by the company’s management.
Disclosure of amortization method and reasons if not using the straight-line
method
PSAK 22 article 39 requires goodwill to be amortized using a straight- line method
over its useful life. The examination result indicates that all sample companies have
applied the straight- line method for goodwill amortization. Thus, no company
requires explanation of other method of amortization.
Disclosure of goodwill reconciliation at the beginning and end of the period
Goodwill reconciliation refers to a note containing goodwill information, which
includes (PSAK 22 article 66):
§ The gross amount of goodwill and accumulated amortization at the beginning
of the period
§ Additional goodwill amount recorded throughout the period
§ Amortization amount for the period
§ Reconciliation of subsequent changes or identification of the value of assets
and liabilities after the date of acquisition
§ Deductions of goodwill amount made throughout the period
§ The gross amount of goodwill and its accumulated amortization at the end of
the period
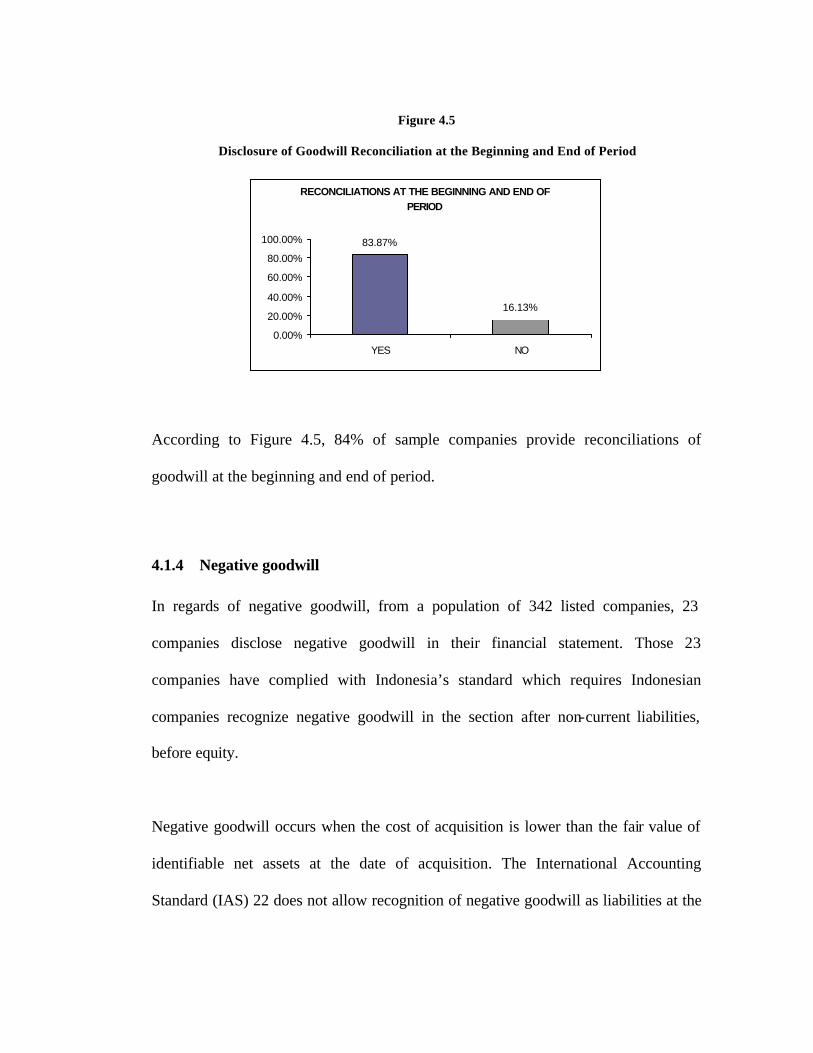
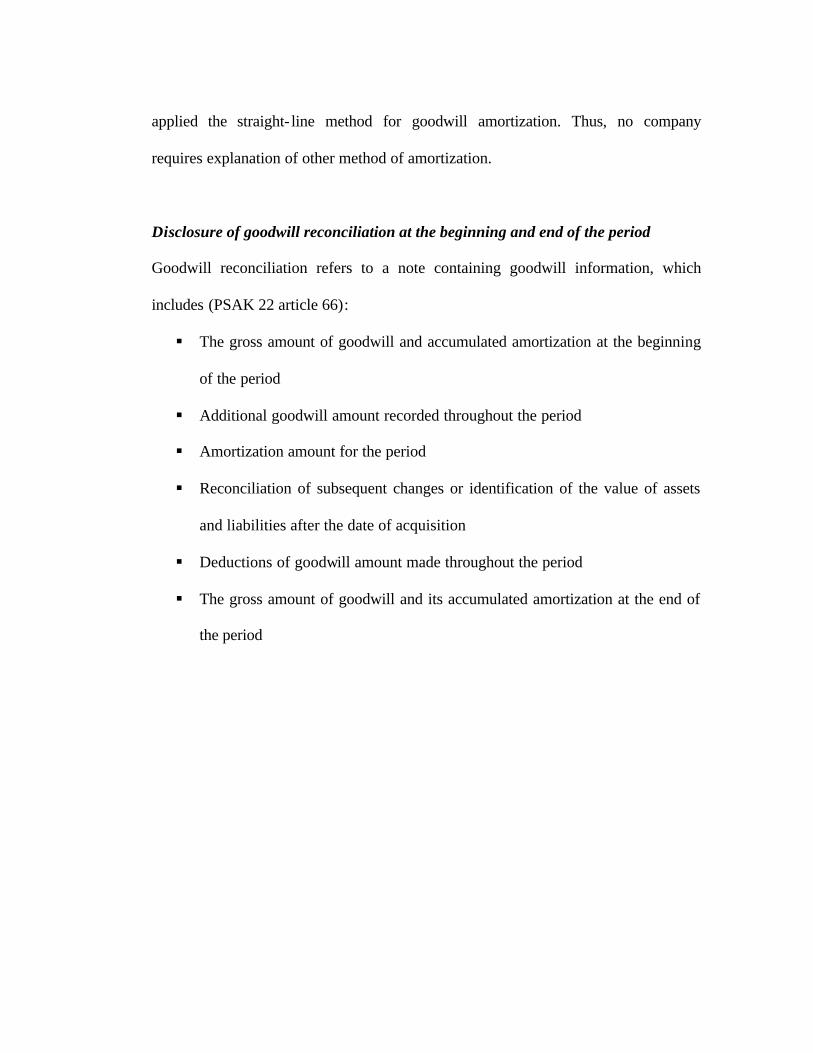
Figure 4.5
Disclosure of Goodwill Reconciliation at the Beginning and End of Period
RECONCILIATIONS AT THE BEGINNING AND END OF PERIOD
83.87%
16.13%
0.00%
20.00%
40.00%
60.00%
80.00%
100.00%
YES NO
According to Figure 4.5, 84% of sample companies provide reconciliations of
goodwill at the beginning and end of period.
4.1.4 Negative goodwill
In regards of negative goodwill, from a population of 342 listed companies, 23
companies disclose negative goodwill in their financial statement. Those 23
companies have complied with Indonesia’s standard which requires Indonesian
companies recognize negative goodwill in the section after non-current liabilities,
before equity.
Negative goodwill occurs when the cost of acquisition is lower than the fair value of
identifiable net assets at the date of acquisition. The International Accounting
Standard (IAS) 22 does not allow recognition of negative goodwill as liabilities at the
time of the acquisition. Otherwise, the excess of acquirer’s interest in the net fair
value of acquiree’s identifiable assets, liabilities and contingent liabilities over cost
shall be reassessed and recognized immediately in the statement of profit or loss. This
accounting treatment is also applied in other countries such as US, UK, and Australia.
However, just like positive goodwill, Indonesian accounting standard for negative
goodwill is different from that standard. Under the PSAK No. 22 article 46, negative
goodwill should be treated as the following:
“If the cost of acquisition is lower than the fair value of identifiable assets
and liabilities at the date of transaction, then the fair value of the acquired
non-monetary assets should be eliminated in a proportional manner, until all
the residual amount is eliminated. If after all the fair value of the non-
monetary assets is eliminated, still there is residual amount that has not been
eliminated, then the remaining residual amount is considered as negative
goodwill and treated as deferred income, and be recognized as revenue
systematically over a period not less than 20 years” (IAI 2004, freely
translated by author).
4.2 Hypotheses Tested
This thesis studies the nature of goodwill with reference to its accounting treatment in
Indonesia. Analysis is referred to the “future economic benefit” nature of goodwill as
one factor to the existing treatment. The four hypotheses being tested are:
H1: There is a positive relationship between goodwill and the company’s earnings
presented in the financial statements at the same accounting periods.
H2: There is a positive relationship between goodwill and earnings achieved by
the grouped sample companies (classified by goodwill proportion to total
assets) at the same respective periods.
H3: There is a positive relationship between the amount of goodwill presented in
the financial statements and earnings achieved during the following years.
H4: There is a positive relationship between the initial goodwill amount (the
purchased amount of goodwill) and earnings achieved within a period after
the initial recognition of goodwill.
4.2.1 Relationship between Goodwill and the Company’s Earnings
The first hypothesis is intended to test the correlation between goodwill and earnings
presented in a company’s financial report at the same respective years.
The first hypothesis can be stated in the null and alternate as follows:
H0: There is no positive relationship between net goodwill and the company’s
earnings presented in the financial statements at the same accounting periods.
Statistically expressed: H0: ? = 0
where ? is the relationship between goodwill and the company’s earnings presented
in the financial statements within the same accounting periods.
H1: There is a positive relationship between net goodwill and the company’s
earnings presented in the financial statements at the same accounting periods.
Statistically expressed: H1: ? ? 0
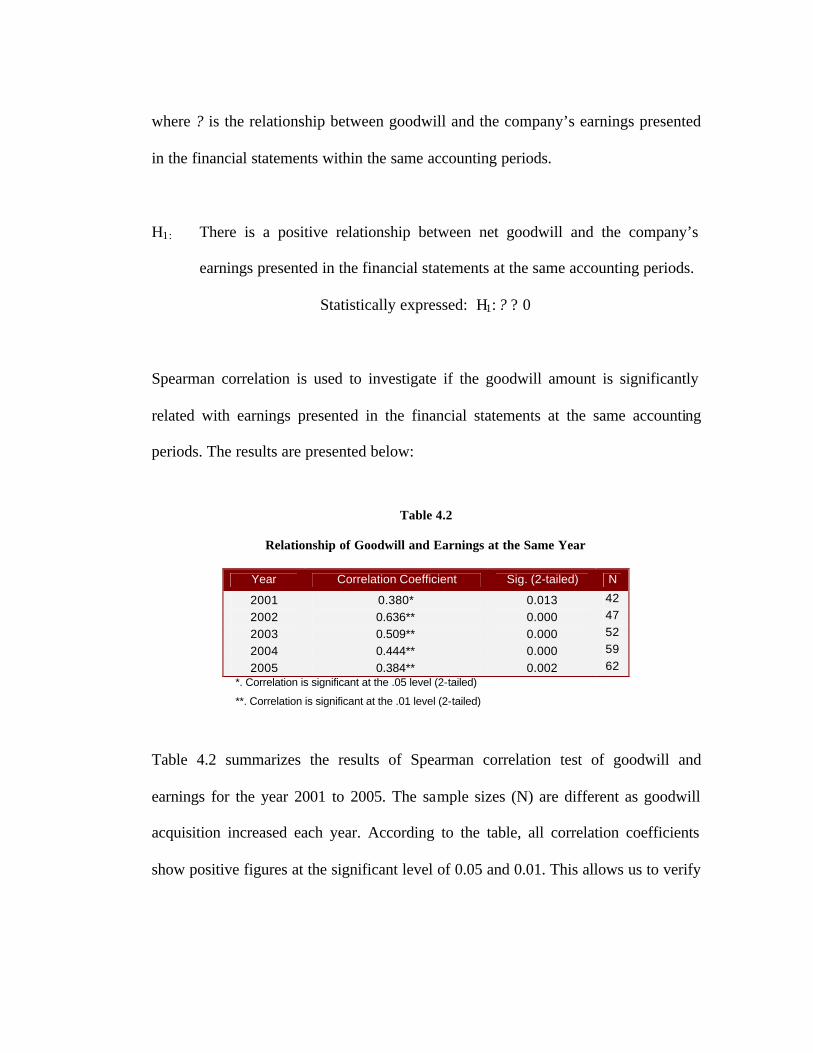
Spearman correlation is used to investigate if the goodwill amount is significantly
related with earnings presented in the financial statements at the same accounting
periods. The results are presented below:
Table 4.2
Relationship of Goodwill and Earnings at the Same Year
Year Correlation Coefficient Sig. (2-tailed) N
2001 0.380* 0.013 42
2002 0.636** 0.000 47
2003 0.509** 0.000 52
2004 0.444** 0.000 59
2005 0.384** 0.002 62 *. Correlation is significant at the .05 level (2-tailed)
**. Correlation is significant at the .01 level (2-tailed)
Table 4.2 summarizes the results of Spearman correlation test of goodwill and
earnings for the year 2001 to 2005. The sample sizes (N) are different as goodwill
acquisition increased each year. According to the table, all correlation coefficients
show positive figures at the significant level of 0.05 and 0.01. This allows us to verify
that net goodwill amount presented in the financial statements positively and
significantly related to a company’s earnings at the same respective period.
This hypothesis, therefore, answers the second research question: Is there positive
correlation between goodwill amount and earnings? These findings are similar to
Archel’s study, in which he reported the existence of strong relationship between
goodwill and profits from a sample ranges from 42 to 48 groups of companies, listed
in the Spanish Stock Exchange, for the year 1992 to 1996.
4.2.2 Does the size of goodwill have an effect on a business’s capacity to earn
higher profits?
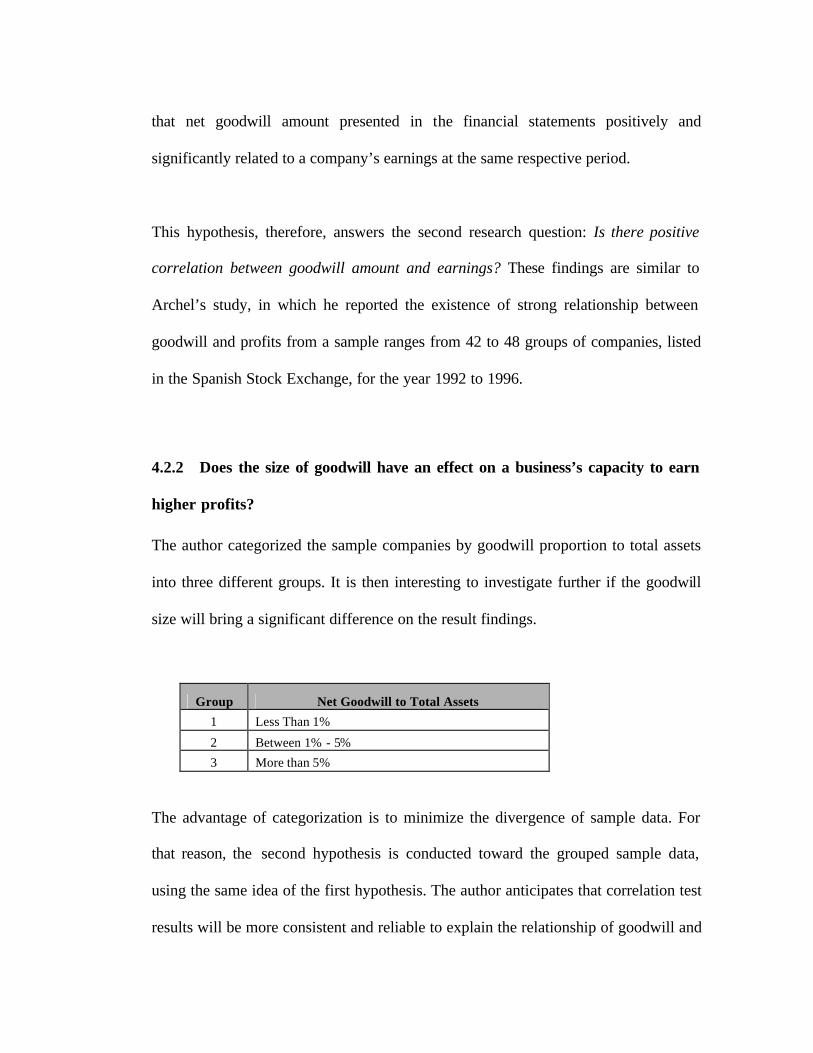
The author categorized the sample companies by goodwill proportion to total assets
into three different groups. It is then interesting to investigate further if the goodwill
size will bring a significant difference on the result findings.
Group Net Goodwill to Total Assets
1 Less Than 1%
2 Between 1% - 5%
3 More than 5%
The advantage of categorization is to minimize the divergence of sample data. For
that reason, the second hypothesis is conducted toward the grouped sample data,
using the same idea of the first hypothesis. The author anticipates that correlation test
results will be more consistent and reliable to explain the relationship of goodwill and
earnings at the same respective periods. Moreover, the result findings may also
explain how the size of goodwill can affect a business’s capacity to earn higher
profits.
The second hypothesis can be stated in the null and alternate as follows:
H0: There is no positive relationship between net goodwill and earnings achieved
by the grouped sample companies at the same respective periods.
Statistically expressed: H0: ? = 0
where ? is the relationship between net goodwill and earnings achieved by groups of
companies (classified by goodwill proportion total assets) at the same respective
periods.
H1: There is a positive relationship between net goodwill and earnings achieved
by the grouped sample companies at the same respective periods.
Statistically expressed: H1: ? ? 0
As the sample companies are separated by groups, the sample sizes for each test
reduce. The ranges of sample sizes for Group 1 are between 21 and 37 companies.
Group 2 requires sample size of 14 to 21 companies. And Group 3, the smallest
group, only has sample size of 7 to 9 companies. As small number of the company
samples may affect the accuracy and consistency of results, two correlation test
methods are used. Both Pearson and Spearman Correlation Tests are conducted to
indicate positive correlation between net goodwill and earnings at the same respective
accounting period.
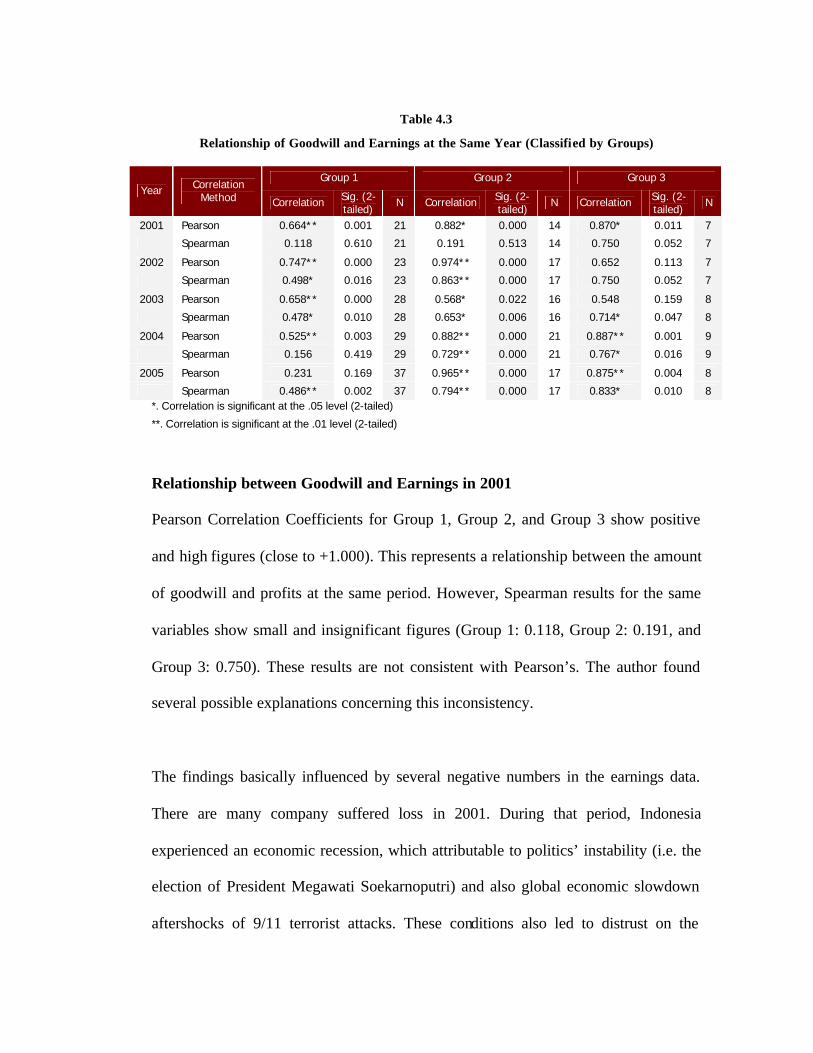
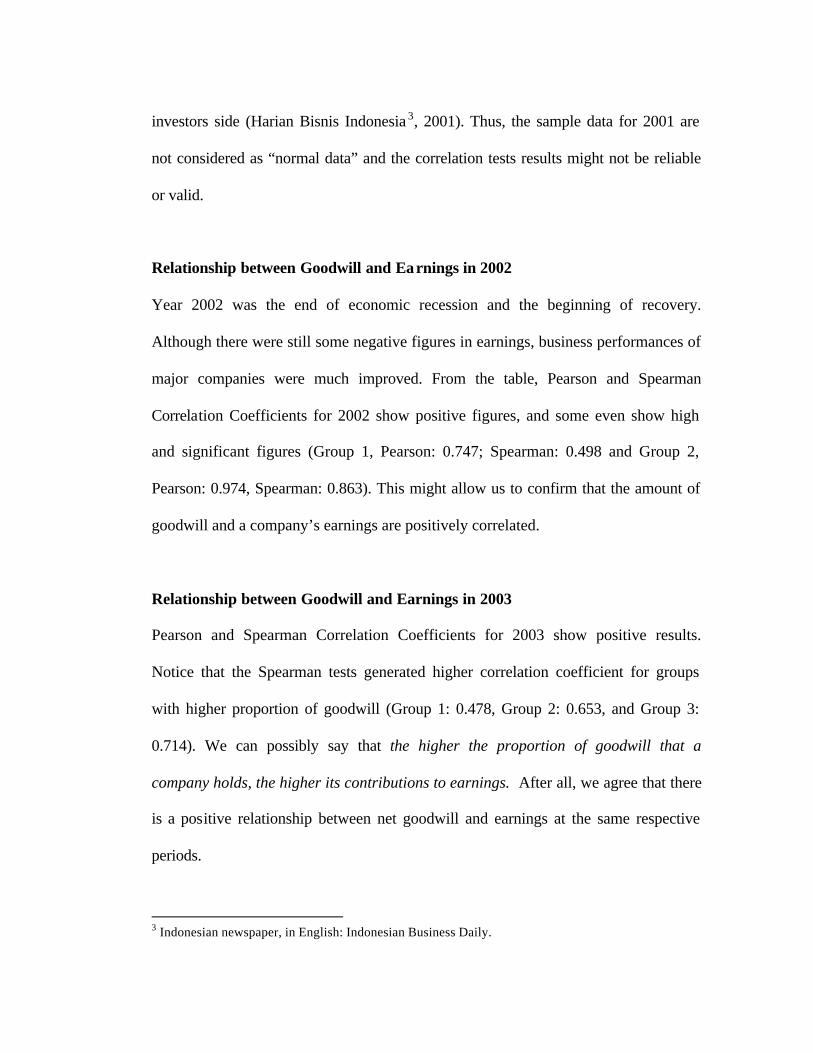
Table 4.3
Relationship of Goodwill and Earnings at the Same Year (Classified by Groups)
Group 1 Group 2 Group 3 Year Correlation
Method Correlation Sig. (2-tailed)
N Correlation Sig. (2-tailed)
N Correlation Sig. (2-tailed)
N
2001 Pearson 0.664** 0.001 21 0.882* 0.000 14 0.870* 0.011 7
Spearman 0.118 0.610 21 0.191 0.513 14 0.750 0.052 7
2002 Pearson 0.747** 0.000 23 0.974** 0.000 17 0.652 0.113 7
Spearman 0.498* 0.016 23 0.863** 0.000 17 0.750 0.052 7
2003 Pearson 0.658** 0.000 28 0.568* 0.022 16 0.548 0.159 8
Spearman 0.478* 0.010 28 0.653* 0.006 16 0.714* 0.047 8
2004 Pearson 0.525** 0.003 29 0.882** 0.000 21 0.887** 0.001 9
Spearman 0.156 0.419 29 0.729** 0.000 21 0.767* 0.016 9
2005 Pearson 0.231 0.169 37 0.965** 0.000 17 0.875** 0.004 8
Spearman 0.486** 0.002 37 0.794** 0.000 17 0.833* 0.010 8 *. Correlation is significant at the .05 level (2-tailed)
**. Correlation is significant at the .01 level (2-tailed)
Relationship between Goodwill and Earnings in 2001
Pearson Correlation Coefficients for Group 1, Group 2, and Group 3 show positive
and high figures (close to +1.000). This represents a relationship between the amount
of goodwill and profits at the same period. However, Spearman results for the same
variables show small and insignificant figures (Group 1: 0.118, Group 2: 0.191, and
Group 3: 0.750). These results are not consistent with Pearson’s. The author found
several possible explanations concerning this inconsistency.
The findings basically influenced by several negative numbers in the earnings data.
There are many company suffered loss in 2001. During that period, Indonesia
experienced an economic recession, which attributable to politics’ instability (i.e. the
election of President Megawati Soekarnoputri) and also global economic slowdown
aftershocks of 9/11 terrorist attacks. These conditions also led to distrust on the
investors side (Harian Bisnis Indonesia 3, 2001). Thus, the sample data for 2001 are
not considered as “normal data” and the correlation tests results might not be reliable
or valid.
Relationship between Goodwill and Earnings in 2002
Year 2002 was the end of economic recession and the beginning of recovery.
Although there were still some negative figures in earnings, business performances of
major companies were much improved. From the table, Pearson and Spearman
Correlation Coefficients for 2002 show positive figures, and some even show high
and significant figures (Group 1, Pearson: 0.747; Spearman: 0.498 and Group 2,
Pearson: 0.974, Spearman: 0.863). This might allow us to confirm that the amount of
goodwill and a company’s earnings are positively correlated.
Relationship between Goodwill and Earnings in 2003
Pearson and Spearman Correlation Coefficients for 2003 show positive results.
Notice that the Spearman tests generated higher correlation coefficient for groups
with higher proportion of goodwill (Group 1: 0.478, Group 2: 0.653, and Group 3:
0.714). We can possibly say that the higher the proportion of goodwill that a
company holds, the higher its contributions to earnings. After all, we agree that there
is a positive relationship between net goodwill and earnings at the same respective
periods.
3 Indonesian newspaper, in English: Indonesian Business Daily.
Relationship between Goodwill and Earnings in 2004
Pearson correlation coefficients for all groups show positive and significant figures
(Group 1: 0.525, Group 2: 0.882, and Group 3: 0.887). Spearman correlation also
yields positive and significant figures, except for Group 1 (r = 0.156). This might
suggest that, for a group of “small-goodwill” companies, the amount of goodwill does
not significantly affect earnings. However, Group 2 and Group 3 generate positive
and significant figures of 0.729 and 0.767 respectively. Again, both Pearson’s and
Spearman’s results show greater outcomes for groups with higher proportion of
goodwill. Not only the findings signify the existence of relationship between net
goodwill and earnings at the same periods, it also proves that the proportion of
goodwill that a company holds affect its contributions to the company’s earnings.
Relationship between Goodwill and Earnings in 2005
Pearson and Spearman Correlations for Group 2 and Group 3 show that goodwill and
earnings are positively and significantly related (Group 2, Pearson: 0.965; Spearman:
0.794 and Group 3, Pearson: 0.875, Spearman: 0.833). However, Spearman’s and
Pearson’s results are inconsistent for Group 1 (Pearson: 0.231 and Spearman: 0.486,
significant at the 0.01 level). This might indicate that the amount of goodwill does not
consistently contribute to company’s earnings for Group 1. Nevertheless, the
outcomes verify the existence of relationship between net goodwill and company’s
earnings at the same respective periods.
In summary, all figures presented in Table 4.3 are positive. These findings strengthen
the conclusion for hypothesis one that there is a positive relationship between net
goodwill and the company’s earnings presented in the financial statements at the
same accounting periods. Moreover, based on the 2003’s, 2004’s and 2005’s results,
the correlation coefficients are higher and more significant for groups with larger
proportion of goodwill. The findings answer the third research question: Does the size
of goodwill have an effect on a business’s capacity to earn higher profits? It is found
that the proportion of goodwill that a company holds relates to its contributions to the
company’s earnings. In other words, the size of goodwill has an effect on a business’s
capacity to earn higher profits.
4.2.3 Is Goodwill an Asset?
The third hypothesis is intended to verify the nature of goodwill as having the
essential characteristics of assets. While goodwill had clearly met the two
characteristics of assets (i.e. the occurrence of past transaction and the rights to
control the assets), the “future economic benefits” of goodwill is often debatable. The
term “future economic benefits” most likely refers to the returns that a company
achieves after an investment is made. The returns on goodwill (investment) will
appear during the periods subsequent to its recognition in the financial statements.
Hence, the third hypothesis will test net goodwill and its effect to the future benefits
of a company, in this case, earnings achieved during the following years.
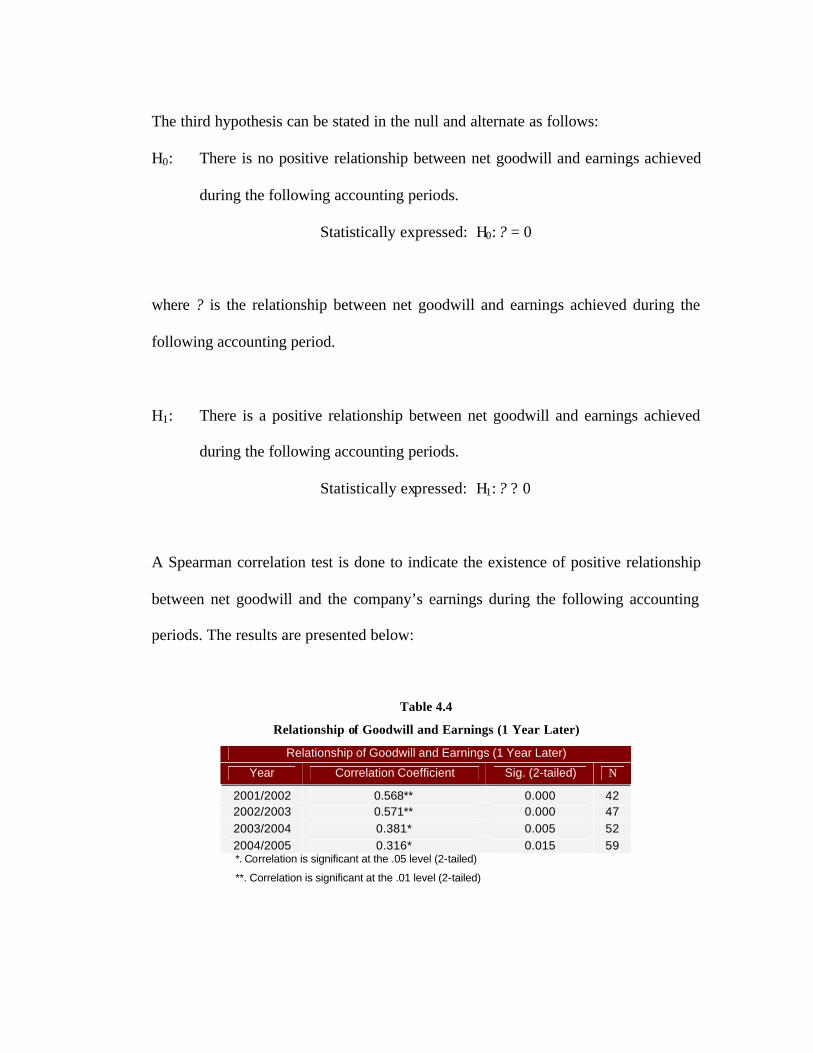
The third hypothesis can be stated in the null and alternate as follows:
H0: There is no positive relationship between net goodwill and earnings achieved
during the following accounting periods.
Statistically expressed: H0: ? = 0
where ? is the relationship between net goodwill and earnings achieved during the
following accounting period.
H1: There is a positive relationship between net goodwill and earnings achieved
during the following accounting periods.
Statistically expressed: H1: ? ? 0
A Spearman correlation test is done to indicate the existence of positive relationship
between net goodwill and the company’s earnings during the following accounting
periods. The results are presented below:
Table 4.4
Relationship of Goodwill and Earnings (1 Year Later) Relationship of Goodwill and Earnings (1 Year Later)
Year Correlation Coefficient Sig. (2-tailed) N
2001/2002 0.568** 0.000 42 2002/2003 0.571** 0.000 47 2003/2004 0.381* 0.005 52 2004/2005 0.316* 0.015 59 *. Correlation is significant at the .05 level (2-tailed)
**. Correlation is significant at the .01 level (2-tailed)
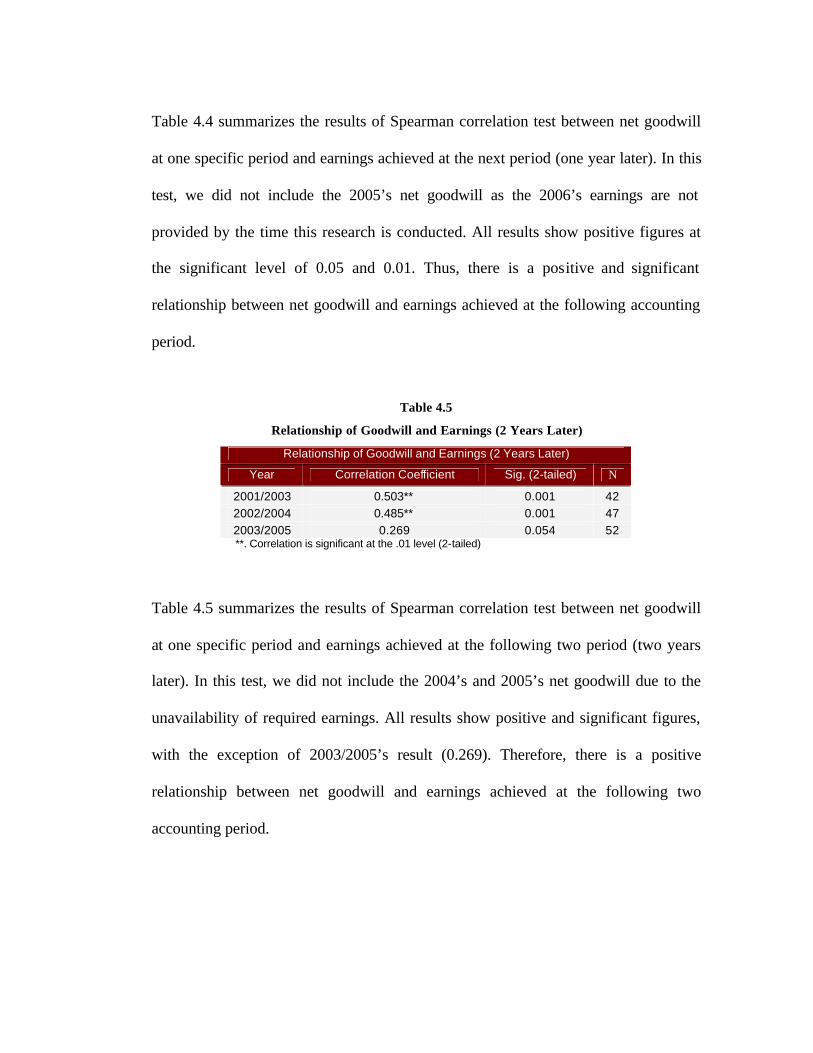
Table 4.4 summarizes the results of Spearman correlation test between net goodwill
at one specific period and earnings achieved at the next period (one year later). In this
test, we did not include the 2005’s net goodwill as the 2006’s earnings are not
provided by the time this research is conducted. All results show positive figures at
the significant level of 0.05 and 0.01. Thus, there is a positive and significant
relationship between net goodwill and earnings achieved at the following accounting
period.
Table 4.5
Relationship of Goodwill and Earnings (2 Years Later) Relationship of Goodwill and Earnings (2 Years Later)
Year Correlation Coefficient Sig. (2-tailed) N
2001/2003 0.503** 0.001 42 2002/2004 0.485** 0.001 47 2003/2005 0.269 0.054 52 **. Correlation is significant at the .01 level (2-tailed)
Table 4.5 summarizes the results of Spearman correlation test between net goodwill
at one specific period and earnings achieved at the following two period (two years
later). In this test, we did not include the 2004’s and 2005’s net goodwill due to the
unavailability of required earnings. All results show positive and significant figures,
with the exception of 2003/2005’s result (0.269). Therefore, there is a positive
relationship between net goodwill and earnings achieved at the following two
accounting period.
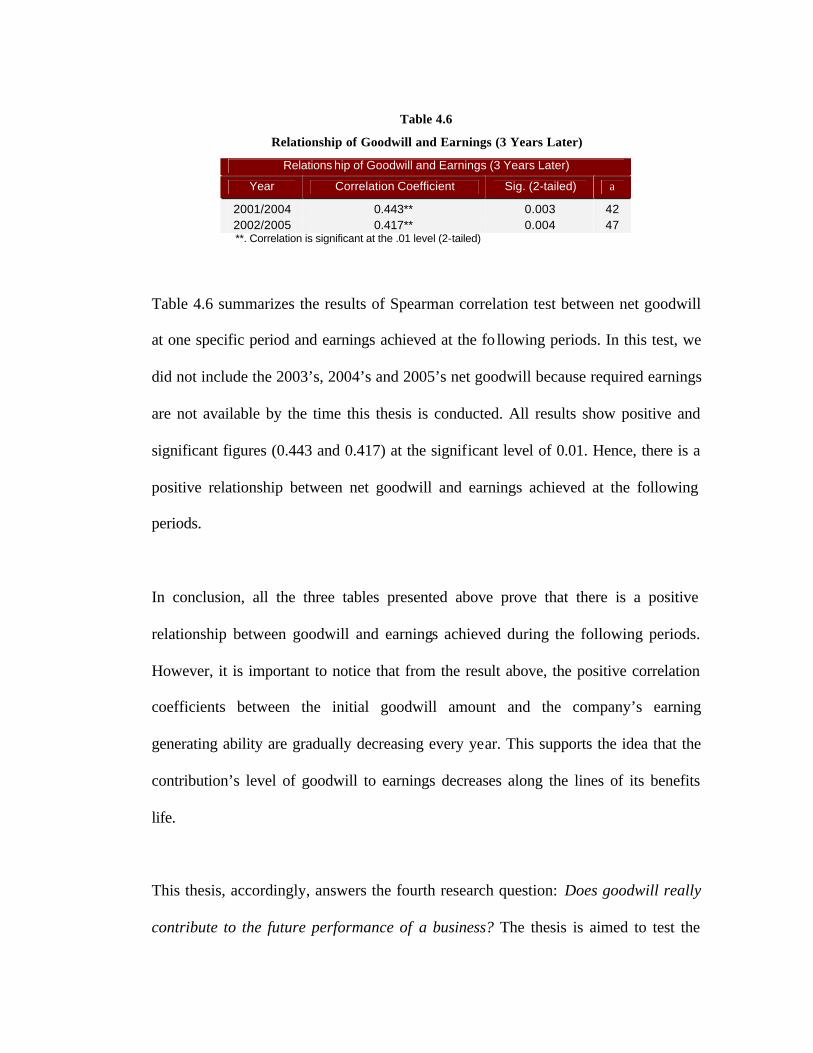
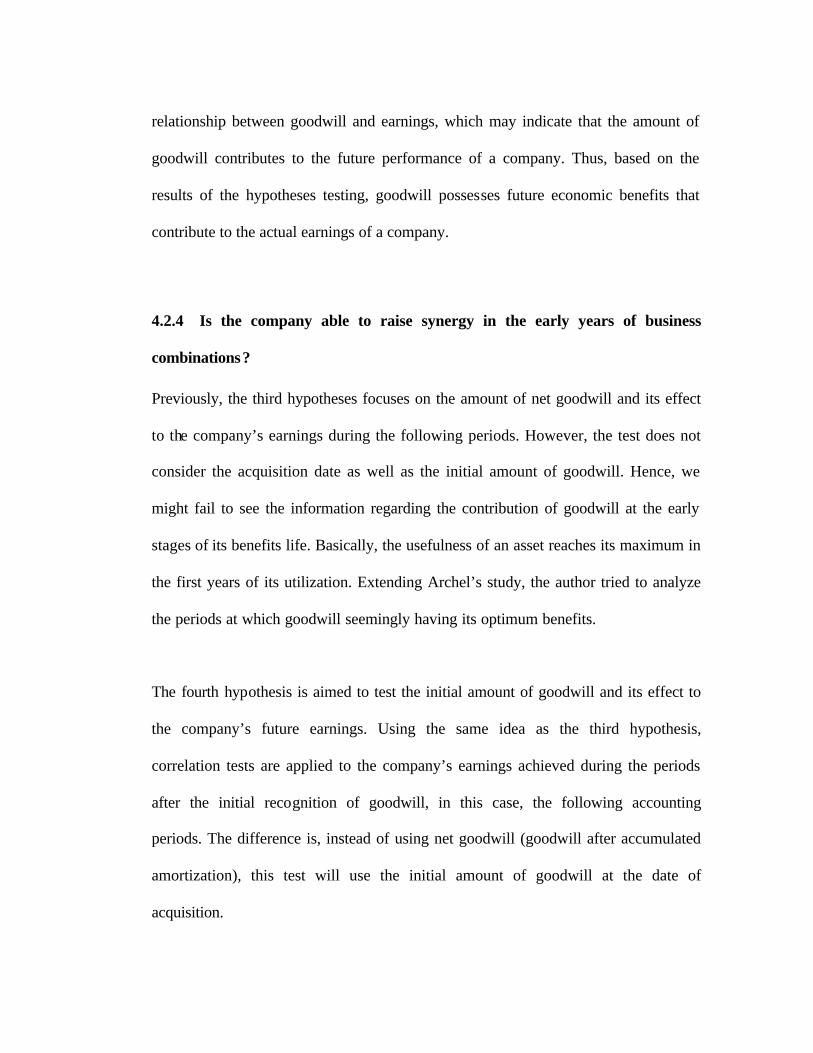
Table 4.6
Relationship of Goodwill and Earnings (3 Years Later) Relations hip of Goodwill and Earnings (3 Years Later)
Year Correlation Coefficient Sig. (2-tailed) a
2001/2004 0.443** 0.003 42 2002/2005 0.417** 0.004 47 **. Correlation is significant at the .01 level (2-tailed)
Table 4.6 summarizes the results of Spearman correlation test between net goodwill
at one specific period and earnings achieved at the fo llowing periods. In this test, we
did not include the 2003’s, 2004’s and 2005’s net goodwill because required earnings
are not available by the time this thesis is conducted. All results show positive and
significant figures (0.443 and 0.417) at the significant level of 0.01. Hence, there is a
positive relationship between net goodwill and earnings achieved at the following
periods.
In conclusion, all the three tables presented above prove that there is a positive
relationship between goodwill and earnings achieved during the following periods.
However, it is important to notice that from the result above, the positive correlation
coefficients between the initial goodwill amount and the company’s earning
generating ability are gradually decreasing every year. This supports the idea that the
contribution’s level of goodwill to earnings decreases along the lines of its benefits
life.
This thesis, accordingly, answers the fourth research question: Does goodwill really
contribute to the future performance of a business? The thesis is aimed to test the
relationship between goodwill and earnings, which may indicate that the amount of
goodwill contributes to the future performance of a company. Thus, based on the
results of the hypotheses testing, goodwill possesses future economic benefits that
contribute to the actual earnings of a company.
4.2.4 Is the company able to raise synergy in the early years of business
combinations?
Previously, the third hypotheses focuses on the amount of net goodwill and its effect
to the company’s earnings during the following periods. However, the test does not
consider the acquisition date as well as the initial amount of goodwill. Hence, we
might fail to see the information regarding the contribution of goodwill at the early
stages of its benefits life. Basically, the usefulness of an asset reaches its maximum in
the first years of its utilization. Extending Archel’s study, the author tried to analyze
the periods at which goodwill seemingly having its optimum benefits.
The fourth hypothesis is aimed to test the initial amount of goodwill and its effect to
the company’s future earnings. Using the same idea as the third hypothesis,
correlation tests are applied to the company’s earnings achieved during the periods
after the initial recognition of goodwill, in this case, the following accounting
periods. The difference is, instead of using net goodwill (goodwill after accumulated
amortization), this test will use the initial amount of goodwill at the date of
acquisition.
The fourth hypothesis can be stated in the null and alternate as follows:
H0: There is a positive relationship between the initial goodwill amount and
earnings achieved during a period after the initial recognition of goodwill.
Statistically expressed: H0: ? = 0
where ? is the relationship between the initial goodwill amount and earnings achieved
during a period after the initial recognition of goodwill.
H1: There is a positive relationship between the initial goodwill amount and
earnings achieved during a period after the initial recognition of goodwill.
Statistically expressed: H1: ? ? 0
Pearson correlation test is done to identify the existence of relationship between the
initial goodwill amount and earnings achieved after goodwill is recognized in the
financial statements. The sample sizes of each test are 20 and below, which might be
insufficient to generate accurate and consistent results. Subsequently, Spearman
correlation test is done to examine the significance and the consistency of correlations
and support Pearson test results. The results are presented below:
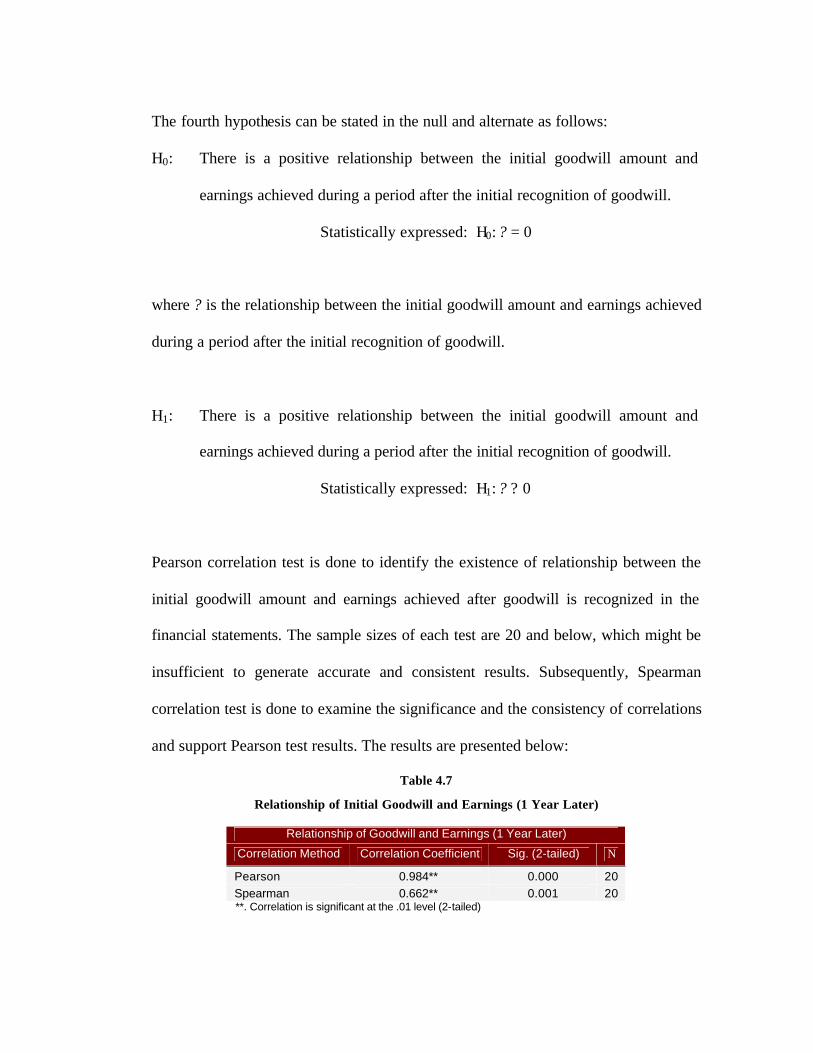
Table 4.7
Relationship of Initial Goodwill and Earnings (1 Year Later)
Relationship of Goodwill and Earnings (1 Year Later)
Correlation Method Correlation Coefficient Sig. (2-tailed) N
Pearson 0.984** 0.000 20 Spearman 0.662** 0.001 20 **. Correlation is significant at the .01 level (2-tailed)
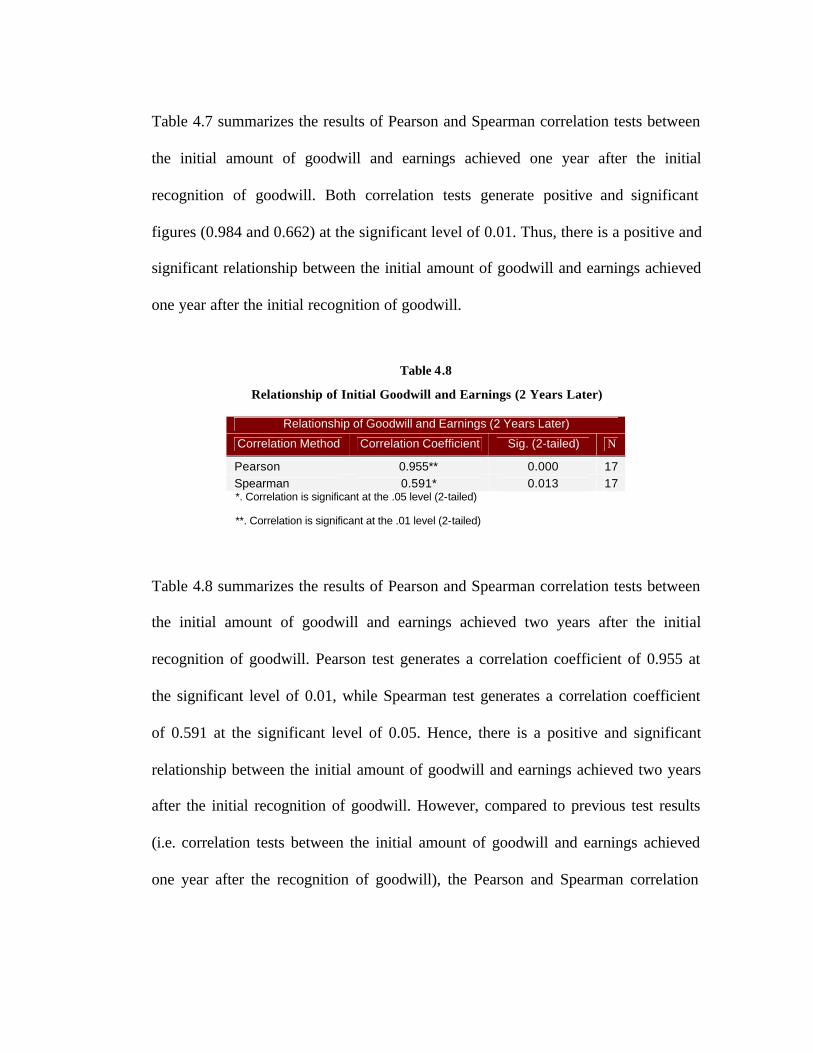
Table 4.7 summarizes the results of Pearson and Spearman correlation tests between
the initial amount of goodwill and earnings achieved one year after the initial
recognition of goodwill. Both correlation tests generate positive and significant
figures (0.984 and 0.662) at the significant level of 0.01. Thus, there is a positive and
significant relationship between the initial amount of goodwill and earnings achieved
one year after the initial recognition of goodwill.
Table 4.8
Relationship of Initial Goodwill and Earnings (2 Years Later)
Relationship of Goodwill and Earnings (2 Years Later)
Correlation Method Correlation Coefficient Sig. (2-tailed) N
Pearson 0.955** 0.000 17 Spearman 0.591* 0.013 17 *. Correlation is significant at the .05 level (2-tailed)
**. Correlation is significant at the .01 level (2-tailed)
Table 4.8 summarizes the results of Pearson and Spearman correlation tests between
the initial amount of goodwill and earnings achieved two years after the initial
recognition of goodwill. Pearson test generates a correlation coefficient of 0.955 at
the significant level of 0.01, while Spearman test generates a correlation coefficient
of 0.591 at the significant level of 0.05. Hence, there is a positive and significant
relationship between the initial amount of goodwill and earnings achieved two years
after the initial recognition of goodwill. However, compared to previous test results
(i.e. correlation tests between the initial amount of goodwill and earnings achieved
one year after the recognition of goodwill), the Pearson and Spearman correlation
coefficients are smaller. This signifies that the contribution level of goodwill is
greater at the first year, rather than at the second year.
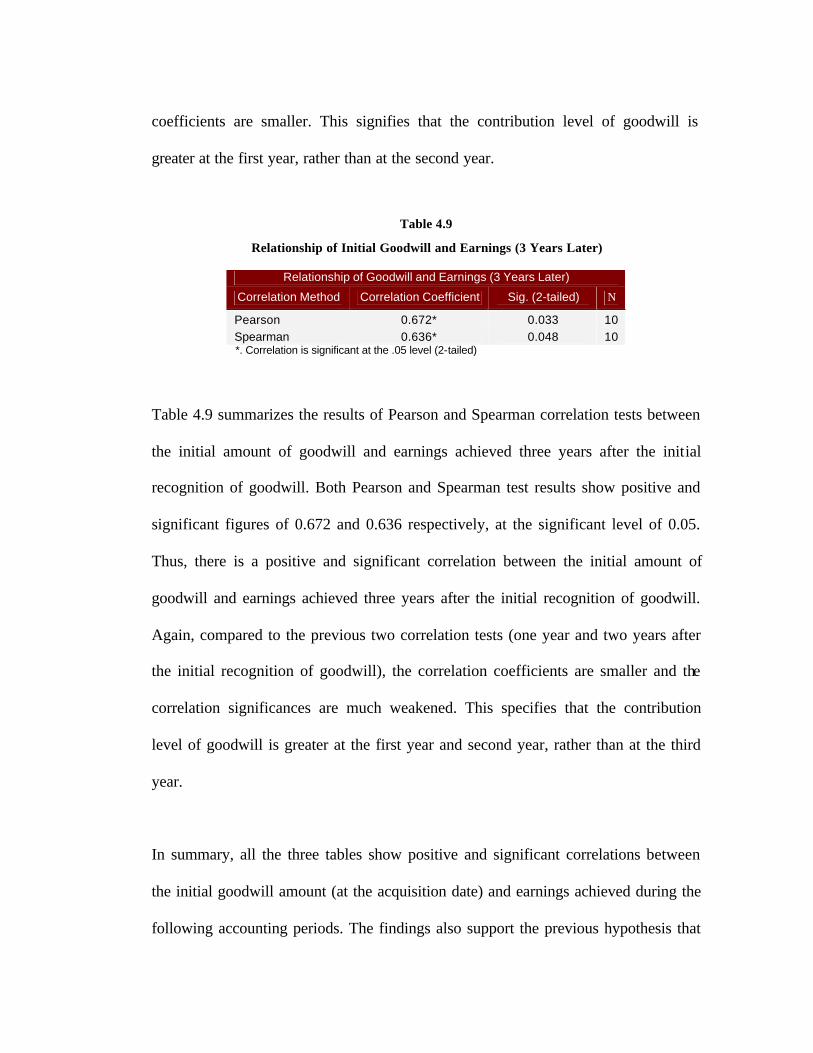
Table 4.9
Relationship of Initial Goodwill and Earnings (3 Years Later)
Relationship of Goodwill and Earnings (3 Years Later)
Correlation Method Correlation Coefficient Sig. (2-tailed) N
Pearson 0.672* 0.033 10 Spearman 0.636* 0.048 10 *. Correlation is significant at the .05 level (2-tailed)
Table 4.9 summarizes the results of Pearson and Spearman correlation tests between
the initial amount of goodwill and earnings achieved three years after the initial
recognition of goodwill. Both Pearson and Spearman test results show positive and
significant figures of 0.672 and 0.636 respectively, at the significant level of 0.05.
Thus, there is a positive and significant correlation between the initial amount of
goodwill and earnings achieved three years after the initial recognition of goodwill.
Again, compared to the previous two correlation tests (one year and two years after
the initial recognition of goodwill), the correlation coefficients are smaller and the
correlation significances are much weakened. This specifies that the contribution
level of goodwill is greater at the first year and second year, rather than at the third
year.
In summary, all the three tables show positive and significant correlations between
the initial goodwill amount (at the acquisition date) and earnings achieved during the
following accounting periods. The findings also support the previous hypothesis that
goodwill contributes to the future benefits of a company. Furthermore, the correlation
coefficients between the initial goodwill amount and earnings are higher and also
more significant at the first years after the initial recognition of goodwill. The results
may reflect that companies are able to derive the synergy from Business
Combinations in the early years. Nonetheless, the effect of Business Combinations to
the company’s ability in generating profit is declining through times.