Chapter 4 Facility Requirements - University Park Airport
74
Chapter 4 – Facility Requirements July 2016 Page 4-1 Chapter 4 Facility Requirements To plan for future airport infrastructure improvements, a facility requirements analysis must first be conducted to measure how well existing facilities are able to meet current and projected demand. The objective of this analysis is to determine the long-term flexibility and growth potential of existing infrastructure elements to respond to changing demand scenarios over a 20-year planning period. Those facilities unable to accommodate demand will be the focus of the alternatives analysis that will identify, review, and evaluate infrastructure improvement options to meet the needs of University Park Airport (Airport) users. This chapter provides a summary of the existing conditions of airside and landside facilities at the Airport and provides recommendations for facility improvements that are anticipated to be needed to meet current and future demand. The recommendations developed in this chapter provide a baseline for not only the development of alternatives, but also future Airport staffing, funding, development and programming decisions. The recommendations from the facility requirement analysis are presented in this chapter and organized by the following sections: 4.1 Demand/Capacity Analysis 4.2 Wind Coverage 4.3 Identification of Design Standards 4.4 Runway 6/24 4.5 Taxiway System 4.6 Aprons 4.7 Navigational Aids and Weather Equipment 4.8 Terminal Area 4.9 General Aviation Facilities 4.10 Support Facilities 4.11 Airport Traffic Control Tower 4.12 Summary 4.1 Demand/Capacity Analysis Demand/capacity analyses measure the maximum capacity of an airfield to process a given volume of air traffic within a specified time period before delays are experienced. A number of factors can impact the capacity of an airfield including configuration of runways, number and location of exit taxiways, local weather conditions, and runway use as dictated by the wind. To help account for these factors when measuring the capacity of an airfield, the Federal Aviation Administration (FAA) published Advisory Circular
Transcript of Chapter 4 Facility Requirements - University Park Airport

Chapter 4 – Facility Requirements
July 2016 Page 4-1
Chapter 4
Facility Requirements
To plan for future airport infrastructure improvements, a facility requirements analysis must first be
conducted to measure how well existing facilities are able to meet current and projected demand. The
objective of this analysis is to determine the long-term flexibility and growth potential of existing
infrastructure elements to respond to changing demand scenarios over a 20-year planning period. Those
facilities unable to accommodate demand will be the focus of the alternatives analysis that will identify,
review, and evaluate infrastructure improvement options to meet the needs of University Park Airport
(Airport) users. This chapter provides a summary of the existing conditions of airside and landside facilities
at the Airport and provides recommendations for facility improvements that are anticipated to be needed to
meet current and future demand. The recommendations developed in this chapter provide a baseline for
not only the development of alternatives, but also future Airport staffing, funding, development and
programming decisions.
The recommendations from the facility requirement analysis are presented in this chapter and organized
by the following sections:
4.1 Demand/Capacity Analysis
4.2 Wind Coverage
4.3 Identification of Design Standards
4.4 Runway 6/24
4.5 Taxiway System
4.6 Aprons
4.7 Navigational Aids and Weather Equipment
4.8 Terminal Area
4.9 General Aviation Facilities
4.10 Support Facilities
4.11 Airport Traffic Control Tower
4.12 Summary
4.1 Demand/Capacity Analysis
Demand/capacity analyses measure the maximum capacity of an airfield to process a given volume of air
traffic within a specified time period before delays are experienced. A number of factors can impact the
capacity of an airfield including configuration of runways, number and location of exit taxiways, local
weather conditions, and runway use as dictated by the wind. To help account for these factors when
measuring the capacity of an airfield, the Federal Aviation Administration (FAA) published Advisory Circular

Chapter 4 – Facility Requirements
Page 4-2 July 2016
(AC) 150/5060-5, Airport Capacity and Delay, which offers mathematical formulas and other computational
methods to calculate capacity and aircraft delay for airport planning and design purposes. In general, the
AC assumes airfields with a single runway and full parallel taxiway are typically capable of accommodating
approximately 200,000 annual aircraft operations. As illustrated in Table 4-1, approximately 46,000 annual
aircraft operations are anticipated to occur at the Airport by 2032, which is significantly less than the
threshold of 200,000 at which capacity is typically strained for an airfield configuration that consists of a
single runway. As such, the capacity of the airfield appears adequate for projected operational demand
throughout the planning period.
Table 4-1: Summary of Forecasted Aircraft Operations
Year Air Carrier General Aviation Military Total
Existing
2012 14,293 25,733 863 40,889
Projected
2017 13,210 27,352 863 41,425
2022 12,698 29,071 863 42,632
2027 12,046 30,874 863 43,783
2032 12,276 32,776 863 45,914
Source: Mead & Hunt, Inc. (2013)
4.2 Wind Coverage
Since aircraft typically land and takeoff into the wind, it is important that the orientation of a runway is aligned
in the same direction as local prevailing winds. FAA AC 150/5300-13A, Airport Design, recommends that
a runway orientation provide least 95 percent wind coverage for aircraft types that use an airport on a
regular basis. If sufficient wind coverage cannot be provided by a single runway, then it is recommended
that an airport also have a crosswind runway. It is important to note that smaller aircraft are more
significantly impacted by crosswinds, or winds that are perpendicular to an aircraft’s path of travel.
In evaluating wind coverage at an airport, FAA guidance notes this assessment be computed on a basis
that crosswinds not exceed the maximum allowable velocities for the following aircraft categories:
• 10.5 knots for Airport Reference Code A-I and B-I aircraft
• 13 knots for Airport Reference Code A-II and B-II aircraft
• 16 knots for Airport Reference Code A-III, B-III, and C-I through D-III aircraft
• 20 knots for Airport Reference Code A-IV through D-VI aircraft
Data gathered from the National Climatic Data Center (NCDC) of local wind conditions at the Airport
indicates that the orientation of the Airport’s single runway, Runway 6/24, provides sufficient wind coverage
in a 10.5 knot crosswind 94.38 percent of the time in all weather conditions (Table 4-2). It should also be

Chapter 4 – Facility Requirements
July 2016 Page 4-3
noted as illustrated in Table 4-3 that Runway 6/24 provides sufficient wind coverage 93.97 percent of the
time in a 10.5 knot crosswind when Visual Flight Rules (VFR) weather conditions are present. The
orientation of Runway 6/24 exceeds 95 percent recommended wind coverage in Instrument Flight Rules
(IFR) conditions (Table 4-4).
Table 4-2: Runway 6/24 Wind Coverage in All Weather Conditions
Crosswind (knots) Runway 6 Runway 6/24 Runway 24
10.5 57.76% 94.38% 82.99%
13 58.33% 97.12% 85.56%
16 58.96% 99.16% 87.45%
20 59.09% 99.82% 88.08%
Note: Single runway end coverage calculated with a 3 knot tailwind
Source: National Climatic Data Center, FAA Standard Wind Analysis tool
Station: State College, Pennsylvania
Period of Record: 2000-2009 based on 81,921 hourly observations
Table 4-3: Runway 6/24 Wind Coverage in Visual Flight Rules Weather Conditions
Crosswind (knots) Runway 6 Runway 6/24 Runway 24
10.5 55.22% 93.97% 83.67%
13 55.83% 96.91% 86.43%
16 56.49% 99.11% 88.47%
20 56.63% 99.81% 89.14%
Note: Single runway end coverage calculated with a 3 knot tailwind
Source: National Climatic Data Center, FAA Standard Wind Analysis Tool
Station: State College, Pennsylvania
Period of Record: 2000-2009 based on 74,852 hourly observations
VFR = Ceiling is greater than or equal to 1,000 feet and visibility greater than or equal to 3 statute miles
Table 4-4: Runway 6/24 Wind Coverage in Instrument Flight Rules Weather Conditions
Crosswind (knots) Runway 6 Runway 6/24 Runway 24
10.5 82.69% 98.59% 73.29%
13 82.86% 99.22% 73.84%
16 83.04% 99.71% 74.26%
20 83.09% 99.90% 74.43%
Note: Single runway end coverage calculated with a 3 knot tailwind
Source: National Climatic Data Center, FAA Standard Wind Analysis tool
Station: State College, Pennsylvania
Period of Record: 2000-2009 based on 5,915 hourly observations
IFR = Ceiling is less than 1,000 feet but greater than or equal to 200 feet and/or visibility less than 3 statute miles but greater than or
equal to 1/2 statue mile
As illustrated by the wind analysis, the orientation of Runway 6/24 does not provide 95 percent wind
coverage in a 10.5 knot crosswind during all-weather conditions; as such, consideration should be given
for the need of a crosswind runway. It should be noted that the Airport previously operated a crosswind
runway (Runway 16/34) that was closed due to a number of factors that included:

Chapter 4 – Facility Requirements
Page 4-4 July 2016
• Non-Standard Runway Safety Areas (RSAs) – The former crosswind runway (Runway 16/34)
did not have RSAs that met FAA design standards due to terrain issues that did not meet safety
area gradient standards. In addition, airfield drainage structures, Fox Hill Road, and a service road
were located within the RSA. Improving the gradient of the safety area and relocating the roadways
and drainage structures outside of the safety area boundaries was not considered a financially
feasible option given that the runway could only be utilized by a few small single-engine aircraft
types. Likewise, relocating the runway thresholds to shorten the runway so that the safety areas
could be moved away from the terrain and object penetration issues would have placed further
limits on the utility of the runway.
• Limited Use – The crosswind runway, Runway 16/34, was 2,349 feet in length, 50 feet in width,
and designed for aircraft up to Airport Reference Code category B-I. Due to the length and width
of the runway, it was limited in use to only small single- and twin-engine aircraft, typically weighing
less than 12,500 pounds. Conditions favoring use of this runway were, on average, present
approximately five percent of the time, during which operations of small single- and twin-engine
aircraft were limited in number.
• Preferred Use of Runway 6/24 – Runway 6/24, at a length of 6,701 feet and a width of 150 feet,
offers significantly more lateral and longitudinal room than the former Runway 16/34 for small
single- and twin-engine aircraft to maneuver when conducting a takeoff or landing. This offers a
significant margin of safety advantage to smaller aircraft when conducting a landing or takeoff, even
in tolerable crosswind conditions.
• Increased Potential for Runway Incursion – At the time of the crosswind runway’s closure, the
Airport was an uncontrolled airfield that required pilots to communicate their positions with one
another when operating in the traffic pattern. The intersection of two runways increased the
potential for a runway incursion if aircraft did not properly communicate with each other and were
simultaneously conducting operations on both Runway 6/24 and the crosswind runway.
• Future Terminal Area Expansion – There is limited land on Airport property east of Runway 6/24
along Fox Hill Road that offers a centralized location to expand the terminal area. Given the limited
use of the former crosswind runway and its location adjacent to the terminal area, it was logical at
the time to plan for the future expansion of the terminal area within an area of land occupied by the
approach end of Runway 16. In anticipation of initial terminal area planning and site preparation,
Runway 16/34 was closed. It should be noted that the location of the future planned terminal
building as designated on the Airport Layout Plan (ALP) drawing set is at a site that overlays the
approach end of the former Runway 16.
In evaluating the need for a crosswind runway, it is important to note that the wind coverage provided by
Runway 6/24 falls 0.62 percent under the preferred wind coverage recommended by the FAA. Considering
the advantages and disadvantages of opening the former crosswind runway, or constructing a new
crosswind runway, with the long-term development needs of the Airport, justification can be made that
Runway 6/24 provides adequate wind coverage. While a crosswind runway will increase the percentage

Chapter 4 – Facility Requirements
July 2016 Page 4-5
of wind coverage at the Airport, it may impact the ability to expand and improve facilities to meet the needs
of existing and future users. If the former crosswind runway is opened, limited options will be available to
expand the terminal area, which is anticipated to need improvements to accommodate future commercial
airline demand. Likewise, opening the former crosswind runway is anticipated to receive limited use by few
aircraft types due to the length and width of the runway as well as the infrequent number of times wind
conditions are present that favor use of the runway. Given the preference by small aircraft pilots to conduct
landings and takeoffs on Runway 6/24 since its width and length provides an increased margin of safety,
and the environmental challenges of constructing a new crosswind runway, it is the opinion of the Master
Plan Advisory Committee (MPAC) that the orientation of Runway 6/24 provides sufficient wind coverage at
the Airport.
4.3 Identification of Design Standards
The design of airport infrastructure, such as runways, taxiways, and aprons, is based on design standards
established by the FAA that promote safety, economy and efficiency. Design standards that are most
appropriate to an airport are based on the operational and physical characteristics of the most demanding
type of aircraft that is projected to operate at an airport on a regular basis. FAA AC 150/5300-13A, Airport
Design, categorizes design standards that relate to airport infrastructure components based on a variety of
factors including the approach speed, wingspan and undercarriage dimensions of an aircraft. The following
describes the two coding systems identified in FAA AC 150/5300-13A, Airport Design, that are used in the
design and planning of airfield surfaces.
4.3.a Runway Design Code
The Runway Design Code (RDC) is a coding system that identifies the design standards of a runway as it
relates to the approach speed, wingspan and tail height of an aircraft as well as the approach visibility
minimums of a runway. The first component of the RDC, the Aircraft Approach Category (AAC), is depicted
by a letter and relates to the approach speed of an aircraft as categorized in Table 4-5. It should be noted
that aircraft in approach categories A and B typically include small single- and twin-engine piston aircraft,
commuter turboprop aircraft, and small business jet aircraft. Category C is typically comprised of business
jets, regional jets, and narrow-bodied commercial aircraft while categories D and E are comprised of large
wide-bodied aircraft, high performance military aircraft, and small business jet aircraft with high approach
speeds.

Chapter 4 – Facility Requirements
Page 4-6 July 2016
Table 4-5: Aircraft Approach Categories
Category Approach Speed
Category A Less than 91 knots
Category B 91 knots or more, but less than 121 knots
Category C 121 knots or more, but less than 141 knots
Category D 141 knots or more, but less than 166 knots
Category E 166 knots or more
Source: FAA Advisory Circular 150/5300-13A, Airport Design
The second component of the RDC, the Airplane Design Group (ADG), is depicted by a Roman numeral
and categorizes aircraft by wingspan and tail height as illustrated in Table 4-6. It should be noted that ADG
I and II aircraft typically include small single- and twin-engine piston aircraft, turboprop aircraft, and most
business jets. Large business jets, regional jets, and narrow-bodied commercial aircraft typically comprise
ADG III, while large jets used for commercial and military uses typically comprise ADG IV, V, and VI.
Table 4-6: Airplane Design Groups
Group Tail Height Wingspan
I Less than 20 feet Less than 49 feet
II From 20 feet to less than 30 feet From 49 feet to less than 79 feet
III From 30 feet to less than 45 feet From 79 feet to less than 118 feet
IV From 45 feet to less than 60 feet From 118 feet to less than 171 feet
V From 60 feet to less than 66 feet From 171 feet to less than 214 feet
VI From 66 feet to less than 80 feet From 214 feet to less than 262 feet
Source: FAA Advisory Circular 150/5300-13A, Airport Design
The third and final component of the RDC relates to the visibility minimums of an approach to a runway,
which is often a factor that helps determine the width of the pavement and the dimensions of protection
surfaces. The following categorization of visibility minimum as defined by FAA AC 150/5300-13A, Airport
Design, are used in conjunction with the AAC and ADG to determine the dimensions of runway design
surfaces:
• Visual (runways with only visual approaches)
• Not lower than one mile (runways with instrument approaches)
• Not lower than ¾ mile (runways with instrument approaches)
• Lower than ¾ mile (runways with instrument approaches)
The 2006 update of the ALP identified that the design standards for the airfield were based upon RDC
category C-III aircraft, which were the most demanding type of aircraft operating at the Airport at that time,
and a visibility minimum of lower than ¾ mile, based upon the ½ mile visibility minimum associated with the
instrument approach to Runway 24. It should be noted that the RDC determination can be based upon a

Chapter 4 – Facility Requirements
July 2016 Page 4-7
single aircraft type or a combination of the wingspan and approach speed of two separate aircraft types.
Since the Airport received operations from both commercial turboprop and regional jet aircraft, with each
having unique physical and operating characteristics, the RDC determination was based upon the larger
wingspan of the De Havilland Dash-8 turboprop and the higher approach speed of the -200 model of the
Canadair Regional Jet (CRJ-200).
While it is projected that commercial airlines will retire and/or reduce use of regional turboprop aircraft, such
as the Dash-8, and 50-seat regional jets, such as the CRJ-200, during the 20-year planning period, an
increase is projected in the number of operations by larger 70- to 90-seat regional jet aircraft. As illustrated
in Table 4-7, all of the 70- to 90- seat regional aircraft that could potentially replace the existing 50-seat
regional jets that serve the Airport are also classified as RDC category C-III; as such, it is recommended
that the existing RDC remain at category C-III.
Table 4-7: Runway Design Codes of Anticipated C-III Critical Aircraft Types
Aircraft Type Maximum Seating Capacity Runway Design Code
CRJ-700 70 C-III
ERJ-170 78 C-III
CRJ-900 86 C-III
ERJ-175 86 C-III
CRJ-1000 104 C-III
ERJ-190 106 C-III
ERJ-195 118 C-III
Source: Mead & Hunt, Inc. (2013)
While it is recommended the existing RDC remain at category C-III, it is important to note that the Airport
receives a number of operations each year by larger category C-III and D-IV aircraft. These aircraft are
commonly utilized by The Pennsylvania State University (Penn State) to transport its athletic teams to away
games, other collegiate institutions to transport other athletic teams to State College for Penn State home
games, and private charters. In addition, the Airport has the potential to attract weekly service by low cost
carriers (LCCs), which often operate large narrow-body aircraft such as the Boeing 737, Airbus A320, and
McDonnell Douglas MD-80. Since these aircraft have larger physical characteristics than the 70- to 90-
seat regional jets that are projected to increase in operations, it is important that the Airport initiate facility
planning to accommodate these types of aircraft.
It should also be noted that Penn State has inquired in the past about using RDC category D-IV Boeing
757 aircraft to transport its football team to away games since the aircraft has increased capacity for
passengers, equipment, and luggage. Though this aircraft type is not currently used to transport the football
team, planning should be initiated to accommodate its operation should it be required by Penn State to
transport its football team. Further analysis of the capability of existing Airport infrastructure to
accommodate both the operational needs of RDC category C-III aircraft and larger category D-IV aircraft
are discussed in the following sections.

Chapter 4 – Facility Requirements
Page 4-8 July 2016
4.3.b Taxiway Design Group
The Taxiway Design Group (TDG) is a classification of aircraft used for taxiway design standards based on
the width of an aircraft’s main landing gear and the distance between the main landing gear and the cockpit.
The width of taxiways and taxilanes, as well as fillet design standards and separation requirements for
runways/taxiways and taxiways/taxilanes, are determined by the TDG of the critical design aircraft intended
to use the surface. It is important to note that the TDG for a series of taxiways at an airport will often vary
by surface based on the purpose of the taxiway. Taxiways parallel to a runway will often be designed to
the TDG of the largest type of aircraft anticipated to regularly operate at an airport while taxiways and
taxilanes leading to hangar or apron areas will be designed for specific TDG aircraft types using the facilities
in that area. Figure 4-1 illustrates how the seven TDG classifications are categorized by FAA AC 150/5300-
13A, Airport Design.
Figure 4-1: Taxiway Design Group Classifications
Source: FAA Advisory Circular 150/5300-13A, Airport Design (2014)
Most of the taxiways at the Airport are at least 50 feet in width and are designed to accommodate TDG-3
aircraft. (Note: Taxiway H, connecting the T-style hangar area with Taxiway A, is 37 feet in width and
designed for TDG-2 aircraft.) While it is projected that the Airport will continue to receive operations by
TDG-1, -2, and -3 aircraft throughout the planning period, operations by TDG-4 aircraft are anticipated to
increase. Though it is recommended that the Airport continue to maintain its taxiway system to meet TDG-
3 design standards, planning should be initiated to improve the taxiway system to accommodate TDG-4
aircraft. Further discussion of the improvements that would be needed to the taxiway system to
accommodate TDG-4 aircraft are presented in Section 4.5.

Chapter 4 – Facility Requirements
July 2016 Page 4-9
4.4 Runway 6/24
A comprehensive analysis was conducted as a part of this sustainable master plan to evaluate how Runway
6/24 is able to accommodate projected future demand; this review included its length, width, grade, and the
pavement strength and condition. In addition, design surfaces of Runway 6/24, such as its safety area and
object free area, as well as airspace protection surfaces, were also evaluated to determine if improvements
may be needed to meet future demand. This section reviews each component of Runway 6/24 that was
evaluated as a part of this analysis and recommends improvements that may be needed for the runway to
accommodate future anticipated demand.
4.4.a Runway Length
The length of a runway should be capable of accommodating the landing and takeoff distance requirements
of the most demanding types of aircraft (existing or projected) intended to regularly conduct operations on
the surface. FAA AC 150/5325-4B, Runway Length Requirements for Airport Design, provides guidelines
to determine the recommended length of a runway based on a critical design aircraft that is anticipated to
operate on the surface over a period of several years. As such, it is important to first identify the runway
length requirements of aircraft that are anticipated to conduct regular operations on Runway 6/24 during
the planning period.
Table 4-8 presents the required runway lengths for regional jet aircraft types that currently or have the
potential to conduct regular commercial airline operations at the Airport during the 20-year planning period.
Each runway length presented in the table is based upon the maximum requirements for each aircraft at
their maximum gross takeoff weight (MTOW) on an 85-degree Fahrenheit day (mean high temperature for
July) and adjusted for the elevation of the airfield (1,231 feet above mean sea level). It should be noted
that aircraft manufacture planning manuals were also referenced, where available, to determine the
maximum runway length for each aircraft type.

Chapter 4 – Facility Requirements
Page 4-10 July 2016
Table 4-8: Maximum Runway Lengths for Current and Potential Commercial Aircraft
Aircraft Maximum Takeoff Weight MTOW Runway Length
Current Scheduled Carrier Equipment Types
Dash 8-100 34,500 pounds 4,406 feet1
Q-200 36,300 pounds 4,443 feet1
CRJ-200 53,000 pounds 8,333 feet2
Potential Scheduled Carrier Equipment Types
ERJ-135 44,092 pounds 7,125 feet2
ERJ-145 53,131 pounds 7,450 feet2
CRJ-700 75,000 pounds 7,258 feet2
ERJ-170 82,012 pounds 6,402 feet1
CRJ-900 84,500 pounds 7,982 feet2
ERJ-175 85,517 pounds 6,926 feet1
CRJ-1000 91,800 pounds 8,483 feet1
ERJ-190 114,199 pounds 6,869 feet1
ERJ-195 115,280 pounds 7,452 feet1
Notes:
1 – Estimated for 85° Fahrenheit day, field elevation 1,231 feet mean sea level, maximum takeoff weight
2 – Calculated using manufacturer’s hot day chart at field elevation 1,231 feet mean sea level, maximum takeoff weight
Source: Mead & Hunt, Inc. (2013)
Based on the information presented in the preceding table, it appears the existing 6,701-foot length of
Runway 6/24 is not capable of meeting the runway length needs of a number of existing and anticipated
commercial aircraft types operating at MTOW on a warm July day. As such, it is recommended that the
Airport initiate planning to extend Runway 6/24. A number of existing and potential commercial aircraft
types require not more than 7,500 feet of runway to take off from the Airport on a warm day at MTOW; as
such, it is recommended Runway 6/24 be extended 800 feet to provide 7,500 feet of takeoff distance.
It should be noted that the MTOW runway lengths would primarily apply if aircraft were to fly long-haul
routes from the Airport. Understanding that all of the commercial aircraft types listed in the table can operate
on Runway 6/24 at full passenger loads, but with concessions to fuel and/or cargo payloads, an additional
evaluation was conducted to determine the maximum range of each aircraft type considering fuel
concessions to operate from a 6,701-foot runway. Table 4-9 illustrates the maximum range of each existing
and potential aircraft types from State College if cargo payload and/or fuel concessions are made to the
takeoff weight of each aircraft type.

Chapter 4 – Facility Requirements
July 2016 Page 4-11
Table 4-9: Ranges of Existing and Potential Commercial Aircraft from State College
Aircraft Maximum Range From State College
Current Scheduled Carrier Equipment Types
Dash 8-100 820 nautical miles1
Q-200 1,125 nautical miles1
CRJ-200 1,166 nautical miles2
Potential Scheduled Carrier Equipment Types
ERJ-135 1,300 nautical miles3
ERJ-145 1,500 nautical miles2
CRJ-700 1,710 nautical miles2
ERJ-170 1,800 nautical miles4
ERJ-900 1,044 nautical miles2
ERJ-175 1,300 nautical miles4
CRJ-1000 1,000 nautical miles4
ERJ-190 1,400 nautical miles4
ERJ-195 1,000 nautical miles4
Notes:
1 – Maximum range of aircraft
2 – Calculated using manufacturer’s hot day chart at field elevation (1,231 ft. MSL) with full passenger load at 6,701 ft. takeoff length
3 – Estimate based on manufacture payload/range chart at maximum passenger payload (assumed 225 lbs. per passenger and bags)
4 – Estimate based on maximum range of aircraft at MTOW, assuming field elevation 1,231 ft. MSL on 82°F day
Source: Mead & Hunt, Inc. (2013)
As illustrated in the table, most existing and potential commercial airline service aircraft types are capable
of achieving a range of approximately 1,000 miles given fuel concessions in order to take off with a full
passenger load on the existing length of Runway 6/24. Given that all commercial airlines currently operating
at the Airport are serving destinations in the Northeast and in the Great Lakes region, requiring a trip length
of less than 1,000 miles, the existing length of Runway 6/24 is sufficient to meet the runway length needs
of existing and potential commercial airline aircraft types if airlines continue to serve these markets. If non-
stop service is desired to destinations west of the Mississippi River or in the Southeast, then additional
runway length is necessary. It is recommended that the Airport initiate planning to extend Runway 6/24 to
7,500 feet for when non-stop service to these destinations is desired.
As noted, there is the potential for the Airport to attract weekly service by an LCC. It is anticipated that if
an LCC entered the State College market, it would most likely operate a narrow-body aircraft such as the
Boeing 737, Airbus A320, or McDonnell Douglas MD-80 to provide service at the Airport. In evaluating the
adequacy of the existing 6,701 foot length of Runway 6/24 to meet the needs of future users, it is also
important to review the runway length requirements for these types of aircraft. As illustrated in Table 4-10,
the maximum length of runway needed for potential narrow-body aircraft types to operate from the Airport
with full passenger, payload, and fuel loads on a day with a warm temperature exceeds the existing length
of Runway 6/24.

Chapter 4 – Facility Requirements
Page 4-12 July 2016
Table 4-10: Maximum Runway Length Requirements for Potential Narrow-Body Aircraft
Aircraft Maximum Takeoff Weight MTOW Runway Length
717-200 121,000 pounds 6,142 feet
DC-9-50 122,200 pounds 10,266 feet
MD-88 149,500 pounds 8,600 feet
737-400 150,000 pounds 9,857 feet
737-700 154,500 pounds 6,923 feet
MD-90 156,000 pounds 7,944 feet
MD-83 160,000 pounds 9,206 feet
MD-87 160,000 pounds 8,628 feet
A319 166,448 pounds 7,857 feet
A320 171,960 pounds 8,142 feet
737-800 174,200 pounds 8,269 feet
737-900 174,200 pounds 8,740 feet
757-200 255,000 pounds 8,440 feet
757-300 273,000 pounds 7,857 feet
Notes:
MTOW runway lengths calculated using manufacture hot day chart assuming field elevation 1,231 ft. MSL, ISA conditions, MTOW
Source: Mead & Hunt, Inc. (2013)
It should be noted that the maximum amount of runway length needed for each narrow-body aircraft listed
in the table is based on each aircraft flying a long-haul route at maximum payload and fuel capacities.
Given that all of these narrow-body aircraft types can operate from the existing 6,701-foot length of Runway
6/24 if concessions are made to passenger/payload/fuel loads, it is also important to consider the maximum
range of each aircraft from State College. Table 4-11 lists the maximum range available for potential
narrow-body aircraft types if concessions were made to operate at the Airport on a warm day from the
existing 6,701-foot length of Runway 6/24. As illustrated in the table, the maximum range from State
College varies by aircraft type; Boeing 757-200s, Boeing 737-400s, Boeing 737-700s, Airbus A319s, and
Airbus A320 appear capable of conducting non-stop flights to destinations as far as the West Coast. Other
aircraft, such as the Boeing 757-300, Boeing 737-800, and Boeing 717-200, are capable to serving non-
stop destinations east of the Rocky Mountains while the McDonnell Douglas MD-80 series is capable of
serving non-stop destinations in the Northeast, Great Lakes, and Mid-Atlantic regions.

Chapter 4 – Facility Requirements
July 2016 Page 4-13
Table 4-11: Ranges of Potential Narrow-Body Aircraft from State College
Aircraft Maximum Range From State College
717-200 2,060 nautical miles
DC-9-50 471 nautical miles
MD-88 655 nautical miles
737-400 2,306 nautical miles
737-700 2,600 nautical miles
MD-90 979 nautical miles
MD-83 944 nautical miles
MD-87 2,048 nautical miles
A319 2,865 nautical miles
A320 2,616 nautical miles
737-800 1,633 nautical miles
737-900 838 nautical miles
757-200 3,083 nautical miles
757-300 1,551 nautical miles
Notes:
Maximum range calculated using manufacture hot day chart assuming field elevation 1,231 ft. MSL, ISA conditions, and maximum
load for 6,701 ft. takeoff length
Source: Mead & Hunt, Inc. (2013)
It is important to note the range limitation of the McDonnell Douglas MD-80 series of aircraft from State
College since this is a popular type that is frequently used by some LCC and other charter operators.
Typically, LCC and charter operators are successful in their business models by providing non-stop service
from communities with non-hub airports to leisure destinations in Florida and along the West Coast. Should
an LCC or charter operator desire to initiate service at State College with an MD-80, it may not be capable
of providing non-stop service to leisure destinations in Florida, such as Orlando, Tampa/St. Petersburg,
and Ft. Lauderdale due to limited range of the aircraft if operating from a 6,701-foot runway. As such,
additional runway length should be considered if an operator desires to offer non-stop service from State
College with an MD-80 aircraft to destinations west of the Mississippi River and on the Florida peninsula.
Increasing the length of Runway 6/24 an additional 1,600 feet would better accommodate the takeoff
distance requirements of the MD-80 series of aircraft; therefore, it is recommended that the Airport
ultimately plan to extend Runway 6/24 to 8,301 feet should an LCC decide to provide non-stop service to
these markets from the Airport.
In addition to evaluating the runway length requirements of commercial service aircraft, a review was also
conducted of the adequacy of Runway 6/24 to meet the takeoff distance requirements of general aviation
(GA) aircraft. Based aircraft information obtained from the Airport as well as operational counts obtained
from the FAA’s Traffic Flow Management System Counts (TFMSC) database were used to determine the
types of GA aircraft that most frequently conduct operations at the Airport. The based and itinerant GA
aircraft with the most demanding runway length needs were then identified to evaluate the adequacy of
Runway 6/24 in meeting these needs.

Chapter 4 – Facility Requirements
Page 4-14 July 2016
Table 4-12 presents the runway length requirements of based and itinerant GA aircraft that most frequently
conduct operations at the Airport. It should be noted that airport planning manuals and manufacture runway
length requirement charts were not readily available for these aircraft types to calculate the maximum
takeoff distance required for a departure from the Airport on a warm day at MTOW. Instead, sea level
takeoff distance requirements for each aircraft at MTOW in International Standard Atmosphere (ISA)
conditions were obtained through data sheets provided by each aircraft manufacturer. Using an FAA
runway length planning spreadsheet that calculates the takeoff distance of an aircraft by mathematically
adjusting its sea level takeoff distance requirement given the elevation of an airfield, the temperature, and
the gradient adjustment of the runway, takeoff distance requirements were calculated for each aircraft type
operating at MTOW on an 85-degree Fahrenheit day.
Table 4-12: Runway Takeoff Distance Requirements of General Aviation Aircraft
Aircraft Type MTOW MTOW Takeoff Distance
(Sea Level) 1
MTOW Takeoff Distance
@ UNV elev., 85° F 2
Based Aircraft
Hawker 125-700A 25,500 lbs. 5,800 ft. 7,652 ft.
Citation 550 13,300 lbs. 3,450 ft. 4,709 ft.
Citation V 15,900 lbs. 3,160 ft. 4,346 ft.
King Air F90 10,950 lbs. 2,775 ft. 3,864 ft.
King Air 200 12,500 lbs. 2,579 ft. 3,619 ft.
Eclipse 500 5,995 lbs. 2,342 ft. 3,322 ft.
Adam A500 7,000 lbs. 2,150 ft. 3,082 ft.
Cessna 208 8,000 lbs. 2,055 ft. 2,963 ft.
Common Itinerant GA Aircraft
Gulfstream IV 73,200 lbs. 5,280 ft. 7,001 ft.
Citation X 36,100 lbs. 5,140 ft. 6,825 ft.
Embraer 120 24,433 lbs. 5,118 ft. 6,798 ft.
Challenger 300 38,850 lbs. 4,810 ft. 6,412 ft.
Falcon 50 38,800 lbs. 4,700 ft. 6,274 ft.
Dornier 328 Jet 34,524 lbs. 4,485 ft. 6,005 ft.
Learjet 45 20,500 lbs. 4,350 ft. 5,836 ft.
Beechjet 400 15,780 lbs. 3,950 ft. 5,335 ft.
Citation Excel XLS 20,200 lbs. 3,560 ft. 4,847 ft.
Citation CJ1 10,600 lbs. 3,280 ft. 4,497 ft.
Notes:
1 – Sea level MTOW takeoff distances obtained from aircraft manufacture data sheets for ISA temperature conditions
2 – Takeoff distances at Airport elevation (1,231 feet) on 85° F day estimated from FAA runway calculation planning worksheet
Sources: Aircraft manufacture data sheets, FAA runway length calculation planning spreadsheet
Mead & Hunt, Inc. (2013)
As illustrated in the table, the 6,701-foot length of Runway 6/24 is adequate to meet the runway length
needs of most GA aircraft types departing from the Airport at MTOW on an 85-degree Fahrenheit day. It is
important to note, however, that one of the aircraft requiring more than 6,701 feet of runway, the Hawker
125-700A, is a type that is based at the Airport; therefore, consideration should be given to extend the

Chapter 4 – Facility Requirements
July 2016 Page 4-15
length of Runway 6/24 to accommodate the takeoff needs of this aircraft type. The 7,652 feet of takeoff
distance required for the Hawker 125-700A to depart from the Airport at MTOW on an 85-degree Fahrenheit
day also supports the recommendation for a 7,500-foot runway. Extending Runway 6/24 an additional 800
feet will also help support the takeoff distance requirements of itinerant GA aircraft that frequently operate
at the Airport, such as the Gulfstream IV and Citation X. It is noted that if a decision is made to pursue a
runway extension, a justification process will be needed to document that at least 500 annual operations
are conducted by aircraft types in need of the additional runway length should pursuit of federal funding be
desired for the project. The recommendation to plan for a runway extension is rather intended to preserve
space for such a project when planning for other future infrastructure development is taken into
consideration.
In conclusion, the existing runway length of 6,701 feet is generally adequate to accommodate current
demands. In the future, to meet the runway takeoff distance requirements of both commercial airline and
GA aircraft, it is anticipated that Runway 6/24 will need to be extended 800 feet to a length of 7,501 feet.
In addition, it is also recommended that the Airport plan for and protect the ability to extend Runway 6/24
an additional 800 feet to an ultimate length of 8,301 feet should an LCC or charter operator provide service
to destinations west of the Mississippi River or on the Florida peninsula with some aircraft types.
4.4.b Runway Width
The width of a runway is determined based on a combination of the RDC of the critical aircraft intended to
operate on the surface and the runway’s approach visibility minimums. The required width of a runway for
RDC category C-III aircraft at an approach visibility minimum lower than ¾ mile as designated by FAA AC
150/5300-13A, Airport Design, is 150 feet. Since the RDC of Runway 6/24 is C-III, and the current approach
visibility minimum is ½ mile, the existing 150-foot width of the runway meets current FAA design standards.
It is also important to note that the 150-foot width of Runway 6/24 also meets RDC category D-IV standards
as identified in the FAA AC. As such, it is not anticipated that improvements will be needed to the width of
Runway 6/24 to accommodate demand throughout the planning period.
Runways are often grooved to improve skid-resistance and prevent hydroplaning during conditions in which
the pavement is contaminated with water. Grooves are applied to the entire width of a runway to assist in
the drainage of water provided by the transverse slope of the pavement surface. It should be noted that
the width of the runway is grooved 40 feet either side of the centerline for a total width of 80 feet. The 80-
foot width of the grooves once met FAA standards when Runway 6/24 was 100 feet in width; when the
runway width was expanded to 150 feet, a modification to standards was issued in 2000 to address this
non-conforming situation. It is recommended that at the time of the next major runway pavement
rehabilitation project the width of the grooves be extended to meet design standards.
In addition, as a part of evaluating the width of a runway, it is also important to consider the need for paved
shoulders, which are beneficial to reduce the potential of foreign object debris (FOD) from the jet blast of
larger aircraft and help support the passage of maintenance and emergency vehicles. FAA AC 150/5300-
13A, Airport Design states that paved shoulders are required for runways accommodating ADG IV and
higher aircraft and are recommended for runways accommodating ADG-III aircraft. Currently, Runway 6/24
does not have paved shoulders. While it is not a requirement for RDC category C-III runways, it is a

Chapter 4 – Facility Requirements
Page 4-16 July 2016
recommendation; therefore, the inclusion of paved shoulders is recommended during the next major runway
rehabilitation project. Paved shoulders of 25 feet in width would be necessary to meet design standards
identified in FAA AC 150/5300-13A, Airport Design, for both RDC category C-III and D-IV aircraft.
4.4.c Runway Grade
Runway gradient design standards are outlined in FAA AC 150/5300-13A, Airport Design, so that pilots and
air traffic controllers are able to view that any one point on a runway is clear of aircraft, vehicles, wildlife,
and other objects. Design standards for longitudinal and transverse runway grades are based on the AAC
of the critical design aircraft. Gradient standards are the same for AAC category C, D, and E aircraft with
the maximum allowable longitudinal grade change between runway ends being ±1.50 percent; it should be
noted that the longitudinal grade may not exceed ±0.80 percent in the first and last quarter of a runway.
As illustrated in Figure 4-2, the overall longitudinal grade of Runway 6/24 between runway ends is 0.58
percent and meets current FAA design standards; likewise, the longitudinal grade changes within the first
and last quarter of the runway are each less than 0.80 percent and also fall within allowable tolerances.
Figure 4-2: Runway 6/24 Longitudinal Grade
Source: Mead & Hunt, Inc. (2013)
It should be noted that while the overall longitudinal grade of the runway falls within allowable tolerances,
it does not meet line-of-sight requirements, or the ability of a departing or arriving aircraft to verify the
location and actions of other aircraft and vehicles on the ground that could create a conflict. FAA AC
150/5300-13A, Airport Design, states that runways with a full parallel taxiway should be designed so that
any point five feet above the runway centerline must be mutually visible with any other point five feet above
the runway centerline that is located at a distance less than one half the length of the runway. The line-of-
sight for Runway 6/24 is such that any point above the runway centerline can be viewed from any other
point above the runway centerline at a height of six feet. To address this non-standard condition, the FAA
1,192 ft. 1,200 ft.
1,220 ft.
1,228 ft.1,231 ft.
1,190
1,195
1,200
1,205
1,210
1,215
1,220
1,225
1,230
1,235
0 1,000 2,000 3,000 4,000 5,000 6,000 7,000
Ele
vati
on
ab
ov
e s
ea l
ev
el (i
n f
eet)
Distance from approach end Runway 24 (in feet)
Overall longitudinal grade - 0.58%
(6,701 ft.)
Longitudinal grade - 0.46%
(0-1,730 ft.)
Longitudinal grade - 1.22% (1,730-3,367 ft.)
Longitudinal grade - 0.53% (3,367-4,890 ft.)
Longitudinal grade - 0.17%
(4,890-6,701 ft.)

Chapter 4 – Facility Requirements
July 2016 Page 4-17
approved a modification of standards for this condition in 1995, which has been further mitigated to some
extend by the installation of the Airport Traffic Control Tower (ATCT) in 2011. However, it is important to
note that the ATCT is not open 24 hours a day, requiring pilots for certain periods of time to verify that the
runway is clear of other aircraft and vehicles without the assistance of air traffic controllers. It is
recommended that, during the design of the next major runway rehabilitation, the Airport evaluate the
economic feasibility of correcting the line-of-sight standard deficiency.
4.4.d Runway Pavement Strength & Condition
As a part of the sustainable master plan project, an airfield
pavement evaluation was conducted by Applied Pavement Technology, Inc. (APTech) to determine the
condition of airfield pavement surfaces and develop
recommendations for future rehabilitation and repair. To
conduct this evaluation, past pavement management
records were reviewed from the State of Pennsylvania
airport pavement management system, construction
history information, and traffic data. Visual pavement
condition inspections to determine the pavement condition
index (PCI) were also conducted as well as falling weight
deflectometer testing to determine the condition of subgrade and pavement layer properties.
The PCI is a rating system that gives a numerical value to the existing condition of pavement based on
distresses observed on the surface. The PCI scale ranges from a value of 0 for pavements in a completely
failed condition to a value of 100 for pavements with no distress. It is recommended that pavements be
maintained with a PCI value above 70; pavements with PCI values between 70 and 40 or less are more
likely to need a major rehabilitation, while pavements with PCI values less than 40 are in need of a
reconstruction.
The overall PCI value of airfield pavements at the Airport is 71; this compares to an overall airfield PCI of
84 that was determined in 2008. By type of pavement surfaces, the runways and taxiways are considered
to be in fair condition with PCI values of 66 and 68, respectively. Aprons are considered to be in better
condition with a PCI value of 78, which is largely attributed to the favorable condition of the commercial
airline terminal apron. Overall, approximately 80 percent of the pavement area has a PCI value between
60 and 70. Less than one percent of the pavement area has a PCI value below 60 while the rest of the
pavements have a PCI value above 70. A summary of the PCI values assigned to pavement surface
branches as calculated from the evaluation study, as well as a percentage calculation for pavement
distress, if any, is presented in Table 4-13.

Chapter 4 – Facility Requirements
Page 4-18 July 2016
Table 4-13: Airfield Pavement Surface Pavement Condition Index Values
Pavement Surface Branch PCI
Value
Percent of Distress
Climate/ Durability
Load Other
Runway 6/24 68 100% 0% 0%
Taxiway A 65 84% 16% 0%
Taxiway B 68 92% 0% 8%
Taxiway F 53 72% 28% 0%
Taxiway J 76 100% 0% 0%
Taxiway A Holding Apron – Approach End Runway 6 67 100% 0% 0%
Taxiway A Holding Apron – Approach End Runway 24 70 100% 0% 0%
East Half Commercial Airline Terminal Apron 90 46% 23% 31%
West Half Commercial Airline Terminal Apron 92 57% 0% 43%
General Aviation Apron 70 100% 0% 0%
Deicing Apron 78 100% 0% 0%
Notes:
1) Distress due to climate or durability includes those distresses attributed to either the aging of the pavement and the effects of the
environment or to a materials-related problem.
2) Distress due to load includes those distresses attributed to a structural deficiency in the pavement or mid-panel cracking.
Source: Applied Pavement Technology, Inc. (2014)
In summary, Runway 6/24 has an area-weighted PCI of 68 and last received a hot-mix asphalt overlay in
1999. Typical pavement distresses on the runway include raveling and longitudinal and transverse (L&T)
cracking. The PCIs of taxiways range from 53 on Taxiway F to 76 on Taxiway J. Raveling and L&T cracking
are also predominant distresses on taxiway surfaces. It should be noted that Taxiway A and Taxiway F
also have localized low-severity fatigue cracking. The deicing apron and GA apron have PCI values of 78
and 70, respectively. The GA apron has a rejuvenator that is wearing off with raveling occurring in localized
areas at high severity while other areas of the apron have been patched. The deicing apron has limited
raveling with a majority of the sealant used to seal pavement joints considered to be in good condition.
Finally, the commercial airline terminal apron has PCI values of 90 and 92 for the east and west halves of
the surface, respectively. Though the surface is considered to be in good condition, it does have a few
areas of cracking, patching, and joint/corner spalling.
The collection of pavement surface conditions was entered into a software program to predict future
performance and help determine when failure of the pavement can be anticipated. The software program
generated life cycle models based on mathematical equations considering the age of the pavement
surfaces and their PCI values. Performance characteristics such as pavement use (runway, taxiway, or
apron) and surface types were also factored into the life cycle calculations. A summary of the projected
PCI value for each pavement surface branch for the next five years as well as its anticipated functional
remaining life is presented in Table 4-14.

Chapter 4 – Facility Requirements
July 2016 Page 4-19
Table 4-14: Summary of Pavement Condition Index Projections and Functional Remaining Life
Branch Projected PCI by Year Functional
Remaining Life
2014 2015 2016 2017 2018
Runway 6/24 67 65 63 61 60 > 10 years
Taxiway A 63 58 54 49 45 6 years
Taxiway B 65 61 56 52 48 6 years
Taxiway F 51 46 42 37 33 3 years
Taxiway J 75 73 71 69 68 > 10 years
Twy A Holding Apron – Approach End Runway 6 66 65 63 62 61 > 10 years
Twy A Holding Apron – Approach End Runway 24 69 68 66 65 64 > 10 years
Commercial Airline Terminal Apron 91 90 89 89 88 > 10 years
General Aviation Apron 69 68 66 65 64 > 10 years
Deicing Apron 77 76 74 73 72 > 10 years
Key: = PCI value above critical value for section
= PCI value below critical value but greater than 40
= PCI value below 40
Source: Applied Pavement Technologies, Inc. (2014)
As indicated in the table, by 2018 the area-weighted PCI values of airside pavements are predicted to be
50 if no rehabilitation work is performed. Runway 6/24 is predicted to have a PCI of 60 by 2018 while
taxiways are predicted to have PCI values between 33 and 68 by 2018. Five pavement surface branches
are projected to be below the critical PCI value of 70 by 2015 with this increasing to seven by 2017. It
should be noted that by 2017, Taxiway F is anticipated to have a PCI value of below 40, which would create
an FOD and safety concern. Overall, a majority of the pavement surface branches have functional lives
greater than 10 years while Taxiway A, Taxiway B, and Taxiway F have functional remaining lives of less
than 10 years.
In addition, a strength analysis was conducted to determine the pavement classification number (PCN) for
each pavement surface to determine allowable load limits using methodology outlined in FAA AC 150/5335-
5B, Standardized Method of Reporting Airport Pavement Strength – PCN). The PCN is a numerical value
assigned to a pavement and expresses the relative load-carrying capacity of that pavement in terms of the
weight of an equivalent single-wheel load that it can support. PCN is determined based on the frequency
and weight of aircraft operations and existing pavement layer properties. Table 4-15 presents the PCN
value for each pavement surface at the Airport.

Chapter 4 – Facility Requirements
Page 4-20 July 2016
Table 4-15: Summary of Pavement Classification Numbers
Airfield Surface PCN Value
Runway 6/24 Greater than 70 Taxiway A 42.5 Taxiway B Greater than 70
Taxiway C (between GA Apron and Taxiway A) Greater than 70 Taxiway C (between Taxiway A and Runway 6/24) 42.9
Taxiway D Greater than 70 Taxiway E Greater than 70 Taxiway F n/a* Taxiway G 37.9 Taxiway J n/a*
General Aviation Apron Greater than 70 Commercial Terminal Apron (East Half) 44.3 Commercial Terminal Apron (West Half) 44.0
Deicing Apron Greater than 70 Taxiway A Hold Apron (Approach End Runway 6) Greater than 70 Taxiway A Hold Apron (Approach End Runway 24) Greater than 70
Note: n/a = PCN value not calculated for surface
Source: Applied Pavement Technology, Inc. (2014)
The PCN values for the airfield pavement surfaces presented in the table range from 37.9 to over 70.
Reported PCN values were limited to 70 because values greater than 70 are not entirely realistic given
airfield pavement cross sections, the layout of the Airport, and runway length. Taxiway A and Taxiway C
between Runway 6/24 and Taxiway A have PCN values of 42.6 and 42.9, respectively, which is
approximately the currently published PCN of the Airport. This is important to note since all aircraft are
required to operate on Taxiway A.
In summary, it appears the strength of the pavement surfaces at the Airport is sufficient to meet existing
and anticipated operational demands throughout the planning period; however, it is recommended that the
GA apron, Taxiway A, and Taxiway F be considered for rehabilitation in the near future. It is anticipated
that the area-weighed PCI of the Airport will decrease from a value of 71 in 2013 to a value of 60 in 2018 if
no pavement rehabilitation work was completed. Preventative maintenance and rehabilitation of the most
critical surfaces as previously noted are anticipated to increase the area-weighted PCI value of the Airport
to 94 by 2018.
4.4.e Runway Design Surfaces
In addition to the length, width, and strength of the pavement surface, there are also a number of other
design components associated with runways that protect aircraft from obstructions and provide a margin of
safety in the event of an unintentional deviation from the runway. As illustrated in Figure 4-3, these surfaces
include safety areas, object free areas, and protection zones. This section reviews each of these design
surfaces as they are associated with Runway 6/24 and evaluates if dimensional changes will be needed to
accommodate aircraft that are projected to operate at the Airport during the planning period.

Chapter 4 – Facility Requirements
July 2016 Page 4-21
Figure 4-3: Runway Design Surfaces
Source: Mead & Hunt, Inc. (2013)
RSA – The RSA is a two-dimensional surface at the elevation of the runway that is centered on the extended
centerline, which provides an area to support an aircraft in the event of an unintended excursion from the
runway surface. According to FAA AC 150/5300-13A, Airport Design, RSAs must be:
• Cleared, graded, free of hazardous surface variations, and properly drained.
• Capable of supporting an aircraft without causing structural damage, as well as airfield
maintenance and emergency response vehicles.
• Free of objects except those that are necessary, such as navigational signs and lighting, which
must be mounted on low-impact resistant supports.
The RSA for Runway 6/24 is 500 feet in width and extends 1,000 feet beyond each end of the runway,
meeting design standards for RDC category C-III aircraft. As such, dimensional changes to the width and
length of the safety area will not be needed to accommodate the larger 70- and 90- seat regional jet aircraft
that are anticipated to increase in operation throughout the planning period. The existing dimensions of the
RSA also meet design standards for RDC category D-IV aircraft that are also projected to increase in
operation at the Airport over the next 20 years.

Chapter 4 – Facility Requirements
Page 4-22 July 2016
As noted, the RSA must be kept free of objects except those necessary by function. Given that the RSA
extends 1,000 feet beyond the approach end of the runway, it is important to note that the localizer antenna
for Runway 24 is located 346 feet from the approach end of Runway 6 within the RSA. In 2000, the FAA
issued a Runway Safety Area Determination for the Airport that stated the RSA for Runway 6/24 meets
standards, understanding that placement of the localizer was necessary for its correct operation. It should
be noted that the FAA has recently placed an emphasis on maintaining safety areas that meet design
standards and are free of all objects, except those necessary by function that must be mounted on low-
impact resistant supports. Though the localizer is the responsibility of the Technical Operations Services
unit within the Air Traffic Organization office of the FAA, it is important to note that relocation of the localizer
may be necessary when evaluating future infrastructure improvement projects at the Airport.
Runway Object Free Area (ROFA) – The ROFA is also a two-dimensional ground area at the elevation of
the runway and centered on its extended centerline; however, the function of the ROFA varies from the
RSA in that it is intended to protect aircraft operating on the runway and within the RSA from colliding with
objects. It should be noted that the FAA prohibits aircraft from parking within the OFA, except for ground
maneuvering purposes, and all above-ground objects protruding from the edge of the RSA elevation, except
those fixed by function for navigational purposes. Dimensions of an ROFA are based on the critical design
aircraft intended to use a runway and its approach visibility minimums. The ROFA for Runway 6/24 is 800
feet wide and extends 1,000 feet beyond each runway end, meeting design standards for both RDC
category C-III and D-IV aircraft; as such, improvements to the ROFA are not anticipated.
It is important to note that the glide slope antenna for Runway 24 and the Airport’s weather reporting
equipment, each used for navigational purposes, are located approximately 250 feet from the centerline of
Runway 6/24 outside the boundary of the RSA but within the ROFA. While above-ground objects that are
fixed by function for navigational purposes are allowed to protrude from the edge of the RSA elevation
within the ROFA, the FAA recommends that glide slope antennas be located a minimum of 400 feet from
the centerline of a runway. Though the glide slope antenna is the responsibility of the Technical Operations
Services unit within the Air Traffic Organization of the FAA, it is important to note that its relocation, as well
as the relocation of the weather reporting equipment maintained by the Airport, may be necessary when
evaluating future airfield infrastructure improvement projects at the Airport.
Obstacle Free Zone (OFZ) – The OFZ is a three-dimensional volume of airspace located along the runway
and beyond its end. Clearing standards prohibit taxiing aircraft, parked aircraft, vehicles, and other objects,
except those fixed by function, from being located within the OFZ when aircraft are departing from or arriving
to a runway surface. The OFZ is actually comprised of three design elements, each of which are described
in the following summaries:
• Runway Obstacle Free Zone (ROFZ) – The ROFZ extends 200 feet beyond the end of a runway
at a width determined by the type of aircraft conducting operations on the runway surface. Since
the Airport receives operations by aircraft with a maximum certificated takeoff weight of more than
12,500 pounds, the width of the ROFZ at either end of Runway 6/24 is 400 feet, which meets FAA
design standards. Likewise, improvements are not anticipated to be needed to the ROFZs
associated with Runway 6/24.

Chapter 4 – Facility Requirements
July 2016 Page 4-23
• Inner-approach OFZ – The inner-approach OFZ is a volume of airspace centered on the runway
centerline and only applies to runways with an approach lighting system (ALS). The inner approach
OFZ begins 200 feet beyond the runway threshold and extends 200 feet beyond the last light unit
in the ALS. The width is the same as the ROFZ and rises at a slope of 50:1 outward and upward
from the beginning of the surface located 200 feet beyond the end of the runway. Since only
Runway 24 is equipped with an ALS, an inner approach OFZ is located 200 feet beyond the end of
the runway at a width of 400 feet and extends outward and upward at a slope of 50:1 to a horizontal
distance of 2,354 feet, which extends 200 feet beyond the last light unit of the ALS. The inner-
approach OFZ at the approach end of Runway 24 meets FAA design standards; as such,
improvements are not anticipated during the planning period.
• Inner-transitional OFZ – The inner-transitional OFZ is also a defined volume of airspace located
along the sides of the ROFZ and inner-approach OFZ and only applies to runways with lower than
¾ mile approach visibility minimums. The dimensions of the inner-transitional OFZ are based on
the type of aircraft intended to use a runway and the category of its instrument approach. For
runways with Category I instrument approaches, the inner-transitional OFZ begins at the edges of
the ROFZ and inner-approach OFZ and rises vertically to height determined by the following
equation:
Hfeet = 61-0.094(Sfeet) – 0.003(Efeet)
It should be noted that in the equation above, “Sfeet” is equal to the wingspan of the most demanding
RDC to operate on the runway and “Efeet” is equal to the runway threshold above sea level. Since
the visibility minimum for Runway 24 is less than ¾ mile, and it is equipped with a Category I
instrument approach, an inner-transitional OFZ is found at the approach end of the runway. The
height of the inner-transitional surface at the approach end of Runway 24, based upon the
wingspan of the Dash 8-100, which is the existing critical design aircraft, is:
61-0.094(85.92 feet) – 0.003(1,192 feet mean sea level) = 49.35 feet
At a height of 49.35 feet, the inner-transitional OFZ then extends outward and upward at a slope of
6:1 to a height of 150 feet above the Airport. Given that operations are anticipated throughout the
planning period by larger RDC category C-III aircraft ranging up to the Boeing 737-900, it is
recommended the dimensions of the surface be adjusted to accommodate larger wingspans. Since
the Boeing 737-900 (with winglets) has a wingspan of 117.42 feet, the inner-transitional OFZ should
be adjusted to rise to a height of 46.39 feet before extending outward and upward at a 6:1 slope to
a height of 150 feet above the Airport. Likewise, the height of this surface from ROFZ and inner-
approach OFZ would change to 45.69 feet if the RDC category D-IV Boeing 757-300 aircraft
became the critical aircraft type operating on Runway 6/24.
• Precision OFZ (POFZ) – The POFZ is defined as a volume of airspace above an area beginning
at the threshold elevation and centered on the extended runway centerline. The POFZ is 800 feet
in width centered on the extended runway centerline and extends 200 feet beyond the runway

Chapter 4 – Facility Requirements
Page 4-24 July 2016
threshold. The POFZ is in effect at all runway thresholds when all of the following operational
conditions are met:
o The approach includes vertical guidance
o The reported ceiling is below 250 feet, visibility is less than 3/4 statue mile, or the
Runway Visual Range (RVR) is below 4,000 feet
o An aircraft is on final approach within 2 miles of the runway threshold
When the POFZ is in effect, a wing of an aircraft holding on a taxiway waiting to depart may
penetrate the POFZ; however, neither the fuselage nor tail may penetrate the POFZ. Vehicles up
to 10 feet in height necessary for maintenance are also permitted in the POFZ.
It should be noted that a POFZ is located at the approach end of Runway 24 and is only in effect
when an aircraft is on approach to land and all of the previously described operational conditions
are present. While currently no airfield pavement surfaces are located within the POFZ at the
approach end of Runway 24, it is important to note this design surface should any future runway,
taxiway, or apron improvement projects be considered.
Runway Protection Zone (RPZ) – The RPZ is designed to enhance the protection of people and property
on the ground. RPZs are to be controlled by an airport and be clear of any incompatible land uses such as
occupied buildings, concentrations of people, wildlife attractants, and objects of height. The RPZ is
trapezoidal in shape and centered on the extended centerline of the runway located 200 feet beyond the
end of a paved runway surface with an inner and outer width that is based on the AAC of the critical design
aircraft and type of approach to the runway. Table 4-16 presents the dimensions of the RPZ located at
either end of Runway 6/24.
Table 4-16: Runway Protection Zone Dimensions
Dimensions Runway 6 Runway 24
Length 1,700 feet 2,500 feet
Inner Width 1,000 feet 1,000 feet
Outer Width 1,510 feet 1,750 feet
Area 48.978 acres 78.914
Source: FAA Advisory Circular 150/5300-12A, Airport Design
It should be noted that the dimensions of the RPZs found at each end of Runway 6/24 meet FAA design
standards as identified in FAA AC 150/5300-13A, Airport Design, for RDC category C-III and D-IV aircraft
if the approach visibility minimums to either end of the runway remain unchanged. Changes to the
dimensions and/or locations to the RPZs are only anticipated if Runway 6/24 is extended and/or an
instrument approach with lower than ¾ mile is developed for Runway 6. This is important to note since the
FAA recommends that land within an RPZ be controlled by an airport to prevent and eliminate incompatible
objects and activities for the protection of people and property on the ground. Should Runway 6/24 be
extended, or an approach with increased visibility minimums be developed for Runway 6, the acquisition of
Chapter 4 – Facility Requirements
July 2016 Page 4-25
land or an easement may be needed if any portion of a relocated or increased RPZ should fall outside
existing Airport property to control incompatible land uses.
It should be noted that there are some public roadways within the RPZs, such as Rock Road near the
approach end of Runway 24 and Minute Man Lane near the approach end of Runway 6. These roads are
below the runway elevation and do not have an adverse effect on the Airport, nor do the RPZs include any
land uses that are residential or places of assembly. Therefore, the RPZs are compliant with FAA design
standards.
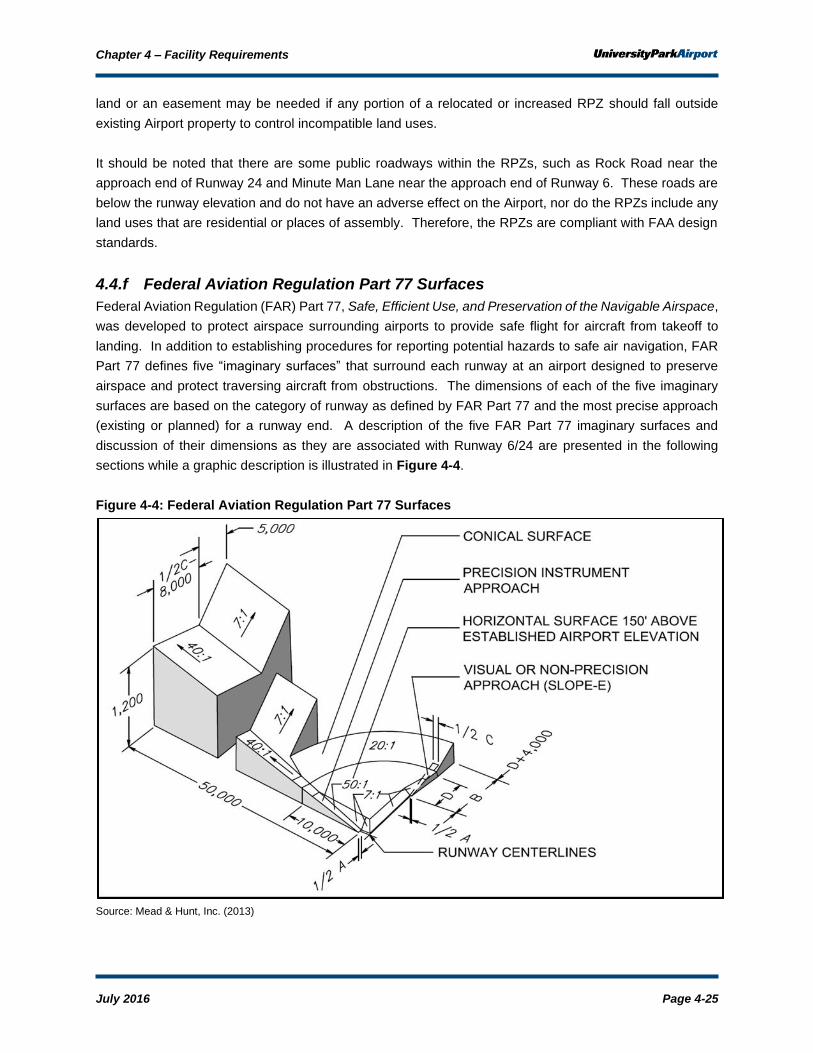
4.4.f Federal Aviation Regulation Part 77 Surfaces
Federal Aviation Regulation (FAR) Part 77, Safe, Efficient Use, and Preservation of the Navigable Airspace,
was developed to protect airspace surrounding airports to provide safe flight for aircraft from takeoff to
landing. In addition to establishing procedures for reporting potential hazards to safe air navigation, FAR
Part 77 defines five “imaginary surfaces” that surround each runway at an airport designed to preserve
airspace and protect traversing aircraft from obstructions. The dimensions of each of the five imaginary
surfaces are based on the category of runway as defined by FAR Part 77 and the most precise approach
(existing or planned) for a runway end. A description of the five FAR Part 77 imaginary surfaces and
discussion of their dimensions as they are associated with Runway 6/24 are presented in the following
sections while a graphic description is illustrated in Figure 4-4.
Figure 4-4: Federal Aviation Regulation Part 77 Surfaces
Source: Mead & Hunt, Inc. (2013)

Chapter 4 – Facility Requirements
Page 4-26 July 2016
Primary Surface – The primary surface is a two-dimensional surface centered longitudinally on a runway
and extends 200 feet beyond the end of a prepared hard surface (or at the end of a runway if there is no
prepared hard surface). The elevation of the primary surface is the same elevation as the nearest point on
the runway centerline and has a width based upon the designation of the runway and type of the approach.
Since Runway 6/24 is not considered to be a utility runway and has a precision approach (Runway 24), the
width of its primary surface is 1,000 feet while the length extends 200 feet beyond each end of paved
surface of the runway.
Approach Surface – The approach surface is centered longitudinally on the extended runway centerline
and extends outward and upward from each end of the primary surface. The dimensions of the approach
surface at each end of a runway is based upon the type of approach available or planned for that runway
end. The inner width of the approach surface is the same width as the primary surface and expands
uniformly to a width of:
• 1,250 feet for utility runways with only visual approaches;
• 1,500 feet for runways other than utility with only visual approaches;
• 2,000 feet for utility runways with non-precision instrument approaches;
• 3,500 feet for non-precision instrument runways other than utility having visibility minimums greater
than ¾ statue mile;
• 4,000 feet for non-precision instrument runways other than utility having a non-precision instrument
approach with visibility minimums as low as ¾ statue mile; and
• 16,000 feet for precision instrument runways.
In addition, the approach surface extends horizontally to a distance of:
• 5,000 feet at a slope of 20:1 for all utility and visual runways;
• 10,000 feet at a slope of 34:1 for all non-precision instrument runways other than utility; and
• 10,000 feet at a slope of 50:1 with an additional 40,000 feet at a slope of 40:1 for all precision
instrument runways.
Table 4-17 lists the dimensions of the approach surfaces at either end of Runway 6/24.
Table 4-17: Runway 6/24 Approach Surfaces Dimensions
Dimensions Runway 6 Runway 24
Inner Width 1,000 feet 1,000 feet
Outer Width 4,000 feet 16,000 feet
Horizontal Distance 10,000 feet 50,000 feet
Slope 34:1 50:1 first 10,000 feet;
40:1 for remaining 40,000 feet
Source: FAR Part 77

Chapter 4 – Facility Requirements
July 2016 Page 4-27
It should be noted that a number of trees were found to have penetrated the approach surface to Runway
24 as a part of the 2009 update to the Airport’s ALP approach surface drawings (no objects were found to
penetrate the approach surface to Runway 6). It is recommended that these trees be pruned or removed
so that the Runway 24 approach surface can be free of obstructions. The Airport should continually monitor
and mitigate objects that could be potential obstructions to the approach surfaces at either end of the
runway. It is also important to note that an obstruction survey should be considered as a part of any future
runway extension project to identify objects that may be penetrations to relocated approach surfaces.
Transitional Surface – The transitional surface extends outward and upward at right angles to the
extended runway centerline at a slope of 7:1 from the sides of the primary and approach surfaces. Those
portions of the transitional surface adjacent to precision approach surfaces which project through and
beyond the limits of the conical surface extend to a distance of 5,000 feet measured horizontally from the
edge of the approach surface and at right angles to the runway centerline.
Horizontal Surface – The horizontal surface is a plane 150 feet above the elevation of an airport whose
perimeter is constructed by swinging arcs of specified radii from the center of each end of the primary
surface for each runway at an airport and connecting the adjacent arcs by lines of tangent. The radius of
each arch is:
• 5,000 feet for all runways designated as utility or visual
• 10,000 feet for all other runways.
Runway 6/24 is not designated as utility or visual; as such, the radii of the arc found at each end of the
runway is 10,000 feet.
Conical Surface – The conical surface extends outward and upward from the periphery of the horizontal
surface at a slope of 20:1 for a horizontal distance of 4,000 feet.
Objects that penetrate the FAR Part 77 surfaces are considered to be hazards to air navigation unless
determined otherwise by an aeronautical study conducted by the FAA. It should be noted that aeronautical
studies only determine if an object is a hazard to air navigation and does not give the FAA specific
authorization to limit the height of objects that may be identified as hazards to air navigation. As such, it is
the responsibility of an airport to work with state or local governmental jurisdictions to control objects that
may penetrate FAR Part 77 surfaces. Objects that are identified as hazards to air navigation should be
removed (or pruned in the case of vegetation) or illuminated with an obstruction light if the objects cannot
be removed or are fixed by function.
4.5 Taxiway System
The design standards of a taxiway are based on the combination of the TDG and ADG classification of the
critical design aircraft intended to operate on the surface. The TDG classification of the critical design
aircraft determines the width of a taxiway while the ADG classification of the critical design aircraft

Chapter 4 – Facility Requirements
Page 4-28 July 2016
determines the width of the taxiway safety area and taxiway object free area. Similar to runways, taxiways
are designed with these three components to limit damage to an aircraft in the event of an unintended
excursion from the taxiway surface and protect aircraft from obstructions being place within close proximity
of the taxiway surface. It should be noted that the design standards of a taxiway system can vary by
individual taxiway depending on the purpose of the taxiway and the fleet mix of aircraft intended to operate
on the surface.
While a number of connector taxiways comprise the taxiway system at the Airport, it is most critical that a
review is conducted of the design standards associated with Taxiway A since it parallels Runway 6/24 and
provides access to the runway for all types of aircraft that operate at the Airport. Table 4-18 lists the
dimensions of the design surfaces associated with Taxiway A. Currently, the width of the taxiway meets
design standards for TDG-3 aircraft while the width of the taxiway safety area and taxiway object free area
meets ADG III design standards, which are classifications of the most demanding type of aircraft anticipated
to conduct regular operations at the Airport throughout the planning period.
Table 4-18: Taxiway A Design Surfaces Dimensions
Surface Design Criteria Dimension
Taxiway Width TDG-3 50 feet
Taxiway Safety Area Width ADG III 118 feet
Taxiway Object Free Area Width ADG III 186 feet
Source: FAA AC 150/5300-13A, Airport Design
While it is not anticipated that improvements will be needed to Taxiway A to support continued operations
of the critical design aircraft, it is important to note that the Airport is projected to receive increased
operations by larger, narrow-bodied aircraft classified in TDG-4. As noted in the projections chapter,
operations by TDG-4 aircraft, such as the McDonnell Douglas MD-80 series and the Boeing 757, are
anticipated to increase throughout the planning period. These aircraft types are frequently used by charter
operators, which conduct operations at the Airport to transport collegiate sports teams and LCCs who could
potentially operate at the Airport in the future. As such, it is important to review the taxiway design standards
for these categories of aircraft.
As illustrated in Table 4-19, some improvements are needed to the design surfaces of Taxiway A to meet
standards for TDG-4 aircraft. The existing width of parallel Taxiway A (50 feet) meets taxiway width
standards for both TDG-3 and TDG-4 aircraft; thus, no improvements to this design standard are necessary.
However, taxiway shoulder widths of 20 feet are recommended for taxiways that accommodate TDG-3
aircraft and are required for those taxiways designed for TDG-IV aircraft. Since Taxiway A does not have
paved shoulders, the addition of 20 foot wide paved shoulders should be considered. Improvements to the
width of the taxiway safety area and taxiway object free area may also be needed depending on the type
of TDG-4 aircraft that most frequently conduct operations at the Airport in the future. If these future
operations are conducted primarily by the MD-80, which is classified in TDG-4 and ADG III, then no
improvements are needed since the existing width of Taxiway A’s safety area and object free area meet
TDG-4 standards. However, if future TDG-4 operations at the Airport are primarily conducted by the Boeing

Chapter 4 – Facility Requirements
July 2016 Page 4-29
757, classified in TDG-4 and ADG IV, then the width of the taxiway safety area and object free area would
need to be increased from 118 feet and 186 feet, respectively, to 171 feet and 259 feet, respectively.
Table 4-19: Taxiway Design Criteria for Critical Design Aircraft
Surface
TDG-3 / ADG III Aircraft TDG-4 / ADG III Aircraft TDG-4 / ADG IV Aircraft
Design Criteria
Dimensions Design Criteria
Dimensions Design Criteria
Dimensions
Taxiway Width TDG-3 50 feet TDG-4 50 feet TDG-4 50 feet
Taxiway Shoulder Width
TDG-3 20 feet TDG-4 20 feet TDG-4 20 feet
Taxiway Safety Area Width
ADG III 118 feet ADG III 118 feet ADG IV 171 feet
Taxiway Object Free Area Width
ADG III 186 feet ADG III 186 feet ADG IV 259 feet
Source: FAA AC 150/5300-13A, Airport Design (2014)
It should be noted that inquiries have been received in the past about the feasibility of the Airport to support
operations by TDG-4/ADG IV aircraft. During negotiations of its most recent charter contract, Penn State
requested that a Boeing 757 (TDG-4/ADG IV) be used to transport its collegiate football team due to the
increased passenger and cargo capabilities of the aircraft. While sufficient runway length is available to
meet the minimum takeoff and landing distance requirements of the Boeing 757, concern was expressed
by the football charter operator, United Airlines, about the width of Taxiway A and the design of pavement
fillets at taxiway intersections to provide a sufficient margin of safety for the landing gear dimensions and
turning radii of this aircraft type. Likewise, similar concerns have been expressed by LCCs and other charter
operators who have met with the Airport in the past to discuss the potential of initiating service at State
College about the dimensions of Taxiway A and its pavement fillets and the ability to accommodate the
wider turning radii of TDG-4 aircraft, such as the McDonnell Douglas MD-80. Although the existing 50-foot
width of Taxiway A meets the design standards for these aircraft types, the Airport should continually
evaluate throughout the planning period the TDG classifications of large aircraft types that conduct regular
operations to determine if a change in the TDG classification of Taxiway A is needed.
Similar to runways, taxiways have longitudinal grade requirements based upon the AAC of the critical
design aircraft type intended to operate on the surface. According to FAA AC 150/5300-13A, Airport
Design, the maximum longitudinal grade is two percent for taxiways designed for Aircraft Approach
Category A and B aircraft and 1.5 percent for taxiways designed for Aircraft Approach Categories C, D, and
E. Taxiway D, which receives operations from Aircraft Approach Category C and D aircraft, has a
longitudinal grade of 2.7 percent that exceeds the 1.5 percent standard. At the time of this master plan
study, the Airport was undertaking a project to realign Taxiway D in an effort to correct the non-standard
longitudinal grade. The location of this realigned taxiway will be discussed as a part of the alternatives
analysis presented in Chapter 5.
FAA AC 150/5300-13A, Airport Design, recommends that connecting taxiways from aprons not have direct
access to a runway to reduce the potential for an aircraft to taxi from an apron directly onto a runway in an
effort to reduce runway incursions. Therefore, it may be beneficial to relocate the Taxiway C and Taxiway

Chapter 4 – Facility Requirements
Page 4-30 July 2016
J connectors to the runway so that there is not direct apron access to the runway without a distinctive turn
from Taxiway A to the runway.
Consideration should also be given to rename the connector taxiways between Runway 6/24 and Taxiway
A to meet standards identified in FAA AC 150/5340-18F, Standards for Airport Sign Systems. General
guidelines that should be followed include keeping the naming designation simple and logical, using letters
of the alphabet in sequential order from one end of the airport to the other. Designations such as “A1”,
“A2”, and “A3” should be used as these are intended to represent short taxiways that are perpendicular to
a runway or parallel taxiway.
The remainder of the taxiway system at the Airport, comprised of connector taxiways between Runway
6/24 and Taxiway A, as well as between Taxiway A and the apron surfaces, currently meet design standards
for TDG-3/ADG III aircraft. Since TDG-3/ADG III aircraft are anticipated to remain the critical aircraft type
operating at the Airport during the planning period, improvements to meet FAA design standards are not
anticipated. However, improvements to some connector taxiways, specifically those to the air carrier apron
and the GA apron from Taxiway A, may be needed if operations by TDG-4 aircraft increase throughout the
planning period. It is recommended that the Airport initiate planning to improve the safety areas and object
free areas of these connector taxiways, if needed, to accommodate certain TDG-4 aircraft types, such as
the Boeing 757, that require an increase taxiway safety area and object free area width if these aircraft
become the critical design aircraft.
4.6 Aprons
The function of an apron is to accommodate aircraft during the loading and unloading of passengers and/or
cargo as well as to support fueling, maintenance, and parking activities. The size and layout of an apron is
dependent upon a number of factors including purpose of the apron, number of aircraft parking positions,
size and type of aircraft intended to use the surface, movement patterns of aircraft and ground service
vehicles, and locations of support facilities such as hangars and terminal buildings. In addition, aprons
should also be designed to accommodate demand during peak periods of operation. Considering these
factors, an analysis was conducted to determine the amount of apron space that will be needed to
accommodate demand throughout the planning period.
Guidance established in FAA AC 150/5300-13A, Airport Design, was used to evaluate the demand for
apron space at the Airport based on the total amount of space that is needed on the busiest day of
operation. The total number of itinerant GA aircraft operations in 2012 was obtained from the FAA’s Air
Traffic Activity Data System (ATADS) as well as the projected annual number of itinerant GA aircraft
operations that can be anticipated at the Airport throughout the planning period. The percent of total
operations in the peak month (10.28 percent) was then multiplied by these annual counts to determine the
total number of operations in the peak month. This number was then multiplied by 31 to determine the
average number of daily operations in the peak month. Assuming that the existing apron area is at 100
percent capacity to meet existing demand, an apron demand per aircraft square footage can be calculated

Chapter 4 – Facility Requirements
July 2016 Page 4-31
to determine the amount of additional apron area that will be needed to meet future demand as presented
in Table 4-20.
Table 4-20: Projected Itinerant Aircraft Apron Demand
Source: Mead & Hunt, Inc. (2013)
As illustrated in the table, the demand for apron space is anticipated to grow throughout the planning period
from an additional 21,487 square feet of apron area needed in 2017 to an additional 93,481 square feet of
apron area in 2032. Therefore, it is recommended that apron areas be expanded at the Airport to
accommodate the increase in demand that is projected for the planning period.
It is important to note that a few times each year, the demand for apron space well exceeds the peak month
average day demand; this is often the case when Penn State hosts a football game against a high ranking
opponent. During these events, the Airport experiences a large number of itinerant aircraft operations from
alumni, fans, and corporate sponsors associated with both Penn State and the visiting team. As such, all
available apron space is utilized for aircraft parking including the GA apron, deicing apron, T-style hangar
area apron, box-style hangar aprons, and, if needed, the holding pads on Taxiway A located near the
approach ends of Runway 6/24. Though the recommended expansion of apron area will help the Airport
better accommodate itinerant aircraft parking during these events, it is only intended to meet the peak
month average day demand, which may necessitate the continued use of other pavements for overflow
parking.
Like runways and taxiways, aprons have surface gradient design standards as identified in FAA AC
150/5300-13A, Airport Design, to ease aircraft towing and taxiing while promoting positive drainage.
Gradient design standards are based upon the AAC of the most demanding type of aircraft intended to
operate on the surface. For Aircraft Approach Categories A and B, the maximum allowable grade in any
direction is two percent while the maximum allowable grade for Aircraft Approach Categories C, D, and E
is one percent. The GA apron is designed for Aircraft Approach Category C and D and has a maximum
grade of 3.3 percent, which exceeds the two percent design standard. As such, it is recommended that the
Airport evaluate the feasibility of correcting the grade change on the GA apron during the design of the
pavement surface’s next major rehabilitation project.
Criteria 2012 2017 2022 2027 2032
Annual GA itinerant operations 15,420 16,390 17,421 18,501 19,640
x Percentage of total operations in peak month 10.28% 10.28% 10.28% 10.28% 10.28%
= Peak month operations 1,585 1,685 1,791 1,902 2,019
Peak month average day operations(Peak month operations divided by 31)
51 54 58 61 65
Existing apron area (square feet) 341,583 341,583 341,583 341,583 341,583
Itinerant apron demand per aircraft (square feet) 6,680 6,680 6,680 6,680 6,680
Total itinerant apron demand (square feet) 341,583 363,070 385,909 409,833 435,064
Apron Deficiency (square feet) 0 (21,487) (44,326) (68,250) (93,481)

Chapter 4 – Facility Requirements
Page 4-32 July 2016
4.7 Navigational Aids and Weather Equipment
Visual and electronic guidance for pilots on approach to land and during takeoff are provided by
Navigational Aids (NAVAIDs) that are located either physically on an airfield, from other nearby ground
based electronic equipment, or from orbiting satellites. Several factors such as the type and volume of
aviation activity, local meteorological conditions, and established instrument approach procedures dictate
the types of NAVAIDs that should be installed at an Airport. Several FAA documents such as AC 150/5300-
13A, Airport Design; FAA Order 7031.2C, Airway Planning Standard Number One – Terminal Air Navigation
Facilities and Air Traffic Control Services; FAR Part 139, Certification of Airports, and the Aeronautical
Information Manual (AIM) offer guidance on the type of visual and electronic NAVAIDs that should be
present at an airport. A review of the visual and electronic NAVAID equipment documented during the
inventory effort of the planning process was conducted to determine if any improvements to existing
equipment or installation of additional NAVAID equipment will be necessary to meet the projected demand.
NAVAIDs are discussed in this section by two categorizations: visual NAVAIDs and electronic NAVAIDs.
In addition, this section will also review the weather equipment that is installed at the Airport, which also
provides important information to pilots that can factor into navigation procedures, such as wind direction,
wind speed, visibility, cloud ceiling height, and local atmospheric conditions, such as rain and snow. This
review, which is presented at the end of the section, will focus on whether any upgrades or relocation of
the equipment is necessary to improve the accuracy of weather condition reporting at the Airport.
4.7.a Visual Navigational Aids
Navigational devices that require visual recognition by a pilot are considered to be visual NAVAIDs and
include devices such as approach lighting, windsocks, and signage. Visual NAVAIDs are most beneficial
in assisting a pilot to visually locate a runway and complete the transition from flight to touchdown on a
runway. It should be noted that visual NAVAIDs often complement electronic NAVAIDs and may be
required in certain circumstances to fulfill the installment of the electronic NAVAID. The following
summarizes the review that was conducted of each visual NAVAID and discusses any improvements that
may be necessary for the device to continue to provide accurate navigational information to pilots.
Rotating Beacon – The rotating beacon at the Airport is located on the top of the ATCT and is utilized to
identify the location of the Airport to pilots in the air. Illumination of the rotating beacon at night indicates
that the Airport is open while illumination during the day indicates the cloud ceiling is below 1,000 feet
and/or the visibility is less than three miles. The angle of the light should be positioned as such that on-
and off- airport structures and surrounding terrain do not block the light when viewed from the air. Currently,
there are no obstructions or surrounding terrain that obstruct viewing of the light beam; as such, no
improvements such as relocation of the rotating beacon or mitigation of possible obstructions are
necessary.
Wind Indicators – Also known as wind cones, wind indicators are devices that provide surface wind
direction and velocity information to pilots. FAR Part 139 directs that a wind indicator be installed at each
end of an air carrier runway or at least at a point visible to the pilot on final approach and prior to takeoff.

Chapter 4 – Facility Requirements
July 2016 Page 4-33
Wind indicators are also required to be illuminated if an airport is open for air carrier operations at night. At
the Airport, there are three lighted wind indicators: one located near the approach end of Runway 6 inside
the segmented circle to the south of the commercial airline terminal building, one to the west of the deicing
apron adjacent to the GA apron, and one at the approach end of Runway 24 adjacent to the Taxiway A and
Taxiway H intersection. An additional wind indicator is planned to be installed adjacent to the Taxiway A
holding apron near the approach end of Runway 6. No improvements are recommended to the wind
indicators other than routine inspections and replacement of worn or faded fabric.
Segmented Circle – A segmented circle is a series of ground based markings that are arranged in a circle
with a wind indicator in the middle used to indicate the direction and strength of the wind as well as the
traffic pattern of each runway at an airport. FAR Part 139 requires that a segmented circle with associated
landing strip indicators and traffic pattern indicators be installed at an airport when a control tower is not
present or is not in 24-hour continuous operation. The segmented circle at the Airport, located southwest
of the commercial airline terminal apron, is equipped with landing strip indicators and traffic pattern
indicators and meets the requirement set forth in FAR Part 139; therefore, no improvements are necessary.
Medium Intensity Approach Lighting System with Runway Alignment Indicator Lights (MALSR) –
The Medium Intensity Approach Lighting System with Runway Alignment Indicator Lights (MALSR) is a
series of light bars located at the threshold of a runway used in assisting pilots confirm the centerline of a
runway during landing. MALSR light bars are each equipped with five lights that are preceded by a series
of sequenced flashing lights. MALSRs are most beneficial when visibility is limited, such as at night, in
inclement weather, and/or when lights from the surrounding environment have the potential to make visual
identification of the runway threshold challenging, such as when an airport is located in an urban
environment. At the Airport, a MALSR is located at the approach end of Runway 24 and meets siting
standards set forth by FAA Order JO 6850.2B, Visual Guidance Lighting Systems; as such, improvements
to the MALSR are not necessary. An approach lighting system such as a MALSR is required for approach
visibility minimums below ¾ mile and the potential need for a MALSR system for Runway 6 is discussed in
the electronic NAVAIDs section.
Precision Approach Path Indicators (PAPIs) – PAPIs provide the correct glide slope path for an aircraft
to land on a runway through a series of red and white lights arranged in a single row consisting of either
two- or four-light units. A combination of red and white, all red, or all white lights identifies if a pilot is on
the glide slope, below the glide slope, or above the glide slope, respectively. A four-light PAPI is located
at the approach end of Runway 6 and Runway 24, installed to the siting standards identified in FAA Order
JO 6850.2B, Visual Guidance Lighting Systems; as such, improvements to the PAPI units are not
necessary.
Runway Edge Lighting – Runway 6/24 is equipped with a high intensity runway lighting (HIRL) system
that offers five illumination intensity settings and the ability for pilots to remotely control the intensity of the
lights through a series of microphone clicks on the universal communications (UNICOM) frequency when
the air traffic control tower is closed. It should also be noted that HIRL systems are required on runways
that have a Category I, Category II, or Category III instrument approach. Given that Runway 24 is equipped

Chapter 4 – Facility Requirements
Page 4-34 July 2016
with a Category I instrument approach, and the control tower is not in operation between 10:00 p.m. and
6:00 a.m. daily, improvements to the edge lighting system on Runway 6/24 are not anticipated.
Airfield Pavement Markings – Airfield pavement markings applied to runways, taxiways, and apron
surfaces provide visual and perceptual navigational cues to pilots and ground vehicle operators when
navigating an airfield surface. Examples of pavement markings include those identifying the aiming point,
touchdown zone, and designation of a runway, the boundary of a runway and its associated safety area,
and the boundary of the movement area where communication with air traffic control is necessary.
Runways that support precision instrument approaches are required to include a landing designator
marking, centerline, threshold markings, aiming point marking, touchdown zone markings, and side stripes.
Runway 6/24 meets these marking requirements; only routine maintenance is anticipated throughout the
planning period to maintain the reflectivity and visibility standards so that they can be easily identified in
reduced visibility and nighttime conditions.
Airfield Signage – Airfield signage complements pavement markings by providing locational and
directional information to pilots and ground vehicle operators maneuvering on an airfield. Signage found
on an airfield includes runway hold position signs, runway distance remaining signs, taxiway locations,
taxiway directional signs, and destination location signs. A review of existing airfield signage found that all
airfield signs meet standards set forth in FAA AC 150/5340-18F, Standards for Airport Sign Systems; as
such, only routine inspections and maintenance to ensure signs continue to meet reflectivity and visibility
standards are anticipated throughout the planning period.
Taxiway Edge Lighting – Taxiway edge lighting is an important navigational tool for pilots and ground
vehicle operators as it delineates the edge of a taxiway surface when visibility conditions are limited such
as during the night and in inclement weather. Airports that support commercial airline service are
recommended to have medium intensity taxiway lighting (MITL) systems since three illumination intensities
are offered. Since the airfield is equipped with a MITL system, no improvements to taxiway edge lighting
are anticipated throughout the planning period; it should be noted, however, that the Airport is currently
working on a project to upgrade its taxiway lighting to more energy efficient light-emitting diode (LED)
fixtures, which would help reduce energy usage resulting in decreased airfield operating expenses.
4.7.b Electronic Navigational Aids
Electronic NAVAIDs are considered to be those navigational devices that transmit a signal to be received
by properly equipped aircraft so that a pilot can conduct a landing when visibility is impacted, such as during
inclement weather, low cloud ceilings, and in nighttime conditions. Electronic NAVAIDs range from signal
transmitting devices installed at an airport to off-airport electronic equipment and orbiting satellites in space.
The following section reviews the existing electronic NAVAIDs at the Airport, identifies if they are adequate
to meet anticipated demand, and lists actions that should be considered to improve the electronic-based
navigational capabilities of the Airport.
Instrument Landing System (ILS) – An ILS is comprised of two components: a localizer and a glide slope
antenna. The localizer is an antenna placed at the departure end of a runway that transmits a signal to
align aircraft with the centerline of a runway when on approach to land. The glide slope antenna is

Chapter 4 – Facility Requirements
July 2016 Page 4-35
positioned near the aiming point marking at the approach end of a runway and provides vertical guidance
to aircraft to align them with the correct landing descent path. ILSs permit properly equipped aircraft with
certified pilots to conduct precision instrument approaches during periods of limited visibility.
The type of precision instrument approach offered by an ILS is categorized based on the minimum cloud
ceiling height and visibility requirement that is necessary for a pilot to fly the approach, with Category III
approaches offering lower decision heights and visibility requirements than Category I approaches.
Currently, the Airport is equipped with a Category I ILS approach to Runway 24 that offers a minimum cloud
ceiling height (also known as decision height) of 200 feet and a minimum visibility requirement of a ½ mile
for a pilot to conduct an instrument approach for landing. While other categories of ILS are available that
offer lower decision heights and visibility requirements, it appears the Category I approach is adequate to
meet existing and projected demand.
Through the planning process, a question was raised on the potential of establishing a special authorization
Category II approach to Runway 24. Special authorization Category II approaches are those that utilize
Category I ground based instrumentation and offer Category II decision heights as low as 100 feet and
visibility minima as low as 1,200 feet RVR for aircraft that are equipped with autoland capabilities or a heads
up display (HUD) approved for use to touchdown. For a special authorization Category II approach to be
established, a number of requirements must be met as identified in FAA Order 8400.13D. These include
having an ATCT, runway distance of at least 6,000 feet, MALSR, HIRL, RVR instrumentation, ILS, and
obstruction clearing that meets Terminal Instrument Procedures (TERPS) Category II requirements.
A review of these requirements found that only the installation of RVR equipment is needed for the Airport
to receive a special authorization Category II approach to Runway 24. Initially, the height of the ATCT and
its location in relation to the runway was a concern as it was not known whether this structure could be a
potential obstruction to TERPS Category II missed approach surfaces. However, a review of the allowable
heights of objects if TERPS Category II missed approach surfaces were established at the Airport found
that the ATCT would not be an obstruction. As illustrated in Figure 4-5, the height of the ATCT is 1,335
feet MSL and the allowable height of an object at its location is 1,340 feet MSL; thus, this object would not
be considered an obstruction to TERPS Category II missed approach surfaces.
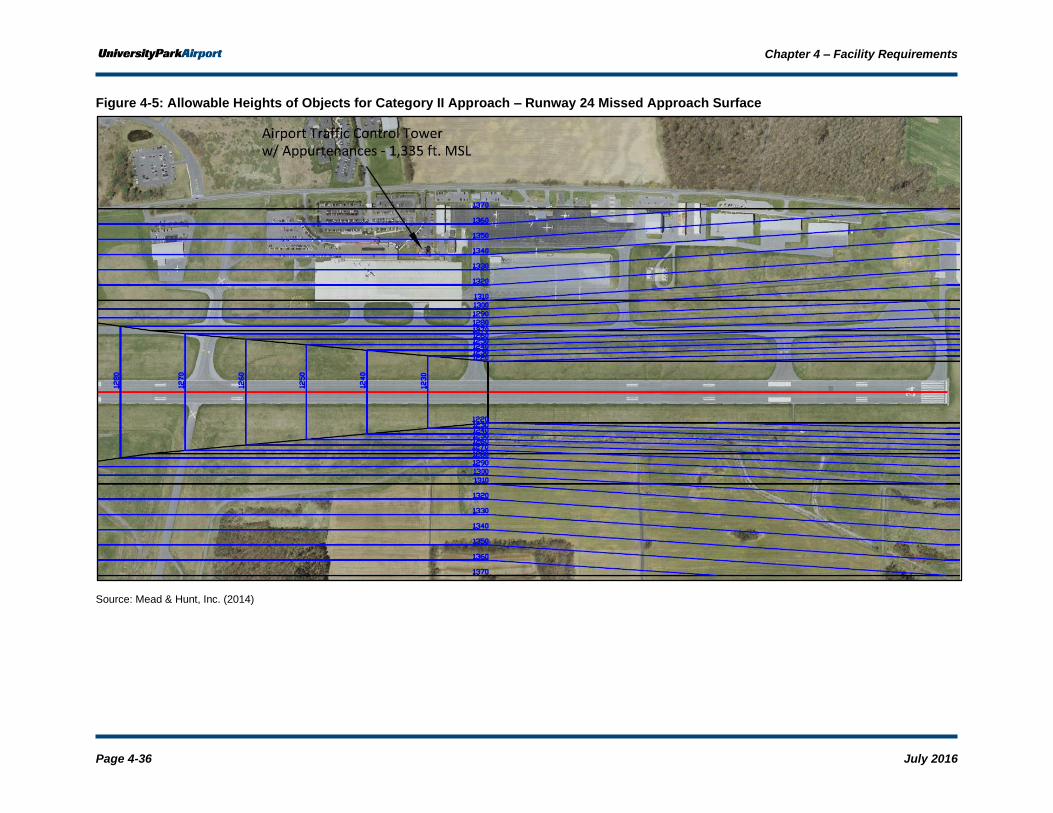
Chapter 4 – Facility Requirements
Page 4-36 July 2016
Figure 4-5: Allowable Heights of Objects for Category II Approach – Runway 24 Missed Approach Surface
Source: Mead & Hunt, Inc. (2014)

Chapter 4 – Facility Requirements
July 2016 Page 4-37
The FAA establishes takeoff minimums for every airport that has published Standard Instrument
Approaches (SIA). Commercial aircraft conducting operations under FAR Part 121 and FAR Part 135 must
comply with these visibility and ceiling height minimums when taking off while aircraft operating under FAR
Part 91 are not required, but encouraged, to comply. Based on the operations specifications (OpSpecs) of
each FAR Part 121 and Part 135 operator, a request can be made for lower-than-established takeoff
minimums if certain navigational infrastructure elements are present at an airport. This is possible due to
the advancement of avionics equipment that can increase the position accuracy of aircraft to offset
limitations with existing ground based navigational equipment. It is important to note that aircraft requesting
to depart in lower than standard minimums must have this advanced avionics equipment on board in order
to depart in these conditions.
Information presented in Table 4-21 illustrates the lower than standard visibility minimums that are available
to FAR Part 121 and Part 135 operators with proper avionics equipment installed in their aircraft when
certain ground based navigational air infrastructure is present at an airport. As indicated in the table,
departures can occur when the RVR is as low as 300 feet if an aircraft equipped with a HUD departs on a
runway that has centerline lighting and HIRL. Since Runway 6/24 does not have centerline lighting,
departures could occur at the Airport when the visibility is as low as 1,000 feet if requested by a commercial
airline operating under FAR Part 121 or Part 135.
Table 4-21: Equipment Requirements for Lower Than Standard Takeoff Visibility Minimums
Required Equipment HUD onboard aircraft
Rwy Centerline lighting HIRL
Rwy Centerline Lighting HIRL
Rwy Centerline lighting; or
Rwy centerline markings HIRL
Touchdown Zone Visibility 300 feet with RVR 500 feet with RVR 1,000 feet with RVR
Midpoint Visibility 300 feet with RVR 500 feet with RVR 1,000 feet with RVR
Rollout Visibility 300 feet with RVR 500 feet with RVR 1,000 feet with RVR
Source: Jeppesen (2008)
It should be noted that, to implement lower than standard takeoff visibility minimums at the Airport, an RVR
would need to be installed near the touchdown zone, midpoint, and rollout portions of Runway 24. In
addition, a Surface Movement Guidance and Control System (SMGCS) plan would need to be created
since it is required by the FAA if departures (or arrivals) are authorized below 1,200 feet RVR. Table 4-22
lists the infrastructure and operational requirements that are necessary for SMGCS operations to occur at
the Airport. As indicated in the table, the installation of runway guard lights as well as the development of
a ground vehicle training and control program, a low visibility taxi route chart, and initial and periodic
operational inspections that meet SMGCS standards would be needed for low visibility operations to occur
at the Airport. Review and revision of the SMGCS plan as needed would be regularly required.

Chapter 4 – Facility Requirements
Page 4-38 July 2016
Table 4-22: SMGCS Plan Requirements for Operations below 1,200 Feet RVR
Required Element Installed Needed
Taxiway lights X Runway guard lights X 12 inch taxiway markings with black borders X Taxiway guidance signs at all intersections X Consideration of local issues * * Ground vehicle training and control X Low visibility taxi route chart X Initial and periodic operational inspections X Review and revision of SMGCS plan as needed X
Notes: * = local issues would be considered as a part of plan development
Source: FAA AC 120-57A, Surface Movement Guidance and Control System
In summary, for lower than standard operations to occur at the Airport, a request must first be made by a
commercial operator who has aircraft equipped with avionics systems that are capable for operation in low
visibility conditions. For a special authorization Category II approach to be developed for these operators
using the Category I ILS system on Runway 24, RVR equipment must first be installed at the Airport. The
installation of this equipment, in addition to the development of an SMGCS plan and the installation of
runway guard lights would be necessary for lower than standard departure procedures to be developed at
the Airport.
To conclude the review of ILS system requirements at the Airport, it should be noted that Runway 6 is not
equipped with an ILS or a precision instrument approach. This is important to consider given that during
IFR conditions, Runway 6 provides greater wind coverage at a 10.5 knot crosswind than Runway 24 (82.69
percent to 73.29 percent, respectively). As such, there is a need for a precision instrument approach to
Runway 6. Currently, the FAA is moving away from ground-based instrumentation to provide precision
instrument approaches in support of satellite-based Next Generation Air Transportation System (NextGen)
air traffic control and navigation initiatives. Due to this transformation of air traffic control and aircraft
navigation, legacy systems such as ILSs are not being installed at airports to provide a precision instrument
approach to a runway. However, for an airport to receive satellite-based precision instrument approach
minimums, other infrastructure components, such as an approach lighting system, will still be required.
Therefore, it is recommended that the Airport consider installation of an approach lighting system such as
a MALSR to Runway 6 so that when NextGen initiatives are fully implemented, the runway will be properly
equipped to receive approach minimums as low as a Category I ILS.
Global Positioning System (GPS) – Currently, the Airport has two satellite-based instrument approach
procedures that offer localizer performance with vertical guidance (LPV); an Area Navigation (RNAV)
Approach to Runway 24 and an RNAV approach to Runway 6. These approaches each offer properly
equipped aircraft and trained pilots the ability to conduct a GPS-based approach when the visibility is at
least ¾ mile and the cloud ceiling is at least 300 feet to Runway 6 as well as when the visibility is at least a
½ mile and the cloud ceiling is at least 200 feet to Runway 24. While the GPS approach to Runway 24
appears adequate to meet the demands of users throughout the planning period, it is recommended a GPS
approach offering lower visibility and cloud ceiling minimums be developed for Runway 6. As mentioned
in the previous section, a GPS-based precision instrument approach to Runway 6 would improve the
capacity of the Airport, particularly during IFR conditions in a 10.5 knot crosswind. It is recommended an

Chapter 4 – Facility Requirements
July 2016 Page 4-39
improved GPS-based instrument approach offering a visibility minimum of a ½ mile and a cloud ceiling
minimum of 200 feet be developed for Runway 6 to match the GPS instrument approach capabilities of
Runway 24; as previously discussed, this will require the installation of an approach lighting system such
as a MALSR.
Very High Frequency Omni-Directional Radio Range Antenna (VOR) – The VOR is a ground-based
NAVAID that emits radio signals so that a pilot can determine his or her course and position in relation to
the distance from the VOR. While a VOR is not located on Airport property, a VOR is installed
approximately 8.9 miles to the northwest of the Airport near Philipsburg and is used in navigating a non-
precision instrument approach to the Airport. VORs do not offer the accuracy of GPS and the FAA is
currently evaluating the necessity, benefits, and costs of these NAVAIDs throughout the National Airspace
System (NAS).
Airport Weather Observation System (AWOS) – The AWOS at the Airport is a unit located near the glide
slope antenna at the approach end of Runway 24 that measures and transmits local weather conditions at
the Airport such as temperature, dew point, altimeter, wind speed, wind direction, visibility, cloud ceiling
height, and type of precipitation intensity. It is important that an airport installs weather reporting equipment
that is appropriate for the operational needs and atmospheric characteristics of the surrounding
environment as well as at a site that accurately reports conditions. The existing AWOS III P/T unit installed
at the Airport meets the accuracy of weather reporting required for aircraft to conduct Category I precision
instrument approaches and does not need to be replaced with a system offering a greater degree of weather
reporting accuracy to meet the demands of users.
RVR is an instrumentally derived value reported in feet that represents the horizontal distance a pilot will
see down the runway from the approach end. RVR equipment is often most beneficial for runways with a
precision instrument approach as it provides more accurate visibility measurements to increase the
utilization and throughput capacity of a runway. RVR equipment is also a beneficial safety tool for pilots
when deciding to conduct a takeoff or landing in low visibility conditions. Currently, RVR equipment is not
installed at the Airport. As such, the installation of this equipment would help to increase the accuracy of
visibility measurements during low visibility conditions. Consideration should be given for the installation
of an RVR if more accurate visibility reporting is desired at the Airport.
As a part of evaluating the adequacy of the Airport’s AWOS unit, it is also important to consider whether
the location of the AWOS meets siting criteria identified in FAA Order 6560.20B, Siting Criteria for
Automated Weather Observing Systems (AWOS). This FAA order offers guidance on siting weather
observing equipment so that sensors and instrumentation are not influenced by artificial conditions such as
large structures, cooling towers, and expanses of concrete and tarmac. While each AWOS sensor (wind,
temperature, cloud ceiling, etc.) has specific siting requirements, all AWOS sensors should be located
together and outside of runway and taxiway OFAs. Generally, AWOS units should be placed between
1,000 and 3,000 feet longitudinal distance from the primary runway threshold and between 500 and 1,000
feet from the runway centerline. The AWOS unit at the Airport is located approximately 1,000 feet of
longitudinal distance from the threshold of Runway 24 and is located approximately 250 feet from the
centerline of the runway within the ROFA. While it is not mandated that the AWOS unit be located outside

Chapter 4 – Facility Requirements
Page 4-40 July 2016
the OFA, consideration should be given to relocate this equipment to meet guidelines identified in FAA
Order 6560.20B, Siting Criteria for Automated Weather Observing Systems (AWOS). It is recommended
that this occur as a part of any future infrastructure or runway design surfaces improvement project that
would relocate the runway threshold such as what would occur if Runway 24 were extended.
4.8 Terminal Area
In addition to airside elements, a review of the facility needs in the terminal area was also conducted as a
part of this sustainable master plan study. Terminal area elements that were assessed include the terminal
gates and apron, terminal building, landside vehicular access, and vehicle parking. For the purposes of
this master plan, the terminal area review is organized in the following four elements:
4.8.a Terminal Gate and Apron Requirements
4.8.b Terminal Building Requirements
4.8.c Landside Access Requirements
4.8.d Vehicle Parking Requirements
4.8.a Terminal Gate and Apron Requirements
The number of gates needed to support forecasted activity is a critical element in determining the overall
size and configuration of the terminal complex. A gate is defined as an aircraft parking position near the
terminal that is used on a daily basis for the loading and unloading of passengers. The Airport currently
has six ground loading parking positions. Figure 4-6 depicts the terminal apron parking layout with the six
aircraft parking positions for the fleet mix that operates at the Airport shown in blue. It is important to note
that all of the parking positions are ground loaded as passenger loading bridges are not available.

Chapter 4 – Facility Requirements
July 2016 Page 4-41
Figure 4-6: Terminal Apron Aircraft Layout
Source: Mead & Hunt, Inc. (2013)
The size of the terminal apron should be able to accommodate the fleet mix of commercial aircraft types
present during periods where the demand for space is at its greatest. Figure 4-7 depicts the airline
schedule of the peak month (October 2012) as well as the addition of two daily roundtrips to Chicago O’Hare
by United Airlines depicted as a ramp chart by carrier. This ramp chart shows a bar for the arrival and
departure time of each aircraft at the Airport indicating when a gate or parking position on the terminal apron
is occupied.
Figure 4-7: Air Carrier Ramp Chart
Source: Diio Mi Airlines Schedules, United Airlines Service Announcement (2013)
The greatest demand for terminal apron space occurs during the overnight period when aircraft from the
final arriving flights of the day are parked and staged for departure the following morning, also known as
remain overnight aircraft (RON). RON aircraft parking during the peak month of October are presented in
the air carrier ramp chart. As shown, airlines schedules include five overnight aircraft. It should also be
noted that the Airport experiences occasional RON charter flights that are not included in the ramp chart of
scheduled passenger activity.
The forecasted demand for RON aircraft parking on the terminal apron through 2032 is presented in Table
4-23. It is assumed that the total number of typical daily departures is directly proportional to the total
Airline 0500 0600 0700 0800 0900 1000 1100 1200 1300 1400 1500 1600 1700 1800 1900 2000 2100 2200 2300
DL
US
US
UA
UA
5 OVERNIGHTS
CRJCRJ
CRJ
DH8 DH8 CRJ DH8 CRJ CRJ
CRJ
DH8 CRJ
CRJ
DH8 DH8
CRJ
DH8 DH8
CRJ
CRJ CRJ

Chapter 4 – Facility Requirements
Page 4-42 July 2016
number of annual scheduled passenger aircraft departures. The total number of daily departures by aircraft
type was projected along with the number of daily RON aircraft. Using the demand for RON aircraft parking
on a typical Sunday in the peak month of October 2012, with the addition of the recent service
announcement by United Airlines of two daily roundtrips to Chicago O’Hare (one overnight) as a
benchmark, the projected demand for RON aircraft parking by aircraft type was extrapolated from the
projected typical daily departures.
Table 4-23: Projected Overnight Aircraft Parking Demand
Projections: Mead & Hunt, Inc. (2013)
As illustrated in the table above, the total number of daily flights is anticipated to decrease slightly through
the planning period, due to the increases in average aircraft size. The table also indicates that number of
overnight aircraft are also anticipated to decline slightly through the planning period. The fleet mix of the
aircraft, however, is anticipated to change towards larger regional jets as turboprops and smaller regional
jets are retired. Therefore, it is anticipated that daily RON aircraft in 2032 will continue to consist of four to
five aircraft, which is consistent with current airline schedules; however, the apron should be capable of
accommodating larger 70- to 90-seat regional jets, rather than 50-seat regional jets as it is currently
configured. At least one of the aircraft positions should also be sized to accommodate narrow-body aircraft
for potential low-cost carrier activity in the future and charter flights.
Additionally, it is desirable for the terminal apron to be sized to accommodate at least one or two additional
aircraft beyond those projected to accommodate late arriving or departing flights, changes in airline flight
schedules, charter activity, a new entrant service carrier, or aircraft diversions from other airports due to
weather. Therefore, through the planning period the Airport should plan to accommodate at least six aircraft
parking positions with the following fleet mix:
2012 2017 2022 2027 2032
Annual Enplanements: 138,488 172,000 186,137 201,437 217,994
Total Annual Scheduled Passenger Aircraft Departures: 4,736 4,134 3,815 3,425 3,474
Peak Month Typical Day (PMTD) Departures: 16 14 13 12 12
Seats Typical Aircraft
Projected Annual Departures: 2,697 1,558 763 0 0
Projected PMTD Departures: 9.1 4.3 2.1 0.0 0.0
Overnight Gate Demand: 1 1 1 0 0
Projected Annual Departures: 2,039 2,191 1,953 1,466 1,251
Projected PMTD Departures: 6.9 7.4 6.6 5.0 4.2
Overnight Gate Demand: 4 3 3 2 1
Projected Annual Departures: 0 289 992 1,850 2,085
Projected PMTD Departures: 0.0 1.0 3.4 6.2 7.0
Overnight Gate Demand: 0 1 1 2 3
Projected Annual Departures: 0 0 0 0 0
Projected PMTD Departures: 0.0 0.0 0.0 0.0 0.0
Overnight Gate Demand: 0 0 0 0 0
Projected Annual Departures: 0 95 107 110 139
Projected PMTD Departures: 0.0 0.3 0.4 0.4 0.5
Overnight Gate Demand: 0 0 0 0 0
Projected Annual Departures: 0 0 0 0 0
Projected PMTD Departures: - 0.0 0.0 0.0 0.0
Overnight Gate Demand: 0 0 0 0 0
Overnight Gate Demand: 5 5 5 4 4
Percent of Total Average Daily Depatures: 31.3% 35.8% 38.8% 34.6% 34.1%
Less than 40
SAAB 340, Dornier 328,
ERJ-135, Beech 1900,
EMB-120, DHC-8
40-60CRJ-200, ERJ-140,
ERJ-145, DHC-8-300
61-99Avro RJ, CRJ-700, CRJ-900,
ERJ-170, ERJ-175
100-130717, DC-9, ERJ-190,
ERJ-195, A319
131-150A320, MD-81/82/83/87/88,
737-400, 737-500
151 or moreMD-90, 737-800, 737-900,
757-200

Chapter 4 – Facility Requirements
July 2016 Page 4-43
• One (1) small regional jet (50 seats)
• Four (4) large regional jets (70 to 90 seats)
• One (1) narrow body jet (737/A320/MD-80)
The existing terminal apron has six aircraft parking positions, however, they are for small turboprop and 50
seat regional jets. Therefore, as a part of the alternatives analysis, six parking positions capable of
accommodating a fleet mix of larger sized aircraft as identified above will be evaluated.
As noted, all of the parking positions on the terminal apron are ground loaded as passenger boarding
bridges are not available. Passenger boarding bridges are often an advantageous terminal building
component as they provide an enclosed, protective mechanism for the transfer of passengers between an
aircraft and the terminal building. This is beneficial because it does not expose passengers to rain, snow,
ice, and apron hazards such as jet/auxiliary power unit (APU) exhaust, maneuvering ground vehicles, and
other aircraft as is necessary with a ground loading boarding gate. To improve passenger safety and
convenience, it would be beneficial if two aircraft parking positions on the terminal apron were equipped
with a passenger boarding bridge that could service 50- to 90- seat regional jets as well as narrow body
aircraft. This would enhance the travel experience at the Airport for commercial airline passengers as well
as protect them from weather elements and ramp hazards when transitioning between an aircraft and the
terminal building. Consideration should be given for the installation of two passenger boarding bridges as
a part of any future terminal building or apron improvement project.
4.8.b Terminal Building Requirements
The 34,745-square-foot terminal building at the Airport consists of single shared holdroom, one baggage
claim device, a single security checkpoint, airline and rental car spaces, Transportation Security
Administration (TSA) offices, concessions space, Centre County Airport Authority (CCAA) administration
offices, and other ancillary spaces. Additionally, there is a covered walkway that provides access from the
holdroom to a number of the aircraft parking positions. Figure 4-8 depicts the layout of the existing terminal
building.

Chapter 4 – Facility Requirements
Page 4-44 July 2016
Figure 4-8: Existing Terminal Building Layout
Source: Mead & Hunt, Inc. (2013)
In 2005, a Terminal Area Master Plan was completed that recommended a new terminal building be
constructed in a new location to support the long-term needs of the Airport. This master plan study did not
include a detailed space programming study of the individual components within the terminal building
facility, but did include an assessment of the capacity of the key passenger processing components. This
work determined the capacity, or threshold, at which the existing terminal building’s capacity would be
reached. Generally, terminal facility needs are a function of peak passenger demands placed upon the
facility. The number of hourly arriving and departing seats during a typical day in the peak month is shown
in Table 4-24 that also includes the number of peak hour seats by United Airlines for two daily roundtrips
to Chicago O’Hare. Peak hour departing seats occur between 5:31 a.m. and 6:30 a.m., while peak hour
arriving seats occur between 3:49 p.m. and 4:50 p.m.

Chapter 4 – Facility Requirements
July 2016 Page 4-45
Table 4-24: Peak Hour Arriving and Departing Seats
Source: Airline schedules from Diio Mi (October 2012), United Airlines January 2014 schedule to Chicago O’Hare
Mead & Hunt, Inc. (2013)
The current and projected number of average day and busy day passengers based upon the percentage
of daily seats occurring in the peak hours is presented in Table 4-25. The peak hour projections presented
in the table are based upon the current airline schedules peak hour, changes in airline schedules, aircraft
types, and flight times can impact the peak hour passengers. The average day peak hour passengers is
based upon the current and projected annual average load factor, while the busy day peak hour passengers
is based upon 100 percent of the seats being filled. It should be noted that some passenger processing
components of the terminal building can operate at a lower level of service beyond their typical capacity,
Time of Day Number of Seats Total Daily Seats
Percent of Day in
Peak Hour (PH)
Existing Flight Schedule
Peak Hour Departing Seats (Enplanements)
05:31 to 06:30 137 609 22.5%
Peak Hour Arriving Seats (Deplanements)
15:49 to 16:50 137 609 22.5%
Peak Total Passengers
15:49 to 16:50 150 1,218 12.3%
Existing Flight Schedule with UA Chicago O'Hare Service Included
Peak Hour Departing Seats (Enplanements)
05:31 to 06:30 187 709 26.4%
Peak Hour Arriving Seats (Deplanements)
15:49 to 16:50 150 709 21.2%
Peak Total Passengers
15:49 to 16:50 250 1,218 12.3%
Source: Airline Schedules from Diio Mi (Oct 2012), plus UA O'Hare service schedule (beginning Jan 2014)
Mead & Hunt, Inc.
0
50
100
150
200
250
0:00 2:00 4:00 6:00 8:00 10:00 12:00 14:00 16:00 18:00 20:00 22:00 0:00
Seat
s
Time
Total Seats
Seats arriving in past 60 min
Seats departing in next 60
min

Chapter 4 – Facility Requirements
Page 4-46 July 2016
such as a departure lounge where more people will be required to stand and less space per person is
available. Other facilities, however, such as passenger or baggage screening, need adequate throughput
capacity to meet the peak hour demand or significant delays will be experienced. Therefore, both average
day and busy day peak hour passengers should be considered in the assessment of the existing terminal
building’s capacity.
Table 4-25: Projected Peak Hour Passengers (Scheduled Carriers)
Note: PMAD = Peak Month Average Day, LF = Load Factor
Source, Airline schedules from Diio Mi, October 2012 Schedule and Mead & Hunt, Inc. (2013)
The key passenger processing points within the existing terminal building were evaluated for various levels
of peak hour enplanements and deplanements to determine the level at which the capacity of the existing
terminal buildings facilities were exceeded. This analysis utilized FAA ACs and spreadsheet queue models
and guidance associated with Airport Cooperative Research Program (ACRP) Report 25, Airport
Passenger Terminal Planning and Design. Table 4-26 summarizes the results of this analysis depicting
increasing peak hour enplanement levels. The table also correlates peak hour enplanement levels to peak
hour deplanement levels and annual enplanement levels based upon the current peaking characteristics.
The facilities required to process or accommodate each peak hour enplanement level is summarized with
the capacity of existing facilities exceeding anticipated demand highlighted in orange.
Scheduled
Annual PMAD Dep
Year Enplanements Seats Departing Arriving LF Enpl Depl LF Enpl Depl
Current 134,452 609 137 137 68.7% 94 94 100.0% 137 137
Projected: 26.4% 21.2%
2014 164,038 709 187 150 72.0% 135 108 100.0% 187 150
2017 172,000 743 196 157 74.0% 145 116 100.0% 196 157
2022 186,137 805 212 170 75.0% 159 128 100.0% 212 170
2027 201,437 871 230 184 76.0% 175 140 100.0% 230 184
2032 217,994 942 249 199 78.0% 194 155 100.0% 249 199
Note: PMAD = Peak Month Average Day; LF = Load Factor
Source: Airline Schedules from Diio Mi, Sun, Oct 2012 Schedule
Mead & Hunt, Inc.
Peak Hour Seats Peak Hour Passengers Peak Hour Passengers
Busy DayAverage Day

Chapter 4 – Facility Requirements
July 2016 Page 4-47
Table 4-26: Terminal Facility Needs Summary
Note: Curbfront length requirement is twice enplanement/deplanement level as enplaning and deplaning curbs are combined at the
Airport.
Source: FAA Advisory Circulars, ACRP Report 25 – Airport Passenger Terminal Planning and Design
Prepared by: Mead & Hunt, Inc. (2013)
The projected number of busy day peak hour passengers in year 2032 is 249 enplanements and 199
deplanements. As shown above, the existing terminal facilities are projected to be adequate to meet this
level of peak hour passengers, with the exception of the departure lounge space, which will reach capacity
between 225 and 250 peak hour enplanements, at approximately 231 around the year 2027 given the
current passenger peaking characteristics. At the current ratio of busy day peak hour passengers to annual
enplanements, this level of peak hour activity correlates to approximately 202,000 annual enplanements,
providing a rough capacity approximation of the current terminal building as currently configured, and for
current passenger peaking characteristics.
As the departure lounge is the current constraining terminal component, it is worth noting that there is a
viewing lounge of approximately 890 square feet located adjacent to the holdroom. If this area were added
to the departure lounge, the departure lounge would total approximately 5,340 square feet and its capacity
would be increased to approximately 300 passengers. This size of departure lounge would then roughly
equal the capacities of the passenger and baggage screening areas. Note that the bag claim frontage
requirement is based upon the peak hour deplanement level, which is less than the peak hour enplanement
level. Incorporation of the viewing lounge into the departure lounge increases the terminal building’s
Tick
eting
Pos
itions
Bag S
creen
ing D
evice
s
Pass.
Securi
ty La
nes
Dep. L
oung
e (sf)
Bag C
laim Fron
tage (
ft)
Curbfr
ont L
ength
(ft)
12 1 2 4,450 108 510
Busy Day
Peak Hour
Enplanements
Busy Day
Peak Hour
Deplanements
Annual
Enplanements
137 110 120,178 3 1 1 2,900 44 134
150 120 131,581 4 1 1 3,100 48 142
175 140 153,511 4 1 2 3,500 56 166
200 160 175,442 5 1 2 3,800 64 192
225 180 197,372 5 1 2 4,200 72 216
250 201 219,302 6 1 2 4,600 80 240
275 221 241,232 7 1 2 4,900 88 264
300 241 263,163 7 2 2 5,300 96 286
325 261 285,093 8 2 3 5,700 104 294
350 281 307,023 8 2 3 6,000 112 334
375 301 328,953 9 2 3 6,400 120 358
400 321 350,883 9 2 3 6,800 128 376
Legend: Existing terminal facilties meet peak hour demand
Existing terminal facilities do not meet peak hour demand
Note: Curbfront length requirement is twice Enpl/Depl level as enplaning and deplaning curbs are
combined at UNV
Source: FAA Advisory Circulars
ACRP Report 25 - Airport Passenger Terminal Planning and Design
Prepared by: Mead & Hunt
Facilities Required
Existing Facilities =

Chapter 4 – Facility Requirements
Page 4-48 July 2016
capacity to 300 peak hour enplanements, which at current peaking characteristics, correlates to an annual
enplanement level of approximately 263,000 annual enplanements.
It should be noted that while the passenger processing capability of the terminal appears adequate to
accommodate approximately 230 peak hour departing passengers as currently configured and 300 peak
hour departing passengers with some holdroom expansion, there are still some areas that are not adequate
to meet demand. Concessions and restroom spaces within the holdroom are undersized and the size of
the baggage makeup area is less than typical industry standards for baggage makeup areas at similarly
sized airports. Additionally, any scheduled service by narrow body aircraft, which have much larger seating
capacities than the turboprops and regional jets that currently serve the Airport, could significantly increase
peak hour passengers, particularly if the schedule for these operations were to overlap with other existing
scheduled operations.
Therefore, the existing terminal building appears capable of meeting projected passenger needs at current
passenger peaking characteristics through the 20-year planning period with some modest reconfiguration,
particularly converting the viewing lounge into an addition to the secure departure lounge. However the
addition of a low-cost carrier, which typically operate narrow body aircraft with seating capacities of 150
seats or more with very high load factors, could not be accommodated during certain hours of the day within
the current terminal building’s facilities. Commercial operations with larger narrow body aircraft may need
to be scheduled outside of busy periods until new or expanded terminal facilities can be provided. The
Airport should continue to monitor peak hour seats, particularly as airline schedules and aircraft equipment
types change.
As the market has a strong potential for low-cost carrier service within the 20-year planning period, the
addition of this type of service combined with the projected growth in traditional air service has the potential
to exceed the capacity of the terminal building. Thus, the Airport should continue to plan for new terminal
facilities within the 20-year planning period. Land purchased by the CCAA to the north of Fox Hill Road
should continue to be preserved for the development of a new terminal area for when this need is realized.
4.8.c Landside Access Requirements
Landside vehicular access to the Airport was also reviewed as a part of the sustainable master planning
study. In addition to on-Airport roadways and traffic circulation, access to the Airport from major regional
traffic arteries was also evaluated to determine if roadway infrastructure improvements are needed.
Overall, the Airport is situated in relatively close proximity to Interstate 99 and its interchange with U.S.
Route 322, which are the primary roadways into and out of the State College community (Figure 4-9). The
Airport terminal is approximately 1.5 miles from this interchange; however, there are not currently any direct
connections from these major traffic arteries to the Airport. Traffic coming from any direction on these
limited access highways are required to either travel past the Airport to the nearest exit and back-track or
exit prior to the Airport and travel a circuitous route from the highway. It is recommended that the Airport
look at improved landside access from Interstate 99 and U.S. Route 322 while working with Centre County
and the local communities to identify and determine an improved access corridor.

Chapter 4 – Facility Requirements
July 2016 Page 4-49
Figure 4-9: Major Traffic Arteries near Airport
Source: Bing Maps (2012)
As illustrated in Figure 4-10, local traffic access is provided by Fox Hill Road, which runs along the north
side of the Airport’s property providing access to the majority of the airport’s facilities. Minute Man Road
provides access from Fox Hill Road to the National Guard complex located south of the Runway 6 runway
end. Terminal area traffic is circulated on the terminal loop road around the front public parking lot to the
front of the terminal building and back out to Fox Hill Road.

Chapter 4 – Facility Requirements
Page 4-50 July 2016
Figure 4-10: Landside Roadways in Proximity to Airport
Source: Bing Maps (2013)
The Pennsylvania Department of Transportation’s (PennDOT) Internet Traffic Monitoring (iTMS) web portal
provides traffic information and reports from PennDOT’s Bureau of Planning and Research (BPR). BPR is
responsible for capturing and analyzing traffic count data and reporting it to various agencies and the public.
The iTMS has three traffic reports available on the roadways providing the primary access to and from the
Airport:
• Site # 19796 – Fox Hill Road east of the intersection with Minute Man Road
o Average Daily Traffic (ADT) – 3,739
o Trucks – 75 (2 percent)
o Count year – 2010
• Site # 4921 – Fox Hill Road between Fillmore and Rock Roads, west of Alexander Drive
o ADT – 3,673
o Trucks – 87 (2 percent)
o Count year – 2013
• Site # 4922 - Rock Road, north of Fox Hill Road before Test Track Drive
o ADT – 2,273
o Trucks – 23 (1 percent)
o Count year – 2013

Chapter 4 – Facility Requirements
July 2016 Page 4-51
The Institute of Transportation Engineers (ITE) published a formula used to calculate the average level of
daily traffic associated with passengers arriving and departing from an airport. The formula, Y =
7.395(x)0.8526, is based on the number of average daily arriving and departing passengers (x) to calculate
the average level of daily traffic at an airport. Table 4-27 illustrates the projected level of ADT demand to
and from the Airport based on enplanement projections presented previously in this sustainable master
plan.
Table 4-27: Terminal Area Traffic Demand
Source: Airport Trip Generation, ITE Journal (May 1998), Volume 68, Page 26; Mead & Hunt, Inc. (2013)
As illustrated in the table, the average level of daily traffic from 2012 to 2032 is anticipated to increase
approximately 33 percent, which will affect traffic demand. The Highway Capacity Manual, Page 15-5,
states the capacity of a two-lane highway is 1,700 passenger cars per hour in one direction, with a limit of
3,200 passengers per hour for the total of the two directions. While this is a somewhat generalized
assumption that depends upon the speed limit and number of vehicles exiting and changing lanes on the
roadway, it provides a generalized maximum traffic volume to provide an acceptable level of service. Given
the current traffic volumes and the projected Airport traffic demands that are significantly below this
maximum optimal service threshold, Fox Hill Road, with two lanes (one lane of travel in each direction) is
adequate to accommodate traffic demands throughout the planning period.
Therefore, while Fox Hill Road somewhat constrains aviation development along the north side of the
Airport, it has adequate capacity to accommodate anticipated demands through the planning period.
However, as noted earlier it is recommended that the Airport look at improved landside access from the
interstate to the Airport.
Additionally, consideration should be given for an improved perimeter service road to provide enhanced
access for maintenance and emergency vehicles to remote areas of the Airport. Currently, an unimproved
service road constructed of loose gravel is located along the public side of the perimeter security fence
between Minute Man Road and Rock Road. The rough condition of this road requires vehicles to travel at
reduced speeds, which increases the emergency response time if incidents occur at remote areas of the
Airport. In addition, as a result of its unimproved state, the service road is often unable to be traversed
when deep snow and wet surface conditions are present. Construction of a paved perimeter service road
Average Daily Average Peak Hour
Annual Arriving and Departing Daily Traffic Demand
Year Enplanements Passengers Traffic 12.3%
2012 138,488 759 1,572 193
Projected:
2014 164,038 899 1,816 223
2017 172,000 942 1,891 233
2022 186,137 1,020 2,023 249
2027 201,437 1,104 2,164 266
2032 217,994 1,194 2,315 285
Source: Airport Trip Generation, ITE Journal (May 1998), Vol. 68, Page 26; Mead & Hunt, Inc.

Chapter 4 – Facility Requirements
Page 4-52 July 2016
would also provide improved landside access for Airport equipment to support any future development that
may occur at the southwest corner of the Airport.
4.8.d Terminal Area Vehicle Parking Requirements
The sustainable master plan project team conducted an assessment of vehicle parking at the Airport to
assess the needs for adequate, convenient parking throughout the planning period as enplanements and
facilities grow. In addition, an evaluation of employee parking and rental car ready/return parking needs
was conducted to determine if future expansion of these lots will be necessary. The basis of these analyses
involved benchmarking past and current relationships between parking demand and originating
enplanements to project future parking demand based on anticipated levels of enplanements.
Parking Capacity – There are currently 558 spaces available for public parking in the main front lot (388
spaces) and the west credit card lot (170 spaces). Employee parking is currently provided in the east
employee lot with 52 spaces. Rental car ready/return spaces are provided in a separate lot immediately
west of the terminal, which provide 86 spaces for the agencies operating on the Airport, while 190 spaces
are available remotely for the storage of vehicles off of Alexander Drive. Table 4-28 summarizes the current
parking capacity at the Airport.
Table 4-28: Terminal Area Parking Supply
Source: Centre County Airport Authority records (2013)
Public Parking Demand – Parking demand at an airport is normally expressed as a ratio of spaces
required per 1,000 annual originating enplanements. Like most systems, a parking system runs most
efficiently when it is at 85 percent to 95 percent capacity. The allowance of 5 percent to 15 percent of
spaces allows for the dynamics of cars moving into and out of spaces, reduces search time for a space,
and allows for a temporary loss of spaces due to parking lot maintenance activities, snow cover, or
unforeseen circumstances. Ideally, this cushion can also accommodate parking on days that are busier
than the average or typical day. On extremely busy days, the capacity of the parking lot should be capable
of meeting demand, but the cushion will be limited and parking space search times could be greater.
Parking Lot Spaces
Public Parking
Main - Front Lot 388
West Lot - Credit Card Lot 170
Subtotal Public Parking 558
Employee Parking
East Lot 52
Rental Car Parking
Ready/Return - West Lot 86
Remote Storage (Alexander Dr) 190
Subtotal Rental Cars 276
Terminal Area - Airport Total 886
Source: Airport Management

Chapter 4 – Facility Requirements
July 2016 Page 4-53
Therefore this parking analysis analyzes the peak parking days, so that the system is capable of
accommodating the peak parking needs, which then provides an allowance of 5 to 15 percent for average
days.
Overnight parking counts are provided to CCAA by their parking operator. However the peak parking
demand is typically around 9:00 a.m. after passengers have arrived at the airport and parked for the early
morning departure flights before inbound flights have begun arriving. For a few weeks in March of 2014
the CCAA performed 9:00 a.m. occupancy counts in addition to the 1:00 a.m. overnight occupancy counts.
Table 4-29 summarizes this relationship between the mid-morning parking occupancy and the overnight
parking occupancy.
Table 4-29: Relationship between Overnight and Mid-Morning Parking Occupancy
Source: Centre County Airport Authority records (2014)
As shown above, on average there is an increase in the parking occupancy of approximately 55 stalls, or
15 percent, for early morning departures before cars begin leaving the lot from the first arrival flights of the
day. Table 4-30 presents the parking occupancy counts for 2012, utilizing the overnight parking counts
provided by the parking operator and incorporating the additional morning parkers at 15% of overnight
demand to determine the mid-morning parking peak.
Overnight
Date Day of Week
Occupied Stalls
(1am)
Occupied Stalls
(9am)
Additional Stalls
Occupied
Percent Increase
from 1am Count
3/11/2014 Tue 453 509 56 12%
3/12/2014 Wed 471 521 50 11%
3/13/2014 Thu 460 509 49 11%
3/14/2014 Fri 381 406 25 7%
3/15/2014 Sat 294
3/16/2014 Sun 269
3/17/2014 Mon 289 357 68 24%
3/18/2014 Tue 349 413 64 18%
3/19/2014 Wed 376 431 55 15%
3/20/2014 Thu 371 436 65 18%
3/21/2014 Fri 385 427 42 11%
3/22/2014 Sat 320
3/23/2014 Sun 314
3/24/2014 Mon 289 364 75 26%
3/25/2014 Tue 334 397 63 19%
3/26/2014 Wed 368 432 64 17%
3/27/2014 Thu 389 434 45 12%
3/28/2014 Fri 380 432 52 14%
Average 55 15%
Mid-Morning Peak

Chapter 4 – Facility Requirements
Page 4-54 July 2016
Table 4-30: Historical Public Parking Lot Occupancy
Source: Centre County Airport Authority records
Examination of the estimated mid-morning parking peak, indicates that the demand ratio during peak
periods is 3.84 occupied parking stalls per 1,000 annual enplanements. The demand ratio is applied to the
forecast enplanements throughout the planning period as shown in Table 4-31. This calculation results in
a public parking deficit of 72 spaces in the near term with this deficit projected to grow to 279 spaces by
2032.
Table 4-31: Public Parking Demand Projections
Note: Parking capacity includes main front lot (388 spaces) and side credit card lot (170 spaces)
Source: Mead & Hunt, Inc. (2014)
It should be noted that the parking demand ratio can be measured with some precision for any particular
year as long as the proper data is collected. It is not a static number, however, although it has been treated
as such in the projections because the nature of airline passengers can change frequently over time due
to a number of factors. For example, if enplanements on low-cost carriers were to comprise a larger portion
of the increase in enplanements at the Airport, the parking demand may increase more quickly than
Month
2012
Enplanements
Overnight
Average
Overnight
Peak
Additional Morning
Parkers (15%)
Mid-Morning
Peak
Jan 10,063 281 385 58 443
Feb 10,983 325 449 67 516
Mar 11,745 336 449 67 516
Apr 11,303 297 369 55 424
May 11,915 298 395 59 454
Jun 11,293 304 396 59 455
Jul 10,443 247 327 49 376
Aug 11,436 256 317 48 365
Sep 11,175 309 422 63 485
Oct 12,133 335 429 64 493
Nov 11,501 298 389 58 447
Dec 10,462 227 349 52 401
Total 134,452
Maximum 336 449 67 516
Demand Ratio per 1,000 Annual Enplanements* 3.84
Occupied Parking Stalls
Scheduled Demand Ratio Projected
Annual per 1,000 Parking Parking Surplus/
Year Enplanements Enplanements Demand Capacity Deficiency
2012 134,452 3.84 516 558 42
Projected:
2014 164,038 3.84 630 558 (72)
2017 172,000 3.84 661 558 (103)
2022 186,137 3.84 715 558 (157)
2027 201,437 3.84 774 558 (216)
2032 217,994 3.84 837 558 (279)

Chapter 4 – Facility Requirements
July 2016 Page 4-55
enplanements due to the nature of these passengers and longer trip durations. Therefore, it is
recommended this calculation be checked each year to track trends and be adjusted accordingly to
changing patterns.
It should also be noted that the above calculation is quantitative, not qualitative; in other words, there may
be enough parking, but it may not provide the level of customer service desired by the Airport. In the future
consideration should be given to adjust parking rates, particularly on the most convenient parking in the
main front lot. The Airport may also want to consider the possibility of instituting a short-term parking lot for
the most convenient spaces as short-term parkers typically constitute two-thirds to three-quarters of all
customers. The rate for this lot could be increased due to the demand; however, segregation of some of
the stalls into a short-term lot would result in some loss of efficiency in terms of overall utilization of all the
public spaces.
Employee Parking Demand – Employees parking at the Airport include those from the CCAA, TSA, car
rental agencies, tenants, and airlines. These employees are generally assigned to the east employee lot
that has an approximate capacity of 52 spaces as estimated by CCAA officials with an approximate 15
unoccupied stalls available during a shift change. This utilization was used to estimate future employee
parking demand, as summarized in Table 4-32. A surplus of 15 spaces is anticipated to become a small
deficit of 8 spaces by the year 2032.
Table 4-32: Employee Parking Demand Projections
Source: Centre County Airport Authority, Mead & Hunt, Inc. (2013)
Rental Car Ready/Return and Storage Spaces – The rental car ready/return lot directly west of the
terminal contains 86 spaces. CCAA officials estimate that this lot is at capacity for current operations and
activity levels. This correlates to a demand ratio of 0.64 spaces needed per 1,000 annual enplanements.
As passenger traffic increases, it is anticipated that rental car transactions will increase at the same rate.
The demand ratio is applied to the forecast enplanements throughout the planning period as shown in
Table 4-33. This calculation results in a deficit of 19 spaces projected for 2014 with the deficit growing to
53 spaces by the year 2032.
Scheduled Demand Ratio Projected
Annual per 1,000 Parking Parking Surplus/
Year Enplanements Enplanements Demand Capacity Deficiency
2012 134,452 0.28 37 52 15
Projected:
2014 164,038 0.28 45 52 7
2017 172,000 0.28 47 52 5
2022 186,137 0.28 51 52 1
2027 201,437 0.28 55 52 (3)
2032 217,994 0.28 60 52 (8)
Source: Airport Management; Mead & Hunt

Chapter 4 – Facility Requirements
Page 4-56 July 2016
Table 4-33: Rental Car Parking Demand Projections
Source: Centre County Airport Authority, Mead & Hunt, Inc. (2013)
A remote rental car storage lot with 190 spaces is located across Fox Hill Road, west of the terminal,
adjacent to the intersection of Alexander Drive. Occupancy and demand for this lot fluctuates greatly as
rental fleets increase and decrease seasonally. CCAA officials estimate that during peak months this lot is
at about 70 percent occupancy. This correlates to a demand ratio of 0.99 spaces per 1,000 annual
enplanements. As illustrated in the table, the existing lot appears adequate to meet demand through 2022,
with a deficit of 26 spaces anticipated by 2032.
Overall, the rental car operation in the commercial airline terminal building is in need of expansion to provide
customers with an acceptable level of rental car service in the future. Office space and counter space in
the terminal are constrained and may need expansion in the future to meet customer service expectations.
The actual growth rate of rental car business compared to the passenger growth rate is contingent on the
traffic mix (business versus pleasure travel) and future expansion of the Airport service area. For example,
high levels of leisure passenger traffic would result in increased rentals, which also would affect the number
of spaces needed. Such phenomena could require expansion of the rental car ready/return lot on a
schedule different than originally planned. Other unknown factors can greatly influence the accuracy of
any current projections, such as rental car company mergers and technological or marketing innovations.
In any case, it is factual that expansion is needed and that passenger traffic growth projections indicate that
an expansion may be needed in the near future.
Parking Needs Summary – A summary of existing and projected parking capacity and demand throughout
the planning period is presented in Table 4-34. Review of the table indicates that parking deficits will
Scheduled Demand Ratio Projected
Annual per 1,000 Parking Parking Surplus/
Year Enplanements Enplanements Demand Capacity Deficiency
Rental Car Ready/Return Parking Demand Projections
2012 134,452 0.64 86 86 0
Projected:
2014 164,038 0.64 105 86 (19)
2017 172,000 0.64 110 86 (24)
2022 186,137 0.64 119 86 (33)
2027 201,437 0.64 129 86 (43)
2032 217,994 0.64 139 86 (53)
Rental Car Storage Parking Demand Projections
2012 134,452 0.99 133 190 57
Projected:
2014 164,038 0.99 162 190 28
2017 172,000 0.99 170 190 20
2022 186,137 0.99 184 190 6
2027 201,437 0.99 199 190 (9)
2032 217,994 0.99 216 190 (26)
Source: Airport Management; Mead & Hunt

Chapter 4 – Facility Requirements
July 2016 Page 4-57
develop quickly in 2014 for public parking and rental car ready/return parking as new air service begins.
Through the planning period, it is projected that the parking deficits will increase, with deficits also
experienced in the employee lot and the rental car storage lot as enplanements increase. The desired level
of customer service should be considered along with the number of spaces provided as plans are developed
for future parking facility needs.
Table 4-34: Parking Capacity/Demand Summary
Source: Centre County Airport Authority, Mead & Hunt, Inc. (2013)
4.9 General Aviation Facilities
GA operations by local and itinerant aircraft accounted for approximately 63 percent of all aircraft operations
in 2012; therefore, it is also important to consider GA facilities at the Airport with reviewing the adequacy of
existing infrastructure. Generally, the size and type of facilities needed to support GA activity is directly
proportional to the size and type of GA aircraft that operate at an airport. Other factors such as climate,
availability of developable land, and anticipated demand also guide facility planning when reviewing the
Scheduled Projected Parking Projected Parking
Annual Parking Parking Surplus / Parking Parking Surplus /
Year Enplanements Demand Supply (Deficit) Demand Supply (Deficit)
2012 134,452 516 558 42 37 52 15
Projected:
2014 164,038 630 558 (72) 45 52 7
2017 172,000 661 558 (103) 47 52 5
2022 186,137 715 558 (157) 51 52 1
2027 201,437 774 558 (216) 55 52 (3)
2032 217,994 837 558 (279) 60 52 (8)
2012 134,452 86 86 0 133 190 57
Projected:
2014 164,038 105 86 (19) 162 190 28
2017 172,000 110 86 (24) 170 190 20
2022 186,137 119 86 (33) 184 190 6
2027 201,437 129 86 (43) 199 190 (9)
2032 217,994 139 86 (53) 216 190 (26)
2012 134,452 772 886 114
Projected:
2014 164,038 942 886 (56)
2017 172,000 988 886 (102)
2022 186,137 1,069 886 (183)
2027 201,437 1,157 886 (271)
2032 217,994 1,252 886 (366)
Total Parking Demand
Public Parking Employee Parking
Rental Car Ready/Return Rental Car Storage

Chapter 4 – Facility Requirements
Page 4-58 July 2016
adequacy of GA infrastructure at an airport. The review of GA facilities focused on three components that
are presented in this section: the GA terminal building, services provided to GA users, and hangar space
at the Airport.
Though also utilized by commercial airline operators, this review of GA facilities also focused on the
adequacy of the fuel farm to meet fuel storage requirements as well as the air cargo facilities at the Airport.
Fuel storage capabilities of the fuel farm and its ability to meet the demand for fuel through the planning
period will also be discussed in this section as well as the capabilities of existing air cargo facilities to meet
the processing requirements of projected air cargo activity.
4.9.a General Aviation Terminal Building
The GA terminal building was constructed in 2002 and serves as the focal point for all GA activity at the
Airport. The terminal serves as the transfer point for pilots and passengers of GA flights, as well as provides
administrative offices for the Airport staff employed by Penn State and provides space for pilots to plan
flights and access weather information. The GA terminal building is also equipped with two conference
rooms, a large passenger waiting area, and a reception desk that also serves as the communication center
for GA line services. Providing approximately 6,000 square feet of area, the GA terminal was designed at
the time to provide adequate space to meet the long-term demands of public circulation, waiting area space,
administrative areas, flight planning/conference room space, and utility/storage areas. However, in recent
years, the building has been at capacity and needs additional office space to meet the administrative needs
of both the fixed base operator (FBO) service staff and airport administration personnel, who currently
shares office space with one another in the building. In addition, other improvements that are needed
include an airport administrative records room, office/kitchen supply space for the storage of bulk items,
and additional counter area space for the reception desk. It is recommended that planning be initiated to
expand the GA terminal building so that these needed areas are included to meet the demands of the
building’s users.
4.9.b Fixed Base Operator Services
FBO services are considered to be those that support GA activity, such as fueling, aircraft maintenance
and repair, and coordination of ground transportation for itinerant users. FBO services currently being
provided at the Airport include 100 low lead (LL) and Jet-A aviation fuels, aircraft maintenance and repair
services for single- and multi- engine aircraft, power plant maintenance and repair, and line service
personnel available to marshal taxiing aircraft and assist in other ground service aircraft needs. It should
be noted that the Airport places an emphasis on providing a high level of customer service when providing
FBO services to GA users at the Airport; as such, compliments are often received by both based and
itinerant users for the friendliness of Airport staff and the efficiency with which FBO requests are handled.
While it appears that the FBO services currently being provided at the Airport will meet the needs of based
and itinerant users throughout the planning period, it is recommended that the Airport continue to place a
focus on efficiency, quality, and courteousness when providing its FBO services to customers. It should be
noted that aircraft maintenance and power plant repair services occur in a 17,071-square-foot maintenance
hangar operated by Penn State. It appears the size of this hangar will be adequate for existing and
projected maintenance operations at the Airport, which is most often work performed on single-engine, twin-
engine, and small- to medium-sized jet aircraft.

Chapter 4 – Facility Requirements
July 2016 Page 4-59
4.9.c Hangars
In evaluating the capacity of existing hangars to meet future demand, it is assumed that all based aircraft
will desire hangar storage. Forecasts presented in Chapter 3 project the number of based aircraft by fleet
mix that can be anticipated at the Airport during the planning period. As summarized in Table 4-35, based
aircraft are anticipated to grow from a total of 59 aircraft in 2012 to 76 aircraft by 2032. This equates to 10
additional single-engine aircraft, three additional multi-engine aircraft, and three additional jets.
Table 4-35: Projections of Based Aircraft by Fleet Mix
Year Single Engine
Multi Engine
Small Business Jets
Mid-Sized Business Jets
Large Business Jets
Helicopters
2012 46 7 2 3 0 1
2017 47 8 3 4 0 1
2022 50 8 3 4 0 1
2027 52 9 3 4 1 1
2032 56 10 3 4 1 2
Source: Mead & Hunt, Inc. (2013)
Given the projected number of based aircraft by fleet mix that can be anticipated throughout the planning
period, the demand for box-style and t-style hangars by square feet can be projected. Table 4-36
summarizes the approximate parking area in square feet needed to park each type of aircraft fleet mix
classification. It should be noted that the amount of area required to park an aircraft varies based on the
size and type of aircraft; as such, planning ratios were used for each fleet mix classification as identified in
the table. The size approximations for each aircraft classification included a safety margin for wingtip, nose,
and tail clearances.
Table 4-36: Parking Area Sizes for Aircraft Fleet Mix Classifications
Aircraft Type Examples Approximate Square Feet
Single Engine Cessna 172, Cirrus SR-22 1,400 square feet
Multi Engine Piper Seneca, Beechcraft King Air 2,500 square feet
Small & Mid-Sized Jets Cessna Citation, Learjet 3,600 square feet
Large Business Jets Gulfstream G550, Global Express 10,000 square feet
Helicopter Sikorsky S-76, Bell 206 1,400 square feet
Source: Mead & Hunt, Inc. (2013)
Table 4-37 illustrates the total demand in square feet for hangar space by aircraft fleet mix classification
that can be anticipated at the Airport through 2032. As presented in the table, the total demand for hangar
space will grow by approximately 40 percent throughout the planning period with single-engine aircraft
requiring 78,400 square feet of hangar space followed by jets (35,200 square feet) and multi-engine aircraft
(25,000 square feet). It should be noted that the hangar space demand for single- and multi-engine aircraft
should be considered by square feet and the number of T-hangar units needed to house each aircraft.

Chapter 4 – Facility Requirements
Page 4-60 July 2016
Table 4-37: Projected Hangar Area Demand by Aircraft Fleet Mix Classification
Source: Mead & Hunt, Inc. (2013)
A summary of the existing hangar capacity at the Airport is presented in Table 4-38. As illustrated in the
table, a total of 131,057 square feet of hangar space is available to park based aircraft made available by
three box-style hangars structures with four units each that offer 55,490 square feet of space and seven T-
style hangar units offer 61 parking spaces for single- and multi-engine aircraft. It is important to note that
the 17,071-square-foot maintenance hangar operated by Penn State was not included in this calculation
since it is not intended to be used for the permanent parking of aircraft.
Aircraft Type 2012 2017 2022 2027 2032
Single Engine
Projected Based Aircraft 46 47 50 52 56
Approximate Area per Aircraft (sq. ft.) 1,400 1,400 1,400 1,400 1,400
Total Demand (sq. ft.) 64,400 65,800 70,000 72,800 78,400
Multi Engine
Projected Based Aircraft 7 8 8 9 10
Approximate Area per Aircraft (sq. ft.) 2,500 2,500 2,500 2,500 2,500
Total Demand (sq. ft.) 17,500 20,000 20,000 22,500 25,000
Small Jets
Projected Based Aircraft 2 3 3 3 3
Approximate Area per Aircraft (sq. ft.) 3,600 3,600 3,600 3,600 3,600
Total Demand (sq. ft.) 7,200 10,800 10,800 10,800 10,800
Mid-Sized Jets
Projected Based Aircraft 3 4 4 4 4
Approximate Area per Aircraft (sq. ft.) 3,600 3,600 3,600 3,600 3,600
Total Demand (sq. ft.) 10,800 14,400 14,400 14,400 14,400
Large Jets
Projected Based Aircraft 0 0 0 1 1
Approximate Area per Aircraft (sq. ft.) 10,000 10,000 10,000 10,000 10,000
Total Demand (sq. ft.) 0 0 0 10,000 10,000
Helicopters
Projected Based Aircraft 1 1 1 1 2
Approximate Area per Aircraft (sq. ft.) 1,400 1,400 1,400 1,400 1,400
Total Demand (sq. ft.) 1,400 1,400 1,400 1,400 2,800
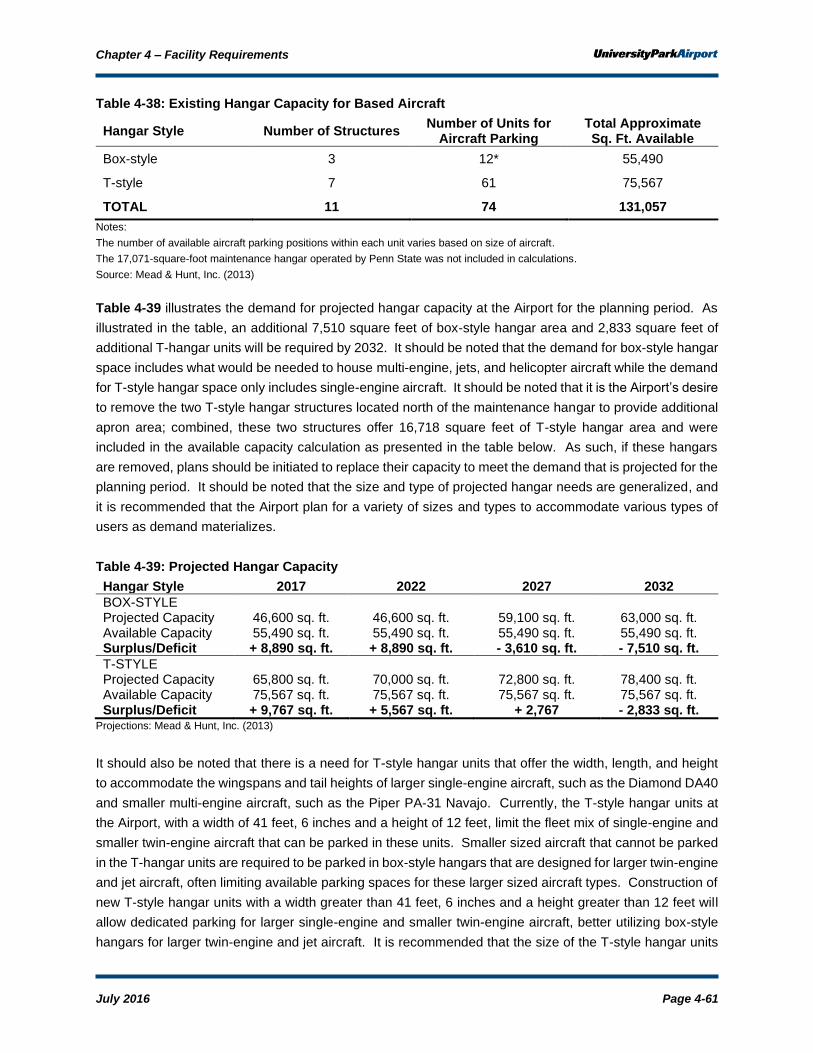
Chapter 4 – Facility Requirements
July 2016 Page 4-61
Table 4-38: Existing Hangar Capacity for Based Aircraft
Hangar Style Number of Structures Number of Units for
Aircraft Parking Total Approximate Sq. Ft. Available
Box-style 3 12* 55,490
T-style 7 61 75,567
TOTAL 11 74 131,057
Notes:
The number of available aircraft parking positions within each unit varies based on size of aircraft.
The 17,071-square-foot maintenance hangar operated by Penn State was not included in calculations.
Source: Mead & Hunt, Inc. (2013)
Table 4-39 illustrates the demand for projected hangar capacity at the Airport for the planning period. As
illustrated in the table, an additional 7,510 square feet of box-style hangar area and 2,833 square feet of
additional T-hangar units will be required by 2032. It should be noted that the demand for box-style hangar
space includes what would be needed to house multi-engine, jets, and helicopter aircraft while the demand
for T-style hangar space only includes single-engine aircraft. It should be noted that it is the Airport’s desire
to remove the two T-style hangar structures located north of the maintenance hangar to provide additional
apron area; combined, these two structures offer 16,718 square feet of T-style hangar area and were
included in the available capacity calculation as presented in the table below. As such, if these hangars
are removed, plans should be initiated to replace their capacity to meet the demand that is projected for the
planning period. It should be noted that the size and type of projected hangar needs are generalized, and
it is recommended that the Airport plan for a variety of sizes and types to accommodate various types of
users as demand materializes.
Table 4-39: Projected Hangar Capacity
Hangar Style 2017 2022 2027 2032
BOX-STYLE Projected Capacity 46,600 sq. ft. 46,600 sq. ft. 59,100 sq. ft. 63,000 sq. ft. Available Capacity 55,490 sq. ft. 55,490 sq. ft. 55,490 sq. ft. 55,490 sq. ft. Surplus/Deficit + 8,890 sq. ft. + 8,890 sq. ft. - 3,610 sq. ft. - 7,510 sq. ft.
T-STYLE Projected Capacity 65,800 sq. ft. 70,000 sq. ft. 72,800 sq. ft. 78,400 sq. ft. Available Capacity 75,567 sq. ft. 75,567 sq. ft. 75,567 sq. ft. 75,567 sq. ft. Surplus/Deficit + 9,767 sq. ft. + 5,567 sq. ft. + 2,767 - 2,833 sq. ft.
Projections: Mead & Hunt, Inc. (2013)
It should also be noted that there is a need for T-style hangar units that offer the width, length, and height
to accommodate the wingspans and tail heights of larger single-engine aircraft, such as the Diamond DA40
and smaller multi-engine aircraft, such as the Piper PA-31 Navajo. Currently, the T-style hangar units at
the Airport, with a width of 41 feet, 6 inches and a height of 12 feet, limit the fleet mix of single-engine and
smaller twin-engine aircraft that can be parked in these units. Smaller sized aircraft that cannot be parked
in the T-hangar units are required to be parked in box-style hangars that are designed for larger twin-engine
and jet aircraft, often limiting available parking spaces for these larger sized aircraft types. Construction of
new T-style hangar units with a width greater than 41 feet, 6 inches and a height greater than 12 feet will
allow dedicated parking for larger single-engine and smaller twin-engine aircraft, better utilizing box-style
hangars for larger twin-engine and jet aircraft. It is recommended that the size of the T-style hangar units

Chapter 4 – Facility Requirements
Page 4-62 July 2016
as a part of any hangar expansion project at the Airport include larger sized hangars to accommodate most
single-engine and small twin-engine aircraft.
4.9.d Aircraft Fuel Storage Facilities
There are two aircraft fuel storage facilities at the Airport. The main fuel farm, located north of the deicing
apron, is comprised of three (3) 15,000-gallon Jet-A fuel tanks, one (1) 12,000-gallon 100LL tank, one (1)
1,000-gallon diesel fuel tank, and one (1) 1,000-gallon automobile gasoline tank. The other fuel storage
facility is a single 1,000-gallon 100LL tank located with a self-serve pump adjacent to the T-hangar area.
Combined, these facilities offer the Airport the capability to store 45,000 gallons of Jet-A and 13,000 gallons
of 100LL aviation fuel.
To evaluate the aircraft fuel storage requirements of the Airport throughout the planning period, it is first
important to review the historical sale of fuel to establish a baseline of demand. Table 4-40 illustrates the
annual fuel sales at the Airport from 2010 to 2012. As illustrated in the table, an average of 1,244,078
gallons of Jet-A fuel and 77,462.3 gallons of 100LL fuel have been sold between 2010 and 2012.
Table 4-40: Fuel Sales by Fiscal Year (2011-2013)
Year Airline
Jet-A Sales (in gallons)
General Aviation Jet-A Sales (in gallons)
100LL Sales (in gallons)
TOTAL SALES (in gallons)
2010 857,093 417,896 83,458.6 1,358,448
2011 862,318 421,443 76,133.9 1,359,895
2012 838,205 335,278 72,794.3 1,246,277
’10-’12 Average 852,539 391,539 77,462.3 1,321,540
Source: Airport administration records (2013)
Next, the fuel storage turnover rate, or the rate at which the fuel tanks at the Airport need to be refilled to
meet demand, must be calculated. This rate can be calculated by dividing the annual sale of fuel by the
number of days in a year to find the average daily fuel sales. The total fuel storage capacity at the Airport
is then divided by the average daily fuel sales to determine the average fuel storage turnover rate. Table
4-41 presents the findings of the historical fuel storage turnover rate for Jet-A fuel while Table 4-42 presents
the historical fuel storage turnover rate for 100LL fuel.
Table 4-41: Historical Jet-A Fuel Storage Turnover Rate
Year Total Jet-A Sales
(in gallons)
Average Daily Fuel Sales (in gallons)
Total Jet-A Fuel Storage Capacity
(in gallons)
Average Fuel Storage Turnover
Rate
2010 1,274,989 3,493 45,000 12.9 days
2011 1,283,761 3,517 45,000 12.8 days
2012 1,173,483 3,206 45,000 14.0 days
’10-’12 Average 1,244,078 3,408 45,000 13.2 days
Source: Mead & Hunt, Inc. (2013)

Chapter 4 – Facility Requirements
July 2016 Page 4-63
Table 4-42: Historical 100LL Fuel Storage Turnover Rate
Year Total 100LL
Sales (in gallons)
Average Daily Fuel Sales (in gallons)
Total 100LL Fuel Storage Capacity
(in gallons)
Average Fuel Storage Turnover
Rate
2010 83,458.6 228.7 13,000 56.9 days
2011 76,133.9 208.6 13,000 62.3 days
2012 72,794.3 198.9 13,000 65.4 days
’10-’12 Average 77,462.3 212.0 13,000 61.5 days
Source: Mead & Hunt, Inc. (2013)
As illustrated, the storage capacity of existing fuel tanks at the Airport are capable of storing, on average,
a 13- day supply of Jet-A fuel and a 61 day supply of 100LL fuel. It should be noted that an increase in
operations of 70- to 90-seat regional jet aircraft and narrow body aircraft, such as the McDonnell Douglas
MD-80, Boeing 737, and Boeing 757, could increase fuel sales since these aircraft types require greater
amounts of fuel than existing commercial service types operating at the Airport. In addition, fuel sales could
also increase if longer range non-stop routes such as those to destinations in the Southeast and west of
the Mississippi River are implemented from the Airport. Increases in operations by larger aircraft and longer
range non-stop routes, as projected to occur during the planning period, will lower the fuel storage turnover
rate and thus may require an expansion of fuel storage facilities. It is recommended that planning be
initiated to prepare for an expansion of fuel storage facilities at the Airport as demand is realized throughout
the planning period with increased operations from 70- and 90- seat regional jets and narrow body aircraft.
4.9.e Air Cargo
The existing air cargo facility at the Airport is a 25,969-square-foot facility operated by FedEx that is used
as a distribution center to transfer packages between Central Pennsylvania and the FedEx air cargo facility
at the Pittsburgh International Airport. Currently, Cessna 208 Caravan aircraft, with occasional use of
Beechcraft BE-99 and Embraer EMB-110 turboprop aircraft, are used to transfer packages to and from
Pittsburgh International Airport. In 2012, a total of 1,445,060 pounds of air cargo was enplaned at the
Airport, with most of that amount processed through the FedEx facility. Given that the volume of air cargo
enplaned at the Airport is anticipated to increase 15 percent by 2032, it is important to review whether the
existing facility is adequate to meet the anticipated increase in demand.
While it appears the size of the air cargo facility at the Airport will be adequate to meet the freight processing
needs of air cargo activity at the Airport, consideration should be given to increase the size of the air cargo
apron so that an additional Cessna 208 Caravan aircraft can be parked simultaneously. The current size
of the air cargo apron is only capable of parking a maximum of two Cessna 208 Caravan aircraft, which are
utilized by Wiggins Aviation to provide FedEx air cargo services at the Airport. During the course of a year,
three to four Cessna 208 Caravan aircraft are used on a daily basis to transfer freight to and from the FedEx
facility at the Pittsburgh International Airport. Given that only two aircraft can be parked simultaneously on
the air cargo apron, the GA apron and the Airport-owned maintenance hangar are often utilized on a daily
basis to support air cargo processing at the Airport. Increasing the size of the air cargo apron would allow
aircraft parking, maintenance, and servicing activities to occur in a centralized location adjacent to the air
cargo facility, increasing efficiencies and reducing the use of the GA apron and Airport-owned maintenance

Chapter 4 – Facility Requirements
Page 4-64 July 2016
hangar. As such, it is recommended that the air cargo apron be expanded so that is it capable of
accommodating at least four Cessna 208 Caravan aircraft.
4.10 Support Facilities
Support facilities are considered to be those infrastructure elements necessary to support the operation
and maintenance of the Airport. A review of support facilities including the fire station, snow removal
equipment building, and airfield electrical vault and generator was conducted as a part of evaluating the
adequacy of existing infrastructure to meet future demand. This section reviews each support facility
element and discusses improvements that will be needed, if any, to meet anticipated demand.
4.10.a Aircraft Rescue and Firefighting Facility
As noted in the inventory chapter, the existing 3,400-square-foot aircraft rescue and firefighting (ARFF)
facility is limited in size and is inadequate to meet the vehicle and firefighting equipment storage needs of
the Airport. Built in 1987, the existing facility has outlived its expected useful life and is not capable of
housing newer generation ARFF vehicles that will need to be purchased to replace existing aging ARFF
vehicles. Likewise, support spaces in the facility for firefighting equipment storage, raw material storage,
and personnel areas are not adequate to meet the firefighting operational demands of the Airport. In
addition, the existing facility does not meet current building codes and Americans with Disabilities Act (ADA)
requirements. As such, it is recommended that planning be initiated for a new ARFF facility.
There are several items that should be considered when planning for a new ARFF facility, which are outlined
in FAA AC 150/5210-15A, Aircraft Rescue and Firefighting Station Building Design. The following
summarizes the design elements that should be considered as planning is initiated for a new ARFF facility.
It is important to note these elements are based on a review of the existing ARFF facility and its capability
to support the firefighting operations at the Airport as well as needs that were identified through discussions
with Airport officials.
• ARFF Index – It is anticipated that the ARFF Index at the Airport will remain at Index B throughout
the planning period based on the fleet mix of commercial aircraft types that are projected to operate
at the Airport. However, it should be noted that entry of a low cost carrier utilizing a narrow-body
aircraft greater than 126 feet in length and averaging five or more daily departures would increase
the ARFF Index at the Airport. Likewise, it should also be noted that charter operators utilizing
larger aircraft, such as the Boeing 737 and 757 may request that the Airport temporarily increase
its ARFF Index capabilities when these types are used to conduct charter flights. While it is
recommended that the ARFF facility be designed so that it is adequate to support ARFF Index B
operational requirements, it should also be capable of supporting ARFF Index C operational needs
should a need arise to have increased firefighting capacity at the Airport.
• ARFF Vehicles – A significant deficiency with the existing ARFF facility is that the vehicle bays are
not sized large enough to fit newer generation ARFF vehicles that the Airport will need to purchase
Chapter 4 – Facility Requirements
July 2016 Page 4-65
to replace outdated existing equipment. It is recommended that the vehicle bays of a new ARFF
facility be designed so that they are capable of housing at least two Oshkosh TI 1500 First
Generation-sized Striker vehicles. It is also recommended that each vehicle bay be equipped with
doors on each side of the facility so that ARFF apparatuses can be driven though the bays in a
single direction of travel. This will increase safety and reduce the potential for damage when these
vehicles are maneuvered into and out of the facility since large ARFF apparatuses often have many
blind spots. As mentioned in the previous discussion, consideration should also be given to have
vehicle bays sized so that they are capable of accommodating ARFF vehicles that meet Index C
requirements should this be an operational requirement needed in the future.
• Personnel Areas – Currently, line service crews and maintenance personnel are tasked with
performing ARFF functions at the Airport. While there are not full-time, dedicated firefighters staffed
at the Airport to perform ARFF functions, it is recommended that personnel support areas, such as
a break room, training room, locker area, snow desk/dispatching center, kitchen, and sleeping
areas be included in the design of a new facility. Incorporating these elements will allow the facility
to be able to accommodate full-time, dedicated firefighters if it is required in the future while
providing personnel support areas for existing staff members.
• Building Orientation – The orientation of the building should be such that responding emergency
vehicles have immediate, straight access to the airfield with unimpeded access routes that have a
minimum of turns. Access routes from the building should be such that crossing of taxiways,
aprons, and other areas of potential congestion, such as vehicle parking areas, aircraft fuel storage
areas, and service roads, are kept to a minimum. This is critical because of the need for a timely
and safe response route so that ARFF response requirements as identified in FAR Part 139 can
be maintained. In addition, it is desired that the building be oriented so that it has maximum
surveillance of the airfield to assist responding personnel in locating the scene of an emergency.
• Equipment and Raw Material Storage – In addition to having vehicle bays and personnel areas,
adequate storage area for equipment and raw material storage should be included in the design of
an ARFF facility. As identified in FAA AC 150/5210-15A, Aircraft Rescue and Firefighting Station
Building Design, storage areas should be planned to accommodate firefighting turnout gear, first
aid medical equipment, rescue tools, and self-contained breathing apparatuses (SCBA). Likewise
it is also important that an area be included in the design of the facility for the storage of raw material
firefighting agents such as chemicals and powders. This room needs to be large enough to store
and move several pallets as well as be equipped with a loading dock so that raw material deliveries
can be received in an efficient manner.
• Joint Use with Local Fire Departments – North of State College, firefighting response times are
greater since the nearest fire stations are located in Bellefonte, Pleasant Gap, and near Park Forest
Village in Patton Township; as such, there is a need for fire station north of State College to improve
response times in this area. Understanding that the Airport is in need of a new firefighting facility,
discussions have occurred in the past about constructing a joint-use firefighting facility on the
Airport that would serve both the ARFF and community firefighting functions. If a joint-use facility

Chapter 4 – Facility Requirements
Page 4-66 July 2016
to be utilized by the Airport and a community fire department were constructed, additional elements
should be considered in the building design. Additional vehicle bays such as those for a structural
firefighting fire truck and an emergency medical services (EMS) vehicle would also need to be
included. Likewise, the building would need landside access for community fire department
vehicles in addition to airside access for Airport ARFF apparatuses. Cost savings and efficiencies
could be realized through the construction of the building if support spaces, such as personnel
areas and equipment storage areas, were shared by both Airport ARFF staff members and the
firefighters of the community fire department.
It should be noted that there are financial, operational, and labor challenges associated with a joint-
use fire station. Financially, a portion of the facility would not be eligible for federal funding if it is
not used to support the operations of the Airport. Likewise, operational challenges exist with a
joint-use fire station as additional controlled access components may need to be incorporated into
the structure for it to meet TSA security requirements while also accommodating structural
firefighting operations. Finally, the sharing of facilities in a joint-use fire station may create labor
challenges with the unions representing workers of both Airport staff and community firefighters,
since dedicated personnel areas may be demanded for each. Though these challenges may be
experienced, cost savings, operational efficiencies, and improved fire service for both the Airport
and the surrounding community can be experienced with a joint-use fire station. It is recommended
that the Airport coordinate closely with the FAA and community fire agencies if it is desired to plan
for a joint-use ARFF facility.
In addition to these elements, other specific technical guidance identified in FAA AC 150/5210-15A, Aircraft
Rescue and Firefighting Station Building Design, as well as local building codes and other regulatory
compliance such as ADA requirements should also be considered as a part of the design for a new ARFF
facility.
4.10.b Snow Removal Equipment Facility
Similar to the ARFF facility, the existing Airport snow removal equipment (SRE) facility is limited in size and
does not provide sufficient space to park and maintain vehicles as well as provide adequate work areas for
Airport maintenance personnel. In particular, the vehicle bays of the SRE facility are inadequately sized to
park SRE vehicles that are required to position plow and broom attachments at an angle in order to
maneuver into and out of the building. Other inadequacies, such as the lack of an overhead crane, lack of
a pit or vehicle lift device to perform under vehicle maintenance, and limited personnel work areas, also are
factors that impact the efficiency of maintaining SRE equipment at the Airport. As such, planning should
be initiated for the construction of a new SRE facility at the Airport.
The most significant component of an SRE facility are the equipment bays, which should be adequately
sized to meet not only the dimensions of existing vehicles, but also larger next generation equipment that
the Airport may need to purchase during the planning period. Consideration should be given to size at least
one equipment bay large enough to accommodate a tandem plow/broom vehicle, which the Airport currently
does not have in its inventory, but could purchase during the planning period. Likewise, the equipment
bays should be oriented so that vehicles can drive through the facility in a single direction of travel to enter
Chapter 4 – Facility Requirements
July 2016 Page 4-67
and exit. In addition to size and orientation, there should be enough equipment bays so that all SRE
equipment can be stored and maintained in the SRE facility, something not currently available with the
existing facility. It is recommended that at least two of the bays be dedicated for vehicle maintenance with
at least one equipped with an overhead crane and another equipped for the washing of equipment.
In addition to the equipment bays, other features that should be considered in the design of an SRE facility
are personnel areas for SRE crews, such as a break room, training room, locker area, restrooms, and a
snow desk. In addition, personnel work areas such as tool benches, machine areas, parts storage areas,
and areas for lubrication materials, oils, and pneumatic systems should also be included in the design of
an SRE facility. FAA AC 150/5220-18A, Buildings for Storage and Maintenance of Airport Snow and Ice
Control Equipment and Materials, provides guidance that should be considered in the site selection and
design of buildings used to store and maintain airport snow and ice control equipment. In addition to this
guidance, other factors such as ADA requirements and local building codes should be considered in the
design and construction of a new SRE facility.
4.10.c Consolidated Aircraft Rescue and Firefighting/Snow Removal Equipment
Facility
It is interesting to note the similarities between the design elements that should be considered for both an
ARFF and SRE facility, most notably the personnel areas that are needed, such as locker rooms, tool
storage areas, and break rooms. Given that line service and maintenance staff at the Airport are
responsible for both ARFF and SRE duties, it is logical to consider planning for a consolidated ARFF/SRE
facility that provides a centralized location for the equipment associated with each operation. Consolidated
ARFF/SRE facilities are often a benefit for airports with similar staffing arrangements as many functionality,
operational, and cost efficiencies can be realized.
Most importantly, cost savings can be realized with a consolidated ARFF/SRE facility since construction
costs for a single building tend to be lower than for two separate buildings. Likewise, cost savings in heat,
ventilation, and air condition (HVAC) and energy usage can be realized with a single structure as compared
to maintaining and operating two separate buildings. Additional benefits include the ability to offer a
centralized location for staff to access both ARFF and SRE equipment, which will improve the efficiency in
which transfers can be made between performing SRE, maintenance, and line service functions and
responding to emergency situations. A consolidated ARFF/SRE facility also reduces the footprint
necessary for each facility, since some design elements would be shared that allow the most efficient use
of limited available land for other infrastructure development, such as hangars and aprons. Therefore, it is
recommended that the Airport consider planning to have a facility that can offer a centralized location for
the storage of both ARFF and SRE equipment to take advantage of the efficiencies that can be gained from
this type of infrastructure arrangement.
4.10.d Airfield Electrical Vault and Generator
The airfield electrical vault, which includes the generator and components such as transformers, lighting
panels, relays, and constant current regulators (CCRs) that are necessary to power lights, NAVAIDs, and
other electrical components on the airfield, was constructed in 2011. Since electrical components inside

Chapter 4 – Facility Requirements
Page 4-68 July 2016
the vault were also upgraded and installed at this time, it is not anticipated that improvements to the vault
or generator will be needed to meet the electrical demands of airfield components during the planning
period. It is important to note, however, the location of the airfield electrical vault and generator when
planning other future infrastructure development projects at the Airport, since this is the central hub for the
transfer of power to airfield electrical components. It is recommended that any future infrastructure
improvement projects at the Airport consider the location of the vault so that its relocation can be avoided
if possible.
4.10.e Collection, Treatment, and Disposal of Deicing Fluids
The application of deicing fluids on aircraft is a necessary and important flight preparation procedure during
the winter season to melt and prevent snow, ice, and frost from interfering with the aerodynamic surfaces
of an aircraft. However, the toxicity of deicing fluids is an environmental concern and care needs to be
taken in the collection, treatment, and disposal of deicing fluids to not adversely impact the water quality of
streams, rivers, lakes, and other bodies of water. Currently at the Airport, all aircraft deicing takes place on
the deicing apron where deicing fluid runoff is collected from drains and stored in tanks before being sent
to the Bellefonte Wastewater Treatment Plant. A wastewater contribution permit regulates the amount of
fluid per day that can be discharged into sanitary sewer for treatment at the wastewater treatment plant.
Though this method to collect, treat, and dispose of deicing fluids has generally been a cooperative
relationship between the Airport and the wastewater treatment plant, enforcement of the permit has been
strict with several challenges. In 2007, a malfunction in the deicing runoff discharge monitoring system
resulted in a temporary suspension of the wastewater contribution permit. More recently, the Airport was
billed a surcharge to discharge of excess quantities on two occasions in 2011. Given the challenges that
the Airport has experienced in recent years for the discharge of deicing fluid to the wastewater treatment
facility, it is recommended that the Airport review if other feasible options are available to collect, treat, and
dispose of waste deicing fluid. It is important to note that potential impacts to the Spring Creek Canyon
Conservation Overlay District should be a primary consideration when reviewing options for the treatment
of deicing fluid. Consideration should also be given as a part of this review for options that allow the Airport
to meet all regulatory requirements, limit environmental impacts, and be cost efficient so that it can be
administered with available staff levels and skill sets.
4.10.f Storm water Management
Currently, storm water and water quality requirements are addressed on a project by project basis at the
airport. This approach doesn’t consider the interrelationships between projects, and the economies that
might be gained through planning and designing storm water management components as interconnected
pieces of a basin-wide system.
Community concerns and regulatory requirements regarding storm water quantity and quality are changing
and becoming more stringent. The Spring Creek Canyon Conservation Overlay District was adopted by
Benner Township in 2010 to implement land use and land development-related goals within the overlay
district and safeguard ecological and cultural resources from the impacts of human activity and
development. To adequately address these concerns regulatory requirements as part of a holistic system
it is recommended that the airport conduct a storm water master plan. This addresses the need for the

Chapter 4 – Facility Requirements
July 2016 Page 4-69
airport to take a systematic approach in analyzing long-term development and storm water and water quality
needs, and developing a facility-wide plan to address those needs in a sustainable way.
4.11 Airport Traffic Control Tower
The current ATCT at the Airport began operation on September 1, 2011, and is operated by Midwest ATC
who is contracted by the FAA to operate the tower through the Contract Tower Program. The ATCT was
constructed at the time to improve air traffic control safety in airspace surrounding the Airport since it was
the busiest airport in terms of passenger enplanements that did not have a control tower. Due to the recent
construction of the ATCT, it is not anticipated any improvements will be necessary to meet the air traffic
control demands of the Airport throughout the planning period.
It should be noted, however, that air traffic controllers inside the ATCT are restricted to line-of-sight, or
visual means of providing separation advisories to aircraft operating within the Class D airspace that
surrounds the Airport. While radar services are not anticipated to be provided by the ATCT, installation of
the radar unit display would improve the ability of air traffic controllers to identify aircraft locations,
particularly during times when visibility is limited as when inclement weather or nighttime conditions are
present. This is typically provided in a VFR ATCT through a display of radar information from the closest
Terminal Radar Approach Control Facilities (TRACON) radars or Air Route Traffic Control Center (ARTCC)
radars. The airport should continue to pursue the installation of a radar display for the ATCT. While a radar
display of this type would provide radar information to the Airport air traffic controllers to enhance their
location information of aircraft, at the Airport, radar coverage from current FAA radar installations does not
provide coverage below approximately 1,000 feet above ground level (AGL). To provide optimal
surveillance information of aircraft below 1,000 feet AGL will likely require either the installation of an Airport
Surveillance Radar (ASR) at or near the Airport or for FAA NextGen initiatives to advance to provide location
information on aircraft through some other means such as GPS and Automatic Dependent Surveillance-
Broadcast (ADS-B) systems. The airport should continue to pursue additional surveillance information and
capabilities for the ATCT.
4.12 Summary
Planning and investment made to improve infrastructure facilities at the Airport will allow it to meet the air
transportation demands of central Pennsylvania for the next 20 years. A review of existing infrastructure
at the Airport and its ability to accommodate anticipated demand has identified a few areas that should be
the focus of future facility planning and development, which are presented in the following summary:
• Demand/Capacity Analysis – The capacity of the airfield appears adequate to meet the projected
volume of air traffic that is anticipated throughout the planning period.
• Wind Coverage – The orientation of Runway 6/24 provides 94.38 percent coverage in a 10.5 knot
crosswind during all weather conditions, which is less than the 95 percent coverage that is

Chapter 4 – Facility Requirements
Page 4-70 July 2016
recommended by the FAA. However, justification can be made that the orientation of Runway 6/24
provides adequate wind coverage given the environmental challenges and impacts to other
infrastructure development plans at the Airport if a crosswind runway were constructed.
• RDC – It is recommended that Runway 6/24 be maintained to meet the design standards of RDC
category C-III aircraft. However, it is important to consider that the Airport receives a small number
of operations each year by larger RDC category C-III and D-IV aircraft. Though the frequency of
operations by larger RDC category C-III and D-IV aircraft does not yet require a change in the
design standards of the runway, it is recommended that planning be initiated to protect for the
design standards that are associated with these larger aircraft types.
• TDG – It is recommended that the taxiway system at the Airport be maintained to meet TDG-3
standards; however, given that the Airport receives a small number of operations each year by
larger TDG-4 aircraft, it is recommended that planning be initiated to protect for TDG-4 standards.
• Runway Length – It is anticipated that Runway 6/24 will need to be extended 800 feet to a length
of 7,501 feet to meet the runway takeoff distance requirements of commercial airline and GA aircraft
that use the Airport. Planning should also be initiated to preserve an additional 800-foot extension
of the runway for an ultimate length of 8,201 feet should non-stop service to destinations west of
the Mississippi River or to the Florida peninsula be initiated by some aircraft types.
• Runway Width – Though not a requirement for runways designed for RDC category C-III aircraft,
the inclusion of paved shoulders is recommended during the next major runway rehabilitation
project. In addition, the full width of the runway should be grooved as a part of the next runway
pavement rehabilitation project.
• Runway Grade – A review of the longitudinal grade of Runway 6/24 found that the grade changes
fall within allowable tolerances as defined by FAA Advisory Circular 150/5300-13A, Airport Design.
However, line-of-sight standards are not met and should be evaluated during the design of the next
major runway pavement rehabilitation project.
• Runway Pavement Strength – It is recommended that the GA apron, Taxiway A, and Taxiway F
be considered for pavement rehabilitation in the near future to improve the strength integrity of
these pavements. Preventative maintenance is also recommended for all pavement surfaces to
preserve and improve the condition of the pavements.
• RSA – The location of the localizer antenna for Runway 24 is located within the RSA at the
approach end of Runway 6; though the responsibility of the Technical Operations Services unit
within the Air Traffic Organization office of the FAA, it is important to consider that relocation of the
localizer may be necessary as a part of any future infrastructure improvement projects at the
Airport.

Chapter 4 – Facility Requirements
July 2016 Page 4-71
• ROFA – The glide slope antenna for Runway 24 and the Airport’s weather reporting equipment are
each located within the ROFA near the approach end of Runway 24. While these objects are
allowed to protrude from the edge of the RSA elevation within the ROFA, it is important to consider
that their relocation may be necessary when evaluating future airfield infrastructure improvement
projects at the Airport.
• OFZ – It is recommended that the dimensions of the inner-transitional OFZ be adjusted to
accommodate the wingspans of larger RDC category C-III aircraft such as the Boeing 737-900 that
occasionally conduct operations at the Airport.
• RPZ – The RPZs at each end of Runway 6/24 meet design standards identified in FAA Advisory
Circular 150/5300-13A, Airport Design. Changes to the dimensions and/or locations of the RPZs
will be necessary if Runway 6/24 is extended and/or if an instrument approach lower than ¾ mile
developed for Runway 6.
• FAR Part 77 Surfaces – It is recommended that trees penetrating the approach surface to Runway
24 be either pruned or removed. Also, the Airport should continue to work with state and local
governmental jurisdictions to control objects that may penetrate FAR Part 77 surfaces associated
with Runway 6/24. Any objects that are identified as penetrating these surfaces should be
removed, pruned in the case of vegetation, or illuminated with an obstruction light if it cannot be
removed or is fixed by function.
• Taxiway System – It is recommended that the Airport begin planning to improve Taxiway A to
meet TDG-4 standards since the Airport occasionally receives operations from these larger aircraft
types. Specific improvements that will be needed include:
o Construction of 20-foot wide paved shoulders
o Intersection fillets improvements to meet new standards identified in FAA Advisory Circular
150/5300-13A, Airport Design.
Likewise, should a TDG-4 aircraft also classified in ADG IV, such as the Boeing 757, become the
critical aircraft type, improvements would be needed to the width of the safety areas and OFAs. If
a TDG-4 aircraft also classified in ADG III such as the MD-80 become the critical aircraft type, no
improvements would be necessary to the width of the safety area or OFA.
Other improvements to the taxiway system include:
o Correcting the longitudinal grade of Taxiway D so that it meets design standards for
taxiways intended to receive operations by AAC C and D aircraft.
o Relocating Taxiway C and Taxiway J so that direct access from to the runway is not
possible from apron surfaces.

Chapter 4 – Facility Requirements
Page 4-72 July 2016
o Consideration should be given to rename short connector taxiways between the runway
and parallel Taxiway A to match nomenclature (“A1,” “A2,” “A3,” etc.) that is preferred for
the naming of these surfaces by the FAA.
• Aprons – It is recommended that an additional 93,481 square feet of apron area be provided to
accommodate the increase in GA aircraft operations that is projected for the planning period. Also,
improvements are needed to reduce the maximum grade of the GA apron that exceeds design
standards for AAC C and D aircraft.
• Visual NAVAIDs – A MALSR approach lighting system is recommended for Runway 6. No
additional improvements are anticipated other than routine maintenance to visual NAVAIDs such
as the rotating beacon, wind indicators, segmented circle, approach lighting, and airfield markings.
• Electronic NAVAIDs – It is recommended that a precision instrument approach or equivalent
minimums be provided for Runway 6; in particular, improvements should be made to add an
approach lighting system such as a MALSR so that a GPS-based approach can be developed to
provide approach minimums equivalent to a Category I ILS with visibility minimums as low as ½
mile. In addition, installation of an RVR unit should be considered to provide an opportunity for
reduced visibility minimums.
While it does not appear feasible for the Airport to have a special authorization Category II approach
established using the ILS to Runway 24, the installation of runway guard lights, RVR equipment,
and the development of an SMGCS plan should be considered if lower than standard departure
minimums are requested by a FAR Part 121 or Part 135 commercial operator.
• AWOS – Consideration should be given to relocate the AWOS an additional 250 feet away from
the centerline of the threshold outside of the OFA to meet siting standards identified in FAA Order
6560.20B, Siting Criteria for Automated Weather Observing Systems. In addition, installation of an
RVR unit should be considered to improve the accuracy of visibility measurements at the Airport in
low visibility conditions.
• Commercial Airline Terminal Gates and Apron – The Airport should plan to expand the terminal
apron and gate configuration so that at least six aircraft parking positions can be made available
for the following fleet mix:
o One (1) 50-seat regional jet
o Four (4) 70- to 90- seat regional jets
o One (1) narrow body jet (such as the Boeing 737, Airbus A320, or McDonnell Douglas MD-
80 series of aircraft)
In addition, the installation of aircraft passenger boarding bridges that are capable of
accommodating 50- to 90-seat regional jets and narrow body aircraft should be considered for two
aircraft parking positions.

Chapter 4 – Facility Requirements
July 2016 Page 4-73
• Commercial Airline Terminal Building – While the existing commercial airline terminal building
appears capable of meeting projected passenger needs through the planning period,
reconfigurations of the secure passenger waiting area and rental car service counters to provide
additional space is recommended. The Airport should continue to plan for the development of a
new terminal facility, however, should demand exceed the capacity of a reconfigured existing
terminal facility in the future.
• Landside Access – It is recommended that improved landside access to the Airport from Interstate
99 and U.S. Route 322 be considered to provide a more direct route from these major traffic
arteries.
• Terminal Area Vehicle Parking Requirements – Additional parking needs in the terminal area
are projected to be needed for public, rental car, and employee parking. Consideration should also
be given to the institution of a short-term parking lot to provide increased service and convenience
to customers who park at the Airport for a short period of time.
• GA Terminal Building – The GA terminal building is at capacity and needs additional office space
for airport administration offices and FBO line service personnel. Additionally, a records room,
office/kitchen supply room, and improved reception counter area is needed.
• FBO Services – It appears that the type and level of FBO services provided at the Airport will meet
the needs of GA users throughout the planning period; however, it is recommended that the Airport
continue to place a focus of efficiency, quality, and courteousness when providing these services
to customers.
• Hangars – It is projected that an additional box-style and T-style hangars will be needed to meet
the demand that is anticipated for the planning period. If any existing box-style of T-style hangars
are removed it is recommended that planning be initiated to replace any lost capacity to meet
projected demand. Also, T-style hangar units with a door size greater than 42 feet in width and 12
feet in height are needed so that larger single-engine and small twin-engine aircraft can be parked
in these units.
• Aircraft Fuel Storage Facilities – Aircraft fuel storage capacity at the Airport is capable of storing,
on average, a 13-day supply of Jet-A fuel and a 61-day supply of 100LL fuel. Additional fuel storage
capacity may be needed if operations of 70- to 90-seat regional jets and narrow body aircraft such
as the McDonnell Douglas MD-80, Boeing 737, and Boeing 757 increase, since these types require
greater amounts of fuel than the existing commercial airline fleet serving the Airport. As such, it is
recommended the planning be initiated to expand the aircraft fuel storage facilities at the Airport for
when this demand in capacity is needed.
• Air Cargo Facilities – Planning should be initiated to increase the size of the air cargo apron so
that at least four Cessna 208 aircraft can be serviced simultaneously during freight transfer
operations. An increased air cargo apron will also provide a more centralized location for FedEx

Chapter 4 – Facility Requirements
Page 4-74 July 2016
air cargo operations at the Airport and help reduce its use of the GA apron and the Airport-owned
maintenance hangar.
• ARFF Facility – The existing ARFF facility is limited in size, has limited personnel areas, and is
inadequate to meet the firefighting vehicle and equipment storage needs of the Airport. In addition,
the existing facility does not meet current building codes and ADA requirements; as such, it is
recommended that planning be initiated for a new ARFF Facility.
• SRE Facility – The existing Airport SRE facility is also limited in size and does not provide adequate
space to park and maintain vehicles. In addition, it is not equipped with an overhead crane, a pit
or vehicle lift device to perform under vehicle maintenance, or enough vehicle bays to store all
SRE. It is recommended that planning be initiated to construct a new SRE facility to address the
inadequacies of the existing facility.
• Consolidated ARFF / SRE Facility – Cost savings, both in construction and day-to-day operation,
can be realized if a consolidated facility is constructed to house both firefighting and SRE. A
centralized location for both firefighting and SRE also will increase the efficiency with which
firefighting, rescue, and snow removal tasks are completed since line service staff at the Airport
are trained to perform both functions. It is recommended that planning be initiated for the
construction of a consolidated ARFF / SRE facility to take advantage of efficiencies that can be
gained from this type of infrastructure arrangement.
• Airfield Electrical Vault and Generator – Improvements are not needed to the airfield electrical
vault and generator to meet the airfield power demands that can be anticipated during the planning
period. Any future improvement projects at the Airport should consider the location of the vault and
generator so that relocation of these units can be avoided due to the electrical infrastructure that is
associated with these components to distribute power to airfield components.
• Collection, Treatment, and Disposal of Deicing Fluids – It is recommended that the Airport
review if other feasible options are available to collect, treat, and dispose of waste deicing fluid.
• Storm water master plan – It is recommended that the Airport prepare a storm water master plan to provide a systematic approach in analyzing long-term development and storm water and water
quality needs, and developing a facility-wide plan to address those needs in a sustainable way.
• ATCT – The airport should continue to pursue additional radar or other types of surveillance
information and capabilities for the ATCT.