Environmental Health Chapter 3 Lesson 3.3 Biodiversity and Environmental Health.

228
pChapter 4Environmental Health

4 | Environmental Health
230
Health of Boston 2016-2017
229
Environmental HealthAs stated by the Centers for Disease Control and Prevention, “The environment is everything around us -
the air we breathe, the water we drink and use, and the food we consume. It’s also the chemicals, radiation,
microbes, and physical forces with which we come into contact. Our interactions with the environment are
complex and are not always healthy” (1). The World Health Organization describes environmental health as
addressing all the physical, chemical, and biological factors external to a person, and all the related factors
impacting behaviors. The field of environmental health prioritizes assessment and control of environmental
factors that can harm health, with the goal of preventing disease and creating healthy environments in both
indoor (e.g. commercial buildings, workplaces, schools, and homes) and outdoor settings (2). Maintaining a
healthy environment increases quality of life and years of healthy life. It has been estimated that globally 24%
of the disease burden and 23% of premature mortality is attributable to environmental factors (3).
Environmental health is closely related to health equity. Individuals with low incomes are more likely to live
in areas with higher air pollution and toxic chemicals in their paint and water. For example, hazardous waste
landfills are more often built in low-income communities and communities of color (4, 5). Social inequalities
also result in unequal impact of environmental exposures, as disadvantaged communities generally experience
less access to resources (e.g. nutritious foods and quality medical care) that might otherwise reduce the
negative effects of environmental hazards (6).
In this section of the report, we will present and summarize exposure and health-related indicators relevant to
outdoor air quality, indoor environmental quality, and climate change.
Outdoor air quality and healthOutdoor air pollution is a leading contributor to death, and is estimated to have contributed to 4.2 million
premature deaths globally in 2015 (7). Outdoor air pollution is a complex mixture of thousands of components,
which differ in health impact and toxicity. The national Clean Air Act requires that the United States
Environmental Protection Agency (EPA) maintain and enforce standards that will protect the entire population
against adverse health effects associated with six Criteria Air Pollutants: carbon monoxide, lead, ground-level
ozone (O3), nitrogen dioxide (NO2), particulate matter (PM), and sulfur dioxide (SO2) (8).
There are primary and secondary standards for these Criteria Air Pollutants. Primary standards provide public
health protection, including protecting the health of “sensitive” populations, such as individuals with asthma
and other respiratory/cardiac illnesses, children, and the elderly.

4 | Environmental Health
230
Environmental HealthAs stated by the Centers for Disease Control and Prevention, “The environment is everything around us -
the air we breathe, the water we drink and use, and the food we consume. It’s also the chemicals, radiation,
microbes, and physical forces with which we come into contact. Our interactions with the environment are
complex and are not always healthy” (1). The World Health Organization describes environmental health as
addressing all the physical, chemical, and biological factors external to a person, and all the related factors
impacting behaviors. The field of environmental health prioritizes assessment and control of environmental
factors that can harm health, with the goal of preventing disease and creating healthy environments in both
indoor (e.g. commercial buildings, workplaces, schools, and homes) and outdoor settings (2). Maintaining a
healthy environment increases quality of life and years of healthy life. It has been estimated that globally 24%
of the disease burden and 23% of premature mortality is attributable to environmental factors (3).
Environmental health is closely related to health equity. Individuals with low incomes are more likely to live
in areas with higher air pollution and toxic chemicals in their paint and water. For example, hazardous waste
landfills are more often built in low-income communities and communities of color (4, 5). Social inequalities
also result in unequal impact of environmental exposures, as disadvantaged communities generally experience
less access to resources (e.g. nutritious foods and quality medical care) that might otherwise reduce the
negative effects of environmental hazards (6).
In this section of the report, we will present and summarize exposure and health-related indicators relevant to
outdoor air quality, indoor environmental quality, and climate change.
Outdoor air quality and healthOutdoor air pollution is a leading contributor to death, and is estimated to have contributed to 4.2 million
premature deaths globally in 2015 (7). Outdoor air pollution is a complex mixture of thousands of components,
which differ in health impact and toxicity. The national Clean Air Act requires that the United States
Environmental Protection Agency (EPA) maintain and enforce standards that will protect the entire population
against adverse health effects associated with six Criteria Air Pollutants: carbon monoxide, lead, ground-level
ozone (O3), nitrogen dioxide (NO2), particulate matter (PM), and sulfur dioxide (SO2) (8).
There are primary and secondary standards for these Criteria Air Pollutants. Primary standards provide public
health protection, including protecting the health of “sensitive” populations, such as individuals with asthma
and other respiratory/cardiac illnesses, children, and the elderly.

Health of Boston 2016-2017
231
Secondary standards provide public welfare
protection, including protection against decreased
visibility and damage to animals, crops, vegetation,
and buildings (8). The Massachusetts Department
of Environmental Protection (MassDEP) is the
state agency responsible for monitoring outdoor
air quality in Massachusetts and developing plans
and regulatory programs to reduce emissions
of pollutants that adversely affect public health,
welfare, and the environment. MassDEP submits all
ambient air quality data to the National Air Quality
System database that is administered by the EPA (9).
Particulate matter less than or equal to 5 microns in diameter (PM2.5)Outdoor particulate matter (PM) consists of particles
that are in the air, such as dust, pollen, dirt, soot and
smoke, and little drops of liquid. Some particles,
like soot or smoke, are large or dark enough to be
seen. Other particles are so small that you cannot
see them (10). The major subtypes of outdoor PM
include inhalable particles, which includes particles
with diameters 10 micrometers and smaller (PM10),
and fine inhalable particles with diameters that are
generally 2.5 micrometers and smaller (PM2.5) (11). By
comparison, a human hair is 50 micrometers across
or larger. A variety of sources directly or indirectly
contribute to outdoor PM, some of which include
coal fires, power plants, wood stoves, forest fires,
motor vehicles, factories, and construction sites.
Outdoor PM can be a problem at different times of
the year, depending on where you live (12).
Short-term exposure (averaged over preceding
hours or days) to elevated outdoor PM levels is a
known risk factor for mortality and morbidity related
to cardiovascular (e.g. heart attack, stroke)
and respiratory (e.g. asthma, chronic obstructive
pulmonary disease (COPD)) diseases (13-15).
Studies have also shown that long-term exposure
(averaged over the previous year or longer) to low-
levels of PM2.5 is associated with development of
cardiovascular disease and associated risk factors
(e.g. hypertension, diabetes), COPD, and lung
cancer (13-15).
Nitrogen dioxide (NO2)Major sources of outdoor nitrogen dioxide (NO2) are
motorized road traffic, power generation, industrial
sources, and residential heating (9). Breathing air
with a high concentration of NO2 can irritate airways
in the human respiratory system. Such exposures
over short periods can aggravate cardiovascular and
respiratory diseases, particularly asthma, leading to
respiratory symptoms (such as coughing, wheezing
or difficulty breathing), hospital admissions, and
visits to emergency rooms (16). Studies have shown
that long-term exposure to NO2 may contribute
to the development of chronic diseases, including
cardiovascular disease and associated risk factors,
and lung cancer (17, 18).
Ground-level ozoneOzone is a gas that you cannot see or smell. It
occurs naturally in the sky about 10 to 30 miles
above the earth’s surface. Sometimes, this ozone is
called “good ozone” because it forms a layer that
protects life on earth from the sun’s harmful rays (19).
Ground-level ozone, on the other hand, is a harmful
air pollutant and in this section of the report,
“ozone” will refer to ground-level ozone. Ground-
level ozone is the main ingredient of “smog” and
is created by chemical reactions between oxides of
nitrogen and volatile organic compounds.

4 | Environmental Health
232
This happens when pollutants emitted by cars, power plants, industrial boilers, refineries, chemical plants, and
other sources chemically react in the presence of sunlight (19). Ozone levels are highest during the warmest,
high-intensity sunlight hours of the day, often showing a broad peak between noon and 9 p.m. when many
people are outdoors, resulting in significant human exposure (17).
Ozone is a respiratory irritant, and breathing ozone can result in a number of health effects that are observed
in broad segments of the population, including the induction of respiratory symptoms, reduction in lung
function, and inflammation of the airways (20). Studies have consistently shown that higher levels of ozone are
associated with premature mortality (21-23). Individuals who are at higher risk from breathing ozone include
those who spend most of their time outdoors (e.g. outdoor workers), children and adolescents, the elderly,
people with existing lung diseases, such as asthma and COPD, and people with cardiovascular disease (24).
In this section, we will summarize PM2.5, NO2, and ozone pollution monitoring data for Boston. These are the
pollutants for which there is strongest epidemiological evidence of increased mortality risk (17).
Health of Boston 2016-2017
233
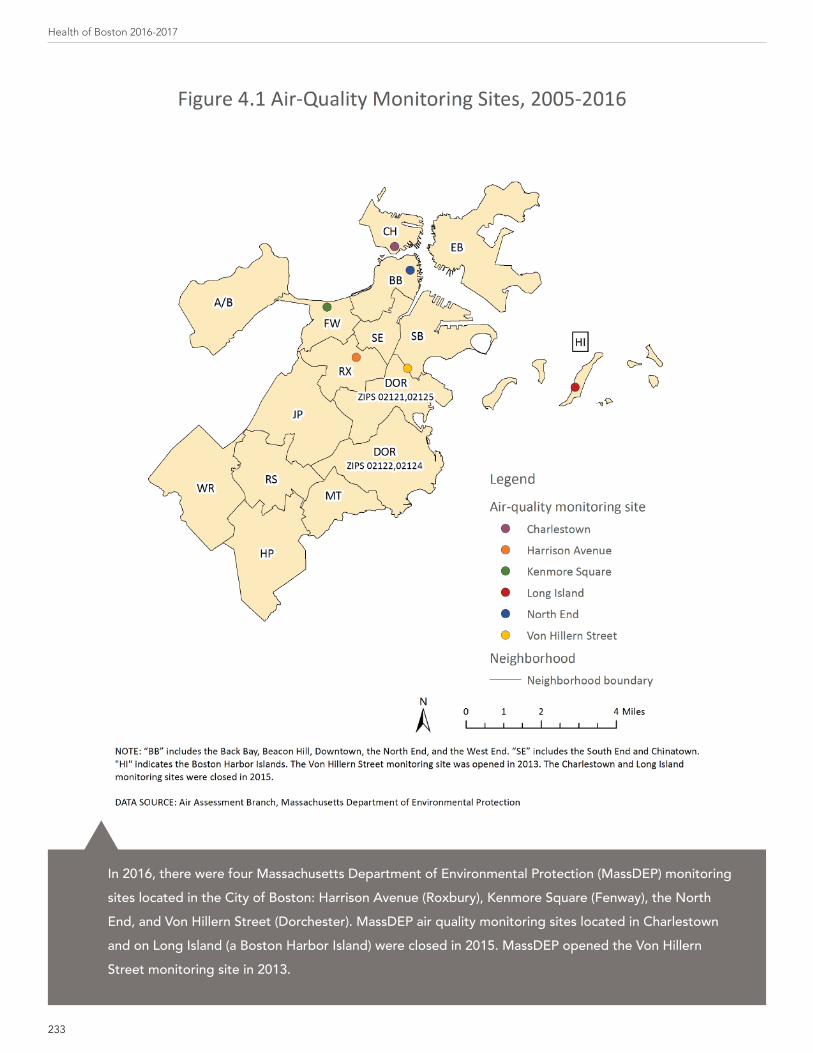
pIn 2016, there were four Massachusetts Department of Environmental Protection (MassDEP) monitoring sites located in the City of Boston: Harrison Avenue (Roxbury), Kenmore Square (Fenway), the North End, and Von Hillern Street (Dorchester). MassDEP air quality monitoring sites located in Charlestown and on Long Island (a Boston Harbor Island) were closed in 2015. MassDEP opened the Von Hillern Street monitoring site in 2013.

4 | Environmental Health
234
p
(1) The Massachusetts Department of Environmental Protection closed the Charlestown monitoring site in 2015. (2) The Massachusetts Department of Environmental Protection opened the Von Hillern Street (Dorchester) monitoring site in 2013.
DATA SOURCE: Air Assessment Branch, Massachusetts Department of Environmental Protection
The U.S. Environmental Protection Agency revised the primary (health-based) annual standard for particulate matter less than or equal to 2.5 microns in diameter (PM2.5) downward from 15 to 12 micrograms per cubic meter in December 2012. Monitoring data from the five Massachusetts Department of Environmental Protection (MassDEP) sites located in Boston between 2005 and 2015 indicates there were no years when the annual average PM2.5 concentration exceeded the primary annual standard. The annual PM2.5 concentrations measured from the four MassDEP monitoring sites in 2015 were well below the current standard of 12 micrograms per cubic meter. Additionally, there were no days at any of the MassDEP monitoring sites between 2005 and 2012 when the primary 24-hour PM2.5 standard was exceeded (data not shown).
p
(1) The Massachusetts Department of Environmental Protection closed the Long Island monitoring site in 2015. (2) The Massachusetts Department of Environmental Protection opened the Von Hillern Street (Dorchester) monitoring site in 2013.
DATA SOURCE: Air Assessment Branch, Massachusetts Department of Environmental Protection
The primary annual and 1-hour standards for nitrogen dioxide (NO2) set by the U.S. Environmental Protection Agency are 53 and 100 parts per billion, respectively. Monitoring data from the four Massachusetts Department of Environmental Protection (MassDEP) sites located in Boston between 2005 and 2015 indicates that there were no years when the annual average NO2 concentration exceeded the primary annual standard. Additionally, there were no days at any of the MassDEP monitoring sites between 2005 and 2012 when the primary 1-hour NO2 standard was exceeded (data not shown).

Health of Boston 2016-2017
235
p
1 The Massachusetts Department of Environmental Protection closed the Long Island monitoring site in 2015.
DATA SOURCE: Air Assessment Branch, Massachusetts Department of Environmental Protection
Between January 2005 and December 2014, there were a total of 14 days when the 70 parts per billion (ppb) 8-hour standard for ozone was exceeded at the Massachusetts Department of Environmental Protection (MassDEP) Long Island monitoring site. Between January 2005 and December 2015, there were a total of 3 days when the 70 ppb 8-hour standard for ozone was exceeded at the MassDEP Harrison Avenue monitoring site.

4 | Environmental Health
236
Indoor Environmental Quality and HealthIndoor environmental quality (IEQ) refers to the quality of a building’s environment (e.g. commercial buildings,
workplaces, schools, and homes) in relation to the health and well-being of those who occupy space within it
(25). There are many sources of indoor environmental pollution, many of which result in respiratory hazards.
These sources include (26):
• Excess moisture resulting in water damage and mold growth
• Lead contamination found in paint and tap drinking water
• Tobacco products
• Pest and rodent infestation
• Environmental stressors (e.g. improper lighting, noise, vibration, overcrowding)
• Building materials and furnishings (e.g. asbestos-containing insulation, newly installed flooring, cabinetry or
furniture made of certain pressed wood products, and lead paint)
• Fuel-burning combustion appliances (e.g. space heaters, ranges, ovens, stoves, furnaces, fireplaces, water
heaters, and clothes dryers)
• Central heating and cooling systems and humidification devices
• Products for household cleaning and maintenance, personal care, or hobbies
• Auto, truck, or bus exhaust from attached garages, nearby roads, or parking areas
Understanding the sources of indoor environmental contaminants and controlling them can often help prevent
symptoms or illness associated with the indoor environment. In this section of the report we will summarize
exposure and health-related indicators relevant to indoor environmental quality, including hazards/violations
for mold and asbestos, leaks and water stains in schools, asthma in school-aged children, secondhand tobacco
smoke exposure at home, carbon monoxide poisonings, lead in home tap water, and overcrowded housing.

Health of Boston 2016-2017
237
p
DATA SOURCE: Environmental and Occupational Health Division, Boston Public Health Commission
The Environmental and Occupational Health Division of the Boston Public Health Commission responds to requests from the public for inspections related to a broad range of potential environmental health hazards, including mold. The Environmental and Occupational Health Division addresses hazards in private residences, public buildings, workplaces, and outdoor spaces. If health hazards or violations of laws are found upon initial inspection, the responsible parties are required to take corrective action. The number of inquiries or complaints the Environmental and Occupational Health Division receives typically exceeds the number of hazards or violations identified upon initial inspection.
In 2016, of the initial inspections in response to an inquiry or complaint, 47 identified mold or chronic dampness-related indoor air quality issues. Of the 787 hazards/violations identified for mold from 2007 to 2016, 99% were for indoor air quality problems involving mold/chronic dampness and 1% were for mold in heating, ventilation, and air conditioning systems.

4 | Environmental Health
238
pFor 2012-2016, there were 432 hazards/violations identified for mold in Boston. The number of hazards/violations by neighborhood ranged from 9 in Charlestown to 59 in Dorchester (zip codes 02121, 02125).

Health of Boston 2016-2017
239
p
DATA SOURCE: Environmental and Occupational Health Division, Boston Public Health Commission
While it is not against the law to have asbestos in good condition present in a building, defective or damaged asbestos materials are a public health hazard, which must be either repaired or removed by a licensed contractor working under a permit. All asbestos removal or repair projects in Boston require a permit issued by the Environmental and Occupational Health Division of the Boston Public Health Commission. Roughly 1,200 such asbestos abatement permits are issued annually. The Division conducts investigations in response to public complaints/inquiries about potential asbestos hazards in public and private buildings, homes, and open spaces as well as random compliance checks of permitted asbestos removal work.
In 2016, 13 hazards/violations were identified by the Environmental and Occupational Health Division during an initial complaint inspection or compliance check of an active permitted asbestos abatement project. From 2007-2016, 205 hazards/violations were identified for asbestos; 65% of these hazards/violations were for unsafe conditions, 26% were for illegal removal, and 9% were for contractor non-compliance during permitted abatement work.

4 | Environmental Health
240
pBetween October 2015 and August 2016, 128 Boston Public Schools were inspected for water leaks and stains by the Environmental and Occupational Health Division of the Boston Public Health Commission. Leaks are of concern because persistent moisture can promote mold growth as well as encourage insect or rodent infestations.
A total of 8,964 areas (classrooms, offices, hallways, etc.) from all 128 schools were accessed during the school survey. Of the 8,964 areas inspected in all schools, 769 (8.6%) were denoted as areas with water leaks or stains. Aggregated at the neighborhood level, the percentage of areas of concern with water leaks or stains ranged from 4.1% in Dorchester (zip codes 02121, 02125) to 15.6% in South Boston.

Health of Boston 2016-2017
241
p
* Statistically significant change over time
NOTE: Hollowed-out symbols represent rates based on 20 or fewer cases and should be interpreted with caution. DATA SOURCE: Acute hospital case-mix databases, Massachusetts Center for Health Information and Analysis
From 2011-2015, the asthma emergency department (ED) visit rate in Boston among children ages 5-17 increased by 9%. The asthma ED visit rate also increased by 58% among White children ages 5-17 over the same time period.
In 2015, the asthma ED visit rate for Black children (267.8 visits per 10,000 residents ages 5-17) was 3.5 times the rate for White children (77.3). The rate for Latino children (156.7) was 2.0 times the rate of White children. The rate was 55% lower for Asian children (35.0) compared with White children.
p
* Statistically significant change over time
DATA SOURCE: Acute hospital case-mix databases, Massachusetts Center for Health Information and Analysis
From 2011-2015, the asthma emergency department (ED) visit rate in Boston increased by 11% for male children ages 5-17. In 2015, the asthma ED visit rate for female children (148.9 visits per 10,000 residents ages 5-17) was 20% lower than the rate for male children (185.2).

4 | Environmental Health
242
pFor 2014-2015, the asthma emergency department (ED) visit rates among children ages 5-17 were higher in Dorchester (zip codes 02121, 02125), Dorchester (zip codes 02122, 02124), Mattapan, and Roxbury compared with the rest of Boston. The asthma ED visit rates among children ages 5-17 were lower in Allston/Brighton, Back Bay, East Boston, Hyde Park, Jamaica Plain, South Boston, and West Roxbury compared with the rest of Boston.

Health of Boston 2016-2017
243
p
* Statistically significant change over time
NOTE: Hollowed-out symbols represent rates based on 20 or fewer cases and should be interpreted with caution. Rates are not presented due to a small number of cases for Asian residents for 2011-2015.DATA SOURCE: Acute hospital case-mix databases, Massachusetts Center for Health Information and Analysis
From 2011-2015, the asthma hospitalization rate in Boston among all children ages 5-17 decreased by 21%. The asthma hospitalization rate also decreased by 27% for Latino children ages 5-17 over the same time period.
Despite these decreases, the asthma hospitalization rate for Black children (53.1 hospitalizations per 10,000 residents ages 5-17) in 2015 was 3.9 times the rate for White children (13.5). The rate for Latino children (31.3) was 2.3 times the rate for White children.
p
* Statistically significant change over time
DATA SOURCE: Acute hospital case-mix databases, Massachusetts Center for Health Information and Analysis
From 2011-2015, the asthma hospitalization rate for children ages 5-17 in Boston decreased by 23% for female and 20% for male children. In 2015, the asthma hospitalization rate for female children (27.6 hospitalizations per 10,000 residents ages 5-17) was 27% lower than the rate for male children (38.0).

4 | Environmental Health
244
pFor 2011-2015, the asthma hospitalization rates among children ages 5-17 were higher in Dorchester (zip codes 02121, 02125), Dorchester (zip codes 02122, 02124), and Roxbury compared with the rest of Boston. The asthma hospitalization rates among children ages 5-17 were lower in Allston/Brighton, Back Bay, East Boston, Hyde Park, Jamaica Plain, South Boston, and West Roxbury compared with the rest of Boston.

Health of Boston 2016-2017
245
p
* Statistically significant change over time
DATA SOURCE: Boston Behavioral Risk Factor Survey (2005, 2006, 2010, 2013, 2015), Boston Public Health Commission
In 2015, 11% of Boston adult residents reported exposure to secondhand tobacco smoke at home in the past week. There was a significant decrease in the percentage of adults who reported exposure to secondhand tobacco smoke at home between 2005 and 2015.

4 | Environmental Health
246
p
* Statistically significant difference when compared to reference group(1) Includes homemakers, students, retirees, and those unable to work(2) Boston Housing Authority resident
NOTE: Bars with patterns indicate the reference group within each selected indicator.DATA SOURCE: Boston Behavioral Risk Factor Survey (2013, 2015), Boston Public Health Commission
During 2013 and 2015 combined, 13% of Boston adult residents reported secondhand tobacco smoke exposure at home in the past week.
The percentage of adults who reported secondhand tobacco smoke exposure at home was higher for the following groups:
• Black (17%) and Asian (16%) adults compared with White adults (11%)
• Adults ages 18-24 (21%) and 45-64 (14%) compared with adults ages 65 and older (11%)
• Adults with less than a high school diploma (18%) and adults with a high school diploma (20%) compared with adults with some college education (11%)
• Adults who were out of work (22%) or whose employment status was “other” (18%) compared with adults who were employed (10%)
• Adults living in households with an annual income of less than $25,000 (23%) or $25,000-$49,999 (15%) compared with adults living in households with an annual income of $50,000 or more (6%)
• Adults who were Boston Housing Authority residents (25%), who received rental assistance (24%), who rented but did not receive rental assistance (14%), or who lived in “other arrangements” (17%) compared with adults who owned their home (7%)

Health of Boston 2016-2017
247
pFor 2010, 2013, and 2015 combined, a higher percentage of adult residents in Dorchester (zip codes 02121, 02125), Roxbury, and South Boston reported exposure to secondhand tobacco smoke in the past week compared with the rest of Boston. Lower percentages of adults in the Back Bay, Charlestown, and West Roxbury reported secondhand tobacco smoke exposure in the past week compared with the rest of Boston.

4 | Environmental Health
248
p
* Statistically significant change over time† Age-adjusted rates per 100,000 residents
DATA SOURCE: Acute hospital case-mix databases, Massachusetts Center for Health Information and Analysis
In 2015, the rate of emergency department visits for confirmed carbon monoxide poisonings in Boston was 13.8 visits per 100,000 residents. Between 2011 and 2015, the rate decreased by 26%.

Health of Boston 2016-2017
249
p
* Statistically significant difference when compared to reference group† 4-year average annual age-adjusted rates per 100,000 residents†† 4-year average annual rates per 100,000 residents§ Rates based on 20 or fewer cases should be interpreted with caution.
NOTE: Bars with patterns indicate the reference group within each selected indicator. DATA SOURCE: Acute hospital case-mix databases, Massachusetts Center for Health Information and Analysis
For 2012-2015, the emergency department visit rate for confirmed carbon monoxide poisonings was 12.6 visits per 100,000 residents. The rate for females (14.1) was 30% higher than the rate for males (10.8). The rate was 4.6 times higher for Black residents (28.8) than for White residents (6.2). The rates were lower for residents ages 18-44 (9.4), 45-64 (9.6), and 65 and older (7.6) compared with those under age 18 (22.2).

4 | Environmental Health
250
p
DATA SOURCE: Boston Water and Sewer Commission
Under U.S. Environmental Protection Agency (EPA) rules, each year your local water department must test water in homes that are likely to have high lead levels. The homes sampled are considered higher risk for high lead levels because they have a lead service line or they had water service lines installed in 1983, 1984, or 1985. The requirement is that 90% of the sampled homes must have lead levels below the lead action level of 15 parts per billion.
In 2016, 90% of the sampled homes had tap water lead concentrations at or below 8.9 parts per billion. Since 2012, sampling rounds in Boston have been below the EPA action level.

Health of Boston 2016-2017
251
p
* Statistically significant difference when comparisons are made between racial/ethnic groups
NOTE: Bars with patterns indicate the reference group within each selected indicator. Due to limited data availability, data for Asian residents includes individuals who identified as Latino (less than 1% of Asian residents identified as Latino).DATA SOURCE: American Community Survey, 2015, U.S. Census Bureau
In 2015, compared with White householder housing units (1%) (e.g. apartments, condos, single family houses), higher percentages of Asian (7%), Black (3%), and Latino (6%) householder housing units were overcrowded (i.e. had more than one occupant per room).
p
‡ Data not presented due to insufficient sample size
NOTE: Bars with patterns indicate the reference group for statistical testing within each selected indicator.DATA SOURCE: American Community Survey, 2015, U.S. Census Bureau
In 2015, there were no significant differences by age of householder in percentages of housing units with more than one occupant per room.

4 | Environmental Health
252
pFor 2011-2015, 3% of occupied housing units in Boston had more than one occupant per room. A higher percentage of occupied housing units in East Boston had more than one occupant per room compared with Boston overall. Lower percentages of occupied housing units in Allston/Brighton, Back Bay, Jamaica Plain, and South Boston had more than one occupant per room compared with Boston overall.
Health of Boston 2016-2017
253
Climate Change and Health
Widespread scientific consensus is that the world’s climate is changing as evidenced by more variable
weather, heat waves, heavy precipitation events, flooding, droughts, more intense storms, sea level rise, and
air pollution (27). The impact of climate change may have already been felt locally. The Climate Ready Boston
Initiative, launched by the City of Boston, published a report in December 2016 with several key findings
addressing the impact of climate change factors in Boston (28). While sea levels for Boston rose about 9 inches
relative to land over the entire 20th century, another 8 inches of relative sea level rise may happen by 2030 (28).
Climate Ready Boston also reports that the rate of increase in average temperatures in Boston is accelerating,
and that the average summer temperatures and number of days with extreme heat will increase (28). From
1958 to 2010, there was a 70 percent increase in the amount of precipitation in the Northeastern U.S. that
fell on the days with the heaviest precipitation. Climate Ready Boston reports that the increase in extreme
precipitation is expected to continue (28).
Each of these impacts could negatively affect public health (27). Climate change, either directly or in
combination with other natural and human-made health stressors, influences human health and disease in
numerous ways. In the U.S., public health can be affected by disruptions (originating here or elsewhere) of
physical, biological, and ecological systems, all of which may lead to increased hospitalizations and emergency
room visits for cardiorespiratory disease and mental illness, injuries and premature deaths related to extreme
weather events, changes in the prevalence and geographical distribution of food- and water-borne illnesses
and other infectious diseases (29). Much research has centered on evaluating the association between
outdoor temperature and health. It is well-established that colder and hotter outdoor temperature (under
both moderate and extreme conditions) is associated with daily mortality (30, 31). Every year, a large number
of hospitalizations are also associated with exposure to extreme outdoor temperatures, especially during heat
waves and cold spells (32-36).
Though the experience of climate change is often shared among an entire population, not everyone is equally
at risk of having a related poor health outcome. Age, economic resources, location, and other factors all
contribute to differential impact that climate change may have on health (29). For example, population groups
that are more vulnerable to heat waves or extreme hot weather conditions include individuals who are elderly,
poorer, lesser educated, non-White, have pre-existing health conditions (e.g. cardiovascular disease, diabetes,
renal disease, or respiratory conditions), have no access to air conditioning, and who live in neighborhoods
with limited access to green space (37).
In this section of the report we will summarize emergency department visits for heat and cold-related illness.

4 | Environmental Health
254
p
† Age-adjusted rates per 100,000 residents
NOTE: Warm-weather months are defined as May, June, July, August, and September. DATA SOURCE: Acute hospital case-mix databases, Massachusetts Center for Health Information and Analysis
In 2015, the rate of heat-related illness emergency department (ED) visits during warm-weather months in Boston was 10.1 per 100,000 residents. The rate of heat-related illness ED visits did not significantly change from 2011 to 2015.
Health of Boston 2016-2017
255
p
* Statistically significant difference when compared to reference group† 4-year average annual age-adjusted rates per 100,000 residents†† 4-year average annual rates per 100,000 residents§ Rates are based on 20 or fewer cases and should be interpreted with caution.
NOTE: Bars with patterns indicate the reference group within each selected indicator. Warm-weather months are defined as May, June, July, August, and September. DATA SOURCE: Acute hospital case-mix databases, Massachusetts Center for Health Information and Analysis
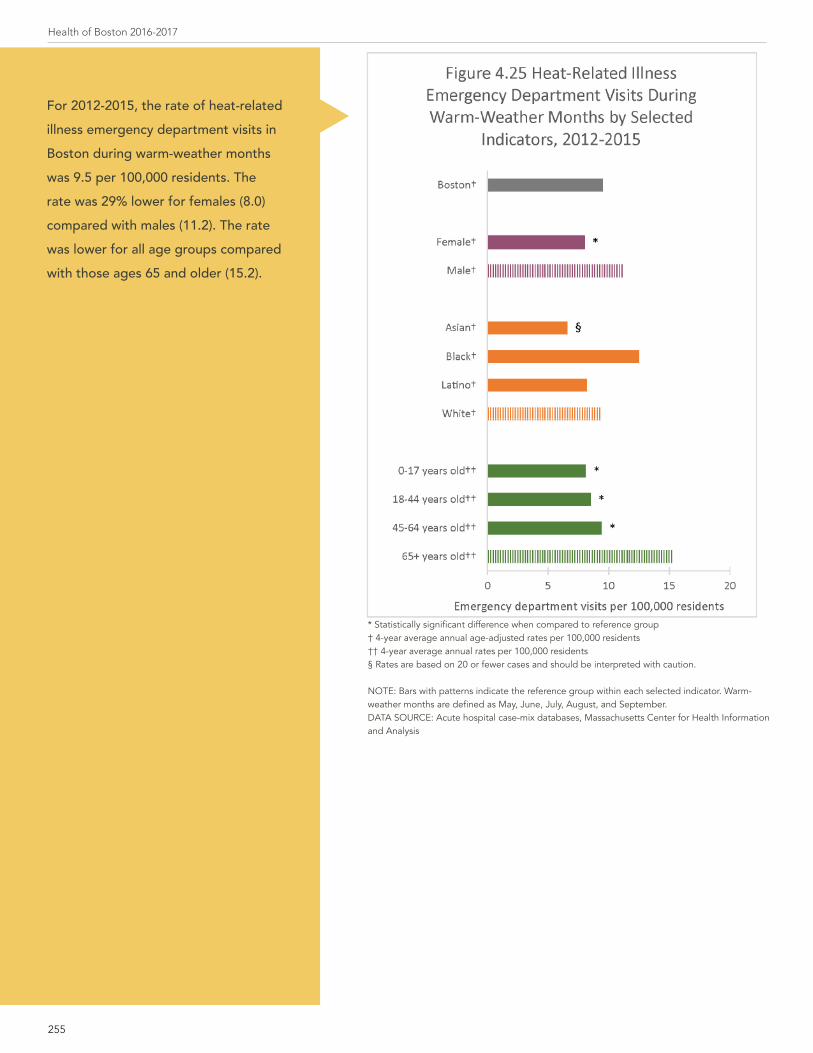
For 2012-2015, the rate of heat-related illness emergency department visits in Boston during warm-weather months was 9.5 per 100,000 residents. The rate was 29% lower for females (8.0) compared with males (11.2). The rate was lower for all age groups compared with those ages 65 and older (15.2).

4 | Environmental Health
256
p
* Statistically significant change over time† Age-adjusted rates per 100,000 residents
NOTE: Cold-weather months are defined as November, December, January, February, and March.DATA SOURCE: Acute hospital case-mix databases, Massachusetts Center for Health Information and Analysis
In 2015, the rate of cold-related illness emergency department (ED) visits in Boston during cold-weather months was 37.7 per 100,000 residents. The rate of cold-related illness ED visits increased 2.5 times from 2011 to 2015.

Health of Boston 2016-2017
257
p
* Statistically significant difference when compared to reference group† 4-year average annual age-adjusted rates per 100,000 residents†† 4-year average annual rates per 100,000 residents§ Rates are based on 20 or fewer cases and should be interpreted with caution.
NOTE: Bars with patterns indicate the reference group within each selected indicator. Cold-weather months are defined as November, December, January, February, and March.DATA SOURCE: Acute hospital case-mix databases, Massachusetts Center for Health Information and Analysis
For 2012-2015, the rate of cold-related illness emergency department (ED) visits during cold-weather months for Boston was 26.5 per 100,000 residents. Approximately 51% of all cold-related illness ED visits during this time period indicate that the patient was homeless. The rate was 68% lower for females (13.3) compared with males (41.2). The rate was 67% higher for Black residents (45.9) compared with White residents (27.5). The rate was 79% and 39% lower for Asian (5.7) and Latino (16.8) residents, respectively, compared with White residents. The rate was lower for residents ages 0-17 (6.3) and 18-44 (20.1), and higher for ages 45-64 (50.9) compared with those ages 65 and older (34.8).

4 | Environmental Health
258
pFor 2011-2015, the cold-related illness emergency department visit rate during cold-weather months was higher in Roxbury and the South End compared with the rest of Boston. The rate was lower in Allston/Brighton, East Boston, Fenway, Hyde Park, Jamaica Plain, Roslindale, South Boston and West Roxbury compared with the rest of Boston.

Health of Boston 2016-2017
259
SummaryAccording to data collected by state and local agencies, outdoor PM2.5 levels and lead levels in home tap
water originating from the public drinking water supply met the standards and action level set forth by the
U.S. EPA. There was a significant decrease in the percentage of adult residents reporting secondhand tobacco
smoke exposure at home from 2005 to 2015. Among all residents, the rate of emergency department (ED)
visits for confirmed carbon monoxide poisonings decreased by 26%. Among residents ages 5 to 17 years,
who spend much of their time inside schools, the rate of asthma hospitalizations decreased by 29% in the
same time period. However, some indicators worsened over time. Among all residents, the rate of ED visits for
cold-related illness increased by two and half times from 2011 to 2015. The rate of ED visits for asthma among
residents of ages 5 to 17 years also increased by 9% in the same time period.
Inequities across categories of age, sex, and race/ethnicity were observed. During 2012 to 2015, the rates of
ED visits for heat-related illness and confirmed carbon monoxide poisonings was highest among residents
65 years and older and among residents under 18 years. During the same time period, the rate of ED visits
for heat and cold-related illness was higher in males than females. Across categories of race/ethnicity, higher
percentages of Asian and Black residents reported secondhand tobacco smoke exposure at home compared
with White residents in 2015. In the same year, higher percentages of Asian, Black, and Latino householder
units also reported overcrowded housing than White householder units. During 2012 to 2015, Black residents
also had higher rates of ED visits for cold-related illness and confirmed carbon monoxide poisonings than
White residents.
At the neighborhood level, the rate of cold-related illness during 2011 to 2015 was higher in the South End
and Roxbury. The higher rate observed in the South End may be explained, at least partially, by the frequency
of homelessness observed in the neighborhood. Survey data collected between 2010 and 2015 also indicates
that higher percentages of secondhand tobacco smoke exposure at home were found for Dorchester (zip
codes 02121, 02125), Dorchester (zip codes 02122, 02124), and South Boston. Lastly, higher percentages of
overcrowded housing were also observed for East Boston and South End during 2011 to 2015.

4 | Environmental Health
260

Health of Boston 2016-2017
261
Our Point of View: Thoughts from public healthThe workplace is a critical site for public health intervention
By Paul Shoemaker, MPHAssociate Director, Environmental & Occupational Health DivisionBoston Public Health Commission
In 2015, working Americans spent nearly one third of their workday (7.6 hours/day) in a workplace1. Assuming only a 5-day work week, that’s over 1,900 hours per year spent at the workplace, making it a critical site for environmental public health intervention. While occupational deaths appropriately make front page headlines (49 Massachusetts workers lost their lives in 2014 and another 63 in 2015 3), there were more than 85,000 work-related injuries and illnesses4 reported in Massachusetts in 2014 2 and research shows that a substantial number of additional injuries go unreported. 5,6
It is likely that so many illnesses and injuries go unreported each year because they are perceived as minor, are invisible to the worker, or the effects of the injury/exposure can take days to years to appear. Furthermore, many happen in small businesses that employ economically and socially vulnerable populations without access to reporting infrastructure. Examples of perceived “minor” injuries include contact dermatitis (skin rash/irritation) or headaches caused by chemicals commonly found in a nail salon or auto shop. These symptoms are frequently ignored as they might clear up when the person leaves work, even though they can be early signs of potentially serious health impacts. Workers have no idea they are being exposed to chemicals that years down the road may lead to birth defects caused by endocrine disruptors, occupational asthma from chronic exposure to a wide variety of chemical and physical irritants (often initially misdiagnosed as bronchitis 7), cancers (such as after exposure to asbestos), or neurological damage. Much of this can be prevented through the application of basic public health and industrial hygiene principles in the workplace.
There is a compelling reason for public health programming in the workplace – particularly those that are too small to have their own industrial hygiene professionals or regular oversight from federal (OSHA) or state (MA Labor and Workforce Development) agencies. Many employers are eager to learn how to protect themselves and their employees. The Boston Public Health Commission has been a national leader in this work with our Safe Shops Program. Launched in 2004, the Program has been recognized as a Model Practice by the National Association of County and City Health Officials and received an Environmental Merit Award from the US Environmental Protection Agency. The program provides free voluntary education and technical assistance to the owners and employees of small businesses on occupational safety and health, with a focus on reducing chemical exposures through product substitution or different work practices. For those businesses that work with the program to make significant changes, the program offers Green & Clean recognition – a badge of honor that business owners can use to promote their shop. Currently the program focuses on automotive repair and body shops, nail salons, and hair salons, but there is opportunity to expand into similar small business areas where chemicals are extensively used with minimal oversight.
1 https://www.bls.gov/news.release/pdf/atus.pdf2 Massachusetts AFL-CIO, MassCOSH; Dying For Work in Massachusetts; April 28, 2015; p.63 https://www.boston.com/jobs/jobs-news/2016/04/29/workplace-fatalities-5-year-high-massachusetts4 http://www.mass.gov/lwd/labor-standards/occupational-safety-and-health-statistics-program/illness-and-injuries-reports/2014-occup-injury-and- illness-report-lo-website-version-3.pdf5 https://www.osha.gov/ooc/underrecording_fagan_hodgson.pdf6 https://www.ncbi.nlm.nih.gov/pmc/articles/PMC5066642/7 https://www.aaaai.org/conditions-and-treatments/library/at-a-glance/occupational-asthma

4 | Environmental Health
262
Our Point of View: Thoughts from a community residentProtecting my employees and community at the same time
By Juan ChavezJuan Chavez is the owner of Moreno Auto Collision in Roslindale, a long-time member of the BPHC’s Green & Clean business recognition program for replacing toxic chemicals and processes with safer alternatives.
My name is Juan Chavez. I am the President of Moreno Auto Collision. We repair cars after accidents – no
matter how big or small the accident is. I joined the Boston Public Health Commission’s Green and Clean
program almost 10 years ago because I want to do what I can to protect myself, my workers and the people
living in the neighborhood around us. We’ve made a lot of changes based on BPHC’s recommendations.
One of the big changes we’ve made is switching to products that are safer. We’ve also started to buy more
items that can be recycled because it’s better for the environment. To improve our work environment, we
started using a vacuum cleaner especially in the summer when we have to work with the doors open to clean
up the dust and keep it from getting into the air outside.
Sometimes it’s hard to make changes if you’re not 100% sure it will make a difference but when I looked at the
recommendations that BPHC makes I know that they’re better for me, my shop and the neighborhood. There
are still more changes I’d like to make. For example, I would like to move from using a solvent-based paint to a
water-based paint system in the next five years. It’s more expensive but it’s better for everyone using it. Making
changes like these will mean I can continue do this work for a long time.

Health of Boston 2016-2017
263
References1. Centers for Disease Control and Prevention, National Center for Environmental Health. Environmental Health: About
NCEH [05/17/17]. Available from: https://www.cdc.gov/nceh/information/about.htm.
2. World Health Organization. Health Topics: Environmental Health [05/17/17]. Available from: http://www.searo.who.int/
topics/environmental_health/en/.
3. Prüss-Üstün A, Corvalán C. Preventing disease through healthy environments: Towards an estimate of the environmental
burden of disease. Geneva: 2006.
4. Bravo MA, Anthopolos R, Bell ML, Miranda ML. Racial isolation and exposure to airborne particulate matter and ozone
in understudied US populations: Environmental justice applications of downscaled numerical model output. Environment
international. 2016;92-93:247-55.
5. Corburn J. Concepts for Studying Urban Environmental Justice. Current environmental health reports. 2017.
6. Schulz A, Northridge ME. Social determinants of health: implications for environmental health promotion. Health
education & behavior : the official publication of the Society for Public Health Education. 2004;31(4):455-71.
7. Cohen AJ, Brauer M, Burnett R, Anderson HR, Frostad J, Estep K, et al. Estimates and 25-year trends of the global
burden of disease attributable to ambient air pollution: an analysis of data from the Global Burden of Diseases Study
2015. Lancet (London, England). 2017.
8. United States Environmental Protection Agency. Criteria Air Pollutants [05/17/17]. Available from: https://www.epa.gov/
criteria-air-pollutants.
9. Department of Environmental Protection, Bureau of Air and Waste, Division of Air and Climate Programs, Air
Assessment Branch. Massachusetts 2015 Air Quality Report. August 2016.
10. Centers for Disease Control and Prevention. Air Quality: Particle Pollution [05/17/17]. Available from: https://www.cdc.
gov/air/particulate_matter.html.
11. United States Environmental Protection Agency. Particulate Matter (PM) Pollution: Particulate Matter (PM) Basics
[05/17/17]. Available from: https://www.epa.gov/pm-pollution/particulate-matter-pm-basics#PM.
12. Centers for Disease Control and Prevention. Outdoor Air [05/17/17]. Available from: https://ephtracking.cdc.gov/
showAirContaminants.action.
13. Thurston GD, Kipen H, Annesi-Maesano I, Balmes J, Brook RD, Cromar K, et al. A joint ERS/ATS policy statement: what
constitutes an adverse health effect of air pollution? An analytical framework. The European respiratory journal. 2017;49(1).
14. Brook RD, Rajagopalan S, Pope CA, 3rd, Brook JR, Bhatnagar A, Diez-Roux AV, et al. Particulate matter air pollution
and cardiovascular disease: An update to the scientific statement from the American Heart Association. Circulation.
2010;121(21):2331-78.

4 | Environmental Health
264
15. World Health Organization, Regional Office for Europe. Health effects of particulate matter: Policy implications for
countries in eastern Europe, Caucasus and central Asia. 2013.
16. United States Environmental Protection Agency. Nitrogen Dioxide (NO2) Pollution: Basic Information about NO2
[05/17/17]. Available from: https://www.epa.gov/no2-pollution/basic-information-about-no2.
17. Newby DE, Mannucci PM, Tell GS, Baccarelli AA, Brook RD, Donaldson K, et al. Expert position paper on air pollution
and cardiovascular disease. Eur Heart J. 2015;36(2):83-93b.
18. Hamra GB, Laden F, Cohen AJ, Raaschou-Nielsen O, Brauer M, Loomis D. Lung Cancer and Exposure to Nitrogen
Dioxide and Traffic: A Systematic Review and Meta-Analysis. Environmental health perspectives. 2015;123(11):1107-12.
19. United States Environmental Protection Agency. Ozone Pollution: Ozone Basics [05/17/17]. Available from: https://
www.epa.gov/ozone-pollution/ozone-basics.
20. United States Environmental Protection Agency. Ozone Pollution and Your Patients’ Health: Health Effects of Ozone in
the General Population [05/17/17]. Available from: https://www.epa.gov/ozone-pollution-and-your-patients-health/health-
effects-ozone-general-population.
21. Bell ML, McDermott A, Zeger SL, Samet JM, Dominici F. Ozone and short-term mortality in 95 US urban communities,
1987-2000. Jama. 2004;292(19):2372-8.
22. Levy JI, Chemerynski SM, Sarnat JA. Ozone exposure and mortality: an empiric bayes metaregression analysis.
Epidemiology (Cambridge, Mass). 2005;16(4):458-68.
23. Ito K, De Leon SF, Lippmann M. Associations between ozone and daily mortality: analysis and meta-analysis.
Epidemiology (Cambridge, Mass). 2005;16(4):446-57.
24. Association AL. Ozone: Who Is at Risk from Breathing Ozone? [05/17/17]. Available from: http://www.lung.org/our-
initiatives/healthy-air/outdoor/air-pollution/ozone.html#atrisk.
25. Centers for Disease Control and Prevention, National Institute for Occupational Safety and Health. Indoor
Environmental Quality [05/17/17]. Available from: https://www.cdc.gov/niosh/topics/indoorenv/.
26. United States Environmental Protection Agency. Indoor Air Quality: Introduction to Indoor Air Quality [05/17/17].
Available from: https://www.epa.gov/indoor-air-quality-iaq/introduction-indoor-air-quality.
27. Centers for Disease Control and Prevention. Climate and Health [05/17/17]. Available from: https://www.cdc.gov/
climateandhealth/.
28. Climate Ready Boston Initiative. Climate Ready Boston - Final Report. December 2016.
29. Centers for Disease Control and Prevention. Climate and Health: Climate Effects on Health [05/17/17]. Available from:
https://www.cdc.gov/climateandhealth/effects/default.htm.

Health of Boston 2016-2017
265
30. Basu R, Samet JM. Relation between elevated ambient temperature and mortality: a review of the epidemiologic
evidence. Epidemiologic reviews. 2002;24(2):190-202.
31. Gasparrini A, Guo Y, Hashizume M, Lavigne E, Zanobetti A, Schwartz J, et al. Mortality risk attributable to high and low
ambient temperature: a multicountry observational study. Lancet (London, England). 2015;386(9991):369-75.
32. Juopperi K, Hassi J, Ervasti O, Drebs A, Nayha S. Incidence of frostbite and ambient temperature in Finland, 1986-
1995. A national study based on hospital admissions. International journal of circumpolar health. 2002;61(4):352-62.
33. Michelozzi P, Accetta G, De Sario M, D’Ippoliti D, Marino C, Baccini M, et al. High temperature and hospitalizations
for cardiovascular and respiratory causes in 12 European cities. American journal of respiratory and critical care medicine.
2009;179(5):383-9.
34. Schwartz J, Samet JM, Patz JA. Hospital admissions for heart disease: the effects of temperature and humidity.
Epidemiology (Cambridge, Mass). 2004;15(6):755-61.
35. Semenza JC, McCullough JE, Flanders WD, McGeehin MA, Lumpkin JR. Excess hospital admissions during the July
1995 heat wave in Chicago. American journal of preventive medicine. 1999;16(4):269-77.
36. Ye X, Wolff R, Yu W, Vaneckova P, Pan X, Tong S. Ambient temperature and morbidity: a review of epidemiological
evidence. Environmental health perspectives. 2012;120(1):19-28.
37. Reid CE, Mann JK, Alfasso R, English PB, King GC, Lincoln RA, et al. Evaluation of a heat vulnerability index on
abnormally hot days: an environmental public health tracking study. Environmental health perspectives. 2012;120(5):715-