Chapter 4 - Citrus County Board of County Commissioners · Citrus County | 2035 Long Range...
7
Chapter 4: Forecasting Growth and Land Use
Transcript of Chapter 4 - Citrus County Board of County Commissioners · Citrus County | 2035 Long Range...
Chapter 4: Forecasting Growth and Land Use

Chapter 4: Forecasting Growth and Land Use
Citrus County | 2035 Long Range Transportation Plan
Chapter 4: Forecasting Growth and Land Use 4‐1
INTRODUCTION Socioeconomic data, such as population and employment information, are a
vital component of travel demand forecasting models used for transportation
planning. Citrus County participates in the development and maintenance of
this information within Citrus County for the Tampa Bay Regional Planning
Model (TBRPM).
This chapter describes some of the more significant issues relative to the
forecast of socioeconomic data in Citrus County, the specific process used to
develop these data, and results of the analysis. Additionally, Technical Appen‐
dix 4 contains a more in‐depth review of the methodologies and assumptions
presented in this chapter.
HISTORIC DEVELOPMENT PATTERNS Citrus County is approximately 720 square miles in size with two municipali‐
ties:
Crystal River
Inverness
The oldest municipality and County seat is Inverness, which is located at
US 41 and SR 44 in the central eastern part of the county. On the western
side of the county is Crystal River, which is where SR 44 and US 19 meet.
US 19 provides a connection to the Tampa Bay region to the south via US 98
and the Suncoast Parkway in Hernando County.
The most heavily‐populated area outside of the municipalities is Beverly Hills,
situated north of CR 486 and West of SR 200, which provides a regional con‐
nection to Ocala. Lecanto is where the County’s government center and
other offices are located, on CR 491 in the center of the county. Two other
towns with established populations are Floral City, which is south of Inver‐
ness on US 41, and Homosassa, which is west of US 19 in the south western
part of the county.
POPULATION AND EMPLOYMENT GROWTH TRENDS Over time, much of Citrus County has developed in a scattered pattern. This
pattern has resulted from several factors, including a strong preference for a
low density, rural lifestyle, the lack of a large defined urban center, and a lim‐
ited transportation network.
The following section fulfills the Metropolitan Planning Organization’s Pro‐
gram Management Handbook, Long Range Transportation Checklist, US Code
Requirement C‐3 as stated below:
“Is the plan consistent, to the maximum extent feasible, with future land use
elements and the goals, objectives, and policies in the approved local gov‐
ernment comprehensive plans? [Subsection 339.175(6), F.S.]”
The County’s Future Land Use Map can be found on page 4‐2 and was used
as the base for which socioeconomic data to support travel demand forecast‐
ing was developed.
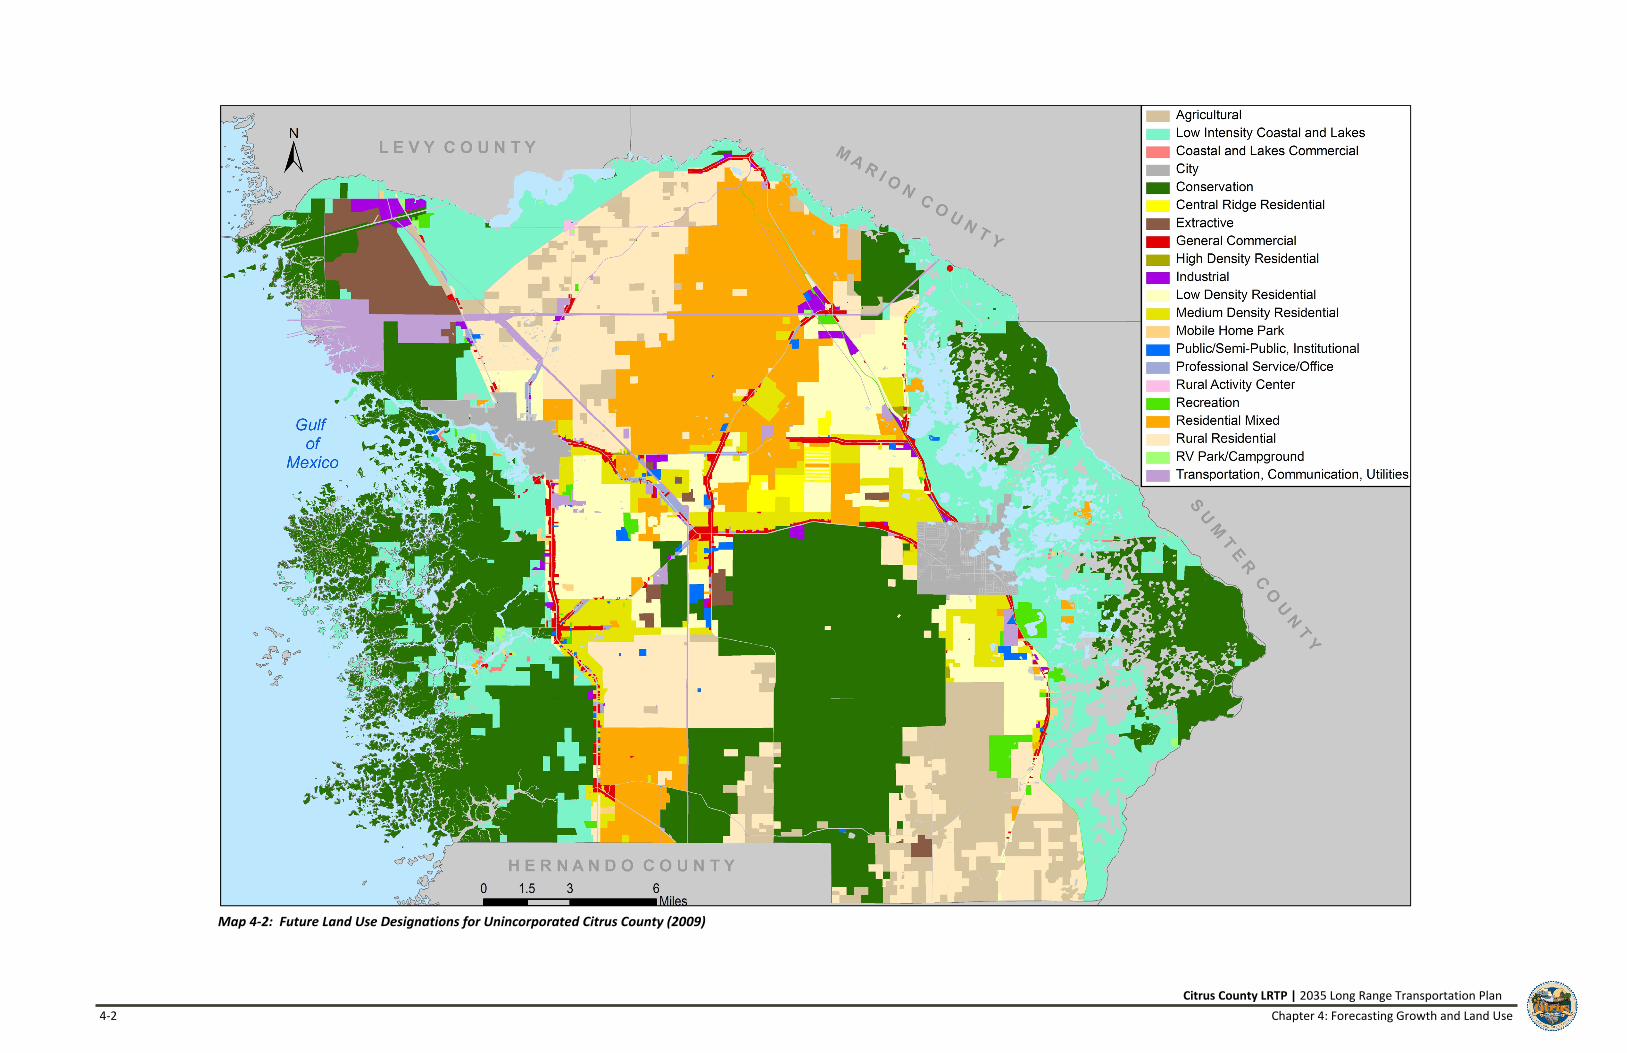
FUTURE LAND USE AND TRANSPORTATION COORDINATION The future land use map for Citrus County is a key tool used to determine
where growth will occur in the future. Each future land use category has
maximum allowable residential densities and non‐residential intensities asso‐
ciated to ensure natural resource preservation while optimizing social infra‐
structure enhancements, including transportation. The future land use plan
was used in the development of the socioeconomic data in the following
ways :
Determination of maximum allocable units to be added to an area.
Identification of physical constraints imposed by coastal zones and
coastal hazard areas.
Guidance of new growth towards existing urban areas that can ac‐
commodate growth and to vacant lands in the vicinity of urban areas.
The adopted Future Land Use used to develop the socioeconomic data pro‐
jections for this LRTP is shown in Map 4‐2.
Map 4‐1: Major Regional Roadways and Municipalities in Citrus County
Citrus County LRTP | 2035 Long Range Transportation Plan
4‐2 Chapter 4: Forecasting Growth and Land Use
Map 4‐2: Future Land Use Designations for Unincorporated Citrus County (2009)

Citrus County | 2035 Long Range Transportation Plan
Chapter 4: Forecasting Growth and Land Use 4‐3
SOCIOECONOMIC DATA DEVELOPMENT Development of Citrus County’s socioeconomic data involved the following
steps:
1. Develop countywide control totals for population, employment,
school enrollment, and hotel/motels.
2. Allocate approved development to the appropriate areas using the
County’s database and geographic information system (GIS).
3. Calculate vacant developable lands in Citrus County using GIS.
4. Allocate growth to appropriate zones throughout the county using a
land use allocation model and GIS.
The following section fulfills the Metropolitan Planning Organization’s Pro‐
gram Management Handbook, Long Range Transportation Checklist, US Code
Requirement B‐3 as stated below:
“Was the plan created using the latest available estimates and assumptions for
population, land use, travel, employment, congestion, and economic activ‐
ity? [23 C.F.R. 450.322(e)]”
Table 4‐1 shows the assumptions used and represents the latest available
data.
SUMMARY OF SOCIOECONOMIC DATA Table 4‐1 summarizes the control totals used to forecast future population
and employment in Citrus County. The current and future land uses, popula‐
tion, and employment in addition to planned development represent the ba‐
sis for this forecast. The allocation of growth to different areas is based on
modeling efforts, public involvement, and consultation with County staff and
is described in greater detail in Technical Support Appendix 4.
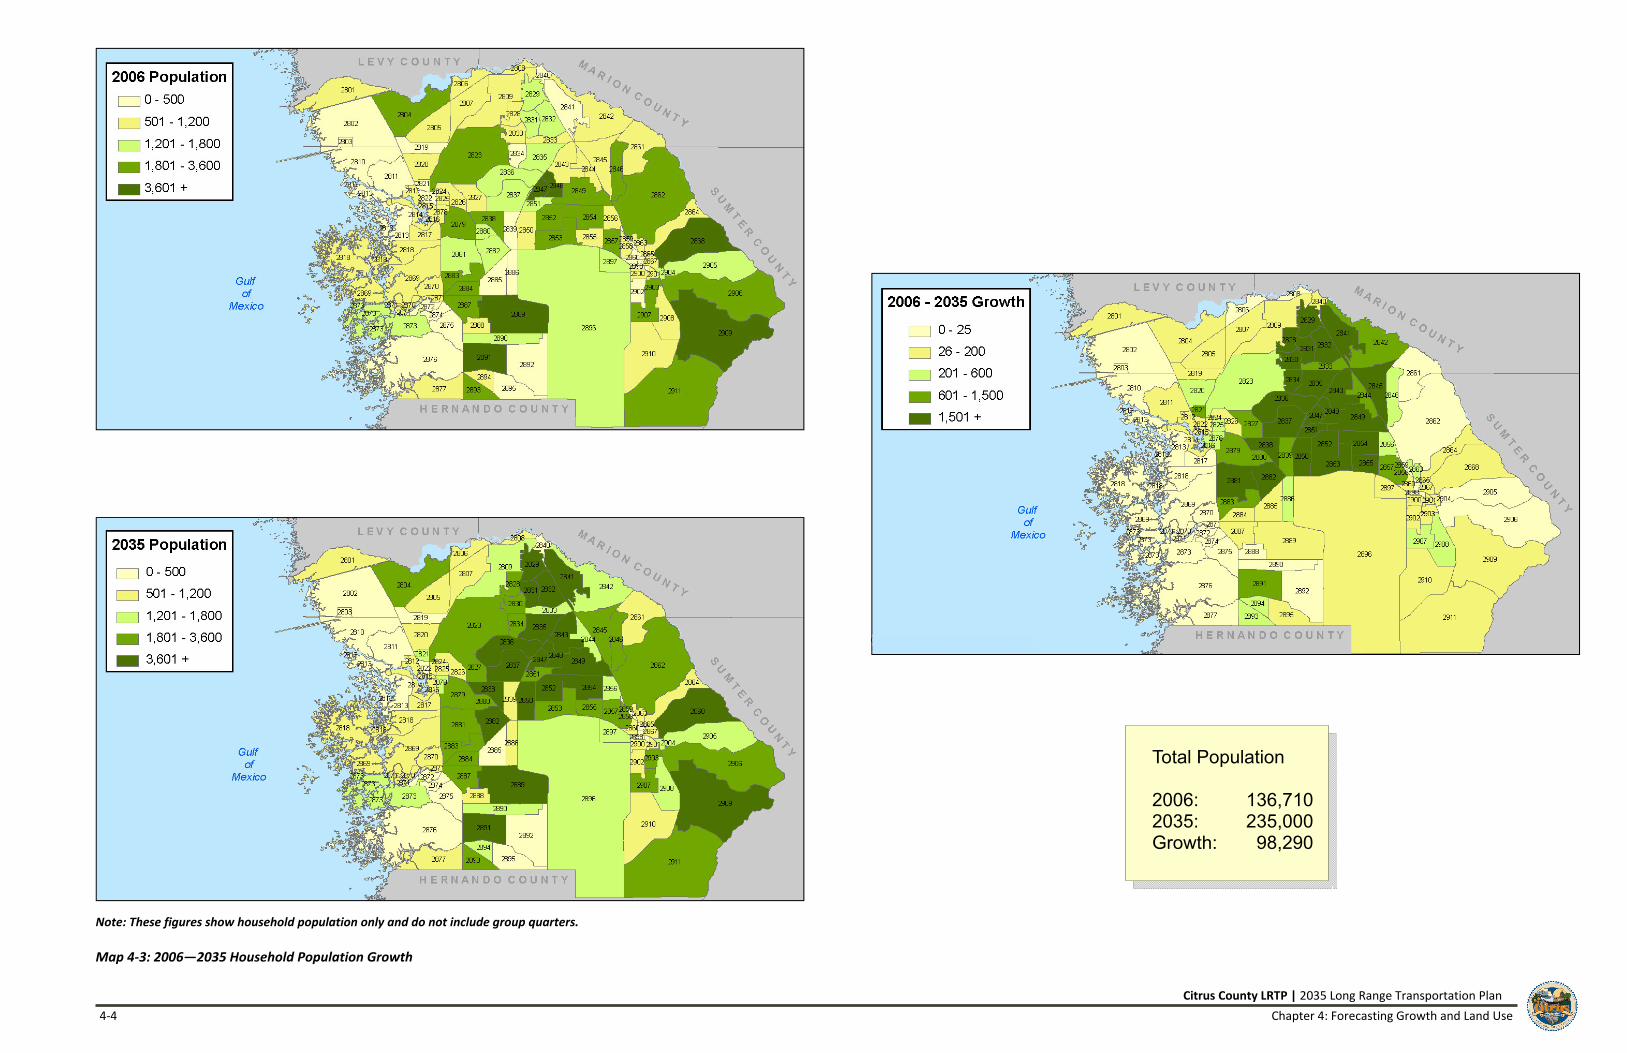
The socioeconomic data forecast results are shown in Maps 4‐3 and 4‐4.
These maps illustrate which areas of the county have the most growth in
population and employment occurring between 2006 and 2035. This socio‐
economic data was used to forecast future transportation needs in Citrus
County through the year 2035.
Control Totals by Year Growth by Year
2006 2015 2025 2035 2006-15 2015-25 2025-35 2006-35
Total Population 136,710 166,350 200,650 235,000 29,640 34,300 34,350 98,290
Total Employees 50,000 61,550 76,247 91,652 11,550 14,697 15,405 41,652
Industrial Employees 11,000 13,541 16,012 18,330 2,541 2,471 2,318 7,330
Commercial Employees 10,300 12,926 16,021 19,249 2,626 3,086 3,228 8.949
Service Employees 28,700 35,084 44,223 54,074 6,384 9,140 9,850 25,374
Hotel/Motel Units 1,137 1,386 1,672 1,958 249 286 268 821
School Enrollment 18,511 21,509 24,525 26,852 2,998 3,016 2,327 8,341
Table 4‐1: Socioeconomic Data Summary
Source: Bureau of Economic and Business Research, Florida Statistical Abstract 2006,Table 1.41. University of Florida, 2007.
Citrus County LRTP | 2035 Long Range Transportation Plan
4‐4 Chapter 4: Forecasting Growth and Land Use
Note: These figures show household population only and do not include group quarters. Map 4‐3: 2006—2035 Household Population Growth
Total Population
2006: 136,710 2035: 235,000 Growth: 98,290

Citrus LRTP | 2035 Long Range Transportation Plan
Chapter 4: Forecasting Growth and Land Use 4‐5
Map 4‐4: 2006—2035 Total Employment Growth
Total Employment
2006: 50,000 2035: 91,652 Growth: 41,652
Citrus County | 2035 Long Range Transportation Plan
4‐6 Chapter 4: Forecasting Growth and Land Use
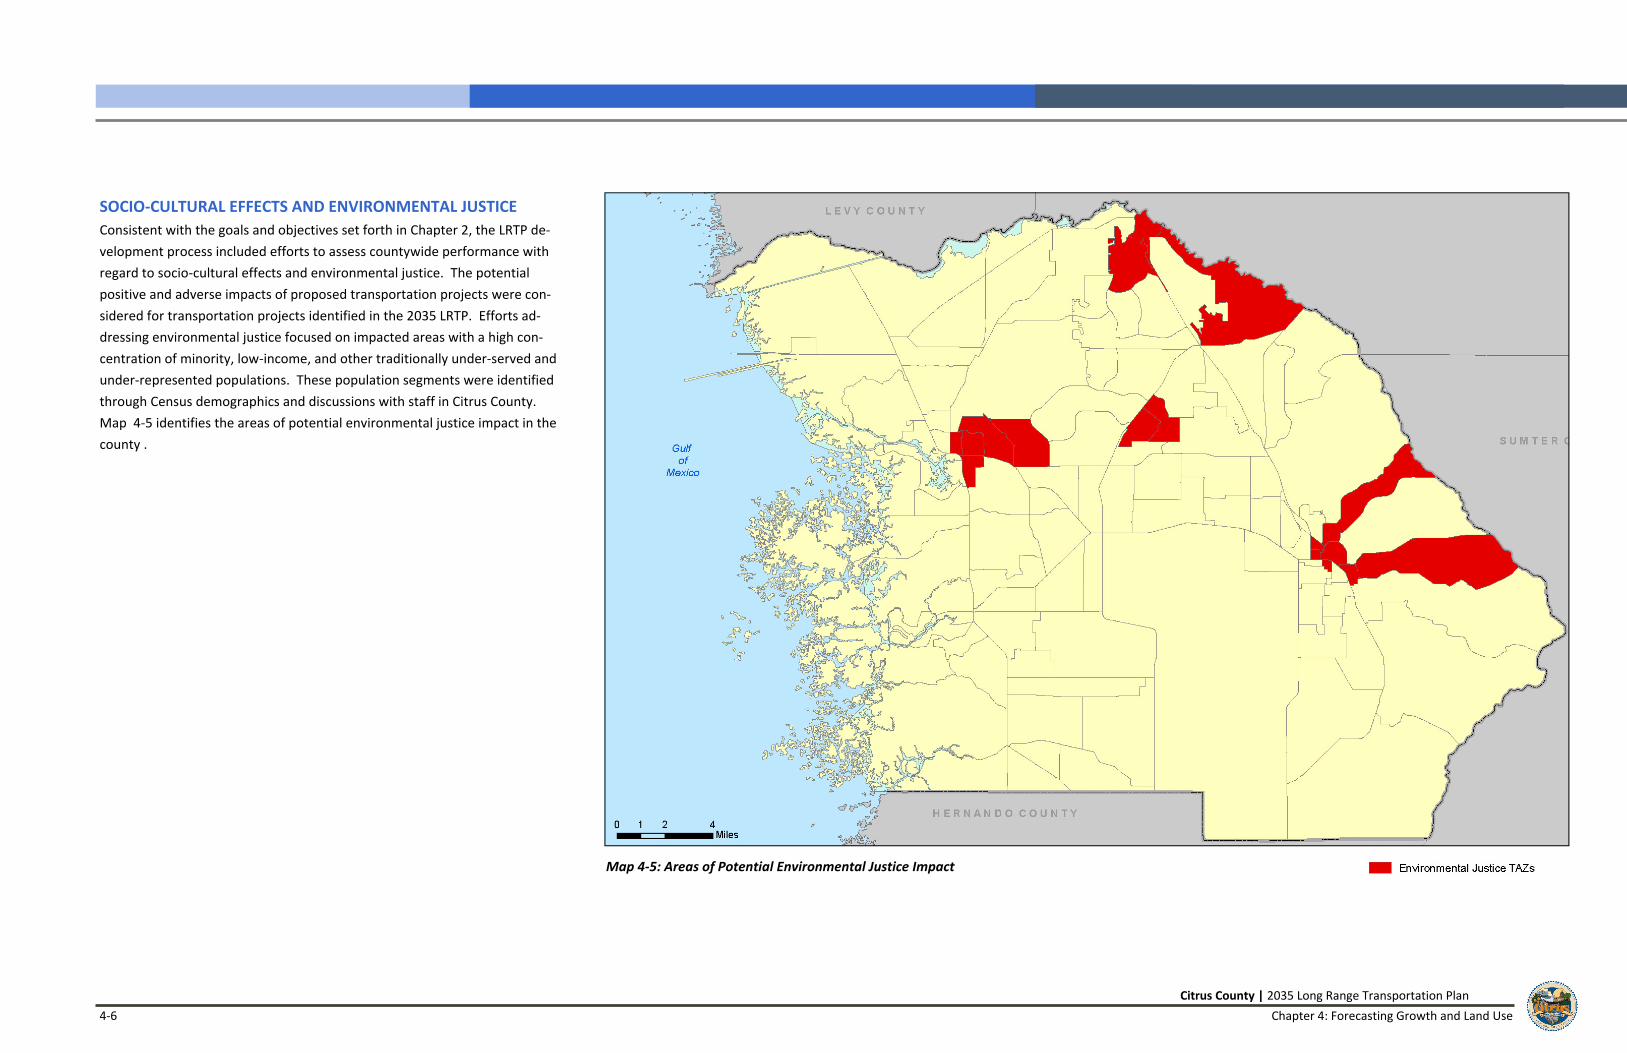
SOCIO‐CULTURAL EFFECTS AND ENVIRONMENTAL JUSTICE Consistent with the goals and objectives set forth in Chapter 2, the LRTP de‐
velopment process included efforts to assess countywide performance with
regard to socio‐cultural effects and environmental justice. The potential
positive and adverse impacts of proposed transportation projects were con‐
sidered for transportation projects identified in the 2035 LRTP. Efforts ad‐
dressing environmental justice focused on impacted areas with a high con‐
centration of minority, low‐income, and other traditionally under‐served and
under‐represented populations. These population segments were identified
through Census demographics and discussions with staff in Citrus County.
Map 4‐5 identifies the areas of potential environmental justice impact in the
county .
Map 4‐5: Areas of Potential Environmental Justice Impact