Chapter - 3shodhganga.inflibnet.ac.in/bitstream/10603/4141/8/08_chapter 3.pdfidentification methods...
34
0 Chapter - 3 CharacterizationTechniques and Instrumentation
Transcript of Chapter - 3shodhganga.inflibnet.ac.in/bitstream/10603/4141/8/08_chapter 3.pdfidentification methods...

0
Chapter - 3
CharacterizationTechniques
and
Instrumentation
- 43 -
SrFe12O19 hexaferrite samples synthesized by three different routes are
characterised by using different experimental techniques namely; Fourier Transform
Infrared (FTIR) spectroscopy, Differential Thermal Analysis (DTA), Differential
Scanning Calorimetry (DSC), Thermo Gravimetric Analysis (TGA), X-ray
Diffraction (XRD), Scanning Electron Microscopy (SEM), Vibrating Sample
Magnetometer (VSM) and Dielectric measurements. Details of these characterization
techniques are discussed in present chapter. The effect of Swift Heavy Ion (SHI)
irradiation on SrFe12O19 hexaferrites is studied. The details of SHI irradiation is
discussed in this chapter.
3.1 Fourier Transform Infrared (FTIR) Spectroscopy
3.1.1 Working Principle
Infrared spectroscopy is non destructive technique for materials analysis and
used in the laboratory for over seventy years. Infrared absorption spectroscopy is the
study of interaction of infrared radiation with matter as a function of photon
frequency. Fourier Transform Infrared Spectroscopy (FTIR) provides specific
information about the vibration and rotation of the chemical bonding and molecular
structures, making it useful for analyzing organic materials and certain inorganic
materials. An infrared spectrum represents a fingerprint of a sample with absorption
peaks which correspond to the frequencies of vibrations between the bonds of the
atoms making up the material. Because each different material is a unique
combination of atoms, no two compounds produce the exact same infrared spectrum.
Therefore, infrared spectroscopy can result in a positive identification (qualitative
analysis) of every different kind of material. In addition, the size of the peaks in the
spectrum is a direct indication of the amount of material present. With modern
software algorithms, infrared is an excellent tool for quantitative analysis.
The IR region is commonly divided into three smaller areas: near - IR (400 -
10 cm-1), mid - IR (4000 - 400 cm-1), and far - IR (14000 – 4000 cm-1). Infrared
photons have enough energy to cause groups of atoms to vibrate with respect to the
bonds that connect them. Like electronic transitions, these vibrational transitions
correspond to distinct energies, and molecules absorb infrared radiation only at certain
wavelengths and frequencies. Chemical bonds vibrate at characteristic frequencies,

and when exposed to infrared radiation, they absorb the radiation at frequencies that
match their vibration modes. Measuring the radiation abs
frequency produces a spectrum that can be used to identify functional groups and
compounds. Some impurities produce their own characteristic bands in infrared
region. Spectral measurements of these bands are used to determine conce
the impurities and their bonding with the host materials.
identification, the measured interferogram signal can not be interpreted directly. A
means of “decoding” the individual frequencies is required. This can be accomplished
via a well-known mathematical technique called the
transformation is performed by the computer which then presents the user with the
desired spectral information for analysis.
3.1.2 Sample Analysis Process
(i) Instrumentation
There are three basic spectrometer components in an FT
source, an interferometer, and
Interferometer divides radiant beams, generates an optical path difference
between the beams,
interference signals measured as a function of optical path difference by a detector. As
its name implies, the interferometer produces interference signals, which contain
infrared spectral information generated after passing through a sample.
commonly used interferometer is a Michelson interferometer. It consists of three
and when exposed to infrared radiation, they absorb the radiation at frequencies that
match their vibration modes. Measuring the radiation absorption as a function of
frequency produces a spectrum that can be used to identify functional groups and
Some impurities produce their own characteristic bands in infrared
region. Spectral measurements of these bands are used to determine conce
the impurities and their bonding with the host materials. In order to make
identification, the measured interferogram signal can not be interpreted directly. A
means of “decoding” the individual frequencies is required. This can be accomplished
known mathematical technique called the Fourier transformation
transformation is performed by the computer which then presents the user with the
desired spectral information for analysis.
Sample Analysis Process
Instrumentation
There are three basic spectrometer components in an FTIR
interferometer, and a detector.
Figure 3.1 Michelson interferometer
Interferometer divides radiant beams, generates an optical path difference
between the beams, and then recombines them in order to produce repetitive
interference signals measured as a function of optical path difference by a detector. As
the interferometer produces interference signals, which contain
infrared spectral information generated after passing through a sample.
commonly used interferometer is a Michelson interferometer. It consists of three
- 44 -
and when exposed to infrared radiation, they absorb the radiation at frequencies that
orption as a function of
frequency produces a spectrum that can be used to identify functional groups and
Some impurities produce their own characteristic bands in infrared
region. Spectral measurements of these bands are used to determine concentration of
In order to make
identification, the measured interferogram signal can not be interpreted directly. A
means of “decoding” the individual frequencies is required. This can be accomplished
Fourier transformation. This
transformation is performed by the computer which then presents the user with the
system: a radiation
Interferometer divides radiant beams, generates an optical path difference
recombines them in order to produce repetitive
interference signals measured as a function of optical path difference by a detector. As
the interferometer produces interference signals, which contain
infrared spectral information generated after passing through a sample. The most
commonly used interferometer is a Michelson interferometer. It consists of three

- 45 -
active components: a moving mirror, a fixed mirror, and a beam splitter (Figure 3.1).
The two mirrors are perpendicular to each other. The beam splitter is a semi-reflecting
device and is often made by depositing a thin film of germanium onto a flat KBr
substrate. Radiation from the broadband IR source is collimated and directed into the
interferometer, and impinges on the beam splitter.
(ii) Sample preparation
IR spectra can be measured using liquid, solid, or gaseous samples that are
placed in the beam of infrared light. A drop of a liquid can be placed as a thin film
between two salt plates made of NaCl or KBr, which are transparent to infrared light
at most important frequencies. A solid can be ground with KBr and pressed into a disk
that is placed in the light beam. Alternatively, a solid sample can be ground into a
pasty mull with paraffin oil. As with a liquid, the mull is placed between two salt
plates. Solids can also be dissolved in common solvents such as CH2Cl2, CCl4, or CS2
that do not have absorptions in the areas of interest. Gases are placed in a longer cell
with polished salt windows. These gas cells often contain mirrors that reflect the beam
through the cell several times for stronger absorption.
(iii) Working of an FTIR spectrometer
The basic instrument design is quite simple. Figure 3.2 (a) illustrates the schematic
diagram and (b) a typical FTIR spectrometer.
The normal instrumental process is as follows:
a. The Source: Infrared energy is emitted from a glowing black-body source. This
beam passes through an aperture which controls the amount of energy presented to the
sample (and, ultimately, to the detector).
b. The Interferometer: The beam enters the interferometer where the ‘spectral
encoding’ takes place. The resulting interferogram signal then exits the
interferometer.
c. The Sample: The beam enters the sample compartment where it is transmitted
through or reflected off of the surface of the sample, depending on the type of analysis

- 46 -
being accomplished. This is where specific frequencies of energy, which are uniquely
characteristic of the sample, are absorbed.
(a) (b)
Figure 3.2 (a) Schematic diagram of FTIR and (b) FTIR instrument
d. The Detector: The beam finally passes to the detector for final measurement. The
detectors used are specially designed to measure the special interferogram signal.
e. The Computer: The measured signal is digitized and sent to the computer where
the Fourier transformation takes place. The final infrared spectrum is then presented
to the user for interpretation and any further manipulation.
3.1.3 Analytical information of FTIR
FTIR can be analysed by two techniques namely: Qualitative and Quantitative.
(i) Qualitative analysis
The combination of the fundamental vibrations or rotations of various
functional groups and the subtle interactions of these functional groups with other
atoms of the molecule results in the unique, generally complex IR spectrum for each

- 47 -
individual compound. IR spectroscopy is mainly used in two ways: structural
elucidation and compound identification.
a. Structural Elucidation
Because of complex interactions of atoms within the molecule, IR absorption
of the functional groups may vary over a wide range. However, it has been found that
many functional groups give characteristic IR absorption at specific, narrow
frequency ranges regardless of their relationship with the rest of the molecule.
Generalized tables of the positions and relative intensities of absorption bands (Table
3.1) have been established and used to determine the functional groups present or
absent in a molecule. Correlation charts are available in many data books [1, 2].
b. Compound Identification
Since the IR spectrum of every molecule is unique, one of the most positive
identification methods of an organic compound is to find a reference IR spectrum that
matches that of the unknown compound.
Transmittance (T) is the ratio of radiant power (I) transmitted by the sample to
the radiant power (I0) incident on the sample. Absorbance (A) is the logarithm to the
base 10 of the reciprocal of the transmittance.
� = log�� �� = − log�� � = − log�� �
� (3.1)
The transmittance spectra provide better contrast between intensities of strong
and weak bands because transmittance ranges from 0 to 100 % T whereas absorbance
ranges from infinity to zero.
(ii) Quantitative analysis
The basis for quantitative analysis of absorption spectrometry is the
Bouguer–Beer–Lambert law, commonly called Beer’s law [3]. For a single compound
in a homogeneous medium, the absorbance at any frequency is expressed as,
� = ��� (3.2)
Where A is the measured sample absorbance at the given frequency, a is the
molecular absorptivity at the frequency, b is the path length of source beam in the

- 48 -
sample, and c is the concentration of the sample. This law basically states that the
intensities of absorption bands are linearly proportional to the concentration of each
component in a homogeneous mixture or solution.
3.1.4 Interpretation of Infrared Spectra
The interpretation of infrared spectra involves the correlation of absorption
bands in the spectrum of an unknown compound with the known absorption
frequencies for types of bonds. Table 3.1 shows some characteristic examples of an
absorption band in the spectrum.
Table 3.1 Characteristic infrared absorption frequencies
No. Bond Compound Type Frequency range (cm-1)
1 C-H Alkanes
2960-2850 (s*) stretch 1470-1350 (v#) scissoring and
bending
CH3 Umbrella Deformation 1380 (mx-w+) - Doublet-isopropyl,
t-butyl
2 C-H Alkenes 3080-3020 (m) stretch
1000-675 (s) bend
3 C-H Aromatic Rings 3100-3000 (m) stretch
Phenyl Ring Substitution Bands 870-675 (s) bend Phenyl Ring Substitution Overtones 2000-1600 (w) - fingerprint region
4 C-H Alkynes 3333-3267 (s) stretch
700-610 (bΔ) bend 5 C=C Alkenes 1680-1640 (m, w) stretch 6 C≡C Alkynes 2260-2100 (w) stretch 7 C=C Aromatic Rings 1600, 1500 (w) stretch
8 C-O Alcohols, Ethers,
Carboxylic acids, Esters 1260-1000 (s) stretch
9 C=O Aldehydes, Ketones, Carboxylic
acids, Esters 1760-1670 (s) stretch
10 O-H
Monomeric - Alcohols, Phenols 3640-3160 (s, b) stretch Hydrogen-bonded -Alcohols,
Phenols 3600-3200 (b) stretch
Carboxylic acids 3000-2500 (b) stretch
11 N-H Amines 3500-3300 (m) stretch 1650-1580 (m) bend
12 C-N Amines 1340-1020 (m) stretch 13 C≡N Nitriles 2260-2220 (v) stretch
14 NO2 Nitro Compounds 1660-1500 (s) asymmetrical stretch 1390-1260 (s) symmetrical stretch
*s - strong, #v - variable, xm - medium, +w – weak, and Δb – broad.

- 49 -
3.1.5 Advantages and Limitations of FTIR spectrometer
(i) Advantages
The FT-IR spectrometer has several major advantages over the dispersive
instrument. Its sensitivity is better because it measures all frequencies simultaneously
rather than scanning through the individual frequencies. Less energy is needed from
the source and less time (typically 1 to 2 seconds) is needed for a scan. Several scans
can be completed in a few seconds and averaged to improve the signal. Resolution
and accuracy are also improved because a laser beam is used alongside the IR beam to
control the speed of the moving mirror and to time the collection of data points. The
light beam is a precise frequency reference that keeps the spectrometer accurately
calibrated.
(ii) Limitations
Few limitations of FTIR spectrometer are listed below:
1) Minimal elemental information is given for most samples.
2) Background solvent or solid matrix must be relatively transparent in the
spectral region of interest.
3) Molecule must be active in the IR region; i.e. when exposed to IR radiation, a
minimum of one vibrational motion must alter the net dipole moment of the
molecule in order for absorption to be observed.
3.2 Differential Thermal Analysis (DTA)
Differential thermal analysis (DTA) is a thermo analytic technique. The
method has been used predominantly for the determination of inorganic systems.
3.2.1 Working Principle
In DTA, the material under study and an inert reference (which does not go
through phase transition in the temperature range of interest) are heated (or cooled)
under identical conditions, while recording any temperature difference between
sample and reference. This differential temperature is then plotted against time, or

- 50 -
against temperature (DTA curve or thermo gram). Changes in the sample, either
exothermic or endothermic, can be detected relative to the inert reference. Thus, a
DTA curve provides data on the transformations that have occurred, such as glass
transitions, crystallization, melting and sublimation [4]. Differential temperatures can
arise between two inert samples when their response to the applied heat-treatment
may not identical. So DTA can also be used to study thermal properties and phase
changes which do not lead to a change in enthalpy.
3.2.2 Instrumentation
(i) Apparatus
The DTA cell consists of mainly four parts:
1. Sample holder comprising thermocouples, sample containers and a ceramic or
metallic block
2. Furnace
3. Temperature programmer
4. Recording system
The essential requirements of the furnace are that it should provide a stable
and sufficiently large hot-zone and must be able to respond rapidly to commands from
the temperature programmer. A temperature programmer is essential in order to
obtain constant heating rates. The recording system must have a low inertia to
faithfully reproduce variations in the experimental set up. Figure 3.3 shows the
experimental set up of a DTA cell.
The sample holder assembly consists of a thermocouple each for the sample
and reference, surrounded by a block to ensure an even heat distribution. The sample
is contained in a small crucible designed with an indentation on the base to ensure a
snug fit over the thermocouple bead. The crucible may be made of materials such as
Pyrex, silica, nickel or platinum, depending on the temperature and nature of the tests
involved. The thermocouples should not be placed in direct contact with the sample to
avoid contamination and degradation, although sensitivity may be compromised.

- 51 -
Figure 3.3 (a) Concept sketch of a DTA cell and (b) DTA instrument
Metallic blocks are less prone to base-line drift when compared with ceramics
which contain porosity. On the other hand, their high thermal conductivity leads to
smaller DTA peaks. The sample assembly is isolated against electrical interference
from the furnace wiring with an earthed sheath, often made of platinum-coated
ceramic material. The sheath can also be used to contain the sample region within a
controlled atmosphere or a vacuum. During experiments at temperatures in the range
200 to 500°C, problems are encountered in transferring heat uniformly away from the
specimen. These may be mitigated by using thermocouples in the form of flat discs to
ensure optimum thermal contact with the now flat- bottomed sample container, made
of aluminium or platinum foil. To ensure reproducibility, it is then necessary to ensure
that the thermocouple and container are consistently located with respect to each
other.
The effects of specimen environment, composition, size and surface-to-
volume ratio all affect powder decomposition reactions, whereas these particular
variables may not affect solid-state phase changes. Experiments are frequently
performed on powders so the resulting data may not be representative of bulk
samples, where transformations may be controlled by the build up of strain energy.
The packing state of any powder sample becomes important in decomposition
(a) (b)

- 52 -
reactions and can lead to large variations between apparently identical samples. In
some circumstances, the rate of heat evolution may be high enough to saturate the
response capability of the measuring system; it is better than to dilute the test sample
with inert material. For the measurement of phase transformation temperatures, it is
advisable to ensure that the peak temperature does not vary with sample size. The
shape of a DTA peak does depend on sample weight and the heating rate used.
Lowering the heating rate is roughly equivalent to reducing the sample weight; both
lead to sharper peaks with improved resolution, although this is only useful if the
signal to noise ratio is not compromised. The influence of heating rate on the peak
shape and disposition can be used to advantage in the study of decomposition
reactions, but for kinetic analysis it is important to minimize thermal gradients by
reducing specimen size or heating rate.
(ii) Interpretation and Presentation of Data
A simple DTA curve may consist of linear portions displaced from the
abscissa because the heat capacities and thermal conductivities of the test and
reference samples are not identical, and of peaks corresponding to the evolution or
absorption of heat following physical or chemical changes in the test sample. The test
results are a graph of the DTA signal (micro-volts) on the Y-axis plotted versus the
sample temperature in °C on the X-axis. The sample graph of enhanced output for
Ceramics-Structe Clay is shown in Figure 3.4.
Figure 3.4 Differential Thermal graph of the Ceramic-structure clay

- 53 -
3.3 Thermo Gravimetric Analysis (TGA)
Thermo gravimetric Analysis (TGA) continuously monitors the weight of a
sample during isothermal or dynamic temperature scans over the range from 30° C to
1000° C in an air, nitrogen, oxygen, or specialty atmosphere. Its principal uses include
measurement of a material's thermal stability and composition. Thermo gravimetric
analysis instruments are routinely used in all phases of research, quality control and
production operations.
3.3.1 Working Principle
Thermo Gravimetric analysis (TGA) technique uses heat to force reactions and
physical changes in materials. TGA provides quantitative measurement of mass
change in materials associated with transition and thermal degradation. TGA records
change in mass from dehydration, decomposition, and oxidation of a sample with time
and temperature. Characteristic thermo-gravimetric curves are given for specific
materials and chemical compounds due to unique sequence from physicochemical
reactions occurring over specific temperature ranges and heating rates. These unique
characteristics are related to the molecular structure of the sample [5]. When used in
combination with FTIR, TGA/FTIR is capable of detailed FTIR analysis of evolved
gases produced from the TGA.
3.3.2 Instrumentation
TGA analyzer consists of a high-precision balance with a pan (generally
platinum) loaded with the sample. The pan is placed in a small electrically heated
oven with a thermocouple to accurately measure the temperature. The atmosphere
may be purged with an inert gas to prevent oxidation or other undesired reactions. A
computer is used to control the instrument. Figure 3.5 shows the instrument for TGA
and a typical characteristic output.

- 54 -
Figure 3.5 (a) An instrument for TGA and (b) Typical Characteristics curve of TGA
3.3.3 Analysis of TGA curve
TG Analysis can be carried out by raising the temperature gradually and
plotting weight (percentage) against temperature. The temperature in many testing
methods routinely reaches 1000°C or greater, but the oven is so greatly insulated that
an operator would not be aware of any change in temperature even if standing directly
in front of the device. After the data are obtained, curve smoothing and other
operations may be done such as to find the exact points of inflection. Simultaneous
TGA-DTA/DSC measures both heat flow and weight changes (TGA) in a material as
a function of temperature or time in a controlled atmosphere. Simultaneous
measurement of these two material properties not only improves productivity but also
simplifies interpretation of the results. The complementary information obtained
allows differentiation between endothermic and exothermic events which have no
associated weight loss (e.g., melting and crystallization) and those which involve a
weight loss (e.g., degradation). Hi-resolution TGA technique is often employed to
obtain greater accuracy in areas where the derivative curve peaks. In this method,
temperature increase slows as weight loss increases. This is done so that the exact
temperature at which a peak occurs can be more accurately identified.
(a) (b)

- 55 -
As many weight loss curves look similar, the weight loss curve may require
transformation before results may be interpreted. A derivative weight loss curve can
be used to tell the point at which weight loss is most apparent. Again, interpretation is
limited without further modifications and deconvolution of the overlapping peaks may
be required.
3.4 X-Ray Diffraction (XRD)
In a crystalline solid, the constituent particles (atoms, ions or molecules) are
arranged in a regular order. An interaction of a particular crystalline solid with X-rays
helps in investigating its actual structure. Crystals are found to act as diffraction
gratings for X-rays and this indicates that the constituent particles in the crystals are
arranged in planes at close distances in repeating patterns. The phenomenon of
diffraction of X-rays by crystals was studied by W. L. Bragg and his father W. H.
Bragg in 1913. They used crystals of zinc sulphide (ZnS) for this purpose.
3.4.1 Basic Theory
Bragg gave a mathematical equation to establish a relationship between
wavelength of the incident X-ray, the distance between the layers and the angle of
diffraction.
�� = 2� sin � (3.3)
Here, � = wavelength of X-ray used
� = Angle between incident X-rays and plane of the crystal. The diffracted
beam makes an angle 2θ.
� = Distance between planes of the constituent particles in a crystal.
� = An integer (1, 2, 3, 4, …etc) which represents the serial order of diffracted
beams.
Bragg's equation can be used to calculate the distances between repeating
planes of the particles in a crystal. Similarly, if interplanar distances are given, the
corresponding wavelengths of the incident beam of X-ray can be calculated.

- 56 -
In case of fine particles, with reduction in the size of the particles, the XRD
lines get broadened, which indicates clearly that particle size has been reduced.
Information of the particle size is obtained from the full width at half maximum
(FWHMs) of the diffraction peaks.
The FWHMs (β) can be expressed as a linear combination of the contributions
from the strain (ε) and particle size (L) through the following relation:
� ��� �� = �
+ " �#$ �� (3.4)
3.4.2 XRD instrumentation
A typical powder XRD instrument consist of four main components such as
X-ray source, specimen stage, receiving optics and X-ray detector as shown in Figure
3.6. The source and detector with its associated optics lie on the circumference of
focusing circle and the sample stage at the centre of the circle. The angle between the
plane of the specimen and the X-ray source is θ (Bragg’s angle) and the angle
between the projection of X-ray and the detector is 2θ. For the XRD analysis, fine
powder samples can be mounted on the sample holder and the powder was assumed to
consist of randomly oriented crystallites. When a beam of X-ray is incident on the
sample, X-rays are scattered by each atom in the sample. If the scattered beams are in
phase, these interfere constructively and one gets the intensity maximum at that
particular angle. The atomic planes from where the X-rays are scattered are referred to
as ‘reflecting planes’.
Figure 3.6 Schematic of the X-ray diffraction by a crystal.

- 57 -
Figure 3.7 A schematic representation of X-ray diffraction
3.4.3 XRD data analysis
After recording the X-ray diffraction pattern, first step involves the indexing
of XRD peaks. The indexing means assigning the correct Miller indices to each peak
of the diffraction pattern.
There are three main methods for indexing of X-ray diffraction pattern:
(i) Comparing the measured XRD pattern with the standard data base (JCPDS-cards)
(ii) Analytical methods
(iii) Graphical methods.
X-ray diffraction (XRD) is used to check the monophasic nature of the
samples. XRD is the most essential technique to investigate the structural aspects of
the material. It helps to identify the presence of different phases, including the
impurities and unreacted components in a given material. Such information provides a
very useful guideline towards modification of synthesis procedures. Analysis of XRD
data gives the unit cell parameters of the system. In the present study, X-ray
diffraction was extensively used to investigate the course of the reaction during the
synthesis of the samples and to change the heat treatment procedures accordingly.

- 58 -
Figure 3.8 Typical XRD instrument
� Important Parameters from XRD Data
Analysis of XRD data provides some very useful information about the
important parameters of the sample. Some of them are discussed below.
a. Unit cell volume
X-ray diffraction provides us the lattice cell parameters of crystal unit cell and
therefore its volume.
Volume of a cubic unit cell,
% = �&, ()ℎ+,+ � = � = �. (3.5)
Volume of a tetragonal unit cell,
% = �/�, ()ℎ+,+ � = �. (3.6)
and Volume of a hexagonal unit cell,
% = √&/ �/� (3.7)
Where a, b, and c are the unit cell dimensions called unit cell or lattice parameters.

- 59 -
b. X-ray density
1 − ,�2 �+�3452 = 6789:; <= ;:7 >;<?@ 8A BA8; C7DDE<DB?7 <= BA8; C7DD (3.8)
F = GH IJE ≡ �.MM�N/
E� Å& (3.9)
Where, ρ = density (gm cm-3)
A = atomic weight of all atoms in the unit cell
N = Avogadro number
V = Vol. of unit cell (cm3)
V0 = Vol. of unit cell (Å3)
c. Porosity
By comparing X-ray density to that of macroscopic density of a pressed and
sintered pellet one can calculate the percent porosity in the compact. Porosity can be
evaluated by using equation [6],
P = �1 − RS × 100 % (3.10)
Where, d is the bulk density of the material can be calculated by mass/volume
of the samples in pellet form or by Archimedes principle.
d. Particle size
When the particle size of the individual crystal is less than 100 Å3, the term
particle size is used. Crystals of this size range cause broadening of the Bragg peak,
the extent of the broadening is given by
W = �.XY �� ��� � (3.11)
Where, B = broadening of the diffraction line (Bragg peak) measured at full width at
half of its maximum intensity (FWHM) (in radian)
λ = wavelength of target
β = diameter of the crystal particle

- 60 -
3.5 Scanning Electron Microscope (SEM)
The scanning electron microscope (SEM) is a type of electron microscope
capable of producing high-resolution images of a sample surface. Due to the manner
in which the image is created, SEM images have a characteristic three dimensional
appearance and are useful for observing the surface structure of the sample. The
microstructures of hexaferrites were examined using a scanning electron microscope,
SEM.
3.5.1 Principle of SEM
Scanning electron microscope (SEM) consists of an electron gun and
electromagnetic lens system to study the surface structure and morphology of
solids. A well defined electron beam impinges on the specimen and leads to
generation of secondary electrons, back scattered electrons, absorbed electrons,
characteristic X-rays etc. These electrons can be detected by suitable detectors
and give information about the surface structure and morphology of the specimens.
The characteristic X-rays generated are used for the identification and estimation
of different elements present in the specimen by energy dispersive spectrometer
(EDS) and wave length dispersive spectrometer (WDS). The depth of focus is much
larger than the optical microscope image even at lowest magnifications is one of the
major advantages of SEM.
3.5.2 Working of an SEM instrument
Electrons from a thermionic or field-emission cathode are accelerated by a
voltage of 1-50 kV between cathode and anode. The smallest beam cross section at
the gun (the crossover) with a diameter of the order of 10-50 µm for thermionic and
100-100nm for field-emission guns, is demagnified by two or three stage electro-
magnetic lens system, so that an electron probe of diameter 1-10 nm carrying current
of 10 -10 to 10 -12 A is formed at the specimen surface.
A deflection coil system in front of the last lens scans the electron probe in a
raster across the specimen and in synchronism with the electron beam of a separate
cathode ray tube (CRT). The intensity of the CRT is modulated by one of the signals

- 61 -
recorded to form an image. The magnification can be increased simply by decreasing
the scan-coil current and keeping image size on CRT constant.
An advantage of SEM is the wide variety of electron -specimen interactions
that can be used to form an image to give qualitative and quantitative information.
The large depth of focus, excellent contrast and the straight forward preparation of
solid specimen are advantages of SEM.
Here an electron beam scans the object (the specimen) and because of
synchronized scans of electron beam and the CRT screen (nowadays, monitor), there
is one-to-one correspondence between the spot on the specimen and the spot on the
screen. Unlike Optical microscopy, SEM requires the vacuum environment and
specimen surface to be electrically conductive. Figure 3.9 (a) shows the general
schematic diagram of SEM.
Figure 3.9 (a) Schematic diagram of Scanning Electron Microscope (SEM) BSE=back
scattered electrons, SE=secondary electrons, SC=specimen current, EBIC=electron-beam-
induced current, X=x-rays, CRT=cathode-ray tube and (b) Typical SEM instrument
The electron beam is produced by hair-pin shaped tungsten (W) filament by
thermionic emission. The acceleration voltage of 5 to 50 kV can be applied between
anode and cathode and hence we get the electron beam of such energy. This diverged
(a) (b)
- 62 -
electron beam passes through a pair of electro-magnetic lenses (coils) and finely
passes through probe forming lens, which makes the beam in a form of a fine probe
(~10 nm diameter). This fine electron probe scans on the specimen area (marked as
lines in Figure 3.9 (a)) in a linear manner. Another electron beam is in
synchronization with this beam which scans on the CRT (or monitor) with the help of
same scan generator. In SEM, the formation of image takes place because of electron
beam-specimen interaction [7].
3.5.3 Sample preparation
Specimen preparation is crucial for specimens to be examined under SEM as
the specimen have to be occupied within the system vacuum and the incident beam is
high voltage electron beam (of the order of thousands of Volts). The specimen (or its
surface) must be electrically conductive and vacuum compatible.
For conventional imaging in the SEM, specimens must be electrically
conductive, at least at the surface, and electrically grounded to prevent the
accumulation of electrostatic charge at the surface. Metallic samples and alloys can be
examined as it is but for organic materials, insulators and non conducting materials
(like poly carbonates, rubber, plastics, concrete, ceramics, biological specimens such
as bacteria and other biological specimens), objects tend to charge when scanned by
the electron beam, and especially in secondary electron imaging mode, this causes
scanning faults and other image artifacts. They are therefore usually coated with an
ultra-thin (about 100-1000 Å) layer of electrically-conducting material, like carbon,
aluminium, gold, or Au-Pd alloy. These coatings/depositions are applied to the
specimen by high temperature evaporation or by plasma discharge techniques.
Normally carbon coating and Au-Pd coating by magnetron sputtering plasma
discharge is used. Two reasons for coating, one is to prevent charging of the
specimen, and other is to increase signal and surface resolution, especially with
samples of low atomic number (Z). Gold coating is most widely used because gold
has a high atomic number and sputter coating with gold produces high topographic
contrast and resolution [8]. The improvement in resolution arises because
backscattering and secondary electron emission near the surface are enhanced and
thus an image of the surface is formed. Elastic and inelastic scattering are the

- 63 -
elementary atomic interaction processes takes place when electron beam interacts
with the specimen. The incident electrons interact with specimen atoms and are
significantly scattered by them.
3.5.4 Electron-specimen interaction
Electron beam -specimen interaction gives various signals which can be used
to form images and also can be used for other important information.
In inelastic scattering, the trajectory of the incident electron is only slightly
perturbed, but energy is lost through interactions with the orbital electrons of the
atoms in the specimen. ‘Loss’ of kinetic energy (of the primary electron) is mainly
caused by the interaction with the electrons of atoms of the specimen.
3.5.5 Magnification, brightness and contrast of the SEM images
Electron images are obtained by rastering the electron beam across the
specimen surface using the deflection coils inside the objective lens and
synchronously rastering the output signal of the detector on a cathode-ray tube (CRT).
The ratio of the area rastered on the specimen to that of the CRT gives the
magnification. For example, a rastered area of 200 µm2 (200 x 10-6 m2) displayed on
CRT with an area of 20 cm (200,000 x 10-6 m2) yields a magnification of 1000x. This
is a very different process than the production of an image by an optical microscope.
Electronic images are sequentially "constructed" during the rastering of the beam,
whereas in optical systems all parts of the sample are imaged simultaneously.
Brightness can be increased /decreased by amplifying /decreasing the signal from the
sample and it can be affected by topography, composition, electrical conductivity, and
other properties of the sample. Contrast reflects the variation in the signal from point
to point. Contrast can also be enhanced by electronically increasing the difference
between small and large signals. Working distance (WD), probe current and probe
diameter, incorrect electron gun alignment, astigmatism, diffused scattering of
electrons from the edges (edge effect), electrostatic charging of the sample, external
disturbances(magnetic fields, flooring, improper grounding) are factors affecting the
quality of the image. The SEM image looks three dimensional Because of SEM's
ability to focus up to certain depth and hence the images can be easily interpreted.
- 64 -
3.5.6 Detectors
There are number of detectors around the specimen in the specimen chamber
which collects different signals for the required information. The most common
imaging mode collects low-energy (< 50 eV) secondary electrons that are ejected
from the k-orbitals of the specimen atoms by inelastic scattering interactions with
beam electrons. Due to their low energy, these electrons originate within a few
nanometers from the sample surface [9]. The electrons are detected by a type of
scintillator-photomultiplier system known as an Everhart-Thornley detector [10]. The
secondary electrons are first collected by attracting them towards an electrically-
biased grid at about + 400 V, then further accelerated towards a phosphor or
scintillator positively biased to about + 2,000 V. The accelerated secondary electrons
are now sufficiently energetic to cause the scintillator to emit flashes of light
(cathode-luminescence) which are conducted to a photomultiplier outside the SEM
column via a light pipe and a window in the wall of the specimen chamber. The
amplified electrical signal output by the photomultiplier is displayed as a two-
dimensional intensity distribution that can be viewed and photographed on an
analogue video display, or subjected to analog-to-digital conversion and displayed
and saved as a digital image. This process relies on a raster-scanned primary beam.
The brightness of the signal depends on the number of secondary electrons reaching
the detector. If the beam enters the sample perpendicular to the surface, then the
activated region is uniform about the axis of the beam and a certain number of
electrons ‘escape’ from within the sample. As the angle of incidence increases, the
‘escape’ distance of one side of the beam will decrease, and more secondary electrons
will be emitted. Thus steep surfaces and edges tend to be brighter than flat surfaces,
which results in images with a well-defined, three-dimensional appearance. Image
resolution less than 0.5 nm is possible using SEM technique.
3.6 Vibrating Sample Magnetometer (VSM)
3.6.1 Basic Theory
Ferrite exhibits ferrimagnetisms. This means there is a net magnetic moment
in molecular level as a result of super exchange interaction between Metal and oxygen
- 65 -
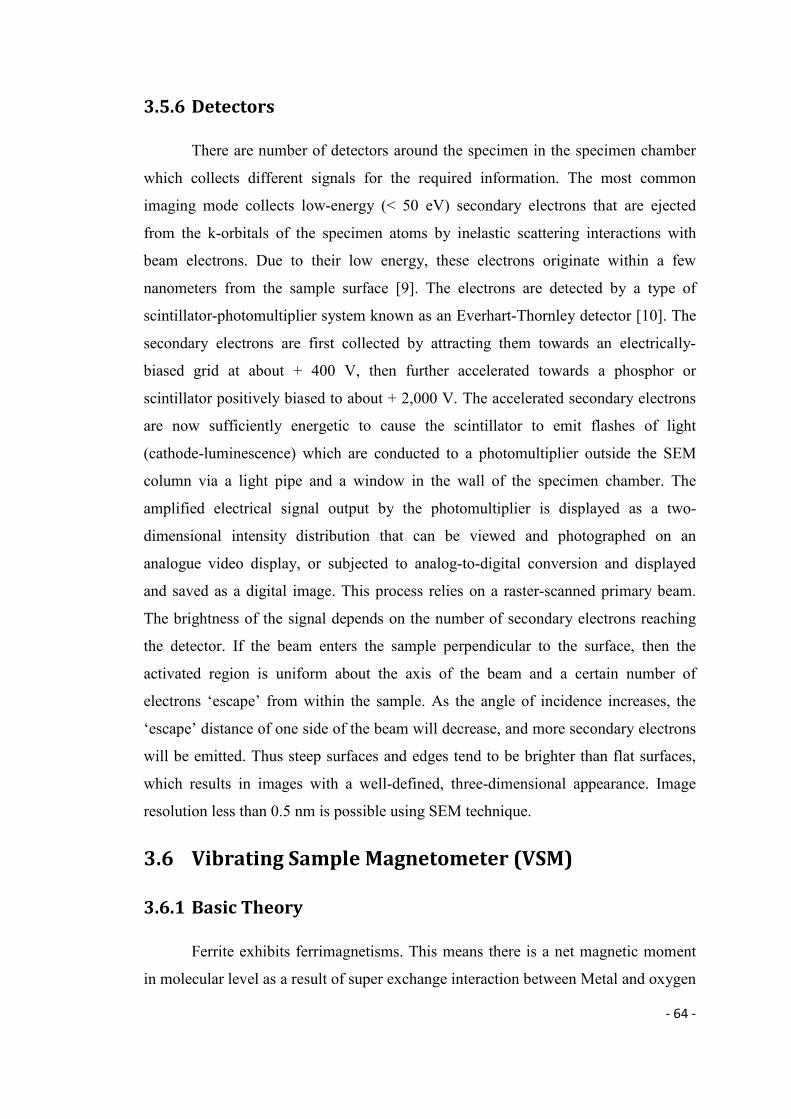
ions. In a bulk ferrite, there exist domains called “Wiess Domains” in which all these
molecular magnets are aligned in one direction. Domain walls separates different
domains aligned in random directions and in the presence of an external magnetic
field these moments can be forced to align in one direction as shown in Figure 3.10.
Some energy has to be spent for this process and the magnetization always lags
behind the magnetizing field and results in a magnetization loop called as B-H Loop.
Figure 3.10 Alignment of domains with an applied magnetic field
In the absence of an applied magnetic field, the infinitesimal magnetic dipoles
in most materials are randomly oriented, giving a net macroscopic magnetization of
zero Figure 3.10 (A). When an external magnetic field is applied, the magnetic
dipoles have a tendency to align themselves with the applied magnetic field (Figure
3.10 (B) and (C)). Material is said to be magnetically saturated when all the magnetic
dipoles present are aligned in one direction (Figure 3.10 (D)).
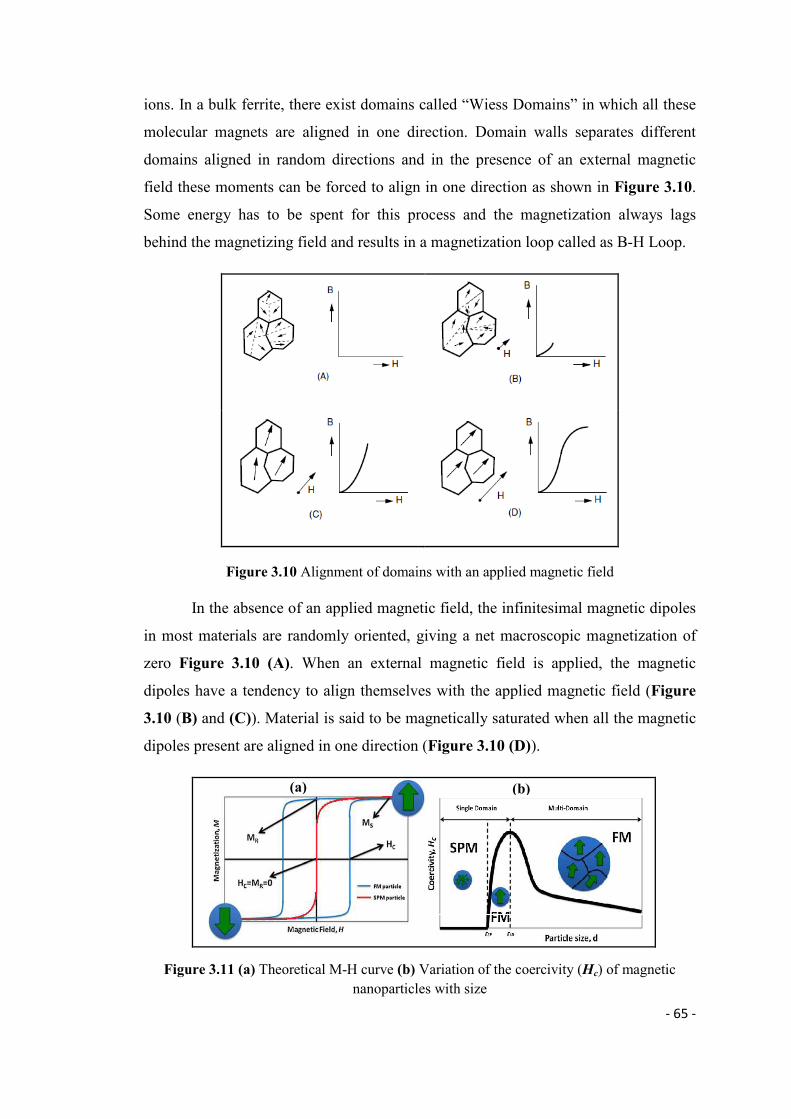
Figure 3.11 (a) Theoretical M-H curve (b) Variation of the coercivity (Hc) of magnetic
nanoparticles with size
(a) (b)

- 66 -
Figure 3.11 (a) shows a theoretical magnetization, (M) versus magnetic field,
(H) curve for superparamagnetic (SPM) and ferromagnetic nanoparticles (FM); where
the coercive field (Hc), the saturation magnetization (MS) and the remanent
magnetization (MR) parameters are indicated. Figure 3.11 (b) indicates the relation
between particle size and coercivity.
3.6.2 Principle
A magnetic sample in oscillatory motion creates a time varying magnetic field
in its surrounding due to its magnetization, and a voltage will be induced in a coil
placed close to the sample. This principle is used in a vibrating sample magnetometer
(VSM), also called Foner magnetometer [11] after its inventor Simon Foner .
3.6.3 Working of an VSM instrument
The mechanism of the VSM is to measure the induced magnetization of the
samples by mechanically vibrating them in a uniform magnetic field. The magnetic
moment of the sample is measured by generating a signal voltage in pick up coils due
to the time varying flux emanating from the vibrating sample. The output
measurement displays the magnetic moment M as a function of the field H. A
schematic diagram of the VSM instrument is shown in Figure 3.12 (a) and Figure
3.12 (b) shows a photograph of an instrument.
Figure 3.12 (a) Schematic diagram of a VSM instrument and (b) Photograph of a VSM
instrument
(a) (b)

- 67 -
The magnetic (dipole) moment is measured in the unit [Am2]. If the sample
weight is known then one can calculate the magnetic moment per unit weight in
[Am2/kg]. If also the density or the volume of the sample is known, it is possible to
calculate the magnetic moment per unit volume which corresponds to the
magnetization in [A/m].
3.7 Measurement of Dielectric properties
The measurement of complex dielectric properties of materials at radio
frequency has gained increasing importance especially in the research fields, such as
material science, microwave circuit design, absorber development, biological
research, etc. Dielectric measurement is important because it can provide the
electrical or magnetic characteristics of the materials, which proved useful in many
research and development fields [12, 13]. Many techniques have been developed to
measure these complex properties such as techniques in time domain or frequency
domain with one port or two ports, etc. Every technique is limited to specific
frequencies, materials and applications by its own constraint.
3.7.1 Dielectric measurement techniques
Measurement of dielectric properties involves measurements of the complex
relative permittivity (εr) and complex relative permeability (µr) of the materials. A
complex dielectric permittivity consists of a real part and an imaginary part. The real
part of the complex permittivity, also known as dielectric constant (ε”) is a measure
of the amount of energy from an external electrical field stored in the material. The
imaginary part is zero for lossless materials and is also known as loss factor (tan δ). It
is a measure of the amount of energy loss from the material due to an external electric
field. The loss factor (or loss tangent/ dissipation factor, tan δ) represents the ratio of
the imaginary part to the real part of the complex permittivity.
3.7.2 Sample preparation
The disc shaped specimens are used for Dielectric measurements. The flat
faces of disc are lapped, a record of the thickness and the diameter is done and then

- 68 -
the parallel faces are painted with silver paste. Silver paste is applied to both the
surfaces (front and back) to provide electrical contact.
The sample is first inserted in the cell and the electrodes closed with the
micrometer until they just touch the sample. The electrodes should not be forced
against the sample. The micrometer is turned with a light finger touch and the
electrometer setting recorded. Experimental set-up is shown schematically in Figure
3.14. The capacitance and the dielectric loss tangent values of the ceramics can be
determined simultaneously. The dielectric constants of samples can be determined
using various equations.
Figure 3.13 Schematic representation of the set-up for dielectric property investigations
Figure 3.14 Precision LCR meter with sample holder and sample pallets
Many materials have unique sets of electrical characteristics which are
dependent on its dielectric properties. Precision measurements of these properties can
provide valuable information in the manufacture or use of these materials.

- 69 -
The real dielectric constant (ε’) from the measured capacitance (C) and the
geometry of the sample can be calculated by equation,
Z = [�[′ H; (3.12)
Where, [� = dielectric permittivity of space = 8.854 x 10⁻¹⁴ Farad/cm
A = metalized area of one circular face, cm2
t = thickness of the ceramic, cm.
3.8 Swift Heavy Ion (SHI) Irradiation
Research on the influence of irradiation on the magnetic properties of ferrites
has been a subject of great interest with the application of these as memory storage
units in equipment operating under irradiation. SHI irradiation has been carried out on
few hexaferrite amples at Inter University Accelerator Centre (IUAC), New Delhi,
India.
3.8.1 Pelletron
The main building at IUAC houses the Pelletron tower, beam hall and the
laboratory complex. The 15UD Pelletron [14], a versatile heavy ion tandem
electrostatic accelerator is installed in a vertical configuration in an insulating tank of
26.5 meter height and 5.5 meter diameter. The accelerator tank is filled with an
insulating, gas sulphur hexafluoride (SF6) maintained at a pressure of 6-7 atmosphere.
A schematic diagram of 15UD Pelletron is shown in Figure 3.15. In this machine the
negative ions are produced and preaccelerated to ~ 300 keV by Cesium sputter ion
source known as SNICS (Source of Negative Ions by Cesium Sputtering). Now it has
been replaced by name MCSNICS (Multi Cathode SNICS).
The ions are mass analyzed by dipole magnet called injector magnet and are
turned vertically downward direction. The ions then enter the strong electric field
inside the accelerator. A terminal shell is located at the centre of the tank which can
be charged to a high voltage (~ 15 MV) by a pellet charging system. The negative
ions on traversing through the accelerating tubes from the column top of the tank to
the positive terminal get accelerated. On reaching the terminal they pass through a

stripper (foil or gas) that removes some electrons from the negative ions thus
transforming the negative ions into the posit
number A >50), the lifetimes of the carbon foils used in stripper are limited to a few
hours due to radiation damage. Therefore a gas filled canal or a combination of the
gas stripper followed by a foil stripper i
positive ions are then repelled away from the positively charged terminal and are
accelerated to ground potential to the tank.
Figure 3.
In this way, same terminal potential is used twice to accelerate the ions.
Therefore this accelerator is called tandem Pelletron accelerator. The final energy of
the emerging ions from the accelerator is given by
stripper (foil or gas) that removes some electrons from the negative ions thus
transforming the negative ions into the positive ions. For very heavy ions (
>50), the lifetimes of the carbon foils used in stripper are limited to a few
hours due to radiation damage. Therefore a gas filled canal or a combination of the
gas stripper followed by a foil stripper is used for heavy ions. The transformed
positive ions are then repelled away from the positively charged terminal and are
accelerated to ground potential to the tank.
Figure 3.15 The Pelletron Accelerator at IUAC
same terminal potential is used twice to accelerate the ions.
Therefore this accelerator is called tandem Pelletron accelerator. The final energy of
the emerging ions from the accelerator is given by
_8 = _R7C`<; + (1 + a8. %
- 70 -
stripper (foil or gas) that removes some electrons from the negative ions thus
ive ions. For very heavy ions (i.e. atomic
>50), the lifetimes of the carbon foils used in stripper are limited to a few
hours due to radiation damage. Therefore a gas filled canal or a combination of the
s used for heavy ions. The transformed
positive ions are then repelled away from the positively charged terminal and are
same terminal potential is used twice to accelerate the ions.
Therefore this accelerator is called tandem Pelletron accelerator. The final energy of
(3.13)

- 71 -
Where, Ei is the energy of the ion having a charge state qi after stripping; V is
the terminal potential in MV and Edecpot is the deck potential of the SNICS source. On
exiting from the tank, the ions are bent into horizontal plane by analyzing magnet.
Figure 3.16 A schematic diagram represents the principle of acceleration of ions in Pelletron
This magnet works as an energy analyzer and depending on the dipole
magnetic field, ions of particular energy travel in the horizontal direction. The
switching magnet diverts the high-energy ion beam into desired beam line of the
beam hall. The ion beam is kept centred and focused using steering magnets and
quadruple triplet magnets. The beam line of the accelerator is in ultra vacuum
condition (~10-10 mbar). The beam is monitoring by beam profile meter (BPM) and
the current is observed by means of Faraday cups. Entire machine is computer
controlled and is operated from the control room. The accelerator can accelerate an
ion from Proton to Uranium from few MeV to hundreds of MeV (200 MeV)
depending on the ion.

- 72 -
Figure 3.17 Schematic of a Fast closing system
3.8.2 Material Science Beam Line
The accelerated beam of desired ions from the Pelletron is brought to the beam
hall and switched to any one of the seven beam lines using the switching magnet. The
Material Science beam line is at 15º to the right with respect to the zero degree beam
line. This beam line houses three chamber-high vacuum chamber, ultra high vacuum
chamber and goniometer chamber. The high vacuum chamber is a cylindrical shaped
multiport stainless steel chamber.
Figure 3.18 Material Science Beam Line
- 73 -
Most of the irradiation experiments are performed in high vacuum chamber. A
typical vacuum of 1 x 10⁻⁶ mbar is generally maintained during irradiation. The
samples to be irradiated are mounted on the four sides of the target ladder (on copper
block). The whole body of the ladder is made stainless steel and a perforated square
copper block is brazed at the end of the ladder. The target ladder is mounted through a
Wilson seal from the top flange of the chamber. This top flange is connected to the
chamber through a flexible bellow that can expand up to 11 cm from its minimum
position. A stepper motor in conjunction with suitable mechanical assembly is used to
control the up and down motion of the ladder. The beam on the ladder can be
observed by observing the luminescence of the beam on the quartz crystal mounted on
all sides of the ladder.
After the observation of the beam on the quartz, the samples to be irradiated
are brought to the same position as that of the quartz by moving the ladder in the
desirable position. A CCD camera is attached to one of the ports of the chamber for
viewing the sample and the quartz position. The positions can be monitored using
close circuit television (CCTV) in the data acquisition room. The magnetic scanner
that can sweep the beam (25 mm in y-direction and 10 mm in x-direction) ensures the
sample ladder, which is kept at a negative potential of 120 V. This enclosure
suppresses the secondary electrons coming out of sample during irradiation. An
opening in the suppressor allows the ion beam to fall on the sample. The total number
of particles/charges falling on the sample can be estimated by a combination of the
current integrator and the pulse counter (Faraday cup) from which the irradiation
fluence can be measured.
The second chamber, UHV chamber contains facilities like in-situ scanning
tunnelling microscopy (STM) for in-situ surface studies and residual gas analyzer
(RGA) for ion beam induced desorption. Third chamber is the goniometer chamber,
which incorporates the in-situ X-ray reflectivity (XRR), large area position sensitive
detector for Elastic recoil detector analysis (ERDA) and other channelling facilities.
The irradiation experiments were performed in high vacuum chamber, with a
typical vacuum maintained at 1 x 10⁻⁶ mbar. The reason for requiring vacuum is to
avoid any collision of the particle (beam) with gas molecules. The samples to be

- 74 -
irradiated were mounted on the four sides of the target ladder (on copper block),
which were separated from each other by a distance of about 1 cm.
The counts calculated for the fluence for each sample can be calculated by
using the following relation
n (dose) = I (nA) x t / 1.6 x 10⁻¹⁹ x q (3.14)
or
Number of Counts = dose x q x 1.6 x 10⁻¹⁹ / Pulse height (3.15)
3.8.3 SRIM Calculations
SRIM (Stopping and Range of Ions in Matter) is a group of programs, which
calculate the stopping, and range of ions (10 eV - 2 GeV / amu) into matter using a
quantum mechanical treatment of ion-atom collisions. During collisions, the ion and
atom have a screened Coulomb collision, including exchange and correlation
interactions between the overlapping electron shells. The ion also has long-range
interactions with target atoms creating electron excitations and plasmons within the
target. These are described by including a description of the target’s collective
electronic structure and inter-atomic bond structure when the calculation is setup. The
charge-state of the ion within the target is described using the concept of effective
charge, which includes a velocity dependent charge state and long range screening
due to the collective electron sea of the target. A full description of the calculation is
found in the tutorial book [15]. This book presents the physics of ion penetration of
solids in a sample tutorial manner, and then presents the source code for SRIM
programs with a full explanation of its physics. SRIM program creates tables of the
stopping and range of ions in matter over a wide band of ion energies. These tables
are useful to set up the full Monte Carlo TRIM program, so that the target thickness is
adequate to contain all the ions. The target may be a complex compound, but may
only contain one layer. The stopping powers are reported as electronic energy loss (to
the target electrons) and as nuclear energy loss (to the target nuclei). These are the
traditional components of the ion’s energy loss.

- 75 -
References
[1] D. R. Lide, ed., CRC Handbook of Chemistry and Physics, 75th ed., Boca Raton,
FL: CRC Press, 1994, 9–79.
[2] R. M. Silverstein, G. C. Bassler, T. C. Morrill, Spectrometric Identification of Organic
Compounds, 4th ed., New York: Wiley, 1981, 166.
[3] IUPAC Compendium of Chemical Terminology, 2nd Edition, 1997.
[4] M. E. Brown, Introduction to thermal analysis: techniques and applications, Springer,
2001.
[5] R. P. W. Scott, Thermal Analysis Book 5.
[6] J. Smith, H. P. J. Wijn, Ferrites, Philips, Eindhoven, 1959.
[7] J. I. Goldstein, H. Yakowitz, Practical Scanning Electron Microscopy, Plenum Press,
1977.
[8] H. Schatten, J. B. Pawley, Biological Low-Voltage Scanning Electron Microscopy,
Springer, 2007, 61.
[9] G. I. Goldstein, D. E. Newbury, P. Echlin, D. C. Joy, C. Fiori, E. Lifshin, Scanning
electron microscopy and x-ray microanalysis, New York: Plenum Press, 1981.
[10] T. E. Everhart, R. F. M. Thornley, Journal of Scientific Instruments 37 (1960) 246.
[11] S. Foner, Rev. Sci. Instrum., 30 (1959) 548.
[12] M. N. Afsar, J. R Birch, R. N. Clarke, IEEE Trans. Microwave Theory Tech, MTT- 25,
1977.
[13] B. Ferguson, Xi-Cheng Zhang, Nature Materials 1 (2002) 26.
[14] D. Kanjilal, S. Chopra, M. M. Narayanan, I. S. Iyer, V. Jha, R. Joshi, S. K. Datta, Nucl.
Instr. and Meth. A 238 (1993) 97.
[15] J. F. Ziegler, J. P. Biersach, U. Littmark, The Stopping and Range of Ions in Matter,
Pergamon Press, New York, 2 – 6, 1985.


![ADB-FUBINACA - SWGDRUGEI Mass Spectrum: ADB-FUBINACA; Lot# RM-140506-03 50 100 150 200 250 300 350 m/z [x 10 5] Intensity 2 4 141 4141 4141 4141 4141 4141 4141 4141 4141 4141 4141](https://static.fdocuments.in/doc/165x107/6117fbd666857d0aa17c01e2/adb-fubinaca-swgdrug-ei-mass-spectrum-adb-fubinaca-lot-rm-140506-03-50-100.jpg)