Chapter 30: Quality Traits and End-Use Functionality of ...
10
30-291 extension.sdstate.edu | © 2019, South Dakota Board of Regents iGrow Wheat BEST MANAGEMENT PRACTICES Chapter 30: Quality Traits and End-Use Functionality of South Dakota Hard Red Spring and Hard Red Winter Wheat Padmanaban G. Krishnan ([email protected]) Julie Darly William Berzonsky Karl D. Glover ([email protected]) Wheat can be made into products ranging from noodles to cake flour. Each product requires wheat with different characteristics (Fig. 30.1). Interactions between genetics, management, and climatic conditions impact the ability to produce wheat with specific characteristics. e purpose of this chapter is to discuss these factors and the importance of considering end-use quality in management decisions. Figure 30.1. Bread loaf volume as a function of flour protein content and gluten strength. (Photo by P.G. Krishnan, SDSU Crop Quality Lab) Introduction Wheat quality is evaluated using many different measurements. Table 30.1 provides a summary of physical properties (test weight, damaged kernels, foreign materials, shrunken and broken kernels, kernel weight and hardness) and dough performance tests (stability and peak mixing time). e kernel traits provide information on how the wheat will perform in processing (milling, baking, pasta extrusion, noodle production, etc.) and its suitability for different end uses. For the purpose of the discussion, data provided in this table reflect real world information derived from 314 samples from the Winter Wheat Breeding Program and Spring Wheat Breeding Program grown over three crop years (2006-2009) in diverse growing locations. Replications over time and locations, therefore, lend a high degree of reliability to observations and conclusions. Furthermore, the data pertain to South Dakota wheat grown in South Dakota locations.
Transcript of Chapter 30: Quality Traits and End-Use Functionality of ...

30-291 extension.sdstate.edu | © 2019, South Dakota Board of Regents
iGrowWheatBEST MANAGEMENT PRACTICES
Chapter 30:Quality Traits and End-Use Functionality of South Dakota Hard Red Spring and Hard Red Winter Wheat
Padmanaban G. Krishnan ([email protected]) Julie Darly
William BerzonskyKarl D. Glover ([email protected])
Wheat can be made into products ranging from noodles to cake flour. Each product requires wheat with different characteristics (Fig. 30.1). Interactions between genetics, management, and climatic conditions impact the ability to produce wheat with specific characteristics. The purpose of this chapter is to discuss these factors and the importance of considering end-use quality in management decisions.
Figure 30.1. Bread loaf volume as a function of flour protein content and gluten strength. (Photo by P.G. Krishnan, SDSU Crop Quality Lab)
IntroductionWheat quality is evaluated using many different measurements. Table 30.1 provides a summary of physical properties (test weight, damaged kernels, foreign materials, shrunken and broken kernels, kernel weight and hardness) and dough performance tests (stability and peak mixing time). The kernel traits provide information on how the wheat will perform in processing (milling, baking, pasta extrusion, noodle production, etc.) and its suitability for different end uses.
For the purpose of the discussion, data provided in this table reflect real world information derived from 314 samples from the Winter Wheat Breeding Program and Spring Wheat Breeding Program grown over three crop years (2006-2009) in diverse growing locations. Replications over time and locations, therefore, lend a high degree of reliability to observations and conclusions. Furthermore, the data pertain to South Dakota wheat grown in South Dakota locations.
30-292 extension.sdstate.edu | © 2019, South Dakota Board of Regents
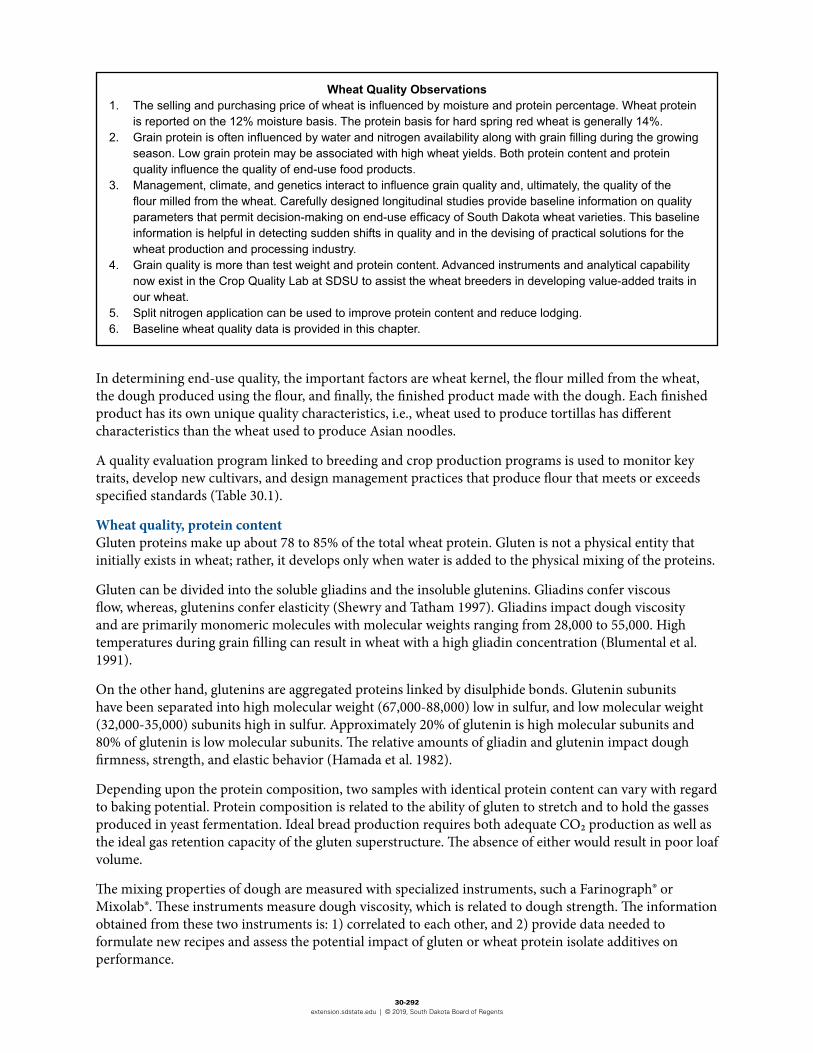
Wheat Quality Observations1. The selling and purchasing price of wheat is influenced by moisture and protein percentage. Wheat protein
is reported on the 12% moisture basis. The protein basis for hard spring red wheat is generally 14%.2. Grain protein is often influenced by water and nitrogen availability along with grain filling during the growing
season. Low grain protein may be associated with high wheat yields. Both protein content and protein quality influence the quality of end-use food products.
3. Management, climate, and genetics interact to influence grain quality and, ultimately, the quality of the flour milled from the wheat. Carefully designed longitudinal studies provide baseline information on quality parameters that permit decision-making on end-use efficacy of South Dakota wheat varieties. This baseline information is helpful in detecting sudden shifts in quality and in the devising of practical solutions for the wheat production and processing industry.
4. Grain quality is more than test weight and protein content. Advanced instruments and analytical capability now exist in the Crop Quality Lab at SDSU to assist the wheat breeders in developing value-added traits in our wheat.
5. Split nitrogen application can be used to improve protein content and reduce lodging.6. Baseline wheat quality data is provided in this chapter.
In determining end-use quality, the important factors are wheat kernel, the flour milled from the wheat, the dough produced using the flour, and finally, the finished product made with the dough. Each finished product has its own unique quality characteristics, i.e., wheat used to produce tortillas has different characteristics than the wheat used to produce Asian noodles.
A quality evaluation program linked to breeding and crop production programs is used to monitor key traits, develop new cultivars, and design management practices that produce flour that meets or exceeds specified standards (Table 30.1).
Wheat quality, protein contentGluten proteins make up about 78 to 85% of the total wheat protein. Gluten is not a physical entity that initially exists in wheat; rather, it develops only when water is added to the physical mixing of the proteins.
Gluten can be divided into the soluble gliadins and the insoluble glutenins. Gliadins confer viscous flow, whereas, glutenins confer elasticity (Shewry and Tatham 1997). Gliadins impact dough viscosity and are primarily monomeric molecules with molecular weights ranging from 28,000 to 55,000. High temperatures during grain filling can result in wheat with a high gliadin concentration (Blumental et al. 1991).
On the other hand, glutenins are aggregated proteins linked by disulphide bonds. Glutenin subunits have been separated into high molecular weight (67,000-88,000) low in sulfur, and low molecular weight (32,000-35,000) subunits high in sulfur. Approximately 20% of glutenin is high molecular subunits and 80% of glutenin is low molecular subunits. The relative amounts of gliadin and glutenin impact dough firmness, strength, and elastic behavior (Hamada et al. 1982).
Depending upon the protein composition, two samples with identical protein content can vary with regard to baking potential. Protein composition is related to the ability of gluten to stretch and to hold the gasses produced in yeast fermentation. Ideal bread production requires both adequate CO₂ production as well as the ideal gas retention capacity of the gluten superstructure. The absence of either would result in poor loaf volume.
The mixing properties of dough are measured with specialized instruments, such a Farinograph® or Mixolab®. These instruments measure dough viscosity, which is related to dough strength. The information obtained from these two instruments is: 1) correlated to each other, and 2) provide data needed to formulate new recipes and assess the potential impact of gluten or wheat protein isolate additives on performance.

30-293 extension.sdstate.edu | © 2019, South Dakota Board of Regents
Table 30.1. Wheat quality measures, definitions, and impact on the milling process. (Modified from Regnier et al. 2009)
Characteristic Definition Effect on Wheat MillingTest Weight Bulk density, weight of a specific volume Provides estimate of flour yieldDamaged kernels Kernels defects due to heat, insects, frost,
sprouting, and scabImpact appearance, decreases yield and increases ash
Foreign materials All non-wheat materials Must be removed prior to millingShrunken and broken kernels
Pass through a #2 sieve in a Carter Day Docket Tester
Moisture Percentage of wheat that is water Moisture and test weights have an inverse relationship
Protein Percentage of wheat that is protein (nitrogen) Impacts textures and bread qualityKernel hardness Average texture, can be hard or soft Hardness impacts engergy required to mill
to flourKernel weight Weight of individual kernelsKernel diameter Diameter of individual kernels Impacts ease of millingFlour yield Percentage of flour recovered during milling Impacts economicsFailing number Indicator of sprout damage and flour’s ability
to set upValue > 250 indicates gummy bread and flour will be unable to thicken soups
Gluten High protein food product directly related to protein content
Impact dough strength, gas retention, water adsorption, and flavor
Ash content Inorganic material contained in the grain, does not burn
Impacts flour color and quality
Peak mixing time Time required for the flour to reach full development
Optimum mixing time
Stability Time difference between the arrival and departure times
Ability to adjust to over- and under-mixing
Absorption rate Amount of water to reach maximum consistency
Optimum use of water
Tenacity (P) Peak height, maximum pressure required to produce a bubble
High P value is light and fluffy
Extensibility (L) How long until it take until the bubble bursts Impacts dough ability to riseStrength (W) Baking strength of dough High value high dough strengthConfiguration ratio (P/L)
Resistance related to time, indicator or gluten behavior
Bread volume and well proportioned inside structure
Internal characteristics
Crumb quality (texture, color, and shape) Impacts end-use qualities
Bread-loaf volume Bread making potential Impacts amount of bread produced
Based on quality characteristics, it is now possible to profile various flours for specific food products (cookies, crackers, pizza crust, cakes, etc). Manufacturers often write tight specifications based on these instrument-derived parameters.
Wheat for different end uses Wheat flour can be used for different end uses. Wheat flour that produces large loaves and has high water absorption capacities has an economic advantage over those flours that do not. Table 30.2 shows the differences in gluten content in All Purpose Flour (APF), bread flour and cake flour.
The moderate amount of protein (and gluten) in All Purpose Flour permits the home baker to use the flour in a variety of baked products. Breads, on the other hand, demand stronger gluten to withstand the additional stresses of dough mixing, dough stretching and expansion during yeast fermentation. The type of flour used impacts the resulting bread (Fig. 30.1). Bread machines will often require higher protein and

30-294 extension.sdstate.edu | © 2019, South Dakota Board of Regents
gluten content as the machines may be mechanically physically abusive to dough systems. Commercial flours are blended to yield high gluten content and a gluten index, which is measured with a Glutomatix System. http://www.sdsinstruments.com/glutomatic.asp
In this analysis, flour is mixed with water to form dough and then the dough is washed to remove the milky starch slurry. The resultant putty-like material is known as wet gluten, or vital gluten. The wet gluten is weighed and then excess water is spun out of the dough in a centrifuge. The dough is then formed into a disk and dried in a heated press; the resulting dry gluten is weighed. The centrifugal force also is capable of separating wet gluten into two gluten fractions. The wet gluten is subjected to forces that allow some of the gluten to penetrate openings in a sieve.
The weights of the wet gluten, gluten fractions, and dry gluten are correlated to other flour physical traits to relate protein content to protein functionality. Figure 30.2 shows pictures of strong and weak glutens taken through the gluten test. Weaker gluten blends have a greater proportion of the wet gluten moving through the wire mesh (far right image in Fig. 30.2).
The gluten index value defines whether the gluten is weak, strong or normal. If the gluten is very weak, the index value will be near 0, whereas if it is very strong, it will be near 100%. Commercial flours are formulated with ingredients for high gluten index (Table 30.2).
Table 30.2. Gluten Content and Gluten Index measurement of various flours. Breads produced with these flours are shown in Figure 30.1.
Sample Total Gluten1 (g)
Dry Gluten2 (g)
Gluten Index3 % Gluten Mean
All Purpose Flour2.37 0.86 100 8.6
8.62.38 0.86 100 8.6
Bread flour2.43 0.87 100 8.7
8.72.44 0.87 100 8.7
Cake flour1.95 0.71 100 7.1
71.93 0.69 100 6.9
1. Total Gluten: Weight of gluten extracted from 10 grams flour.2. Dry Gluten: Dry weight of above.3. Gluten Index: The relative amount of of gluten (weaker gluten) that comes through a specially designed sieve under
centrifugation. 100% GI indicates no weaker gluten pentrating the sieve.
Figure 30.2. Gluten fractions obtained from gluten testing of Glenn (left) and Briggs (middle) varieties. Image on the far right shows extremely weak gluten penetrating the Glutomatic sieve. (Photo by P.D. Krishnan, SDSU Crop Quality Lab)

30-295 extension.sdstate.edu | © 2019, South Dakota Board of Regents
Gluten quality and end use Two samples with identical protein contents can vary significantly with regard to baking potential. Protein quality is related to the ability of gluten to stretch and to hold the gasses produced in yeast fermentation. Ideal bread production requires both adequate CO₂ production as well as the ideal gas retention capacity of the gluten superstructure. The absence of either results in poor loaf volume.
Dough viscosity will rise and fall with mixing and this is often related to how the dough responds to mixing or over-mixing. Instruments such as the Farinograph and Mixolab are used to make these measurements as well as reveal how flour and dough will react to ingredient changes. Dough additives, such as vital gluten or wheat protein isolates and concentrates, can improve the performance of weaker flours.
No single wheat quality measurement by itself is sensitive enough to discriminate between good and poor baking potential (Table 30.3). Hence, a more comprehensive set of parameters is used in a quality evaluation program. Relative values of the gluten index need to be interpreted along with other dough functional properties, such as absorption percentage, dough development time, dough stability, along with dough strength and dough extensibility information provided by the Texture Analyzer Kieffer Rig. It is a combination of instrument-based data that allows for definitive judgments to be made about the performance efficacy of single wheat varieties.
Instruments such as the Mixolab or Farinograph yield crucial information on the amount of energy inputs and water requirement for production of an optimal dough. In this analysis, 30 to 50 grams of flour are needed. As water is added to and mixed with flour, dough is formed. The dough increases in viscosity and offers resistance to the mixing blades. This resistance is translated into a visual graph plotting torque against the mixing time. The resulting output reveals how stable the dough is to over mixing, optimal mixing times, and optimal water requirement. It also expresses the changes that occur as a result of addition of other ingredients normally used in baking. This information can be physically or electronically linked to flour shipments to provide visual documentation specific to the particular sample.
Table 30.3. Comparison of wheat varieties showing variability in flour water adsorption (WA), development time, stability, gluten index, dry gluten, dough extensibility, and dough strength. Highlighted values below indicate a trend toward lower values for the parameters indicated. (Darly, J. personal communications, South Dakota State University, 2011)
Year Variety WA1 (%) Development Time2 (min)
Stability3 (min)
Gluten Index (%)
Dry Gluten (g)
Dough Extensibility
(mm)
Dough Strength
(g)
2008
AC Snowbird 58.5 8.0 11.0 98.5% 1.46 39.6 51.5
Apline 59.6 8.5 11.6 99.4% 1.30 25.1 79.0
Briggs 63.5 8.7 9.4 97.6% 1.49 26.6 51.5
Glenn 59.8 9.4 11.0 99.7% 1.51 28.4 81.0
Lolo 54.6 7.6 11.4 99.1% 1.21 47.1 39.8
2009
AC Snowbird 62.1 8.8 10.9 97.8% 1.26 64.6 32.5
Alpine 62.7 8.8 10.9 98.3% 1.22 85.8 31.0
Briggs 59.9 6.1 11.1 96.5% 1.20 71.1 27.5
Glenn 61.3 9.3 11.9 99.0% 1.27 86.4 39.1
Lolo 59.0 8.1 11.4 97.8% 1.14 72.3 33.4
1. Water absorption is defined as the ideal amount of water to be added to flour to form an optimal dough (as determined by the instrument).
2. Dough Development Time is the time in minutes required to reach peak mixing time.3. Dough Stability provides an indication of the duration of mixing time when the dough remains stable before breaking down.
Dough protein is a biological entity and will denature and lose its cohesive properties with over-mixing and mechanical abuse.

30-296 extension.sdstate.edu | © 2019, South Dakota Board of Regents
In many situations, information derived from one test is correlated to information derived from other tests. For example, water absorption by the flour (to yield optimal dough) is strongly related to the gluten proteins (Fig. 30.3). This is an important functionality of protein. About 80% of the variability in gluten content is explained by the protein content in the wheat flour. The proteins contribute to the expansion of the dough to envelope the expanding gasses (steam, CO₂) and also the ability to retain the gases. While this relationship between flour protein and flour gluten content is strong and well documented, the relationship between flour protein (a flour constituent) and loaf volume (a functional trait) is strong in some years and weak in others.
Figure 30.3. Relationship between flour protein and gluten content in 2008 HRS Selby wheat. (Data from Caffe-Treml et. al 2010b)
Wheat quality, climate and managementNitrogen and water management interact to influence wheat production and quality (Table 30.4). For example, applying more N fertilizer to increase yields and protein content can increase lodging. One approach to overcome this problem is to split the N application (Chapters 8 and 9). Fuertes Mendizábal et al. (2010) reported that splitting N applications from a single pre-plant rate into several split applications improved grain quality and the concentration of high molecular weight glutenin subunits.
In South Dakota, research highlighted in Table 30.4 shows that yield and wheat quality were both impacted by N rate and that each characteristic has a unique optimum N rate (Kharel et al. 2011; Reese 2009). Currently, active research projects are being conducted to improve in-season N recommendations.
Table 30.4. The influence of N rate on hard white winter yield and quality in 2008 at Dakota Lakes Research Farm. (Kharel et al. 2011)
% Recommended N rate Yield (bu/a) Protein (%) Stability (min) Nitrogen Use
Efficiency (%)0 66.8 11.7 8.2 --
25 75.3 12.3 8.3 46
50 75.1 12.7 10 27
100 82.3 13.2 10.3 26
Least significant difference 6.4 0.43 2.4 5

30-297 extension.sdstate.edu | © 2019, South Dakota Board of Regents
Development of wheat quality baseline dataBaseline wheat quality data can be used to match wheat flour with specialty markets, assess how genetics and climate interact to impact wheat composition and quality, and provide a baseline for evaluating year-to-year fluctuations (Caffe-Treml et al. 2010a, 2010b). Tables 30.5 and 30.6 present the baseline details.
For the Spring Wheat baseline data, 218 samples were obtained from five diverse South Dakota growing locations over three growing seasons. The samples were subjected to full milling and baking analysis by the USDA Hard Red Spring Wheat Quality Laboratory in Fargo, North Dakota.
For the Winter Wheat baseline data, 96 samples were obtained from research plot seed samples collected across eight locations for the Crop Performance Trial (CPT) and three locations for the Advanced Yield Trial (AYT). Samples were subjected to full milling and baking analyses by the USDA-ARS Winter Wheat Quality Laboratory in Manhattan, Kansas.
SummaryWheat genetics and growing conditions eventually translate into products with specific quality traits. The challenge for both the researcher and producer is to maximize the value-added food traits that are most desirable for the consumer. An understanding of the constituent/functionality relationship or structure/functionality relationship within the wheat is essential for devising practical solutions relating to sub-optimal baking performance, decreased milling yield or reduced nutritional content.
Newer information on dough-mixing behavior and the energy required to produce optimal bread dough will provide a more complete picture to this understanding. Well-designed studies will also delineate environmental factors or growing practices that may impart valuable traits in existing and new wheat varieties.
Additional information and referencesBlumenthal, C.S., I.L. Batey, C.W. Wrigley, and E.W.R. Barlow. 1991. Seasonal changes in wheat grain
quality associated with high temperature during graining filling. Aust. J. Agric. Res. 42:21-30.
Caffe-Treml, M., K.D. Glover, P.G. Krishnan, and G A. Hareland. 2010.Variability and relationships among Mixolab, Mixograph, and baking parameters based on multienvironment spring wheat trials. Cereal Chemistry. 87(6):574-580.
Caffe-Treml M., K.D. Glover, P.G. Krishnan, K.D. Bondalapati, J. Stein, and G.A. Hareland. 2010b. Effect of wheat genotype and environment on relationships between dough extensibility and breadmaking quality. Cereal Chemistry. 88(2):201-208.
Fuertes-Mendizábal, T., A. Dizpurua, M.B. González-Maro, and J.M. Estvillo. 2010. Improving wheat breadmaking quality by splitting the N fertilizer rate. European J. Agronomy. 33:52-61.
Hamada, A.S., C.E. McDonald, and L.D. Sibbitt. 1982. Relationship of protein fractions of spring wheat flour to baking quality. Cereal Chemistry. 59:296-301.
Kharel, T., D.E. Clay. D. Beck, C. Reese, and C.G. Carlson. 2011. Nitrogen and water effects on winter wheat yield, N and water use efficiency, and dough quality. Agron. J. (In progress).
Reese, C. 2009. Nitrogen and water impacts on hard red spring wheat yield, quality, canopy reflectance and income in South Dakota. South Dakota State University Ph.D. Thesis.
Regnier, S., R. Holcomlb, and P. Royas-Duarte. 2009. Relating wheat quality to end-product quality. FAPC-129. Oklahoma State University Agricultural Products Center. Available at http://www.fapc.okstate.edu/files/factsheets/fapc129.pdf

30-298 extension.sdstate.edu | © 2019, South Dakota Board of Regents
Table 30.5. Hard red wheat quality baseline data. Data fron SDSU Spring Wheat and Winter Wheat Breeding Programs.
Wheat Data
Year Type Wheat Color Test weight (lbs/bu) 1000 Kernel weight (g) Protein (14% mb)
2007
RELEASED VARIETIES
RED 58.1 28.3 14WHITE 56.2 25.5 14.3
BREEDING LINES
RED 58.6 28.5 13.8WHITE 58.9 27.6 13.5
2008
RELEASED VARIETIES
RED 60.2 33.8 12.8WHITE 60 29.3 13.1
BREEDING LINES
RED 58.9 29.5 13.2WHITE 60.1 29.5 13
Flour Data (14% mb)
Year Type Wheat Color Flour Extraction (%) Flour protein (%) Flour ash (%)
2007
RELEASED VARIETIES
RED 70.6 12.9 0.48WHITE 69.4 13.1 0.48
BREEDING LINES
RED 58.6 12.8 0.51WHITE 58.9 13.1 0.50
2008
RELEASED VARIETIES
RED 60.2 12.9 0.39WHITE 60 11.7 0.38
BREEDING LINES
RED 58.9 12 0.40WHITE 60.1 11.8 0.38
Dough Rheology (Mixograph data)
Year Type Wheat Color Water Absorption (%) Mixing time (min) Mixing tolerance (min)
2007
RELEASED VARIETIES
RED 64.3 4.00 3.75WHITE 63.8 3.38 2.33
BREEDING LINES
RED 64.0 3.89 3.89WHITE 62.6 3.15 3.15
2008
RELEASED VARIETIES
RED 62.7 4.27 3.50WHITE 61.3 4.18 2.67
BREEDING LINES
RED 62.2 4.60 3.81WHITE 61.0 3.72 2.67
Baking Data
Year Type Wheat Color
Water Absorption
(%)
Mixing time (min)
Loaf weight (g) Crumb Score Loaf Volume
(cc)
2007
RELEASED VARIETIES
RED 63.3 5.50 149.8 3.55 951.9WHITE 62.7 4.21 149.2 3.50 971.7
BREEDING LINES
RED 62.9 5.08 149.7 3.86 1005.0WHITE 60.4 3.85 148.0 3.16 918.3
2008
RELEASED VARIETIES
RED 62.7 5.04 150.7 3.85 890.0WHITE 59.7 4.14 148.3 4.07 885.0
BREEDING LINES RED 61.2 5.77 148.9 3.90 933.1

30-299 extension.sdstate.edu | © 2019, South Dakota Board of Regents
Table 30.6. Hard spring wheat baseline data that was collected between 2006 and 2009. Data from SDSU Spring Wheat and Winter Wheat Breeding Programs.
Wheat Data
Year Type Test weight (lbs/bu)
1000 Kernel weight (g) Protein (%) Ash (%)
2007RELEASED VARIETIES 59.8 30.4 15.1 1.52
BREEDING LINES 60.1 30.4 14.8 1.46
2007RELEASED VARIETIES 60.0 30.0 14.2 1.65
BREEDING LINES 60.5 30.5 14.0 1.63
2008RELEASED VARIETIES 59.3 32.0 13.9 1.54
BREEDING LINES 59.4 31.4 13.5 1.49
2009RELEASED VARIETIES 59.2 33.0 14.5 1.60
BREEDING LINES 59.1 32.7 14.1 1.61
FlourYear Type Flour Extraction (%) Flour protein (%) Flour ash (%)
2006RELEASED VARIETIES 60.8 13.7 0.36
BREEDING LINES 60.0 13.2 0.35
2007RELEASED VARIETIES 60.3 13.2 0.38
BREEDING LINES 59.0 12.9 0.38
2008RELEASED VARIETIES 59.0 12.7 0.38
BREEDING LINES 59.8 12.1 0.37
2009RELEASED VARIETIES 61.3 13.4 0.45
BREEDING LINES 60.1 13.0 0.41
Dough Rheology (Mixograph data)Year Type Water Absorption (%) Mixing time (min) Mixograph score (min)
2006RELEASED VARIETIES 60.77 4.90 4
BREEDING LINES 60.8 5.84 5
2007RELEASED VARIETIES 61.3 5.59 5
BREEDING LINES 61.0 5.86 6
2008RELEASED VARIETIES -- 5.76 6
BREEDING LINES -- 9.03 6
2009RELEASED VARIETIES -- 4.36 6
BREEDING LINES -- 5.70 6
Baking DataYear Type Water Absorption (%) Mixing time (min) Loaf Volume (cc)
2006RELEASED VARIETIES 57.5 2.05 181.2
BREEDING LINES 56.7 1.99 182.2
2007RELEASED VARIETIES 60.2 2.44 176.1
BREEDING LINES 60.6 2.52 174.7
2008RELEASED VARIETIES 57.2 2.62 183.1
BREEDING LINES 55.8 3.36 181.1
2009RELEASED VARIETIES 58.9 2.1 196.4
BREEDING LINES 58.4 2.59 199.9
30-300 extension.sdstate.edu | © 2019, South Dakota Board of Regents
Shewry, P.R., and A.S. Tatham. 1997. Disulfide bonds in wheat gluten proteins. J. Cereal Science 25:207-227.
Wieser, H., and W. Seilmeier. 1998. The influence of nitrogen fertilization on quantities and proportions of different protein types in wheat flour. J. Sci. Food Agric. 76:49–55.
AcknowledgmentsThe authors wish to thank the South Dakota Wheat Commission and the South Dakota Agricultural Experiment Station for their support of scientific research in the area of wheat production and wheat end-use evaluations.
Krishnan, P.G., J. Darly, W. Berzonsky, and K.D. Glover. 2012. Quality traits and end-use functionality of South Dakota hard red spring and hard red winter wheat. In Clay, D.E., C.G. Carlson, and K. Dalsted (eds). iGrow Wheat: Best Management Practices for Wheat Production. South Dakota State University, SDSU Extension, Brookings, SD.
In accordance with Federal civil rights law and U.S. Department of Agriculture (USDA) civil rights regulations and policies, the USDA, its Agencies, offices, and employees, and institutions participating in or administering USDA programs are prohibited from discriminating based on race, color, national origin, religion, sex, gender identity (including gender expression), sexual orientation, disability, age, marital status, family/parental status, income derived from a public assistance program, political beliefs, or reprisal or retaliation for prior civil rights activity, in any program or activity conducted or funded by USDA (not all bases apply to all programs). Remedies and complaint filing deadlines vary by program or incident.
Persons with disabilities who require alternative means of communication for program information (e.g., Braille, large print, audiotape, American Sign Language, etc.) should contact the responsible Agency or USDA’s TARGET Center at (202) 720-2600 (voice and TTY) or contact USDA through the Federal Relay Service at (800) 877-8339. Additionally, program information may be made available in languages other than English.
To file a program discrimination complaint, complete the USDA Program Discrimination Complaint Form, AD-3027, found online at http://www.ascr.usda.gov/complaint_filing_cust.html and at any USDA office or write a letter addressed to USDA and provide in the letter all of the information requested in the form. To request a copy of the complaint form, call (866) 632-9992. Submit your completed form or letter to USDA by:
(1) mail: U.S. Department of AgricultureOffice of the Assistant Secretary for Civil Rights1400 Independence Avenue, SWWashington, D.C. 20250-9410;
(2) fax: (202) 690-7442; or
(3) email: [email protected].
USDA is an equal opportunity provider, employer, and lender.
SDSU Extension is an equal opportunity provider and employer in accordance with the nondiscrimination policies of South Dakota State
University, the South Dakota Board of Regents and the United States Department of Agriculture.